<?xml version="1.0" encoding="utf-8"?>
<feed xmlns="http://www.w3.org/2005/Atom">
  <title>Android Performance</title>
  
  <subtitle>Focus on Android Performance</subtitle>
  <link href="https://androidperformance.com/en/atom.xml" rel="self"/>
  
  <link href="https://androidperformance.com/en/"/>
  <updated>2026-07-18T02:20:29.563Z</updated>
  <id>https://androidperformance.com/en/</id>
  
  <author>
    <name>Gracker</name>
    
  </author>
  
  <generator uri="https://hexo.io/">Hexo</generator>
  
  <entry>
    <title>SmartPerfetto 2026-06-04 to 2026-07-17 Six-Week Update: From v1.0.28 to v1.1.1</title>
    <link href="https://androidperformance.com/en/2026/07/17/SmartPerfetto-Six-Week-Update/"/>
    <id>https://androidperformance.com/en/2026/07/17/SmartPerfetto-Six-Week-Update/</id>
    <published>2026-07-16T16:00:00.000Z</published>
    <updated>2026-07-18T02:20:29.563Z</updated>
    
    <content type="html"><![CDATA[<p>This post reviews every major SmartPerfetto change since the <a href="https://www.androidperformance.com/en/2026/06/04/SmartPerfetto-Three-Week-Update/">previous three-week update</a> (2026-06-04, v1.0.28), through 2026-07-17 (v1.1.1). By the end, you will understand the problem each feature solved over these six weeks, where its boundaries lie, and the full feature map of the current release. Project repository: <a href="https://github.com/Gracker/SmartPerfetto">github.com&#x2F;Gracker&#x2F;SmartPerfetto</a>.</p><span id="more"></span><h2 id="1-Overview-of-Changes-2026-06-04-to-2026-07-17"><a href="#1-Overview-of-Changes-2026-06-04-to-2026-07-17" class="headerlink" title="1. Overview of Changes (2026-06-04 to 2026-07-17)"></a>1. Overview of Changes (2026-06-04 to 2026-07-17)</h2><p><img src="/en/images/SmartPerfetto-Six-Week-Update/01-six-week-overview.png" alt="Six weeks of SmartPerfetto changes from v1.0.28 to v1.1.1"></p><p>Over these six weeks, approximately 150 commits were merged (excluding merge commits), spanning 13 releases (v1.0.29 → v1.1.1). If the main theme of the previous post was “getting all four Agent runtimes working,” this period focused on <strong>converging those four runtimes on one shared contract</strong>, while continuing to expand the analysis experience, scene knowledge, and public ecosystem.</p><p>First, here are several quantifiable changes, calculated with the repository’s documented counting commands:</p><table><thead><tr><th>Metric</th><th>2026-06-04 (v1.0.28)</th><th>2026-07-17 (v1.1.1)</th></tr></thead><tbody><tr><td>Skill YAML (<code>*.skill.yaml</code>)</td><td>226</td><td>239</td></tr><tr><td>Scene strategies (<code>*.strategy.md</code>)</td><td>20</td><td>21</td></tr><tr><td>Strategy&#x2F;prompt templates (<code>*.template.md</code>)</td><td>—</td><td>80</td></tr><tr><td>Perfetto upstream syncs</td><td>—</td><td>Three syncs during this period: v56.0 → v57.1 → v57.2</td></tr><tr><td>Agent runtimes</td><td>4 parallel implementations</td><td>4, sharing a unified run specification</td></tr></tbody></table><p>The sections below follow their impact on everyday analysis workflows, from largest to smallest. We will start with features that changed how SmartPerfetto is used—the dual-trace workspace and Quick Mode—then move to features that raised its capability ceiling, including private analysis context and runtime unification, before covering scenes, knowledge, the ecosystem, and engineering delivery.</p><h2 id="2-Dual-Trace-Analysis-Workspace"><a href="#2-Dual-Trace-Analysis-Workspace" class="headerlink" title="2. Dual-Trace Analysis Workspace"></a>2. Dual-Trace Analysis Workspace</h2><p><img src="/en/images/SmartPerfetto-Six-Week-Update/02-dual-trace-workspace.png" alt="Dual-trace workspace windows, run identity, and exit semantics"></p><p>Comparison is at the heart of performance optimization: before versus after a change, your product versus a competitor, or regression analysis after a system upgrade. SmartPerfetto already allowed an AI session to attach a reference trace, but the UI exposed only one timeline window. The most natural workflow—viewing two traces side by side—was not possible. The dual-window workspace, shipped on July 10–11 (v1.0.39), filled that gap.</p><p>The interaction path is deliberately short:</p><ul><li><strong>Enter with one click</strong>: A direct “Open Dual Window” button sits at the top of the AI Panel. Clicking it immediately opens two windows: one showing the current trace and the other initially empty. Select a reference trace from the workspace history without first going through the trace picker.</li><li><strong>Atomic window identity swap</strong>: Both windows have trace selectors, so users can freely decide which window displays the current trace and which displays the reference trace. If a historical trace is selected in the current window, the current trace moves atomically to the other window. The workspace never shows the same trace in both windows or enters an intermediate state with no current trace.</li><li><strong>Run identity protection</strong>: During analysis, the “current trace + reference trace + Agent session” form a single run identity. Switching traces, exiting comparison mode, changing Providers, or changing workspaces is rejected while the run is active. Only an explicit Stop invokes the backend cancellation protocol. Layout changes, maximization, dragging, and collapsing the AI Panel affect presentation state only: they neither destroy the iframe nor transfer ownership of the streaming connection. This rule ensures that moving a window midway through an analysis cannot destroy an in-progress run.</li><li><strong>Separate exit semantics</strong>: Exiting dual-window mode closes only the visual workspace; the reference trace and AI comparison context remain available. Exiting comparison mode additionally clears the reference trace, comparison context, and comparison session.</li></ul><p>At the contract level, the <code>smp compare</code> CLI command and the frontend dual-window workspace use the same backend comparison identity, evidence package, and report section. There is no private path that could cause CLI and web comparison results to diverge. The product boundary is equally explicit: comparison always means “the current trace + one reference trace from workspace history.” Comparing any two arbitrary historical traces is not supported; that belongs to the domain of comparing multiple analysis results through snapshot comparison.</p><p>For the full interaction model, including its state machine and boundary conditions, see <code>docs/architecture/dual-trace-workspace.md</code> in the repository.</p><h2 id="3-Quick-Mode-Evidence-Backed-Direct-Answers-and-Analysis-Receipts"><a href="#3-Quick-Mode-Evidence-Backed-Direct-Answers-and-Analysis-Receipts" class="headerlink" title="3. Quick Mode: Evidence-Backed Direct Answers and Analysis Receipts"></a>3. Quick Mode: Evidence-Backed Direct Answers and Analysis Receipts</h2><p><img src="/en/images/SmartPerfetto-Six-Week-Update/03-quick-mode.png" alt="Quick Mode from intent recognition to a zero-turn direct answer and analysis receipt"></p><p>Many everyday questions ask for straightforward facts: “What is the frame rate?”, “Which app is in the foreground?”, or “How severe is the jank?” Sending these questions through a full Agent loop—planning, multiple tool calls, and verification—is both slow and token-intensive. Over these six weeks, the fast path was rebuilt as a genuine evidence-backed direct-answer product. Analysis receipts became a product surface on June 29, the four runtimes were aligned on July 3, and v1.0.38 followed.</p><p>The flow has three steps:</p><ol><li><strong>Intent recognition</strong>: A local classifier identifies direct-answer intents, including trace facts such as frame count, duration, processes, and threads; the foreground app; and an initial scrolling-smoothness assessment. It also handles mixed intents. For example, “What is the frame rate? Is it smooth overall?” matches both trace-fact and scrolling-assessment intents and combines the evidence for both in one answer.</li><li><strong>Deterministic evidence collection</strong>: The backend executes the corresponding SQL&#x2F;Skill directly to collect evidence, bypassing the model’s tool-call loop.</li><li><strong>Direct-answer assembly</strong>: SmartPerfetto assembles the answer directly from evidence tables, adds sentence-level data citations, and returns it after <strong>zero model conversation turns</strong>. An analysis receipt at the end records which evidence was used and the state of the quality gates.</li></ol><p>End-to-end validation covered nine cases against the real DeepSeek API: identity questions, compound facts, global frame count plus jank, initial scrolling assessment, foreground app, the presence of CPU frequency data, questions in English, and more. Eight cases used zero actual model conversation turns, and every case passed claim-by-claim verification.</p><p>Two engineering details are worth calling out:</p><ul><li><strong>Consistent behavior across all four runtimes</strong>. Direct-answer intent derivation, evidence assembly, and the contract governing the number of conclusions converged on shared modules across Claude, OpenAI, Pi Agent Core, and OpenCode. The Claude path had previously assembled these by hand and silently dropped scrolling evidence for mixed intents, diverging from the other three runtimes. The alignment eliminated this class of drift structurally. Contract values such as the maximum number of conclusions are now injected as template variables from a single source of truth.</li><li><strong>No false activation</strong>. Direct answers cover only questions that deterministic evidence can resolve. Questions outside that scope, such as the open-ended request “Give me a quick analysis,” fall back to the normal Agent path instead of being forced into the direct-answer framework and receiving an incomplete answer.</li></ul><h2 id="4-Private-Analysis-Context-Local-Source-Code-the-Android-Internals-Knowledge-Base"><a href="#4-Private-Analysis-Context-Local-Source-Code-the-Android-Internals-Knowledge-Base" class="headerlink" title="4. Private Analysis Context: Local Source Code + the Android Internals Knowledge Base"></a>4. Private Analysis Context: Local Source Code + the Android Internals Knowledge Base</h2><p><img src="/en/images/SmartPerfetto-Six-Week-Update/04-private-context.png" alt="Authorization boundaries for private context from local source code and Android Internals"></p><p>A trace can show you <em>where</em> performance degrades, but explaining <em>why</em> often requires returning to source code and system internals. Over these six weeks, SmartPerfetto integrated two types of private context into the analysis pipeline and unified their authorization model in v1.1.0. This was the main reason for the version jump from 1.0 to 1.1.</p><p><strong>Local source code (Code-Aware)</strong>. After a local codebase is registered with SmartPerfetto, AI analysis can map trace behavior to specific classes and functions. The privacy boundary is intentionally strict: the model sees CodeRef metadata—chunk ID, relative path, line range, and symbol name—not raw source text. Raw text is available only through an access-controlled endpoint for the user to inspect. <code>metadata_only</code> and <code>provider_send</code> are separate consent levels; the former guarantees that source snippets are never sent to the model provider. SmartPerfetto also supports patch proposals on top of this model. The AI can propose changes only against source context it has already looked up, and a patch must pass <code>git apply --check</code> before it can be returned with “verified” status.</p><p><strong>External Android Internals knowledge base</strong> (July 14). A local checkout of <code>android-internals-wiki</code> can be registered as a versioned external knowledge source. The retrieval pipeline enforces the following constraints:</p><ul><li>Paths are denied by default. Only Markdown files under an environment-variable allowlist can be previewed and indexed.</li><li>Registration requires confirmation of content rights (<code>rightsAcknowledged</code>). Sending content to the model provider requires separate, revocable privacy consent (<code>sendToProvider</code>). Once revoked, new indexing and retrieval requests are rejected immediately.</li><li>Only strictly parsed, finalized articles enter retrieval. Drafts and articles awaiting review appear only in the audit trail.</li><li>The model receives only budget-controlled, redacted matching excerpts. Logs and streaming events expose metadata projections only.</li><li>Wiki matches provide system background but <strong>cannot replace evidence from the current trace</strong>. Diagnostic conclusions must still cite actual SQL&#x2F;Skill query results.</li></ul><p><strong>Combined semantics (v1.1.0)</strong>. Source code and the knowledge base have independent authorization lists; either can be used alone or both can be combined. Whenever any private context is present, fast&#x2F;auto mode is forced to resolve to full mode, where the necessary tools and evidence gates are available. Tenant, workspace, user, authorization list, index generation, content fingerprint, and consent state all contribute to a single authorization fingerprint. If any of these changes at a tool-call or run boundary, execution is rejected immediately—fail closed—rather than silently falling back to a different analysis mode. The practical effect is important: after consent is revoked, an index is rebuilt, or permissions change, there is no window in which stale authorization remains active in an existing session.</p><h2 id="5-Unifying-the-Agent-Runtime-Architecture"><a href="#5-Unifying-the-Agent-Runtime-Architecture" class="headerlink" title="5. Unifying the Agent Runtime Architecture"></a>5. Unifying the Agent Runtime Architecture</h2><p><img src="/en/images/SmartPerfetto-Six-Week-Update/05-runtime-unification.png" alt="Four Agent runtimes consuming a unified Run Spec and output contract"></p><p>This was the largest body of code changed during the six-week period, delivered in two stages.</p><p><strong>The early-June refactoring</strong> (around v1.0.32, across more than twenty refactoring commits):</p><ul><li>The four runtimes moved into independent engine directories, while shared logic—including diagnostics, hypothesis projection, and runtime descriptors—moved into a common layer.</li><li>Cancellation semantics were extended all the way down to the SQL tool layer. When a user clicks Stop, an in-progress query is actually canceled instead of being allowed to finish before its result is discarded.</li><li>The two third-party runtimes, Pi Agent Core and OpenCode, regained resumability for opaque session state, allowing a restored session to continue with its previous context.</li><li>Provider snapshots are bound to the runtime environment. Restoring a session cannot silently switch models merely because the user has changed the active Provider.</li><li>The verifier’s misdiagnosis-pattern library is loaded from strategy files, so adding a new pattern no longer requires a TypeScript change.</li></ul><p><strong>The v1.1.0 consolidation on July 17</strong>: All four runtimes now consume the same Provider-independent run specification and comparison-context builder. This structurally eliminates a typical class of bug in which an analysis option takes effect on the Claude path but is silently ignored on the OpenAI path, because options are now parsed in one place. The release also introduced reproducible Perfetto UI prebuild artifacts and a backend regression CI gate (<code>backend-agent-regression-gate</code> in GitHub Actions).</p><p>Before v1.1.0 shipped, the project completed two rounds of independent review: a weekly review on July 15 and a clean-room review on July 16, with reports stored under <code>docs/reviews/</code> in the repository. The release proceeded only after confirming there were no known P0&#x2F;P1 blockers. v1.1.1, released the same day, fixed more than ten remaining findings from those reviews, including source-reference locatability checks, OpenAI tool-output normalization, verifier evidence-label parsing, and restored scrolling-metric semantics.</p><h2 id="6-Token-Cost-Optimization"><a href="#6-Token-Cost-Optimization" class="headerlink" title="6. Token Cost Optimization"></a>6. Token Cost Optimization</h2><p><img src="/en/images/SmartPerfetto-Six-Week-Update/06-token-optimization.png" alt="From always-resident full strategies to an always-resident Core with Detail loaded on demand"></p><p>In mid-June, we identified the largest source of token consumption in full mode: the methodology section of the system prompt embedded the <strong>entire</strong> scene strategy—approximately 51K tokens for the launch scene—and the existing prompt-budget mechanism trimmed only supporting sections, never this one. In effect, every full analysis was paying for an entire “textbook on launch analysis.” A complete optimization package landed on June 18–19 in v1.0.35:</p><ul><li><strong>Strategy split</strong>: Scene strategies are divided into core and detail layers. The core remains in the prompt and is limited to a few thousand tokens; detail is delivered on demand as the analysis advances through its stages. Quality requirements moved into expected tool-call lists in plan templates and into the verifier, ensuring that a shorter prompt does not produce a shallower analysis.</li><li><strong>Regression baselines using real token counts</strong>: New token-baseline tests load the actual strategy files and cover the worst-case combination—scene + architecture + completeness + selection + comparison + source awareness all enabled at once—to prevent future changes from silently inflating prompt size again. The previous unit tests mocked the strategy loader and could not detect size regressions.</li><li><strong>Automatic summarization of large SQL results</strong>: SQL outputs above a threshold are summarized automatically, while the raw data becomes a paginated artifact reference without breaking provenance.</li><li><strong>Compressed tool descriptions and cache boundaries</strong>: MCP tool descriptions were compressed across all four runtimes. Prompt-cache boundaries were added to the runtimes and are now selected according to capability flags declared by Provider adapters, rather than hardcoded Provider names.</li></ul><p>The benefit depends on Provider capabilities. For Providers without prompt caching—OpenAI-compatible endpoints, Pi, and OpenCode—the optimization directly reduces the cost of every request. For Providers with caching, it primarily lowers cache-creation cost and context-window pressure.</p><h2 id="7-Expanded-Scene-Coverage-Camera-Heap-and-GPU"><a href="#7-Expanded-Scene-Coverage-Camera-Heap-and-GPU" class="headerlink" title="7. Expanded Scene Coverage: Camera, Heap, and GPU"></a>7. Expanded Scene Coverage: Camera, Heap, and GPU</h2><p><img src="/en/images/SmartPerfetto-Six-Week-Update/07-camera-heap-gpu.png" alt="Camera, Heap, and GPU scenes probe for evidence before reaching conclusions"></p><p>All three new scenes follow the same principle: <strong>evidence first; when data is insufficient, say so explicitly instead of inventing a conclusion</strong>.</p><ul><li><strong>Camera analysis</strong> (July 12): SmartPerfetto added an evidence-oriented camera capture preset, available directly through <code>smp capture</code>, along with a camera-trace evidence Skill. The key design is conditional tracepoint availability. Tracepoints for different stages of the camera pipeline vary significantly across vendors and platform versions. The Skill first probes the current trace to determine which evidence sources exist, reaches conclusions only for stages backed by data, and explicitly marks data-starved stages as unavailable instead of forcing them through a template.</li><li><strong>Heap dominator-path analysis</strong> (July 14): A new deterministic Skill clusters and extracts heap dominator paths. It extracts dominator paths from the managed heap graph, groups isomorphic paths into clusters, and answers, “Which reference chains are retaining this memory?” Batch trace runs automatically aggregate heap paths across traces and present the cross-trace distribution of memory clusters in the batch report, backed by regression cases using real heap-graph traces.</li><li><strong>GPU compute evidence</strong> (July 14): A vendor-neutral GPU compute evidence Skill that does not depend on proprietary counters from any specific GPU vendor, backed by real-trace regression coverage.</li><li><strong>Existing-scene hardening</strong> (early June): Memory-analysis evidence handling was hardened, and the evidence semantics for thread blocked reasons were corrected. The latter fixed incorrect attribution in the “blocked reason” field.</li></ul><h2 id="8-RFC-0025-Eight-AI-Workflow-Surfaces"><a href="#8-RFC-0025-Eight-AI-Workflow-Surfaces" class="headerlink" title="8. RFC-0025: Eight AI Workflow Surfaces"></a>8. RFC-0025: Eight AI Workflow Surfaces</h2><p><img src="/en/images/SmartPerfetto-Six-Week-Update/08-rfc-0025.png" alt="RFC-0025 organizing eight AI surfaces into auditable workflows"></p><p>Eight capabilities defined by RFC-0025 were merged on July 7. The goal was to extend AI analysis from a question-and-answer interaction into auditable, batch-oriented, collaborative workflows. Design and implementation documents live under <code>docs/architecture/perfetto-ai-rfc-0025/</code> in the repository. Before integration, each capability went through a complete independent review, and every P1 finding was fixed.</p><table><thead><tr><th>#</th><th>Capability</th><th>Description</th></tr></thead><tbody><tr><td>1</td><td>Analysis receipts and evidence audits</td><td>Every analysis produces a structured receipt covering tool calls, evidence coverage, and quality-gate status, answering “What did this analysis do, and what evidence supports it?”</td></tr><tr><td>2</td><td>Capture-configuration recommendations</td><td>When analysis finds an evidence gap, it generates recommendations for the next trace capture: “Which data sources should I enable next time to verify this conclusion?”</td></tr><tr><td>3</td><td>UI navigation recommendation protocol</td><td>The AI emits structured timeline navigation recommendations—a timestamp or range—that users can click to apply; the AI never manipulates the UI directly</td></tr><tr><td>4</td><td>Similar-case retrieval for snapshots</td><td>MVP retrieval of similar cases across completed analysis snapshots, allowing a new investigation to check for comparable historical cases first</td></tr><tr><td>5</td><td>SQL query review layer</td><td>Reviews a query intermediate representation (IR) and rejects obviously invalid query shapes before execution</td></tr><tr><td>6</td><td>External Skill package extensions</td><td>Distribution and installation for external Skill packages with a hash-verification chain, allowing teams to maintain their own private Skill packages</td></tr><tr><td>7</td><td>Batch trace lifecycle</td><td>Batch submission, concurrency control, progress tracking, and result aggregation; the heap-cluster aggregation report described earlier runs on this pipeline</td></tr><tr><td>8</td><td>AI capability controls and disclosure</td><td>Enterprise environments can disable AI entirely or turn off individual capabilities; failed capability-policy validation is rejected immediately (fail closed)</td></tr></tbody></table><h2 id="9-Knowledge-Foundation-Android-17-Rendering-Pipelines-and-the-Trace-Case-Corpus"><a href="#9-Knowledge-Foundation-Android-17-Rendering-Pipelines-and-the-Trace-Case-Corpus" class="headerlink" title="9. Knowledge Foundation: Android 17 Rendering Pipelines and the Trace Case Corpus"></a>9. Knowledge Foundation: Android 17 Rendering Pipelines and the Trace Case Corpus</h2><p><img src="/en/images/SmartPerfetto-Six-Week-Update/09-knowledge-foundation.png" alt="A dual-track knowledge foundation of authoritative Android 17 documentation and trace cases"></p><ul><li><strong>Android 17 rendering-pipeline knowledge sync</strong> (July 13): The authoritative S01–S14 content under <code>docs/rendering_pipelines/</code> is now synchronized from a source repository pinned to a specific commit (<code>npm run sync:rendering-pipelines</code>). Manual edits are prohibited, preventing the knowledge base from drifting from its source. These are not ordinary documentation files: rendering-pipeline detection, teaching mode, and some Skills read them directly at runtime through <code>doc_path</code>. They are therefore bundled into every distribution format, including the Docker image, whose previously missing copy was fixed as part of this work.</li><li><strong>Trace case corpus</strong> (July 13–14): SmartPerfetto introduced the <code>Trace/catalog.json</code> corpus catalog contract and migrated all real traces into a directory-structured corpus. It also introduced <strong>deterministically constructed traces</strong>: scenarios such as binder I&#x2F;O blocking, GPU load, and framework pipelines are represented as reproducibly generated synthetic traces, each with a file of expected conclusions. Scene regression coverage expanded from “six fixed traces” to “catalog-driven corpus regression.” Adding a new scene now requires only registering its case in the catalog, without changing the regression framework.</li></ul><h2 id="10-The-Case-Knowledge-Platform-and-Self-Evolution-V1"><a href="#10-The-Case-Knowledge-Platform-and-Self-Evolution-V1" class="headerlink" title="10. The Case Knowledge Platform and Self-Evolution V1"></a>10. The Case Knowledge Platform and Self-Evolution V1</h2><p><img src="/en/images/SmartPerfetto-Six-Week-Update/10-case-knowledge-loop.png" alt="The Case Knowledge loop from curated cases through pattern extraction to analysis reuse"></p><p>The first version of the Case Knowledge platform landed on June 20–22 (v1.0.36&#x2F;37), with the goal of making analysis experience persistent and reusable:</p><ul><li><strong>Curated case ingestion</strong>: Typical performance-problem cases can be organized into structured knowledge and retrieved for citation during analysis.</li><li><strong>Self-Evolution V1</strong>: Patterns confirmed during analysis can be captured as reusable knowledge entries. Hardening this pipeline accounted for most of the work: a research report and multiple rounds of independent review drove fixes for 14 gaps, including automatic confirmation scans for patterns, serialized writes to pattern storage so concurrent analyses cannot overwrite one another, and SQL-result persistence.</li><li><strong>Runtime memory-layer hardening</strong>: SmartPerfetto now records previously silent state such as Provider continuity breaks and CLI fallback sources. When something goes wrong, users can reconstruct which model was actually used and which fallback path the run took.</li></ul><h2 id="11-Ecosystem-Eight-Repositories-Form-a-Complete-Path"><a href="#11-Ecosystem-Eight-Repositories-Form-a-Complete-Path" class="headerlink" title="11. Ecosystem: Eight Repositories Form a Complete Path"></a>11. Ecosystem: Eight Repositories Form a Complete Path</h2><p><img src="/en/images/SmartPerfetto-Six-Week-Update/11-ecosystem.png" alt="The Android performance ecosystem, from navigation, instrumentation, and capture to analysis, knowledge, and reproduction"></p><p>SmartPerfetto is no longer an isolated project. Launched on July 14, the <a href="https://github.com/Gracker/android-performance-ecosystem">Android Performance Ecosystem</a> connects eight repositories across instrumentation, capture, analysis, knowledge, and reproduction into a complete Android performance analysis path:</p><table><thead><tr><th>Stage</th><th>Project</th><th>Role</th><th>Link</th></tr></thead><tbody><tr><td>Navigation</td><td>Android Performance Ecosystem</td><td>Unified project map, handoff metadata, README navigation blocks, and drift checks</td><td><a href="https://github.com/Gracker/android-performance-ecosystem">GitHub</a></td></tr><tr><td>Instrumentation</td><td>TraceFix</td><td>Injects app-side <code>android.os.Trace</code> sections at compile time so method execution is visible in traces</td><td><a href="https://github.com/Gracker/TraceFix">GitHub</a></td></tr><tr><td>Capture and measurement</td><td>Perfetto Tools</td><td>Captures reproducible Perfetto traces and collects FPS or Simpleperf measurements</td><td><a href="https://github.com/Gracker/perfetto-tools">GitHub</a></td></tr><tr><td>Analysis</td><td>SmartPerfetto</td><td>AI-assisted Web UI, CLI, reports, sessions, comparison, and evidence workflows</td><td><a href="https://github.com/Gracker/SmartPerfetto">GitHub</a></td></tr><tr><td>Agent analysis</td><td>Perfetto Skills</td><td>Portable Android&#x2F;Linux&#x2F;Chromium Perfetto analysis Skills for direct use by Agents such as Codex, Claude Code, and OpenCode</td><td><a href="https://github.com/Gracker/Perfetto-Skills">GitHub</a></td></tr><tr><td>Learning</td><td>Android Performance Blog</td><td>Articles, system internals, and case studies</td><td><a href="https://www.androidperformance.com/en/">AndroidPerformance.com</a></td></tr><tr><td>System knowledge</td><td>Android Internal Wiki</td><td>An alpha-stage Android system knowledge base covering App, Framework, Native, and Kernel mechanisms</td><td>Coming soon</td></tr><tr><td>Reproduction</td><td>Trace for Blog (SystraceForBlog)</td><td>Perfetto&#x2F;Systrace case files used in articles for hands-on reproduction</td><td><a href="https://github.com/Gracker/SystraceForBlog">GitHub</a></td></tr></tbody></table><p>The relationship between SmartPerfetto and Perfetto-Skills deserves a closer look. The two repositories evolve independently but share a portable analysis contract:</p><ul><li><strong>Public Skill export system</strong> (July 11-12): <code>backend/skills/public-export.yaml</code> explicitly classifies every runtime asset. Portable workflows, SQL, methodology, and pipeline knowledge enter the public projection, while product-specific Provider, session, and streaming semantics remain in SmartPerfetto. <code>npm run verify:public-skills</code> verifies the exported result.</li><li><strong>Bidirectional impact review gate</strong>: <code>npm run check:perfetto-skills-impact</code> identifies every commit that touches a shared contract—including Skills, strategies, evidence contracts, SQL services, pipeline knowledge, and export policies—and requires the author to explicitly record a coordination decision: sync required, sync not required, or deferred with a handoff link. Contract drift no longer depends on human memory.</li><li><strong>Perfetto upstream syncs</strong>: This period included three upstream syncs (v56.0 → v57.1 → v57.2). Each followed the repository’s sync rules for merging the fork, refreshing the UI prebuild, and running scene regressions.</li></ul><h2 id="12-Engineering-and-Usability"><a href="#12-Engineering-and-Usability" class="headerlink" title="12. Engineering and Usability"></a>12. Engineering and Usability</h2><p><img src="/en/images/SmartPerfetto-Six-Week-Update/12-engineering-delivery.png" alt="From real E2E testing, independent review, and CI gates to reproducible delivery"></p><ul><li><strong>Real-path DeepSeek end-to-end verification</strong>: Agent SSE end-to-end tests now use the real DeepSeek API by default (<code>npm run verify:e2e:deepseek*</code>), with a manually triggered GitHub Actions workflow also available. Only a real Provider path can expose behavioral differences in tool-call formats and streaming chunks.</li><li><strong>Institutionalized review</strong>: Weekly architecture reviews are paired with clean-room reviews before releases, with reports committed under <code>docs/reviews/</code>. Quick Mode, RFC-0025, and v1.1.0 all had independent review records before these major features shipped.</li><li><strong>Usability fixes</strong>: Portable packages exclude runtime data (v1.0.33); macOS signing resources are staged correctly (v1.0.37); the launcher has a port fallback; Bedrock model IDs are normalized across regions; the OpenCode runtime is linked correctly inside Docker; and Agent turn budgets have been adjusted.</li><li><strong>Dependency maintenance</strong>: Core dependencies—including the Claude Agent SDK, OpenAI Agents, Pi Agent Core, and OpenCode SDK—have been upgraded continuously.</li></ul><h2 id="13-The-Complete-SmartPerfetto-Feature-Map"><a href="#13-The-Complete-SmartPerfetto-Feature-Map" class="headerlink" title="13. The Complete SmartPerfetto Feature Map"></a>13. The Complete SmartPerfetto Feature Map</h2><p><img src="/en/images/SmartPerfetto-Six-Week-Update/13-feature-map.png" alt="SmartPerfetto&#39;s eight-layer feature map, from entry points and analysis to extensibility and distribution"></p><p>As of v1.1.1, SmartPerfetto’s complete feature map is organized into eight layers: “entry points → analysis → evidence and quality → knowledge → comparison and code awareness → output → extensibility and governance → distribution.”</p><table><thead><tr><th>Layer</th><th>Feature</th><th>Description</th></tr></thead><tbody><tr><td><strong>Entry points</strong></td><td>Perfetto UI AI Assistant</td><td>The forked Perfetto UI includes a built-in AI panel&#x2F;sidebar&#x2F;floating window, placing timeline inspection and AI analysis on the same screen</td></tr><tr><td></td><td>Smart Mode</td><td>Reconstructs the scene timeline of a mixed trace, then lets users drill into all scenes or an individual one (startup&#x2F;scroll&#x2F;click&#x2F;navigation&#x2F;ANR, and more)</td></tr><tr><td></td><td>Selection-based quick questions</td><td>Select a timeline region or slice and ask questions against that selected context</td></tr><tr><td></td><td>Dual-trace comparison workspace</td><td>Loads the current and historical traces side by side, allowing AI to compare them in real time within the same session</td></tr><tr><td></td><td>CLI</td><td><code>smp run / ask / repl / capture / compare / report / query / skill / doctor</code>, including Android capture presets and automatic post-capture analysis</td></tr><tr><td></td><td>HTTP + SSE API</td><td><code>/api/agent/v1/*</code>, <code>/api/traces/*</code>, and <code>/api/reports/*</code> for integrations and the frontend</td></tr><tr><td></td><td>Batch analysis</td><td>Batch submission, concurrency control, and result aggregation, including aggregate reports for heap clusters</td></tr><tr><td><strong>Analysis</strong></td><td>Three analysis modes</td><td>fast (lightweight direct answers) &#x2F; full (complete planning + verification) &#x2F; auto (semantic routing)</td></tr><tr><td></td><td>Quick Mode evidence-backed direct answer</td><td>Zero-round direct answers from deterministic evidence collection, with sentence-level data citations and an analysis receipt</td></tr><tr><td></td><td>Scene strategies</td><td>21 Markdown scene strategies (including the final report contract), with scene classification driven by frontmatter</td></tr><tr><td></td><td>YAML Skill engine</td><td>239 deterministic Skills (atomic&#x2F;composite&#x2F;deep&#x2F;modules&#x2F;pipelines&#x2F;comparison), with L1-L4 tiered results</td></tr><tr><td></td><td>Rendering pipeline detection and guidance</td><td>Covers View, Compose, Flutter, WebView, game, and other pipeline types, with authoritative Android 17 knowledge (S01-S14) available to the runtime</td></tr><tr><td></td><td>Four Agent runtimes</td><td>claude-agent-sdk &#x2F; openai-agents-sdk &#x2F; pi-agent-core &#x2F; opencode, with a unified run specification, MCP tool registry, and plan evidence log</td></tr><tr><td></td><td>Provider management</td><td>Manages multiple Provider profiles in the UI, with runtime switching, session-level binding, and environment isolation</td></tr><tr><td><strong>Evidence and quality</strong></td><td>DataEnvelope structured results</td><td>A self-describing table&#x2F;chart contract rendered by the frontend from its schema and consumed by reports, snapshots, and the CLI</td></tr><tr><td></td><td>Evidence contracts and conclusion validation</td><td>Conclusions must be backed by Skill&#x2F;SQL evidence; deterministic conclusions are validated individually, with process and thread identity resolution</td></tr><tr><td></td><td>Report contract gates</td><td>Strategy frontmatter declares required report sections, and completeness is checked programmatically</td></tr><tr><td></td><td>Validator and misdiagnosis pattern library</td><td>An independent validation pass in full mode, with misdiagnosis patterns loaded from strategy files</td></tr><tr><td></td><td>SQL query review</td><td>An intermediate-representation review layer that blocks obviously incorrect queries before execution</td></tr><tr><td><strong>Knowledge</strong></td><td>Perfetto SQL&#x2F;stdlib index</td><td>Schema and standard-library symbol indexes plus knowledge-query tools, regenerated with each upstream sync</td></tr><tr><td></td><td>Case Knowledge and self-evolution</td><td>Curated case ingestion plus automatic pattern extraction from confirmed analyses (V1)</td></tr><tr><td></td><td>Android Internals external knowledge base</td><td>Registers a local wiki checkout as a versioned knowledge source, with dual consent, metadata projection, and fail-closed enforcement</td></tr><tr><td></td><td>Trace case corpus</td><td>A <code>Trace/catalog.json</code> catalog contract for scene regressions across real and deterministically constructed traces</td></tr><tr><td><strong>Comparison and code awareness</strong></td><td>Raw trace comparison</td><td>The dual-window workspace plus CLI <code>smp compare</code>, using the same backend comparison identity and evidence bundle</td></tr><tr><td></td><td>Comparison across analysis results</td><td>Compares the user’s completed snapshots across traces, windows, and workspaces</td></tr><tr><td></td><td>Similar-case retrieval</td><td>Retrieves similar cases across analysis snapshots (MVP)</td></tr><tr><td></td><td>Code-Aware source analysis</td><td>Registers local codebases and resolves symbols; the model sees only CodeRef metadata, while source text is visible only through permission-controlled endpoints; patch suggestions are validated with <code>git apply --check</code></td></tr><tr><td><strong>Output</strong></td><td>Real-time SSE projection</td><td>Streams progress, conclusions, and UI navigation suggestions while keeping chat readable instead of burying it in raw SQL</td></tr><tr><td></td><td>HTML reports</td><td>Complete reports that preserve evidence, conclusion validation, identity resolution, and appendix details</td></tr><tr><td></td><td>Analysis result snapshots</td><td>Persistent snapshots for later comparison, similar-case retrieval, and reinspection</td></tr><tr><td></td><td>CLI Turn Artifacts</td><td>Session and report files under <code>~/.smartperfetto/</code> for scripted consumption</td></tr><tr><td><strong>Extensibility and governance</strong></td><td>External Skill packages</td><td>Skill package distribution and installation with a hash-verification chain</td></tr><tr><td></td><td>Capture configuration suggestions</td><td>Derives trace capture configuration suggestions from gaps in an analysis</td></tr><tr><td></td><td>UI navigation suggestions</td><td>Structured navigation suggestions from AI that execute only after user confirmation</td></tr><tr><td></td><td>AI capability controls and disclosure</td><td>Disables AI globally or per capability, with fail-closed enforcement when policy validation fails</td></tr><tr><td></td><td>Public Skill export</td><td>Explicitly classified exports to the public Perfetto-Skills repository, guarded by a bidirectional impact review gate</td></tr><tr><td><strong>Distribution</strong></td><td>Docker Hub</td><td><code>docker compose -f docker-compose.hub.yml up -d</code>, with no host installation of Node.js required</td></tr><tr><td></td><td>Portable packages</td><td>Windows&#x2F;macOS&#x2F;Linux packages bundling Node.js 24 and a pinned trace processor</td></tr><tr><td></td><td>npm CLI</td><td><code>npm install -g @gracker/smartperfetto</code>, exposing the <code>smp</code> &#x2F; <code>smartperfetto</code> commands</td></tr><tr><td></td><td>Source</td><td><code>./start.sh</code>, using the committed prebuilt UI without building the Perfetto submodule</td></tr></tbody></table><h2 id="14-Release-Timeline"><a href="#14-Release-Timeline" class="headerlink" title="14. Release Timeline"></a>14. Release Timeline</h2><p><img src="/en/images/SmartPerfetto-Six-Week-Update/14-version-timeline.png" alt="SmartPerfetto release timeline from v1.0.29 to v1.1.1"></p><table><thead><tr><th>Version</th><th>Date</th><th>Highlights</th></tr></thead><tbody><tr><td>v1.0.29</td><td>2026-06-05</td><td>Stronger evidence for memory analysis and corrected evidence semantics for thread blocking reasons</td></tr><tr><td>v1.0.30</td><td>2026-06-06</td><td>Perfetto upstream sync to v56.0</td></tr><tr><td>v1.0.31</td><td>2026-06-06</td><td>Agent end-to-end verification moved to the real DeepSeek path</td></tr><tr><td>v1.0.32</td><td>2026-06-07</td><td>Runtime engines organized into directories, end-to-end cancellation semantics, state continuation for third-party runtimes, and a validator misdiagnosis pattern library</td></tr><tr><td>v1.0.33</td><td>2026-06-07</td><td>Runtime data excluded from portable packages</td></tr><tr><td>v1.0.34</td><td>2026-06-17</td><td>DeepSeek trace analysis alignment and turn-budget adjustments</td></tr><tr><td>v1.0.35</td><td>2026-06-19</td><td>Token optimizations shipped: strategy core&#x2F;detail split, SQL summaries, compressed tool descriptions, and cache boundaries</td></tr><tr><td>v1.0.36</td><td>2026-06-22</td><td>Case Knowledge platform + self-evolution V1 + memory-layer fixes</td></tr><tr><td>v1.0.37</td><td>2026-06-22</td><td>Fixed signing resources for macOS portable packages</td></tr><tr><td>v1.0.38</td><td>2026-07-04</td><td>Productized Quick Mode direct answers and analysis receipts, refreshed Provider presets, and Perfetto v57.1</td></tr><tr><td>v1.0.39</td><td>2026-07-11</td><td>RFC-0025’s eight AI workflow surfaces and the dual-trace workspace</td></tr><tr><td>v1.1.0</td><td>2026-07-17</td><td>Unified analysis context and runtime architecture, private-context authorization fingerprints, Camera&#x2F;Heap&#x2F;GPU scenes, Android 17 rendering knowledge, trace corpus, public Skill export, regression-gate CI, and Perfetto v57.2</td></tr><tr><td>v1.1.1</td><td>2026-07-17</td><td>Review-driven fixes for source-reference locatability, validator evidence binding, restored scroll-metric semantics, and more</td></tr></tbody></table><h2 id="15-Try-It-and-Send-Feedback"><a href="#15-Try-It-and-Send-Feedback" class="headerlink" title="15. Try It and Send Feedback"></a>15. Try It and Send Feedback</h2><p><img src="/en/images/SmartPerfetto-Six-Week-Update/15-try-feedback.png" alt="Docker, portable packages, the npm CLI, and source entry points converge into reproducible feedback"></p><p>Choose the distribution format that fits your use case (see the repository README and <code>docs/getting-started/quick-start.md</code> for details):</p><ul><li><strong>For the fastest trial</strong>: Use the Docker Hub image with <code>docker compose -f docker-compose.hub.yml up -d</code>; no host installation of Node.js is required.</li><li><strong>If you do not want Docker</strong>: Use a GitHub Release portable package for Windows, macOS, or Linux; it includes every runtime.</li><li><strong>For terminal and scripting workflows</strong>: Run <code>npm install -g @gracker/smartperfetto</code>; Node.js 24 is required on the host.</li><li><strong>If you want to modify the code</strong>: Check out the source and run <code>./start.sh</code>; use <code>./scripts/start-dev.sh</code> for plugin UI development.</li></ul><p>When reporting a bug, please include as much of the following as possible: a reproducible trace, the exact evidence location (timestamp&#x2F;process&#x2F;thread), and the difference between the expected and actual analysis conclusions. Issues that include a trace receive the highest priority.</p>]]></content>
    
    
    <summary type="html">&lt;p&gt;This post reviews every major SmartPerfetto change since the &lt;a href=&quot;https://www.androidperformance.com/en/2026/06/04/SmartPerfetto-Three-Week-Update/&quot;&gt;previous three-week update&lt;/a&gt; (2026-06-04, v1.0.28), through 2026-07-17 (v1.1.1). By the end, you will understand the problem each feature solved over these six weeks, where its boundaries lie, and the full feature map of the current release. Project repository: &lt;a href=&quot;https://github.com/Gracker/SmartPerfetto&quot;&gt;github.com&amp;#x2F;Gracker&amp;#x2F;SmartPerfetto&lt;/a&gt;.&lt;/p&gt;</summary>


    <category term="SmartPerfetto" scheme="https://androidperformance.com/en/categories/SmartPerfetto/"/>
    
    
    <category term="Perfetto" scheme="https://androidperformance.com/en/tags/Perfetto/"/>
    
    <category term="SmartPerfetto" scheme="https://androidperformance.com/en/tags/SmartPerfetto/"/>
    
    <category term="Android Performance" scheme="https://androidperformance.com/en/tags/Android-Performance/"/>
    
  </entry>
  
  <entry>
    <title>SmartPerfetto 2026-05-17 to 2026-06-04 Three-Week Update: Smart Mode, Evidence Rules, and Four Runtimes</title>
    <link href="https://androidperformance.com/en/2026/06/04/SmartPerfetto-Three-Week-Update/"/>
    <id>https://androidperformance.com/en/2026/06/04/SmartPerfetto-Three-Week-Update/</id>
    <published>2026-06-04T04:00:00.000Z</published>
    <updated>2026-07-18T01:56:58.938Z</updated>
    
    <content type="html"><![CDATA[<p><img src="/en/images/SmartPerfetto-Three-Week-Update/smartperfetto-three-week-cover.png" alt="SmartPerfetto 2026-05-17 to 2026-06-04 update cover"></p><p>The previous SmartPerfetto update was published on May 17. At that point the project had already moved from “an AI Assistant inside Perfetto UI” to “a reusable trace analysis platform.” By June 4, the new work is concentrated in five areas: Smart Mode, selected-range quick analysis, CLI capture, stronger evidence rules for Power &#x2F; ANR &#x2F; Input &#x2F; IO &#x2F; Network, and four Agent runtimes.</p><p>This article is based on the SmartPerfetto main branch on June 4, 2026. The latest public release at this point is <code>v1.0.28</code>. The goal is simple: list what changed after May 17, explain how runtimes and evidence sources are handled, and show what information makes a useful bug report.</p><p>Project links:</p><ul><li>SmartPerfetto main repository: <a href="https://github.com/Gracker/SmartPerfetto">https://github.com/Gracker/SmartPerfetto</a></li><li>Previous update: <a href="https://www.androidperformance.com/en/2026/05/17/SmartPerfetto-Two-Week-Update/">https://www.androidperformance.com/en/2026/05/17/SmartPerfetto-Two-Week-Update/</a></li></ul><span id="more"></span><h2 id="2026-05-17-to-2026-06-04-Overview"><a href="#2026-05-17-to-2026-06-04-Overview" class="headerlink" title="2026-05-17 to 2026-06-04 Overview"></a>2026-05-17 to 2026-06-04 Overview</h2><p>The feature map in the previous article still showed <code>SmartPerfetto v1.0.7</code>. The public release is now <code>v1.0.28</code>. At this commit, the repository has 230 <code>*.skill.yaml</code> files. After excluding <code>_template</code>, 226 of them are functional Skill files. <code>backend/strategies/</code> has 20 <code>.strategy.md</code> files and 35 <code>.template.md</code> files.</p><p>The count changed, but the useful change is not the count itself. Users will notice the changes in six areas:</p><table><thead><tr><th>Area</th><th>May 17 state</th><th>Current state</th></tr></thead><tbody><tr><td>Analysis entry</td><td>Ask questions inside Perfetto UI with fast &#x2F; full &#x2F; auto modes</td><td>Smart Mode starts with scene inventory, selected-range quick analysis only inspects the current range, and CLI uses the shared analysis core</td></tr><tr><td>CLI and capture</td><td>CLI &#x2F; API were already documented and shipped</td><td><code>smp capture</code>, <code>smp analyze</code>, compare workflows, CLI turn files, and npm package checks are now part of release verification</td></tr><tr><td>Scene coverage</td><td>startup, scrolling, ANR, interaction, touch, memory, power, network, and related strategies already existed</td><td><code>smart.strategy.md</code> and <code>io.strategy.md</code> were added, and Power &#x2F; ANR &#x2F; Input &#x2F; Display &#x2F; IO &#x2F; Network &#x2F; Observability now have stricter evidence requirements</td></tr><tr><td>Evidence reliability</td><td>SQL guardrails, evidence IDs, and sentence-level citations were already in place</td><td>Failed SQL no longer becomes frontend evidence; final report checks, claim verification, and scene-specific evidence rules cover more scenes</td></tr><tr><td>Model integration</td><td>Claude Agent SDK and OpenAI Agents SDK were first-class runtimes</td><td><code>claude-agent-sdk</code>, <code>openai-agents-sdk</code>, <code>pi-agent-core</code>, and <code>opencode</code> now share one output format</td></tr><tr><td>Release verification</td><td>Docker, portable packages, source, and CLI were in release docs</td><td>Before <code>v1.0.28</code>, all four runtimes passed startup &#x2F; scrolling strict E2E, 6 canonical scene trace regressions, npm, portable, and Docker checks</td></tr></tbody></table><p>The main direction is clear: more scenes now have verifiable analysis flows. The model still explains and prioritizes. The numbers still come from <code>trace_processor_shell</code>, SQL, Skill tables, and structured evidence in reports.</p><h2 id="Current-Feature-Map"><a href="#Current-Feature-Map" class="headerlink" title="Current Feature Map"></a>Current Feature Map</h2><p><img src="/en/images/SmartPerfetto-Three-Week-Update/feature-map.png" alt="SmartPerfetto v1.0.28 feature map"></p><p>SmartPerfetto now has five practical layers: entry, analysis, evidence, runtime, and distribution.</p><table><thead><tr><th>Surface</th><th>Current behavior</th><th>Good fit</th></tr></thead><tbody><tr><td>Perfetto UI &#x2F; Smart Mode</td><td>Load <code>.pftrace</code> &#x2F; <code>.perfetto-trace</code>, ask questions directly, or let Smart Mode identify startup, scrolling, click, navigation, ANR, and device-state ranges first</td><td>Mixed traces where you want to find the useful ranges before spending full-analysis tokens</td></tr><tr><td>Selected-range quick analysis</td><td>Perfetto area selection &#x2F; track event selection carries <code>selectionContext</code>; the backend runs quick analysis in that bounded scope</td><td>Understanding a short time window, one frame, or what happened around a suspicious slice</td></tr><tr><td>CLI &#x2F; Capture</td><td><code>smp</code> &#x2F; <code>smartperfetto</code> reuse backend runtimes, MCP tools, Skills, reports, and session snapshots</td><td>Terminal analysis, scripts, CI, and remote environments</td></tr><tr><td>Skills + Strategies</td><td>226 functional Skill files, 20 scene strategies, and 35 templates covering startup, scrolling, ANR, interaction, memory, power, network, pipeline, IO, Smart Mode, and more</td><td>Routing natural-language questions to deterministic SQL, Skills, and report requirements</td></tr><tr><td>Reports + Evidence</td><td>HTML reports, Result IDs, analysis-result snapshots, claim refs, data-source narration, and CLI turn files are preserved together</td><td>Mapping “what the AI said” back to SQL, Skills, rows, and evidence IDs</td></tr><tr><td>Agent Runtimes</td><td>Claude, OpenAI, Pi Agent Core, and OpenCode are selected explicitly through Provider Manager or env config</td><td>Running one trace-analysis output format through different SDK or server orchestration modes</td></tr><tr><td>Runtime Guardrails</td><td>Provider Manager, request-scoped MCP tools, session snapshots, and <code>/health</code> diagnostics constrain runtime behavior</td><td>Debugging cases where connection testing passes but the actual analysis runtime is not the one expected</td></tr><tr><td>Distribution</td><td>Docker Hub, Windows &#x2F; macOS &#x2F; Linux portable packages, source <code>./start.sh</code>, and npm CLI all have verification</td><td>Trial use, developer work, team deployment, and script integration</td></tr></tbody></table><p>One rule matters before everything else: SmartPerfetto does not push the whole trace into the prompt. The model sees SQL results returned by backend tools, Skill output, scene context, report summaries, and structured evidence. New runtimes do not bypass that rule.</p><h2 id="Feature-One-Smart-Mode-Selected-Range-Quick-Analysis-and-CLI-Share-One-Core"><a href="#Feature-One-Smart-Mode-Selected-Range-Quick-Analysis-and-CLI-Share-One-Core" class="headerlink" title="Feature One: Smart Mode, Selected-Range Quick Analysis, and CLI Share One Core"></a>Feature One: Smart Mode, Selected-Range Quick Analysis, and CLI Share One Core</h2><p><img src="/en/images/SmartPerfetto-Three-Week-Update/smart-mode-cli.png" alt="Smart Mode and CLI share the analysis core"></p><p>The previous article already covered fast &#x2F; full &#x2F; auto analysis modes. After May 17, SmartPerfetto added two more practical entries: Smart scene selection and range-scoped quick analysis.</p><p>Smart Mode starts with scene inventory. A mixed trace can contain startup, scrolling, clicks, navigation, ANR, and device-state changes in the same file. SmartPerfetto first identifies analyzable ranges, attaches eligibility, confidence, context, verification, and report IDs, then lets the user deep-dive all scenes or only one scene type.</p><p>Selected-range quick analysis solves a smaller but common problem. In Perfetto UI, users often select a time range or one track event and ask “why is this range slow?” or “what happened around this slice?” The backend now passes that selected context into the request. The quick path gathers evidence around that range instead of treating the whole trace as the analysis target.</p><p>The CLI entry also became a real terminal product instead of a thin backend wrapper. <code>smp capture</code> handles capture, <code>smp analyze</code> handles analysis, and compare workflows, session files, report output, and Provider&#x2F;runtime selection reuse the Web logic. CLI does not start the Web UI, and it still uses the shared analysis core.</p><table><thead><tr><th>Scenario</th><th>Before</th><th>Now</th></tr></thead><tbody><tr><td>Mixed-trace triage</td><td>Inspect the timeline manually and ask about one scene</td><td>Smart Mode lists scenes first, then the user chooses what to deep-dive</td></tr><tr><td>A selected jank range</td><td>Copy timestamps or type a range manually</td><td>Selection context enters the backend; quick analysis stays in the selected range</td></tr><tr><td>Remote-machine capture</td><td>Capture with external tools, then move the trace into the UI</td><td><code>smp capture</code> records the trace; <code>smp analyze</code> runs the shared Skills and report flow</td></tr><tr><td>Regression comparison</td><td>Pick a reference trace or Result ID in the UI</td><td>CLI compare workflows and analysis-result snapshots can be scripted</td></tr></tbody></table><p>This is the reason the four-runtime work can fit into the product. The entry may be UI, CLI, or API, but the implementation returns to <code>AgentAnalyzeSessionService</code>, Skills, MCP tools, and report checks.</p><h2 id="Feature-Two-Evidence-Rules-Now-Cover-More-Scenes"><a href="#Feature-Two-Evidence-Rules-Now-Cover-More-Scenes" class="headerlink" title="Feature Two: Evidence Rules Now Cover More Scenes"></a>Feature Two: Evidence Rules Now Cover More Scenes</h2><p><img src="/en/images/SmartPerfetto-Three-Week-Update/evidence-contracts.png" alt="Scene evidence rules"></p><p>Earlier SmartPerfetto work was heavily focused on startup and scrolling. The late-May work expands the rule set for what a report must prove in more scenes.</p><table><thead><tr><th>Scene</th><th>Added or strengthened evidence</th><th>What users get</th></tr></thead><tbody><tr><td>Power</td><td>battery drain, power rails, wakelock, CPU freq &#x2F; idle, JobScheduler, modem &#x2F; network related Skills</td><td>A report can connect background power, rail energy, wakeups, and scheduler events instead of only listing CPU hotspots</td></tr><tr><td>ANR</td><td><code>anr_context_in_range</code>, main thread states &#x2F; slices, futex wait, logcat, and ANR detail requirements</td><td>The report can separate running, waiting, futex, Binder, and logcat signals instead of turning any stall into an ANR root cause</td></tr><tr><td>Input &#x2F; Interaction</td><td>input events, scroll response latency, click response analysis &#x2F; detail</td><td>Input-to-response latency has its own evidence path, so not every jank is pushed into RenderThread by default</td></tr><tr><td>Display &#x2F; Pipeline</td><td>fence wait decomposition and display evidence rules in pipeline strategy</td><td>Producer, SurfaceFlinger, HWC, fence, and report conclusions are tied to explicit evidence</td></tr><tr><td>IO &#x2F; Network</td><td><code>io.strategy.md</code> and network request-stage evidence templates</td><td>IO wait, network request phases, and scene conclusions have concrete entry points</td></tr><tr><td>Observability</td><td>diagnostics evidence templates, missing-signal policy, trace completeness probing</td><td>Missing tables or categories are reported as missing signals instead of becoming confident conclusions</td></tr></tbody></table><p>This is bigger than adding a few SQL queries. Before, report quality relied mostly on prompts asking the model to cite evidence. Now strategy frontmatter, Skill evidence rules, final report checks, and claim verification work together. When key numbers, threads, processes, frame counts, or percentages appear in a report, they need to point back to their evidence source.</p><p>That is also why failed SQL diagnostics cannot become frontend evidence. Failed SQL is useful for maintainers. It is not a trace fact for the user. Verified data, diagnostics, visible report text, and snapshot provenance are stored separately.</p><h2 id="Feature-Three-Four-Runtimes-Share-One-Product-Output"><a href="#Feature-Three-Four-Runtimes-Share-One-Product-Output" class="headerlink" title="Feature Three: Four Runtimes Share One Product Output"></a>Feature Three: Four Runtimes Share One Product Output</h2><p><img src="/en/images/SmartPerfetto-Three-Week-Update/runtime-contract.png" alt="Four runtimes share one product output"></p><p>The previous article covered Claude Agent SDK and OpenAI Agents SDK. In <code>v1.0.28</code>, SmartPerfetto has four runtimes:</p><table><thead><tr><th>Runtime</th><th>Provider fit</th><th>Boundary</th></tr></thead><tbody><tr><td><code>claude-agent-sdk</code></td><td>Anthropic, Bedrock, Vertex, DeepSeek, Anthropic-compatible gateways, local Claude Code config</td><td>Default path; keeps in-process MCP server, verifier, sub-agent, and SDK resume behavior</td></tr><tr><td><code>openai-agents-sdk</code></td><td>OpenAI, Ollama, OpenAI-compatible gateways</td><td>Reuses the shared SmartPerfetto MCP tool registry through function tools</td></tr><tr><td><code>pi-agent-core</code></td><td>custom provider</td><td>Optional public runtime; reuses SmartPerfetto prompt, tools, and report flow; does not enable <code>.pi</code> discovery, package extensions, shell tools, or file tools</td></tr><tr><td><code>opencode</code></td><td>custom provider or explicit OpenAI-compatible config</td><td>Uses a request-scoped SmartPerfetto MCP bridge; does not read the user’s own OpenCode login state or project state, and does not enable built-in file &#x2F; shell &#x2F; web &#x2F; edit tools</td></tr></tbody></table><p>Provider Manager and env config do not guess the runtime from whichever key exists. The priority is request&#x2F;session <code>providerId</code>, active Provider Manager profile, <code>SMARTPERFETTO_AGENT_RUNTIME</code>, then the default <code>claude-agent-sdk</code>. Once an analysis session is created, it pins the credential source used at that moment. Restoring an old session does not silently switch to a new active provider.</p><p>The internal mechanisms differ. Claude runtime exposes an in-process MCP server. OpenAI runtime adapts the shared tool descriptors into function tools. Pi Agent Core uses request-scoped native tools. OpenCode calls SmartPerfetto tools through an isolated server and a request-scoped MCP bridge.</p><p>The product output is shared:</p><figure class="highlight text"><table><tr><td class="gutter"><pre><span class="line">1</span><br><span class="line">2</span><br><span class="line">3</span><br><span class="line">4</span><br><span class="line">5</span><br><span class="line">6</span><br></pre></td><td class="code"><pre><span class="line">runtime result</span><br><span class="line">  -&gt; agentResultNormalizer</span><br><span class="line">  -&gt; finalReportContractGate</span><br><span class="line">  -&gt; evidence rules / claim verification / identity resolutions</span><br><span class="line">  -&gt; HTML report / CLI turn files / analysis-result snapshot</span><br><span class="line">  -&gt; frontend visible projection</span><br></pre></td></tr></table></figure><p>The release checks follow that output format. Before <code>v1.0.28</code>, Claude, OpenAI, Pi Agent Core, and OpenCode all passed startup &#x2F; scrolling strict E2E. All 8 E2E runs required claim verification to pass, 12 checked claims, 0 unsupported &#x2F; issues, and a non-partial final report. The release flow also ran 6 canonical scene trace regressions, frontend prebuild checks, CLI pack checks, npm fresh-install smoke, portable packaging, GitHub Release checks, and Docker Hub manifest checks.</p><p>This does not mean every runtime prints identical wording. Different SDKs have different tool-call timing, streaming events, context recovery, cost, and timeout behavior. SmartPerfetto constrains the shared surfaces: SSE events, HTML reports, CLI turn files, analysis-result snapshots, claim verification, and session resume semantics.</p><h2 id="Feature-Four-Reports-and-Debugging-Data-Are-Easier-to-Inspect"><a href="#Feature-Four-Reports-and-Debugging-Data-Are-Easier-to-Inspect" class="headerlink" title="Feature Four: Reports and Debugging Data Are Easier to Inspect"></a>Feature Four: Reports and Debugging Data Are Easier to Inspect</h2><p>Some changes are less visible than runtime support, but they matter more in daily use.</p><p>The first group is report completeness. Changes such as <code>ensure complete agent final reports</code>, final report presentation hardening, evidence table readability, and analysis quality rules all address one problem: running many tools does not guarantee a complete user-facing report. A report now needs to satisfy the final report rules defined by the scene, and its claims need to pass claim verification. The frontend may clean up visible text. Provenance needed by reports, CLI, or snapshots must stay intact.</p><p>The second group is SQL and diagnostics. Raw SQL artifacts, failed SQL diagnostics, and trace processor startup failures are handled more explicitly. Failed SQL diagnostics can go into logs and debugging material, but they should not be mixed into the evidence table for the current trace. If <code>trace_processor_shell</code> fails to start, a prebuilt binary is missing, or trace loading fails, the error should show up in health checks or error output, not as a vague AI-quality problem.</p><p>The third group is codebase-aware analysis. SmartPerfetto can include local codebase context in an analysis task. This helps map trace evidence to code. It does not replace trace evidence. Code locations can explain possible fixes; performance judgment still comes from trace data.</p><p>This makes bug reports more useful. Instead of only saying “the AI conclusion is wrong,” users can attach a Result ID, HTML report, <code>evidenceRefId</code>, claim ref, related SQL, Skill table, and <code>/health</code> runtime data.</p><h2 id="Usability-Fixes"><a href="#Usability-Fixes" class="headerlink" title="Usability Fixes"></a>Usability Fixes</h2><p>Recent fixes also focus on whether a real user can run the first trace and diagnose a failure.</p><table><thead><tr><th>Fix area</th><th>User-visible effect</th></tr></thead><tbody><tr><td>trace processor prebuilts</td><td>Source and npm CLI paths more reliably get the pinned <code>trace_processor_shell</code>; startup failure messages are clearer</td></tr><tr><td>Provider debug status</td><td><code>/health</code> shows actual runtime, credential source, provider mode, and diagnostics</td></tr><tr><td>Node 24 hardening</td><td>Source and CLI require Node.js <code>&gt;=24 &lt;25</code>, reducing build&#x2F;runtime drift</td></tr><tr><td>npm CLI bin</td><td><code>smp</code> &#x2F; <code>smartperfetto</code> are valid package bins; fresh installs can run version and doctor smoke checks</td></tr><tr><td>service port config</td><td>SmartPerfetto service ports are configurable; port cleanup avoids killing unrelated client processes</td></tr><tr><td>Docker healthcheck</td><td>Docker healthcheck syntax is fixed, so release checks can cover runtime image smoke</td></tr><tr><td>frontend evidence table</td><td>Evidence tables in AI Assistant are easier to read in chat and reports</td></tr><tr><td>final SSE conclusion</td><td>SSE conclusion, <code>analysis_completed</code>, and HTML report final state are more stable</td></tr><tr><td>raw SQL artifact</td><td>Raw SQL, final executable SQL, failed diagnostics, and user-visible evidence are separated</td></tr><tr><td>release verification</td><td>npm, portable assets, GitHub Release, Docker latest, and Docker version tags are verified after publishing</td></tr></tbody></table><p>These fixes are not flashy. They decide whether Android performance teams can use the tool on real traces. SmartPerfetto crosses Perfetto UI, Express backend, SSE, trace processor, Provider protocol, model SDK, CLI, Docker, and portable packages. State drift in any of these surfaces usually shows up to the user as “the AI analysis is unreliable.”</p><h2 id="How-to-Choose-a-Run-Path"><a href="#How-to-Choose-a-Run-Path" class="headerlink" title="How to Choose a Run Path"></a>How to Choose a Run Path</h2><p>For most users, Docker or the portable package is still the first choice. Developers and script users can choose source or CLI.</p><table><thead><tr><th>Run mode</th><th>Good fit</th><th>Notes</th></tr></thead><tbody><tr><td>Docker Hub</td><td>Fast trial or deployment</td><td>Does not use host Claude Code login state; needs Provider Manager or <code>.env</code> provider config</td></tr><tr><td>Portable package</td><td>Users who do not want Node.js or Docker</td><td>Windows, macOS, and Linux packages bundle Node.js 24, backend, prebuilt frontend, and pinned trace processor</td></tr><tr><td>Local source <code>./start.sh</code></td><td>Developers changing backend &#x2F; Skills &#x2F; strategies</td><td>Uses committed prebuilt frontend; normal backend and Skill work does not require rebuilding Perfetto UI</td></tr><tr><td>Dev mode <code>./scripts/start-dev.sh</code></td><td>People changing the AI Assistant plugin UI</td><td>Requires the <code>perfetto/</code> submodule and frontend watch build</td></tr><tr><td>npm CLI <code>smp</code></td><td>Terminal capture, analysis, CI, and scripts</td><td>Does not start Web UI; reuses shared runtime selection, MCP tools, Skills, reports, and session snapshots</td></tr></tbody></table><p>For runtime config, pick one mode first:</p><table><thead><tr><th>What you have</th><th>Recommended choice</th></tr></thead><tbody><tr><td>Local source, and <code>claude</code> already works in the same terminal</td><td>Default <code>claude-agent-sdk</code>; no OpenAI key needed</td></tr><tr><td>OpenAI, Ollama, or OpenAI-compatible gateway</td><td><code>openai-agents-sdk</code></td></tr><tr><td>Pi Agent Core model config</td><td>custom provider + <code>pi-agent-core</code></td></tr><tr><td>OpenCode model config</td><td>custom provider + <code>opencode</code></td></tr><tr><td>Docker &#x2F; portable, and you do not want env files</td><td>Create and activate a provider profile in UI Provider Manager</td></tr></tbody></table><p>Do not put provider names into <code>SMARTPERFETTO_AGENT_RUNTIME</code>. That variable only accepts <code>claude-agent-sdk</code>, <code>openai-agents-sdk</code>, <code>pi-agent-core</code>, and <code>opencode</code>. Providers such as DeepSeek, Qwen, Kimi, MiMo, and TokenHub should be configured through Provider Manager or the matching protocol env block.</p><h2 id="How-to-File-a-Useful-Bug-Report"><a href="#How-to-File-a-Useful-Bug-Report" class="headerlink" title="How to File a Useful Bug Report"></a>How to File a Useful Bug Report</h2><p><img src="/en/images/SmartPerfetto-Three-Week-Update/bug-feedback.png" alt="SmartPerfetto bug report checklist"></p><p>SmartPerfetto bug reports still belong in GitHub Issues. Security reports should not be filed as public issues; use GitHub private advisory or the security contact instead.</p><p>After <code>v1.0.28</code>, a useful report should include:</p><table><thead><tr><th>Category</th><th>What to include</th></tr></thead><tbody><tr><td>SmartPerfetto version</td><td>version, commit, Docker image tag, portable filename, or npm CLI version</td></tr><tr><td>Run mode</td><td>Docker, portable, source <code>./start.sh</code>, dev mode, npm CLI, or API</td></tr><tr><td>Runtime &#x2F; Provider</td><td><code>claude-agent-sdk</code>, <code>openai-agents-sdk</code>, <code>pi-agent-core</code>, or <code>opencode</code>; provider name, model ID, Base URL, protocol type</td></tr><tr><td>Trace information</td><td>device, Android version, scenario, trace categories, FrameTimeline availability, trace size</td></tr><tr><td>Analysis scope</td><td>full trace, selected range, Smart scene, CLI capture, and whether the issue happened during follow-up turns or mode switching</td></tr><tr><td>Evidence pointer</td><td>Result ID, HTML report, <code>evidenceRefId</code>, claim ref, <code>Q/C</code> row, related SQL, or Skill table</td></tr><tr><td>Failure surface</td><td>chat text, SQL, Skill table, report, provider connection, runtime selection, session resume, or CLI output</td></tr><tr><td>Artifacts</td><td>backend logs, CLI turn files, <code>/health</code> <code>aiEngine</code> snippet, screenshot, HTML report</td></tr><tr><td>Expected vs actual</td><td>smallest repro steps, actual output, expected output, and the manual evidence behind the expectation</td></tr></tbody></table><p>Provider issues should separate “the model can chat” from “the model can run stable tool &#x2F; function calls.” SmartPerfetto depends on streaming output, structured tool arguments, context recovery, and long report generation. Normal chat success does not prove full trace analysis works.</p><p>Trace issues also need capture conditions. Android 12+ traces with FrameTimeline are better for startup, scrolling, and rendering analysis. Power, ANR, network, and IO each need different categories. When the data source is missing, the correct behavior is to report missing signals, not to invent a confident conclusion.</p><h2 id="Feedback-That-Helps-Most-Right-Now"><a href="#Feedback-That-Helps-Most-Right-Now" class="headerlink" title="Feedback That Helps Most Right Now"></a>Feedback That Helps Most Right Now</h2><p>SmartPerfetto needs feedback that can become a code fix, a Skill branch, or a regression test.</p><p>Useful samples look like this:</p><ul><li>A power trace where the report blames CPU, but manual inspection points to wakelock or modem activity. Attach power rails, wakelock, CPU freq &#x2F; idle evidence.</li><li>An ANR trace where the report says the main thread is blocked by futex, but logcat or thread state does not support it. Attach the ANR range, main-thread state table, futex wait table, and logcat snippet.</li><li>An OpenAI-compatible provider passes connection testing but mutates tool arguments during full analysis. Attach runtime, provider, model ID, protocol type, session log, and <code>/health</code>.</li><li>An OpenCode or Pi Agent Core config passes smoke but startup &#x2F; scrolling E2E quality is unstable. Attach model config, command, Result ID, and HTML report.</li><li>Smart scene detection picks the wrong range. Attach the trace range, scene inventory output, expected scene type, and manual evidence.</li><li>CLI capture or analyze fails on a remote machine. Attach Node version, platform, <code>smp doctor --format json</code>, CLI turn files, and trace processor error.</li></ul><p>A screenshot plus “the result is wrong” is hard to act on. The maintainer needs to know whether the problem is trace capture, SQL, Skill logic, scene strategy, Provider protocol, runtime session, frontend display, or report rules.</p><h2 id="Closing"><a href="#Closing" class="headerlink" title="Closing"></a>Closing</h2><p>Between May 17 and June 4, SmartPerfetto moved from answering trace questions inside Perfetto UI toward delivering trace-analysis results through multiple entries, multiple runtimes, and shared evidence rules.</p><p>It is still moving quickly. Provider presets, runtime config, public APIs, report rules, and the Skill system will continue to change. For ordinary users, the best next step is to run Docker or a portable package on a real trace. For contributors, the most useful inputs are reproducible traces, wrong-attribution reports with evidence pointers, SQL that can improve a Skill or strategy, and regression samples.</p><p>The May 17 article no longer describes the current repository state. If you try SmartPerfetto again now, start with Smart Mode, selected-range quick analysis, CLI, and the four runtime options.</p>]]></content>
    
    
    <summary type="html">&lt;p&gt;&lt;img src=&quot;/en/images/SmartPerfetto-Three-Week-Update/smartperfetto-three-week-cover.png&quot; alt=&quot;SmartPerfetto 2026-05-17 to 2026-06-04 update cover&quot;&gt;&lt;/p&gt;
&lt;p&gt;The previous SmartPerfetto update was published on May 17. At that point the project had already moved from “an AI Assistant inside Perfetto UI” to “a reusable trace analysis platform.” By June 4, the new work is concentrated in five areas: Smart Mode, selected-range quick analysis, CLI capture, stronger evidence rules for Power &amp;#x2F; ANR &amp;#x2F; Input &amp;#x2F; IO &amp;#x2F; Network, and four Agent runtimes.&lt;/p&gt;
&lt;p&gt;This article is based on the SmartPerfetto main branch on June 4, 2026. The latest public release at this point is &lt;code&gt;v1.0.28&lt;/code&gt;. The goal is simple: list what changed after May 17, explain how runtimes and evidence sources are handled, and show what information makes a useful bug report.&lt;/p&gt;
&lt;p&gt;Project links:&lt;/p&gt;
&lt;ul&gt;
&lt;li&gt;SmartPerfetto main repository: &lt;a href=&quot;https://github.com/Gracker/SmartPerfetto&quot;&gt;https://github.com/Gracker/SmartPerfetto&lt;/a&gt;&lt;/li&gt;
&lt;li&gt;Previous update: &lt;a href=&quot;https://www.androidperformance.com/en/2026/05/17/SmartPerfetto-Two-Week-Update/&quot;&gt;https://www.androidperformance.com/en/2026/05/17/SmartPerfetto-Two-Week-Update/&lt;/a&gt;&lt;/li&gt;
&lt;/ul&gt;</summary>


    <category term="Android" scheme="https://androidperformance.com/en/categories/Android/"/>
    
    
    <category term="Android" scheme="https://androidperformance.com/en/tags/Android/"/>
    
    <category term="Perfetto" scheme="https://androidperformance.com/en/tags/Perfetto/"/>
    
    <category term="Performance" scheme="https://androidperformance.com/en/tags/Performance/"/>
    
    <category term="AI Agent" scheme="https://androidperformance.com/en/tags/AI-Agent/"/>
    
    <category term="SmartPerfetto" scheme="https://androidperformance.com/en/tags/SmartPerfetto/"/>
    
    <category term="MCP" scheme="https://androidperformance.com/en/tags/MCP/"/>
    
    <category term="Open Source" scheme="https://androidperformance.com/en/tags/Open-Source/"/>
    
  </entry>
  
  <entry>
    <title>SmartPerfetto 2026-04-29 to 2026-05-17 Two-Week Update: From Perfetto AI Assistant to a Reusable Trace Analysis Platform</title>
    <link href="https://androidperformance.com/en/2026/05/17/SmartPerfetto-Two-Week-Update/"/>
    <id>https://androidperformance.com/en/2026/05/17/SmartPerfetto-Two-Week-Update/</id>
    <published>2026-05-17T04:00:00.000Z</published>
    <updated>2026-07-18T01:56:58.938Z</updated>
    
    <content type="html"><![CDATA[<p><img src="/en/images/SmartPerfetto-Two-Week-Update/smartperfetto-update-cover.png" alt="SmartPerfetto Update Cover"></p><p>When I wrote the SmartPerfetto open-source introduction on April 29, the headline was still “put an AI Assistant that can run SQL, invoke Skills, and generate reports inside the Perfetto UI.” Two weeks later the repository has moved a long way. The feature surface expanded from single-trace Q&amp;A to reusable analysis results, multi-trace comparison, dual Claude&#x2F;OpenAI runtimes, SQL guardrails, evidence-source indexing, no-install packages, rendering-pipeline teaching, and a more complete Provider diagnostic flow.</p><p>This article is based on the SmartPerfetto repository state as of May 17, 2026, and adds a new feature description on top of the previous post. Readers should walk away knowing three things: what was added in the past two weeks, where the current full feature boundary sits, and what information a good bug report should include.</p><p>Project links:</p><ul><li>SmartPerfetto main repository: <a href="https://github.com/Gracker/SmartPerfetto">https://github.com/Gracker/SmartPerfetto</a></li><li>Previous open-source introduction: <a href="https://www.androidperformance.com/en/2026/04/29/SmartPerfetto-Open-Source-Perfetto-AI-Assistant/">https://www.androidperformance.com/en/2026/04/29/SmartPerfetto-Open-Source-Perfetto-AI-Assistant/</a></li></ul><span id="more"></span><h2 id="What-Changed-Most-in-Two-Weeks"><a href="#What-Changed-Most-in-Two-Weeks" class="headerlink" title="What Changed Most in Two Weeks"></a>What Changed Most in Two Weeks</h2><p>Several numbers from the previous article are already outdated. Back then the repository had 165 YAML Skills and 12 scene strategies. In the current repository state, <code>backend/skills/</code> has 220 <code>*.skill.yaml</code> files, and after excluding <code>_template</code> that comes to 216 functional Skill files. <code>backend/strategies/</code> has 18 <code>.strategy.md</code> files and 26 <code>.template.md</code> files.</p><p>This is not a matter of piling files on top of files. The changes land in six areas that users will actually feel:</p><table><thead><tr><th>Direction</th><th>Previous main path</th><th>Current state</th></tr></thead><tbody><tr><td>Trace analysis</td><td>Ask questions, run Skills, view reports on a single trace</td><td>The original path is preserved, plus selection-based follow-up questions, result snapshots, and cross-window result comparison</td></tr><tr><td>Multi-trace comparison</td><td>Pick a reference trace in the current window, mostly real-time</td><td>New analysis result snapshots that compare completed results without requiring another window to stay open</td></tr><tr><td>Model integration</td><td>Claude Agent SDK was the main path</td><td>Claude Agent SDK and OpenAI Agents SDK are both first-class runtimes</td></tr><tr><td>Provider configuration</td><td>Mainly through <code>.env</code> and README notes</td><td>UI Provider Manager, active profile, env fallback, and <code>/health</code> diagnostics work together</td></tr><tr><td>Evidence reliability</td><td>Mostly relied on prompts to constrain how the model wrote SQL and cited evidence</td><td>SQL stdlib guardrail, final executable SQL, evidence IDs, data-source notes, and sentence-level data citations enter the contract</td></tr><tr><td>Runtime and distribution</td><td>Docker and local source were the focus</td><td>Docker, Windows&#x2F;macOS&#x2F;Linux no-install packages, local source, and CLI&#x2F;API are all part of the docs and release flow</td></tr></tbody></table><p>The past two weeks also fixed a batch of usability edge cases. The large-trace upload limit moved up to 5 GiB with admission and disk pre-checks; the startup script now cleans orphan <code>trace_processor_shell</code> processes and opens the browser automatically; Linux glibc issues, IPv6-disabled hosts, Claude SDK native binary selection, Docker env provider priority, OpenAI&#x2F;MiMo tool calling compatibility, and Perfetto frontend prebuilt asset verification all received fixes.</p><p>These fixes do not look like new features, but they decide whether a real user can finish analyzing the first real trace.</p><h2 id="Current-Full-Feature-Map"><a href="#Current-Full-Feature-Map" class="headerlink" title="Current Full Feature Map"></a>Current Full Feature Map</h2><p><img src="/en/images/SmartPerfetto-Two-Week-Update/feature-map.png" alt="SmartPerfetto Feature Map"></p><p>SmartPerfetto now reads as five layers: entry, analysis, evidence, output, and runtime.</p><table><thead><tr><th>Capability</th><th>Current behavior</th><th>Fitting scenarios</th></tr></thead><tbody><tr><td>AI Assistant inside Perfetto UI</td><td>Load <code>.pftrace</code> &#x2F; <code>.perfetto-trace</code> and ask questions directly; supports <code>fast</code>, <code>full</code>, and <code>auto</code> analysis modes</td><td>Daily trace inspection, quickly asking about package, process, startup, scrolling, ANR</td></tr><tr><td>Selection and event context</td><td>Perfetto area selection &#x2F; track event selection are passed to the backend as <code>selectionContext</code></td><td>Analyzing just a time window, a single frame, or what happened around a suspicious slice</td></tr><tr><td>Common scene strategies</td><td>18 strategies covering startup, scrolling, ANR, interaction, touch, memory, power, network, media, game, pipeline, teaching, overview, and more</td><td>Routing natural-language questions to the right SQL, Skill, and output format</td></tr><tr><td>YAML Skill system</td><td>216 functional Skill files covering atomic, composite, deep, pipeline, comparison, module, and other types</td><td>Encoding Perfetto SQL, display columns, layered results, and boundary handling as reusable analysis units</td></tr><tr><td>SQL and Skill evidence</td><td>Results retain SQL, Skill tables, timestamps, threads, slices, and metric sources</td><td>Mapping the “model’s judgment” back to trace data for review</td></tr><tr><td>SQL guardrail and stdlib knowledge base</td><td>Raw SQL gets stdlib includes auto-completed; Skill validator checks table&#x2F;function&#x2F;macro dependencies; SQL display and copy use the final executable SQL</td><td>Reducing misjudgment caused by Perfetto stdlib migrations, missing includes, or unsafe creates</td></tr><tr><td>Global Trace Sanity</td><td><code>global_trace_sanity_check</code> summarizes the longest slice, D-state, Runnable wait, Runqueue pressure, and CPU hot processes</td><td>Looking at the global bottleneck before scene analysis so you do not fixate on one thread or one Skill</td></tr><tr><td>Evidence-source indexing</td><td>DataEnvelope carries <code>evidenceRefId</code>, <code>traceSide</code>, <code>sourceToolCallId</code>, plan phase, and producer reason; reports support sentence-level data citations</td><td>When asking “where does this number come from in which table and which row,” there is a stable ID and row&#x2F;column info</td></tr><tr><td>HTML analysis report</td><td>A report is generated after every analysis; the generic endpoint <code>/api/reports/:reportId</code> returns it</td><td>Sharing with the team, pasting into issues, keeping as a regression record</td></tr><tr><td>Live trace comparison</td><td>The <code>compare_arrows</code> entry picks a reference trace and queries current&#x2F;reference inside the same AI analysis round</td><td>When both raw traces are accessible and you want to temporarily compare the current window with a reference</td></tr><tr><td>Multi-trace analysis-result comparison</td><td>The <code>fact_check</code> entry picks baseline&#x2F;candidates, or you type a Result ID directly</td><td>Comparing completed analysis results across runs; useful for A&#x2F;B testing, version regression, multi-person collaboration</td></tr><tr><td>Provider Manager</td><td>Create, edit, and activate provider profiles in the UI; the active profile takes precedence over env fallback</td><td>Multi-model, multi-provider, multi-protocol testing without repeatedly editing <code>.env</code></td></tr><tr><td>Dual SDK runtime</td><td><code>claude-agent-sdk</code> and <code>openai-agents-sdk</code> are wired in separately and support Anthropic&#x2F;Claude-compatible, OpenAI&#x2F;Ollama&#x2F;OpenAI-compatible</td><td>Choosing the runtime that matches the provider’s real protocol capability</td></tr><tr><td>Rendering pipeline teaching</td><td>Teaching results are generated from App, RenderThread, Producer, SurfaceFlinger&#x2F;HWC events observed in the current trace</td><td>Learning the Android rendering path while mapping static knowledge back to the actual trace</td></tr><tr><td>Productized upstream Perfetto diagnostics</td><td>heap graph, bitmap heap metadata, critical blocking calls, lock contention owner, Chrome scroll jank frame timeline land in YAML Skills</td><td>Turning upstream Perfetto analysis experience into executable SmartPerfetto evidence</td></tr><tr><td>Mermaid display</td><td>The AI Assistant expands Mermaid source blocks by default, refines rendering style, and supports click-to-zoom preview</td><td>Flowcharts, causal diagrams, and comparison diagrams in reports read better</td></tr><tr><td>API &#x2F; CLI &#x2F; MCP</td><td>Backend REST + SSE, the <code>@gracker/smartperfetto</code> CLI, MCP tool documentation</td><td>Hooking into scripts, CI, internal platforms, or analyzing traces directly in the terminal</td></tr><tr><td>Runtime and distribution</td><td>Docker Hub, local source <code>./start.sh</code>, Windows EXE, macOS App, Linux tarball</td><td>Each user picks the least-dependency path for their environment</td></tr><tr><td>Enterprise &#x2F; multi-tenant foundation</td><td>tenant&#x2F;workspace, RBAC, provider isolation, scoped trace&#x2F;report metadata, runtime dashboard, lease supervisor have landed on mainline</td><td>Foundation for team deployment and commercial support; large-scale external RSS&#x2F;load validation is still tagged as future work in docs</td></tr></tbody></table><p>The most important thing to underline here is the evidence boundary. SmartPerfetto does not push the entire trace file into the prompt. The model only sees SQL results returned by backend tools, Skill output, report summaries, and structured context. Performance numbers still come from <code>trace_processor_shell</code> and deterministic computation inside Skills.</p><h2 id="New-Feature-One-Multi-Trace-Analysis-Result-Comparison"><a href="#New-Feature-One-Multi-Trace-Analysis-Result-Comparison" class="headerlink" title="New Feature One: Multi-Trace Analysis Result Comparison"></a>New Feature One: Multi-Trace Analysis Result Comparison</h2><p><img src="/en/images/SmartPerfetto-Two-Week-Update/multi-trace-comparison.png" alt="Multi-Trace Analysis Result Comparison"></p><p>The older trace comparison is closer to “current window + reference trace” real-time analysis. That mode is still preserved and works well when you want the AI to query two raw traces in the same conversation.</p><p>The new multi-trace analysis-result comparison swaps the comparison subject. It compares completed analysis results. After every AI analysis finishes, SmartPerfetto saves key metrics, evidence references, the conclusion contract, and the report entry into an analysis result snapshot. When the UI shows <code>Ready result</code> or <code>Partial result</code> at the top, it means this analysis now has a reusable result.</p><p>There are two entry points:</p><ul><li>Type something like <code>compare with another one</code>, <code>compare AR-1234abcd</code>, or <code>compare AR-11111111 and AR-22222222</code> into the AI input box.</li><li>Click the <code>fact_check</code> icon at the top to open the result picker and manually choose the baseline and one or more candidates.</li></ul><p>The problem this solves is not opening two traces at the same time; it is reusing completed analysis results. It does not require another Perfetto UI window to stay open, and it supports sharing within a workspace. Results are private by default; once a user explicitly shares one, users in the same workspace can include it as a candidate result for comparison.</p><p>Output happens in two layers:</p><ul><li>The chat message gives the Comparison ID, baseline&#x2F;candidates, the number of significant changes, and the first few rows of key metrics.</li><li>The HTML comparison report expands the standard metrics, the delta, the input snapshots, the significant changes, and the AI conclusion.</li></ul><p>The currently standardized metrics focus on comparable items such as startup duration, FPS, Jank, and slow frames. When metrics are missing, the backend tries to backfill them. If the backfill fails, the comparison still completes but the missing reason is shown.</p><p>This is useful for performance regression work. A startup optimization, a scrolling feel adjustment, or a cross-device re-test can each finish AI analysis on its own trace and then sit inside the same comparison report so the differences are visible.</p><h2 id="New-Feature-Two-SQL-Evidence-Sources-and-Upstream-Diagnostic-Capabilities"><a href="#New-Feature-Two-SQL-Evidence-Sources-and-Upstream-Diagnostic-Capabilities" class="headerlink" title="New Feature Two: SQL, Evidence Sources, and Upstream Diagnostic Capabilities"></a>New Feature Two: SQL, Evidence Sources, and Upstream Diagnostic Capabilities</h2><p>The part of the recent work that deserves the most explanation is how SmartPerfetto handles evidence sources. What the user sees is still conversation, tables, and reports. Internally there are three new layers of contract: how SQL becomes the final executable version, which tool call produced each table&#x2F;summary, and which exact evidence row a number in the conclusion came from.</p><p>The first layer is the SQL guardrail. <code>execute_sql</code>, <code>execute_sql_on</code>, raw SQL auto include, and the Skill validator now share the same stdlib dependency analyzer that identifies tables, functions, macros, and <code>INCLUDE PERFETTO MODULE</code> directives inside SQL. This brings several direct benefits:</p><ul><li>When raw SQL references a Perfetto stdlib table or function, the backend does its best to auto-complete the required module.</li><li>The Skill validator checks whether the <code>prerequisites.modules</code> declared in a Skill cover the stdlib tables&#x2F;functions&#x2F;macros actually used by the SQL.</li><li>The guardrail checks low-noise SQL risks such as repeatable <code>CREATE</code>, safe <code>SPAN_JOIN</code> usage, and direct parsing of the <code>args</code> table.</li><li>When the AI Assistant displays and copies SQL, it uses the final executable SQL, run through the syntaqlite formatter. If the formatter fails, it falls back to the original SQL without blocking the analysis.</li></ul><p>The boundary should be spelled out: the current guardrail is an engineering contract, not a full Perfetto SQL AST parser. It reduces frequent misjudgment but does not prove that every future Perfetto SQL syntax is statically covered.</p><p>The second layer is the stdlib docs and lineage knowledge base. The repository adds <code>backend/data/perfettoSqlDocs.json</code>, generated from upstream <code>stdlib_docs.json</code>, with module, entity, direct&#x2F;transitive includes, and optional <code>pfsql lineage</code> status. <code>lookup_sql_schema</code>, <code>list_stdlib_modules</code>, and <code>query_perfetto_source</code> can return the official stdlib documentation, include relationships, and source-code search results to the Agent together. The model no longer needs to rely only on memory when writing SQL, and we do not need to hard-code every stdlib detail into the prompt.</p><p>The third layer is the data-source index. DataEnvelopes produced by SQL and Skills can carry <code>evidenceRefId</code>, <code>traceSide</code>, <code>traceId</code>, <code>queryHash</code>, <code>sourceToolCallId</code>, <code>paramsHash</code>, plan phase, <code>toolNarration</code>, and <code>producerReason</code>. The HTML report and the analysis result snapshot preserve these fields. The current report contract also adds “sentence-level data citations (structured sources)”: when key numbers, thread names, process names, frame counts, or percentages appear in the conclusion, they can be mapped to <code>evidence_ref_id</code>, <code>source_ref</code>, <code>row_index</code> &#x2F; <code>row_selector</code>, <code>column</code>, and <code>value</code>.</p><p>Quick answers also use the same format. Internally we first derive the conclusion contract from the raw conclusion text, keep machine-readable evidence IDs, and then produce a cleaned-up version for the user. The analysis result snapshot persists this contract so that, when used later for multi-trace comparison or report review, the source references are not lost just because the frontend cleaned up the display.</p><p>This matters for debugging. Users do not have to just say “the AI conclusion is wrong”; they can point to <code>Q1</code>, a specific <code>evidenceRefId</code>, a specific Result ID, or a specific column of a specific table. Maintainers can then judge whether the problem lives in SQL, the Skill, the trace data source, the model summary, or report rendering.</p><p>This round also productized a batch of upstream Perfetto diagnostic experience into YAML Skills:</p><table><thead><tr><th>Capability</th><th>SmartPerfetto landing point</th><th>User value</th></tr></thead><tbody><tr><td>Global Trace Sanity</td><td><code>global_trace_sanity_check</code></td><td>Look at the longest slice, D-state, Runnable wait, Runqueue pressure, and CPU hot processes before scene analysis</td></tr><tr><td>Process identity check</td><td><code>process_identity_resolver</code> and the process identity gate</td><td>Avoid Skills targeting the wrong object due to same-named processes, multi-process apps, or provider processes</td></tr><tr><td>Heap &#x2F; Bitmap</td><td><code>android_heap_graph_summary</code>, <code>android_bitmap_memory_per_process</code></td><td>When heap graph &#x2F; bitmap tables exist, emit per-object and per-bitmap dimensions; degrade clearly when no data is available</td></tr><tr><td>Blocking calls</td><td><code>frame_blocking_calls</code></td><td>Differentiates MainThread, RenderThread, Binder, and other thread roles while preserving the blocking source</td></tr><tr><td>Lock contention</td><td><code>lock_contention_in_range</code>, <code>lock_contention_analysis</code></td><td>Outputs blocked thread, owner thread, owner TID, call site, and overlap duration</td></tr><tr><td>Chrome Scroll Jank</td><td><code>chrome_scroll_jank_frame_timeline</code></td><td>Covers Chrome v3&#x2F;v4 scroll jank, tagging, and preferred frame timeline availability</td></tr></tbody></table><p>These capabilities do not change SmartPerfetto’s core principle: the model explains and prioritizes, but the numbers still come from <code>trace_processor_shell</code>, SQL, Skills, and traceable data sources in reports.</p><h2 id="New-Feature-Three-Provider-Manager-and-Dual-Runtimes"><a href="#New-Feature-Three-Provider-Manager-and-Dual-Runtimes" class="headerlink" title="New Feature Three: Provider Manager and Dual Runtimes"></a>New Feature Three: Provider Manager and Dual Runtimes</h2><p><img src="/en/images/SmartPerfetto-Two-Week-Update/provider-runtime.png" alt="Provider and Runtime Configuration"></p><p>Model configuration in SmartPerfetto now has three boundaries:</p><ul><li><code>Connection</code> configures the SmartPerfetto backend address and an optional <code>SMARTPERFETTO_API_KEY</code>. It is not a model-vendor key.</li><li><code>Providers</code> configures model provider profiles, including Base URL, API key&#x2F;token, model ID, and protocol type.</li><li>The runtime decides which SDK the backend uses to orchestrate tool calls: <code>claude-agent-sdk</code> or <code>openai-agents-sdk</code>.</li></ul><p>Runtime selection priority is:</p><table><thead><tr><th>Priority</th><th>Source</th></tr></thead><tbody><tr><td>1</td><td><code>providerId</code> in the request or session</td></tr><tr><td>2</td><td>Provider Manager’s currently active provider</td></tr><tr><td>3</td><td><code>SMARTPERFETTO_AGENT_RUNTIME</code> in <code>.env</code></td></tr><tr><td>4</td><td>Default <code>claude-agent-sdk</code></td></tr></tbody></table><p>Claude Agent SDK fits Anthropic, Claude Code local auth, Bedrock, Vertex, and Anthropic&#x2F;Claude-compatible providers. OpenAI Agents SDK fits the OpenAI Responses API, Ollama, and OpenAI-compatible gateways that support streaming tool&#x2F;function calling.</p><p>Provider Manager profiles take precedence over <code>.env</code> fallback. An analysis session that has already been created pins the credential source at that moment. When that session is restored, it does not switch to a different model just because the active provider was changed afterwards. This constraint is important because multi-turn follow-up questions in trace analysis depend on the previous turn’s tool results and SDK session state.</p><p>When debugging, do not just look at <code>.env</code>. Open <code>http://localhost:3000/health</code> and inspect <code>aiEngine.runtime</code>, <code>aiEngine.credentialSource</code>, <code>aiEngine.providerMode</code>, and the diagnostics. Many provider presets come from public documentation and may change with account region, plan, or console domain. When connection fails, streaming output behaves oddly, or tool calls are unstable, check the Base URL, model ID, and protocol type in the provider’s own console first.</p><h2 id="New-Feature-Four-Rendering-Pipeline-Teaching-Moves-From-Static-Docs-to-the-Current-Trace"><a href="#New-Feature-Four-Rendering-Pipeline-Teaching-Moves-From-Static-Docs-to-the-Current-Trace" class="headerlink" title="New Feature Four: Rendering Pipeline Teaching Moves From Static Docs to the Current Trace"></a>New Feature Four: Rendering Pipeline Teaching Moves From Static Docs to the Current Trace</h2><p>The “rendering teaching” surface has been refactored over the past two weeks. The previous version was closer to “detect one main pipeline and show the matching Mermaid, the key slices, and the teaching doc.” The new goal is different: show what really happened between App, Framework, RenderThread, Producer, BufferQueue&#x2F;Transaction, SurfaceFlinger&#x2F;HWC, and present, based on the events actually observed in the current trace.</p><p>The new backend service builds an <code>observedFlow</code>:</p><ul><li><code>lanes</code> represent the roles observable in the current trace, such as app, render_thread, producer, buffer_queue, surfaceflinger, hwc_present.</li><li><code>events</code> represent real slice&#x2F;thread&#x2F;process&#x2F;layer events with <code>ts</code>, <code>dur</code>, <code>durMs</code>, evidence source, and optional frame&#x2F;layer association.</li><li><code>dependencies</code> represent confirmable dependencies, such as wakeups or critical path.</li><li><code>completeness</code> flags which signals are missing so static knowledge is not disguised as facts about this trace.</li></ul><p>This is especially important for hybrid rendering. Producers such as WebView, Flutter, React Native, TextureView, SurfaceView, OpenGL ES, Vulkan, Camera, Video, and game engines cannot be flattened into a single “main pipeline.” SmartPerfetto now presents host HWUI and the producer separately, then explains whether there is a dependency between them based on evidence.</p><p>The value of the teaching feature is not memorizing the Android rendering pipeline for the user. It is mapping the knowledge back to the actual events in this trace. After reading, the user should know which paths have evidence in this trace and which paths cannot be confirmed because of capture gaps.</p><h2 id="Usability-Fixes-in-the-Past-Two-Weeks"><a href="#Usability-Fixes-in-the-Past-Two-Weeks" class="headerlink" title="Usability Fixes in the Past Two Weeks"></a>Usability Fixes in the Past Two Weeks</h2><p>Beyond new features, the recent fixes mostly focus on “letting real users actually run the tool.”</p><table><thead><tr><th>Fix direction</th><th>User-visible effect</th></tr></thead><tbody><tr><td>5 GiB trace upload</td><td>Larger traces can go through the upload path; the backend performs admission and disk pre-checks first, avoiding failures only at the end of a long upload</td></tr><tr><td>Startup script cleans orphan processes</td><td>A leftover <code>trace_processor_shell</code> from the previous abnormal exit no longer easily holds the port</td></tr><tr><td>Local startup auto-opens browser</td><td>After <code>./start.sh</code> runs, the experience matches a normal daily tool</td></tr><tr><td>Linux glibc &#x2F; IPv6-disabled host</td><td>Ubuntu 20.04 and IPv6-disabled environments start more reliably</td></tr><tr><td>Claude SDK native binary fallback</td><td>When the optional native package picks the wrong platform, the backend can fall back automatically</td></tr><tr><td>OpenAI&#x2F;MiMo compatibility</td><td>Fixes for reasoning content, tool arguments, plan phases, <code>startup_slow_reasons</code>, and related compatibility issues</td></tr><tr><td>quick&#x2F;full session isolation</td><td>When switching between fast&#x2F;full&#x2F;auto, lightweight context and full context no longer mix</td></tr><tr><td>Stale SDK conversation recovery</td><td>When Claude&#x2F;OpenAI session handles expire, the backend recovers or degrades instead of dropping the second turn</td></tr><tr><td>Process identity gate</td><td>The Skill checks the target process identity before execution, avoiding SQL hitting the wrong target due to package names, process names, or multi-process scenarios</td></tr><tr><td>SQL stdlib guardrail</td><td>Missing stdlib includes, unsafe creates, and SPAN_JOIN or args parsing issues surface in the validator or guardrail stage</td></tr><tr><td>Cross-window result comparison</td><td>Result selection, heartbeat, and Result ID usage are more stable across multiple windows</td></tr><tr><td>Backend trace_processor isolation</td><td>Local traces and backend-created trace processor targets are handled separately, reducing the chance that the second trace uses the wrong target</td></tr><tr><td>Frontend prebuild asset guard</td><td><code>syntaqlite-*</code>, <code>trace_processor.wasm</code>, <code>trace_processor_memory64.wasm</code>, and manifest hashes enter verification, reducing the risk of missing assets in no-install packages and Docker</td></tr><tr><td>Mermaid experience</td><td>Source is expanded by default, the style is clearer, and diagrams support click-to-zoom</td></tr></tbody></table><p>Many of these issues come from real GitHub issues and local reproduction. SmartPerfetto’s difficulty is not only “can the model analyze,” but also whether the state across model, Perfetto UI, backend SSE, <code>trace_processor_shell</code>, browser windows, and provider protocols stays consistent. Any state drift eventually shows up as “the AI result is unreliable.”</p><h2 id="How-to-Choose-a-Runtime-Today"><a href="#How-to-Choose-a-Runtime-Today" class="headerlink" title="How to Choose a Runtime Today"></a>How to Choose a Runtime Today</h2><p>For typical users, Docker or the no-install package is the first choice.</p><table><thead><tr><th>Runtime</th><th>Who it fits</th><th>Notes</th></tr></thead><tbody><tr><td>Docker Hub</td><td>Anyone who wants to try or deploy quickly</td><td>No Node.js, no submodule init; needs model credentials in <code>.env</code> or the UI Provider Manager</td></tr><tr><td>No-install package</td><td>Users who do not want to install Docker</td><td>Windows: unzip and double-click <code>SmartPerfetto.exe</code>; macOS: double-click <code>SmartPerfetto.app</code>; Linux: run <code>./SmartPerfetto</code></td></tr><tr><td>Local source <code>./start.sh</code></td><td>Developers who want to follow mainline</td><td>Uses the prebuilt frontend committed to the repository; daily backend&#x2F;Skill&#x2F;strategy changes do not require rebuilding Perfetto UI</td></tr><tr><td>Dev mode <code>./scripts/start-dev.sh</code></td><td>People modifying the AI Assistant plugin UI</td><td>Needs the <code>perfetto/</code> submodule initialized; saves of frontend code trigger watch rebuilds</td></tr><tr><td>CLI <code>smp</code></td><td>People who want to analyze traces in a terminal or script</td><td>Reuses agentv3, Skills, report generation, and local session storage</td></tr></tbody></table><p>Local source requires Node.js 24 LTS. The repository ships <code>.nvmrc</code> and <code>.node-version</code>, npm has <code>engine-strict=true</code>, and <code>./start.sh</code>, <code>./scripts/start-dev.sh</code>, and <code>./scripts/restart-backend.sh</code> prefer switching to Node 24 through nvm&#x2F;fnm.</p><p>The macOS no-install package currently uses ad-hoc signing to avoid being flagged as damaged by the system directly. Proper notarization still requires a Developer ID and a notary profile. This status should be spelled out in release notes so users do not treat Gatekeeper behavior as a backend problem.</p><h2 id="Sponsorship-and-Commercial-Support"><a href="#Sponsorship-and-Commercial-Support" class="headerlink" title="Sponsorship and Commercial Support"></a>Sponsorship and Commercial Support</h2><p>SmartPerfetto’s open-source maintenance cost mainly comes from four areas: real-trace reproduction, model tokens, provider compatibility validation, and cross-platform release-package validation. The project accepts individual sponsorship, corporate sponsorship, AI Credits &#x2F; token vendor sponsorship, and also commercial licensing and enterprise support consultations built around AGPL.</p><p>Individual sponsorship is suited to supporting open-source maintenance, test traces, documentation examples, and the model consumption for public demos. Individual sponsors can enter the README thank-you list; if a sponsor prefers anonymity, the project will simply record it as anonymous support.</p><p>Regular corporate sponsorship is suited to supporting long-term maintenance, issue reproduction, public documentation, and regression testing. Corporate sponsors can also enter the README thank-you list and have their company name and link displayed on the sponsor page. Deeper enterprise collaboration can be handled through commercial support, for example Android performance trace expert diagnostics, Perfetto &#x2F; SmartPerfetto team training, enterprise on-prem deployment, custom YAML Skill &#x2F; Strategy work, and commercial licensing or integration consulting.</p><p>LLM &#x2F; API &#x2F; token vendor sponsorship fits better with credits, token plans, trial accounts, or developer quotas that support SmartPerfetto. A tool like SmartPerfetto needs more than chat: it needs stable streaming output, tool&#x2F;function calling, long-context recovery, structured arguments, and real trace analysis. Vendor sponsorship can be exchanged for three more direct forms of project support:</p><table><thead><tr><th>Sponsor type</th><th>Project-side support</th></tr></thead><tbody><tr><td>Individual sponsorship</td><td>README thank-you list; supports open-source maintenance and public-example costs</td></tr><tr><td>Regular corporate sponsorship</td><td>README thank-you list; sponsor page placement; entry point for enterprise support &#x2F; training &#x2F; diagnostics</td></tr><tr><td>LLM &#x2F; token vendor sponsorship</td><td>Top-position sponsor placement in the README; Provider configuration notes; candidacy in the recommended models list; first-priority adaptation and regression validation</td></tr></tbody></table><p>The “recommended models” piece must be grounded in real validation. Sponsorship does not change SmartPerfetto’s default provider selection, compatibility conclusions, or technical judgments. If a model is unstable in real trace analysis, tool calling, or long-running reasoning, the documentation will say so honestly. Conversely, if a vendor provides sustainable credits and the model runs stably across real SmartPerfetto analysis tasks, it earns a more prominent README position, a place in the provider configuration guide, and recommendation in the model notes.</p><p>Contact still goes through the current sponsor page and the WeChat ID <code>553000664</code> in the README. Security issues, commercial licensing, and enterprise on-prem deployment requests should be discussed separately, not mixed into public bug issues.</p><h2 id="How-to-Write-a-Good-Bug-Report"><a href="#How-to-Write-a-Good-Bug-Report" class="headerlink" title="How to Write a Good Bug Report"></a>How to Write a Good Bug Report</h2><p><img src="/en/images/SmartPerfetto-Two-Week-Update/bug-feedback.png" alt="SmartPerfetto Bug Feedback Checklist"></p><p>SmartPerfetto bug reports live in GitHub Issues. Security issues should not be filed as public issues; use GitHub private advisory or a security email instead.</p><p>A normal bug report should at minimum include the six fields the current template asks for: Description, Component, Steps to Reproduce, Trace Information, Logs &#x2F; Screenshots, and Environment. For SmartPerfetto specifically, you should also fill in version, platform, and LLM configuration. Many issues are jointly affected by the provider protocol, the model’s tool calling, trace capture quality, and runtime session state, and cannot be handled as pure frontend or backend bugs.</p><p>A locatable report typically contains these fields:</p><table><thead><tr><th>Category</th><th>What to write</th></tr></thead><tbody><tr><td>SmartPerfetto version</td><td>Version number, commit, Docker image tag, or no-install package filename — at least one of these</td></tr><tr><td>Runtime</td><td>Docker Hub, source <code>./start.sh</code>, dev mode, Windows&#x2F;macOS&#x2F;Linux no-install package, or CLI</td></tr><tr><td>Platform</td><td>OS version, browser, Node.js version; for the Docker path, also Docker Desktop&#x2F;Engine and WSL2 status</td></tr><tr><td>Component</td><td>AI Analysis, Skills, Frontend UI Panel, Trace Processor, Backend API, Provider Manager, CLI, etc.</td></tr><tr><td>Reproduction steps</td><td>The minimal sequence of load-trace, click, input, and switch steps, with actual vs expected result</td></tr><tr><td>Trace information</td><td>Device, Android version, business scenario, trace category, whether FrameTimeline is included, trace size</td></tr><tr><td>LLM &#x2F; Provider</td><td>Whether the runtime is <code>claude-agent-sdk</code> or <code>openai-agents-sdk</code>; provider name, model ID, Base URL, protocol type, and whether configuration comes from Provider Manager or <code>.env</code></td></tr><tr><td>Analysis options</td><td><code>fast</code>, <code>full</code>, or <code>auto</code>, and whether the mode was switched during multi-turn questions</td></tr><tr><td>Evidence pointers</td><td>Result ID, HTML report, <code>evidenceRefId</code>, <code>sourceToolCallId</code>, <code>Q1/C1</code> from sentence-level data citations, related SQL or Skill tables</td></tr><tr><td>Evidence material</td><td>Backend logs, <code>backend/logs/sessions/</code>, screenshots, HTML report, Result ID, the <code>aiEngine</code> slice of <code>/health</code></td></tr><tr><td>Privacy boundary</td><td>Traces may contain business and user data. Do not upload sensitive traces directly into a public issue; share desensitized info first and arrange private samples only when necessary</td></tr></tbody></table><p>For provider-related issues, separate “the model can chat” from “the model can do stable tool calls.” SmartPerfetto depends on streaming output, tool&#x2F;function calling, context recovery, and structured arguments. A provider being fine in plain chat does not mean it can finish a full trace analysis.</p><p>For trace-related issues, document the capture conditions. Android 12+ traces that include FrameTimeline are a better fit for SmartPerfetto. Scrolling, startup, ANR, and GPU&#x2F;rendering each need different categories. When the corresponding data source is missing, the correct behavior is to flag the missing signal, not to fabricate a definite conclusion.</p><p>When an analysis conclusion does not match expectations, prefer pasting the evidence location from the report. For example, if a conclusion claims “main thread Runnable wait 120ms,” paste the matching <code>Q1/C1</code>, <code>evidenceRefId</code>, table row, column name, and value. That kind of feedback can turn directly into a SQL fix, a Skill branch, or a report contract fix.</p><h2 id="What-Kind-of-Feedback-Helps-Most-Right-Now"><a href="#What-Kind-of-Feedback-Helps-Most-Right-Now" class="headerlink" title="What Kind of Feedback Helps Most Right Now"></a>What Kind of Feedback Helps Most Right Now</h2><p>What SmartPerfetto is short on right now is samples that can reproduce a problem, regress against a fix, and improve a Skill. Vague evaluations are hard to convert into code fixes or Skill improvements.</p><p>More useful feedback usually looks like this:</p><ul><li>“In a particular scrolling trace, SmartPerfetto blames jank on the RenderThread, but a manual review says it is a main-thread Binder wait.” Include the time window, frame ID, related SQL, or screenshots.</li><li>“In a particular report, the sentence-level data citation points to the wrong row or is missing a critical value.” Include <code>Q1/C1</code>, <code>evidenceRefId</code>, the Result ID, the HTML report, and a screenshot of the matching table.</li><li>“A particular provider produces malformed tool-call arguments under <code>openai-agents-sdk</code>.” Include the runtime, provider, model ID, protocol type, and a session log.</li><li>“A particular device&#x2F;vendor trace is missing common tables, causing a Skill to fail.” Include the Android version, the trace category, the failing Skill name, and the error log.</li><li>“A particular Result ID cannot be found in multi-trace comparison.” Include the workspace, the visibility setting, the Result ID, the current window state, and the steps to reproduce.</li></ul><p>A good bug report should turn into one of three things: a code fix, a Skill branch, or a regression test. A screenshot plus “the result is wrong” makes it hard to tell whether the issue lives in the trace, the model, the provider, the frontend state, or a backend tool.</p><h2 id="Closing"><a href="#Closing" class="headerlink" title="Closing"></a>Closing</h2><p>The direction of SmartPerfetto’s changes in the past two weeks is clear: from “add an AI conversation window inside Perfetto” toward “turn trace analysis into a queryable, reusable, shareable, regression-friendly engineering system.”</p><p>The project is still in fast development. Public APIs, internal contracts, provider presets, and the enterprise deployment surface will continue to adjust. For typical users, the most stable path is running one of your own traces with Docker or the no-install package. For contributors, the most useful input is reproducible traces, evidence that explains the failure attribution, and SQL plus regression samples that can fold back into Skills or strategies.</p><p>If you already use Perfetto in Android performance work, SmartPerfetto is worth trying again now. The introduction from two weeks ago is no longer sufficient to describe the current repository state.</p>]]></content>
    
    
    <summary type="html">&lt;p&gt;&lt;img src=&quot;/en/images/SmartPerfetto-Two-Week-Update/smartperfetto-update-cover.png&quot; alt=&quot;SmartPerfetto Update Cover&quot;&gt;&lt;/p&gt;
&lt;p&gt;When I wrote the SmartPerfetto open-source introduction on April 29, the headline was still “put an AI Assistant that can run SQL, invoke Skills, and generate reports inside the Perfetto UI.” Two weeks later the repository has moved a long way. The feature surface expanded from single-trace Q&amp;amp;A to reusable analysis results, multi-trace comparison, dual Claude&amp;#x2F;OpenAI runtimes, SQL guardrails, evidence-source indexing, no-install packages, rendering-pipeline teaching, and a more complete Provider diagnostic flow.&lt;/p&gt;
&lt;p&gt;This article is based on the SmartPerfetto repository state as of May 17, 2026, and adds a new feature description on top of the previous post. Readers should walk away knowing three things: what was added in the past two weeks, where the current full feature boundary sits, and what information a good bug report should include.&lt;/p&gt;
&lt;p&gt;Project links:&lt;/p&gt;
&lt;ul&gt;
&lt;li&gt;SmartPerfetto main repository: &lt;a href=&quot;https://github.com/Gracker/SmartPerfetto&quot;&gt;https://github.com/Gracker/SmartPerfetto&lt;/a&gt;&lt;/li&gt;
&lt;li&gt;Previous open-source introduction: &lt;a href=&quot;https://www.androidperformance.com/en/2026/04/29/SmartPerfetto-Open-Source-Perfetto-AI-Assistant/&quot;&gt;https://www.androidperformance.com/en/2026/04/29/SmartPerfetto-Open-Source-Perfetto-AI-Assistant/&lt;/a&gt;&lt;/li&gt;
&lt;/ul&gt;</summary>


    <category term="Android" scheme="https://androidperformance.com/en/categories/Android/"/>
    
    
    <category term="Android" scheme="https://androidperformance.com/en/tags/Android/"/>
    
    <category term="Perfetto" scheme="https://androidperformance.com/en/tags/Perfetto/"/>
    
    <category term="Performance" scheme="https://androidperformance.com/en/tags/Performance/"/>
    
    <category term="AI Agent" scheme="https://androidperformance.com/en/tags/AI-Agent/"/>
    
    <category term="SmartPerfetto" scheme="https://androidperformance.com/en/tags/SmartPerfetto/"/>
    
    <category term="MCP" scheme="https://androidperformance.com/en/tags/MCP/"/>
    
    <category term="Open Source" scheme="https://androidperformance.com/en/tags/Open-Source/"/>
    
  </entry>
  
  <entry>
    <title>SmartPerfetto Is Open Source: A Perfetto AI Assistant for Android Trace Analysis</title>
    <link href="https://androidperformance.com/en/2026/04/29/SmartPerfetto-Open-Source-Perfetto-AI-Assistant/"/>
    <id>https://androidperformance.com/en/2026/04/29/SmartPerfetto-Open-Source-Perfetto-AI-Assistant/</id>
    <published>2026-04-29T15:05:00.000Z</published>
    <updated>2026-05-10T23:29:51.063Z</updated>
    
    <content type="html"><![CDATA[<p>SmartPerfetto is now fully open source. Open the repository and you can see the runnable mainline project as it exists today: the Perfetto UI fork, the agentv3 backend, MCP tools, YAML Skills, scene strategies, scripts, and documentation. There is no private core module kept outside the repository, and this is not just a thin demo shell.</p><p>The project comes from a very concrete daily workflow: you have a trace in hand, Perfetto has already exposed the facts, but moving from facts to judgment still means jumping through tables, writing SQL, matching threads, checking FrameTimeline, finding the Binder peer, and then returning to the timeline to confirm everything again. SmartPerfetto tries to turn those repeated actions into tools, so performance engineers can spend more time on judgment.</p><p>It is still in development. I am releasing it now because trace analysis grows from real samples: real devices, real vendor differences, real product traces, and real PRs all change how Skills and strategies should be written. Waiting until every capability is stable before publishing it one way would miss the stage where samples matter most.</p><p>If you often open Perfetto to inspect scrolling jank, startup, ANR, Binder, CPU scheduling, or rendering pipelines, SmartPerfetto provides a Perfetto UI with an AI Assistant. After loading a trace, you ask questions in natural language. The backend queries <code>trace_processor_shell</code>, invokes YAML Skills, organizes evidence, and streams conclusions plus data tables back into the browser.</p><p>Project links:</p><ul><li>Main repository: <a href="https://github.com/Gracker/SmartPerfetto">https://github.com/Gracker/SmartPerfetto</a></li><li>Perfetto UI fork: <a href="https://github.com/Gracker/perfetto">https://github.com/Gracker/perfetto</a></li></ul><p>For normal trial use, you only need the main repository. <code>Gracker/perfetto</code> is the frontend fork used by the <code>perfetto/</code> submodule. It mainly matters to developers who want to modify the AI Assistant plugin UI.</p><p>The previous two technical articles are better for readers who want the engineering details:</p><ul><li><a href="https://www.androidperformance.com/en/2026/04/10/SmartPerfetto-Architecture-Deep-Dive/">From Trace to Insight: Harness Engineering in SmartPerfetto AI Agent</a>: the architecture of the SmartPerfetto AI Agent and the Harness Engineering process.</li><li><a href="https://www.androidperformance.com/en/2026/04/10/SmartPerfetto-Architecture-Deep-Dive-QA/">SmartPerfetto Architecture Q&amp;A: 8 In-Depth Technical Questions</a>: Q&amp;A around the Agent, Workflow, and YAML Skills.</li></ul><p>Those two articles go deep into the internal architecture. Once the source is public, readers usually care more about what is actually in the repository, whether it can run, and which parts are not stable yet. This article focuses on the open-source release itself: what is open, what works today, how the internal pieces are divided, how to run it locally, and where collaboration is most useful.</p><span id="more"></span><h2 id="What-Is-Open-Source"><a href="#What-Is-Open-Source" class="headerlink" title="What Is Open Source"></a>What Is Open Source</h2><p>SmartPerfetto open sources the full engineering stack from UI to analysis rules. It keeps Perfetto’s timeline, SQL, and trace visualization capabilities, adds an AI Assistant panel inside the UI, and uses a TypeScript backend for Agent orchestration, MCP tool calls, Skill execution, report generation, and SSE streaming output.</p><p>The repository contains these parts:</p><p><img src="/en/images/SmartPerfetto-Open-Source-Perfetto-AI-Assistant/open-source-scope.png" alt="Full SmartPerfetto open-source scope"></p><ul><li>Perfetto UI plugin and prebuilt frontend: the <code>perfetto/</code> submodule integrates <code>com.smartperfetto.AIAssistant</code>, and the repository also includes the prebuilt <code>frontend/</code> artifacts. Normal trial use does not require rebuilding Perfetto UI.</li><li>Backend Agent runtime: scene routing, Prompt building, MCP Server, Verifier, Artifact Store, and SSE Bridge under <code>backend/src/agentv3/</code>.</li><li>YAML Skill system: there are currently 165 <code>*.skill.yaml</code> files under <code>backend/skills/</code>, covering scrolling, startup, ANR, memory, CPU, GPU, Binder, rendering pipelines, and more.</li><li>Scene strategies: 12 <code>.strategy.md</code> files under <code>backend/strategies/</code>, used to inject different analysis steps and output constraints for different questions.</li><li>Engineering scripts and documentation: Docker Hub Compose, source-build Compose, <code>start.sh</code>, frontend plugin development scripts, MCP tool references, Skill guides, technical architecture docs, and rendering pipeline references.</li></ul><p>This release opens the whole project. If a capability is not good enough yet, that is the real state of the development-stage system. There is no separate private core implementation outside the repository. The UI, backend runtime, and Skill system are already usable, while public APIs and internal protocols will continue to evolve.</p><h2 id="Why-Open-Source-Now"><a href="#Why-Open-Source-Now" class="headerlink" title="Why Open Source Now"></a>Why Open Source Now</h2><p>Perfetto trace analysis depends heavily on samples. Different Android versions, vendors, rendering frameworks, and business scenarios can make the same kind of jank appear in different data shapes. One person or one team cannot cover all of those branches.</p><p>During SmartPerfetto development, the same pattern appeared repeatedly: SQL can find facts, but facts do not automatically become conclusions. Many analysis mistakes look like the model is “not smart enough,” but the real cause is often that a Skill missed a branch, a table was not covered, there were too few trace samples, or a strategy assumed a specific device behavior.</p><p>Open sourcing now is about putting three things into the open and letting them be tested by real traces:</p><ul><li>Runnable tools: readers can load their own traces locally and verify how the AI Assistant handles real data.</li><li>Reviewable rules: YAML Skills, scene strategies, and MCP tools are all in the repository, so the SQL and strategy behind a conclusion can be inspected, modified, and reused.</li><li>Accumulated samples: complex performance problems need trace samples and regression tests that accumulate over time, and an open-source repository is a better place to preserve those cases.</li></ul><p>For Android performance engineers, a trace that reproduces a problem, a more accurate Perfetto SQL query, a more reliable Skill branch, or a review that points out a wrong attribution is often more useful than a large block of feature code.</p><p>That is also the meaning of open sourcing during development: SmartPerfetto does not need to wait until every analysis path is mature before accepting outside feedback. The earlier it meets real devices, real vendor differences, and real product traces, the easier it is to add the right Skills, strategies, and regression samples.</p><h2 id="What-Problems-It-Targets"><a href="#What-Problems-It-Targets" class="headerlink" title="What Problems It Targets"></a>What Problems It Targets</h2><p>Perfetto’s data is powerful, but analyzing a trace is not easy. A trace that is tens or hundreds of MB can contain millions of events. Threads, slices, counters, FrameTimeline, Binder, CPU frequency, and SurfaceFlinger composition state are scattered across different tables and tracks.</p><p>The most exhausting part is usually the middle of the investigation: after seeing a frame exceed the budget, you still need to decide whether the cause is main-thread queuing, a busy RenderThread, a slow GPU, SurfaceFlinger composition blocking, or an earlier Binder, scheduling, or IO delay.</p><p>SmartPerfetto gives repeated data collection and initial judgment to the tool system, while leaving attribution that needs experience to the Agent and the engineer together.</p><p>It is suited for problems such as:</p><ul><li>Scrolling jank: identify janky frames, VSync budget overruns, App&#x2F;SF&#x2F;GPU responsibility, and main-thread or RenderThread state.</li><li>Startup performance: split cold start, warm start, lifecycle phases, main-thread time, Binder, class loading, GC, and IO.</li><li>ANR: locate main-thread blocking, Binder peer, lock waits, scheduling delay, and system load.</li><li>Interaction latency: break down time from input event to frame production and then to display.</li><li>Memory and GC: observe GC pause, memory pressure, LMK, dmabuf, and system memory state.</li><li>Rendering pipelines: identify Standard View, Compose, Flutter, WebView, SurfaceView, TextureView, game, Vulkan, and related paths.</li></ul><p>It does not replace performance engineers. Trace capture quality, business context, device differences, and reproduction conditions still require human judgment. SmartPerfetto is closer to an analysis assistant that can reliably run SQL, organize tables, and check missing items according to strategies.</p><h2 id="Runtime-Screenshots"><a href="#Runtime-Screenshots" class="headerlink" title="Runtime Screenshots"></a>Runtime Screenshots</h2><p>At runtime, the AI Assistant can appear as a floating window inside Perfetto UI, and it can also work together with the timeline, scene markers, and analysis reports. After users load a trace, they can ask questions, inspect tool calls, expand evidence, and review conclusions in the same interface.</p><p><img src="/en/images/SmartPerfetto-Open-Source-Perfetto-AI-Assistant/1-running_floating_window.png" alt="SmartPerfetto runtime screenshot: AI Assistant floating window"></p><p>The floating window is useful when you want to ask follow-up questions without leaving the Perfetto timeline. It keeps the current conversation, scene entries, session history, and input box together, so you can watch the trace while deciding the next analysis direction.</p><p><img src="/en/images/SmartPerfetto-Open-Source-Perfetto-AI-Assistant/2-running_timeline.png" alt="SmartPerfetto runtime screenshot: Agent conversation timeline"></p><p>The conversation timeline records Agent initialization, plan submission, Skill calls, SQL queries, and data-detail fetches. You can review the intermediate actions, not just the final conclusion.</p><p><img src="/en/images/SmartPerfetto-Open-Source-Perfetto-AI-Assistant/3-running_report.png" alt="SmartPerfetto runtime screenshot: structured analysis report"></p><p>The analysis report puts startup events, data quality, phase durations, suspicious slices, and recommendations into one result, making it easier to move from a natural-language conclusion back to concrete evidence.</p><p><img src="/en/images/SmartPerfetto-Open-Source-Perfetto-AI-Assistant/4-running_root_cause.png" alt="SmartPerfetto runtime screenshot: root cause and evidence table"></p><p>Root-cause analysis tries to tie each judgment back to threads, timestamps, SQL results, and trace slices. Engineers still need to review it with business context, but they do not have to start from a blank SQL page.</p><h2 id="Overall-Architecture"><a href="#Overall-Architecture" class="headerlink" title="Overall Architecture"></a>Overall Architecture</h2><p>The main SmartPerfetto architecture has three layers: the frontend is still Perfetto UI, the backend orchestrates the Agent and tools, and data queries are handled by Perfetto’s official <code>trace_processor_shell</code>.</p><p><img src="/en/images/SmartPerfetto-Open-Source-Perfetto-AI-Assistant/open-source-architecture.png" alt="SmartPerfetto open-source architecture"></p><p>Several boundaries in this architecture are important:</p><ul><li>The frontend does not analyze traces directly. It loads traces, displays the timeline, sends questions, receives SSE events, and renders results.</li><li>The backend <code>agentv3</code> is the main runtime. It handles scene recognition, Prompt assembly, MCP tool registration, Verifier checks, and report generation.</li><li><code>trace_processor_shell</code> remains the data query engine. All performance numbers come from SQL or deterministic calculations inside Skills.</li><li>YAML Skills package common analysis flows into reusable units, so the Agent does not need to write complex SQL from scratch every time.</li></ul><p>The design judgment is straightforward: large models are good at understanding questions, choosing directions, and organizing causal relationships. Databases and Skills are good at querying, aggregating, paginating, formatting, and repeating execution.</p><h2 id="Skill-Turning-Performance-Experience-into-Executable-Analysis-Units"><a href="#Skill-Turning-Performance-Experience-into-Executable-Analysis-Units" class="headerlink" title="Skill: Turning Performance Experience into Executable Analysis Units"></a>Skill: Turning Performance Experience into Executable Analysis Units</h2><p>SmartPerfetto does not put all analysis logic into TypeScript, and it does not let the large model freely compose SQL. A large amount of domain logic lives in YAML Skills.</p><p>A Skill can declare input parameters, required tables, SQL, display columns, layered output, conditional branches, iterators, and parallel steps. The Agent only needs to call:</p><figure class="highlight plaintext"><table><tr><td class="gutter"><pre><span class="line">1</span><br></pre></td><td class="code"><pre><span class="line">invoke_skill(&quot;scrolling_analysis&quot;, &#123; process_name: &quot;com.example.app&quot; &#125;)</span><br></pre></td></tr></table></figure><p>The backend Skill Engine executes the corresponding SQL and composite steps, then wraps the result into a DataEnvelope that the frontend can render. This has three benefits:</p><p><img src="/en/images/SmartPerfetto-Open-Source-Perfetto-AI-Assistant/open-source-skill-system.png" alt="SmartPerfetto YAML Skill runtime"></p><ul><li>Repeatable results: with the same trace and the same parameters, the Skill’s calculation path is stable.</li><li>Renderable output: column names, data types, timestamp jumps, and duration formatting are declared in the Skill.</li><li>Lower contribution cost: performance engineers who know Perfetto SQL can modify YAML and SQL without first understanding the whole backend codebase.</li></ul><p>Current Skill distribution:</p><table><thead><tr><th>Type</th><th align="right">Count</th><th>Location</th><th>Purpose</th></tr></thead><tbody><tr><td>Atomic</td><td align="right">87</td><td><code>backend/skills/atomic/</code></td><td>Single SQL queries, such as CPU frequency, Binder, GC, and FrameTimeline</td></tr><tr><td>Composite</td><td align="right">29</td><td><code>backend/skills/composite/</code></td><td>Multi-step analyses, such as <code>scrolling_analysis</code>, <code>startup_analysis</code>, and <code>anr_analysis</code></td></tr><tr><td>Deep</td><td align="right">2</td><td><code>backend/skills/deep/</code></td><td>Deep analysis such as call stacks and CPU profiling</td></tr><tr><td>Pipeline</td><td align="right">29</td><td><code>backend/skills/pipelines/</code></td><td>Rendering pipeline detection and teaching content</td></tr><tr><td>Module</td><td align="right">18</td><td><code>backend/skills/modules/</code></td><td>Layered expert modules for app, framework, kernel, and hardware</td></tr></tbody></table><p>This Skill system is part of the SmartPerfetto runtime, and it should be separated from development-tool Skills. Claude Code Skills help developers build SmartPerfetto. SmartPerfetto YAML Skills help users analyze traces. Their names are similar, but their runtime location, inputs, outputs, and goals are different.</p><h2 id="MCP-Letting-the-Agent-Touch-Traces-Only-Through-Tools"><a href="#MCP-Letting-the-Agent-Touch-Traces-Only-Through-Tools" class="headerlink" title="MCP: Letting the Agent Touch Traces Only Through Tools"></a>MCP: Letting the Agent Touch Traces Only Through Tools</h2><p>SmartPerfetto exposes tools to the Agent through MCP (Model Context Protocol). Full mode exposes up to 20 tools, while Fast mode keeps only 3 lightweight tools.</p><p>Common tools fall into several categories:</p><p><img src="/en/images/SmartPerfetto-Open-Source-Perfetto-AI-Assistant/open-source-mcp-tools.png" alt="SmartPerfetto MCP tool map"></p><ul><li>Data access: <code>execute_sql</code>, <code>invoke_skill</code>, <code>list_skills</code>, <code>lookup_sql_schema</code>, <code>query_perfetto_source</code>, <code>list_stdlib_modules</code>, <code>lookup_knowledge</code>, and <code>detect_architecture</code>.</li><li>Planning and hypotheses: <code>submit_plan</code>, <code>update_plan_phase</code>, <code>revise_plan</code>, <code>submit_hypothesis</code>, <code>resolve_hypothesis</code>, and <code>flag_uncertainty</code>.</li><li>Result management: <code>fetch_artifact</code>, <code>write_analysis_note</code>, and <code>recall_patterns</code>.</li><li>Comparative analysis: <code>execute_sql_on</code>, <code>compare_skill</code>, and <code>get_comparison_context</code>.</li></ul><p><code>execute_sql</code> and <code>invoke_skill</code> are plan-gated. The Agent must submit an analysis plan before it can query data. This gate is not meant to freeze the workflow. It requires the Agent to state the phases, goals, and expected tools before acting, and the Verifier later checks whether key actions are missing.</p><p>Tool results are also compressed and layered. Large results go into the Artifact Store. The Agent first receives a summary, then fetches rows by page when needed. This avoids dumping hundreds of thousands of tokens from one Skill output into the context.</p><h2 id="From-Question-to-Conclusion"><a href="#From-Question-to-Conclusion" class="headerlink" title="From Question to Conclusion"></a>From Question to Conclusion</h2><p>When the user enters “analyze scrolling jank,” SmartPerfetto does not send the trace directly to the large model. The trace file does not enter the prompt. The Agent only sees structured results returned by tools.</p><p><img src="/en/images/SmartPerfetto-Open-Source-Perfetto-AI-Assistant/open-source-analysis-flow.png" alt="SmartPerfetto analysis flow from question to conclusion"></p><p>A scrolling jank analysis usually goes through these steps:</p><ol><li>The frontend sends the question, traceId, and analysis mode to the backend.</li><li>The backend classifies the scene, such as <code>scrolling</code>, <code>startup</code>, <code>anr</code>, <code>memory</code>, <code>pipeline</code>, or <code>general</code>.</li><li>Prompt Builder injects the corresponding <code>.strategy.md</code>, architecture template, output format, and required knowledge.</li><li>The Agent submits a plan first, then invokes MCP tools.</li><li>The preferred path is <code>invoke_skill</code> for predefined analysis. If a Skill does not cover the case, the Agent uses <code>lookup_sql_schema</code> and <code>execute_sql</code> to add queries.</li><li>Skill and SQL results return as DataEnvelopes, Artifacts, tables, or summaries.</li><li>Verifier checks evidence support, hypothesis state, scene coverage, and common missing items.</li><li>The backend pushes progress, tool results, answer tokens, conclusions, and the final report through SSE.</li></ol><p>The final user experience includes a natural-language conclusion, tables, timestamp jumps, a report URL, and a session that can continue with follow-up questions.</p><h2 id="How-to-Run-It"><a href="#How-to-Run-It" class="headerlink" title="How to Run It"></a>How to Run It</h2><p>If you want to try it with your own trace, start with the shortest path. The repository already includes a prebuilt Perfetto UI, so normal trial use does not require initializing the <code>perfetto/</code> submodule or preparing a local C++ build environment.</p><figure class="highlight bash"><table><tr><td class="gutter"><pre><span class="line">1</span><br><span class="line">2</span><br></pre></td><td class="code"><pre><span class="line">git <span class="built_in">clone</span> https://github.com/Gracker/SmartPerfetto.git</span><br><span class="line"><span class="built_in">cd</span> SmartPerfetto</span><br></pre></td></tr></table></figure><p>The default development environment is currently organized around macOS. Windows users should use Docker Desktop with the WSL2 backend. If you want to run source scripts, WSL2 is also recommended instead of a native Windows shell. Ubuntu and other Linux distributions still need more testing. If you hit issues, include environment details in your Issue or PR.</p><p>If you only want to run the tool first, the recommended path is the Docker Hub image. This only requires Docker Desktop&#x2F;Engine and an LLM API key. You do not need Node.js. The image already includes the backend, prebuilt frontend, and a pinned <code>trace_processor_shell</code>:</p><figure class="highlight bash"><table><tr><td class="gutter"><pre><span class="line">1</span><br><span class="line">2</span><br><span class="line">3</span><br><span class="line">4</span><br><span class="line">5</span><br><span class="line">6</span><br></pre></td><td class="code"><pre><span class="line"><span class="built_in">cp</span> backend/.env.example .<span class="built_in">env</span></span><br><span class="line"><span class="comment"># Edit .env and set ANTHROPIC_API_KEY;</span></span><br><span class="line"><span class="comment"># or configure ANTHROPIC_BASE_URL + ANTHROPIC_API_KEY for an API proxy.</span></span><br><span class="line"></span><br><span class="line">docker compose -f docker-compose.hub.yml pull</span><br><span class="line">docker compose -f docker-compose.hub.yml up -d</span><br></pre></td></tr></table></figure><p>After startup, open <code>http://localhost:10000</code>, load a <code>.pftrace</code> or <code>.perfetto-trace</code> file, and then open the AI Assistant panel. The backend health check is <code>http://localhost:3000/health</code>. Uploaded files and logs are stored in Docker volumes, so they remain after container restart.</p><p>To stop the containers:</p><figure class="highlight bash"><table><tr><td class="gutter"><pre><span class="line">1</span><br></pre></td><td class="code"><pre><span class="line">docker compose -f docker-compose.hub.yml down</span><br></pre></td></tr></table></figure><p>You only need the source-build path when testing Dockerfile changes or building local code that has not been published to the image:</p><figure class="highlight bash"><table><tr><td class="gutter"><pre><span class="line">1</span><br><span class="line">2</span><br></pre></td><td class="code"><pre><span class="line"><span class="built_in">cp</span> backend/.env.example backend/.env</span><br><span class="line">docker compose up --build</span><br></pre></td></tr></table></figure><p>The source-build path still uses the prebuilt <code>frontend/</code> artifacts in the repository. It does not rebuild the <code>perfetto/</code> submodule.</p><p>For local source checkout startup, use <code>./start.sh</code>. This script uses the prebuilt <code>frontend/</code> artifacts in the repository and downloads a pinned <code>trace_processor_shell</code> when needed:</p><figure class="highlight bash"><table><tr><td class="gutter"><pre><span class="line">1</span><br><span class="line">2</span><br><span class="line">3</span><br><span class="line">4</span><br><span class="line">5</span><br></pre></td><td class="code"><pre><span class="line"><span class="built_in">cp</span> backend/.env.example backend/.env</span><br><span class="line"><span class="comment"># Edit backend/.env and set ANTHROPIC_API_KEY;</span></span><br><span class="line"><span class="comment"># or configure ANTHROPIC_BASE_URL + ANTHROPIC_API_KEY for an API proxy.</span></span><br><span class="line"></span><br><span class="line">./start.sh</span><br></pre></td></tr></table></figure><p>You only need to initialize the Perfetto submodule and use the frontend development script when modifying the AI Assistant plugin UI, such as <code>ai_panel.ts</code> or <code>styles.scss</code>:</p><figure class="highlight bash"><table><tr><td class="gutter"><pre><span class="line">1</span><br><span class="line">2</span><br></pre></td><td class="code"><pre><span class="line">git submodule update --init --recursive</span><br><span class="line">./scripts/start-dev.sh</span><br></pre></td></tr></table></figure><p>Both local scripts start two services:</p><ul><li>Frontend: <code>http://localhost:10000</code></li><li>Backend: <code>http://localhost:3000</code></li></ul><p>For daily backend, Skill, strategy, or normal documentation changes, prefer <code>./start.sh</code>. Switch to <code>./scripts/start-dev.sh</code> only when modifying the Perfetto plugin UI.</p><p>Model integration currently focuses on Anthropic direct access or Anthropic Messages-compatible proxies. Third-party models need an adapter layer and stable support for streaming and tool&#x2F;function calling. If a model can only chat and cannot reliably call tools, SmartPerfetto’s SQL queries and Skill calls cannot complete properly.</p><h2 id="Where-to-Contribute"><a href="#Where-to-Contribute" class="headerlink" title="Where to Contribute"></a>Where to Contribute</h2><p>If this project becomes reliable later, the most valuable inputs will be reproducible traces, runnable SQL, Skills that explain failure causes, and regression samples that keep accumulating.</p><p>Good starting points:</p><p><img src="/en/images/SmartPerfetto-Open-Source-Perfetto-AI-Assistant/open-source-contribution-map.png" alt="SmartPerfetto development-stage contribution map"></p><ul><li>Provide small traces and reproducible problems: a trace that demonstrates the problem is easier to turn into a test and a Skill than an abstract description.</li><li>Improve YAML Skills: add SQL, display columns, empty-data hints, vendor differences, and edge cases.</li><li>Improve scene strategies: make <code>scrolling</code>, <code>startup</code>, <code>anr</code>, and other strategies cover more common analysis steps.</li><li>Fix the Perfetto plugin UI: the AI panel, tables, charts, jumps, and scene navigation all live in the frontend plugin.</li><li>Add regression tests: the project already has 6 canonical trace regression gates, and new failure samples can become long-term protection.</li></ul><p>The project changes quickly during development. Before contributing, sync the main SmartPerfetto repository. If you modify the AI Assistant plugin UI, also sync the <code>perfetto/</code> submodule. When you find a bug, an improvement opportunity, or have already fixed something in your fork, prefer opening an Issue or PR with the reproduction trace, expected output, and test results.</p><p>If you want to participate in Skill, Agent, or frontend development over the long term, you can use the contact information in the README to discuss collaboration. Include your GitHub account and email so it is easier to add you to core development collaboration later.</p><p>Before submitting a PR, run the checks that match your change type:</p><figure class="highlight bash"><table><tr><td class="gutter"><pre><span class="line">1</span><br><span class="line">2</span><br><span class="line">3</span><br><span class="line">4</span><br><span class="line">5</span><br><span class="line">6</span><br></pre></td><td class="code"><pre><span class="line"><span class="built_in">cd</span> backend</span><br><span class="line">npm run build</span><br><span class="line">npm run <span class="built_in">test</span>:scene-trace-regression</span><br><span class="line">npm run validate:skills</span><br><span class="line">npm run validate:strategies</span><br><span class="line">npm run <span class="built_in">test</span>:core</span><br></pre></td></tr></table></figure><p>Different PRs need different checks. Code changes should at least run scene trace regression. Skill changes should run <code>validate:skills</code> plus regression. Strategy and template changes should run <code>validate:strategies</code> plus regression. Type or build issues should add <code>npx tsc --noEmit</code>.</p><h2 id="License-and-Current-Boundaries"><a href="#License-and-Current-Boundaries" class="headerlink" title="License and Current Boundaries"></a>License and Current Boundaries</h2><p>SmartPerfetto core code uses AGPL-3.0-or-later. The <code>perfetto/</code> submodule is a fork of Google Perfetto and continues to use Apache-2.0. Before internal enterprise modification, external service deployment, or commercial integration, you should carefully understand the obligations of AGPL. If you need commercial licensing without AGPL obligations, use the contact information in the README.</p><p>Open sourcing the full project does not mean every analysis path is complete. Several runtime boundaries remain:</p><ul><li>It is best suited for Android 12+ traces that include FrameTimeline data.</li><li>The model needs stable support for streaming and tool&#x2F;function calling.</li><li>Third-party model compatibility still needs more real testing. For now, Anthropic direct access or a stable Anthropic-compatible proxy is recommended first.</li><li>When trace capture misses required fields, many conclusions can only degrade into missing-data explanations.</li><li>Agent output still needs engineer review, especially for vendor customization, non-standard rendering paths, and complex cross-process waits.</li></ul><p>After open sourcing, SmartPerfetto puts repeatable trace queries, scene steps, data presentation, and quality checks into the repository. Performance analysis will not become a single prompt. Complex problems still need Perfetto, SQL, trace evidence, and engineering experience.</p><p>SmartPerfetto aims to turn that experience into engineering artifacts that can be modified, reviewed, reused, and protected by regression tests.</p><h2 id="Discussion-Group"><a href="#Discussion-Group" class="headerlink" title="Discussion Group"></a>Discussion Group</h2><p>If you are trying SmartPerfetto, want to report bugs, discuss trace analysis results, submit PRs, or help build Skill, Agent, and frontend capabilities, scan the code to join the discussion group:</p><p><img src="/en/images/SmartPerfetto-Open-Source-Perfetto-AI-Assistant/wechat.jpg" alt="SmartPerfetto discussion group"></p><p>If the group QR code is full or expired, add me on WeChat at <code>553000664</code> and include <code>SmartPerfetto</code> in the note. I will invite you to the group.</p>]]></content>
    
    
    <summary type="html">&lt;p&gt;SmartPerfetto is now fully open source. Open the repository and you can see the runnable mainline project as it exists today: the Perfetto UI fork, the agentv3 backend, MCP tools, YAML Skills, scene strategies, scripts, and documentation. There is no private core module kept outside the repository, and this is not just a thin demo shell.&lt;/p&gt;
&lt;p&gt;The project comes from a very concrete daily workflow: you have a trace in hand, Perfetto has already exposed the facts, but moving from facts to judgment still means jumping through tables, writing SQL, matching threads, checking FrameTimeline, finding the Binder peer, and then returning to the timeline to confirm everything again. SmartPerfetto tries to turn those repeated actions into tools, so performance engineers can spend more time on judgment.&lt;/p&gt;
&lt;p&gt;It is still in development. I am releasing it now because trace analysis grows from real samples: real devices, real vendor differences, real product traces, and real PRs all change how Skills and strategies should be written. Waiting until every capability is stable before publishing it one way would miss the stage where samples matter most.&lt;/p&gt;
&lt;p&gt;If you often open Perfetto to inspect scrolling jank, startup, ANR, Binder, CPU scheduling, or rendering pipelines, SmartPerfetto provides a Perfetto UI with an AI Assistant. After loading a trace, you ask questions in natural language. The backend queries &lt;code&gt;trace_processor_shell&lt;/code&gt;, invokes YAML Skills, organizes evidence, and streams conclusions plus data tables back into the browser.&lt;/p&gt;
&lt;p&gt;Project links:&lt;/p&gt;
&lt;ul&gt;
&lt;li&gt;Main repository: &lt;a href=&quot;https://github.com/Gracker/SmartPerfetto&quot;&gt;https://github.com/Gracker/SmartPerfetto&lt;/a&gt;&lt;/li&gt;
&lt;li&gt;Perfetto UI fork: &lt;a href=&quot;https://github.com/Gracker/perfetto&quot;&gt;https://github.com/Gracker/perfetto&lt;/a&gt;&lt;/li&gt;
&lt;/ul&gt;
&lt;p&gt;For normal trial use, you only need the main repository. &lt;code&gt;Gracker/perfetto&lt;/code&gt; is the frontend fork used by the &lt;code&gt;perfetto/&lt;/code&gt; submodule. It mainly matters to developers who want to modify the AI Assistant plugin UI.&lt;/p&gt;
&lt;p&gt;The previous two technical articles are better for readers who want the engineering details:&lt;/p&gt;
&lt;ul&gt;
&lt;li&gt;&lt;a href=&quot;https://www.androidperformance.com/en/2026/04/10/SmartPerfetto-Architecture-Deep-Dive/&quot;&gt;From Trace to Insight: Harness Engineering in SmartPerfetto AI Agent&lt;/a&gt;: the architecture of the SmartPerfetto AI Agent and the Harness Engineering process.&lt;/li&gt;
&lt;li&gt;&lt;a href=&quot;https://www.androidperformance.com/en/2026/04/10/SmartPerfetto-Architecture-Deep-Dive-QA/&quot;&gt;SmartPerfetto Architecture Q&amp;amp;A: 8 In-Depth Technical Questions&lt;/a&gt;: Q&amp;amp;A around the Agent, Workflow, and YAML Skills.&lt;/li&gt;
&lt;/ul&gt;
&lt;p&gt;Those two articles go deep into the internal architecture. Once the source is public, readers usually care more about what is actually in the repository, whether it can run, and which parts are not stable yet. This article focuses on the open-source release itself: what is open, what works today, how the internal pieces are divided, how to run it locally, and where collaboration is most useful.&lt;/p&gt;</summary>


    <category term="Android" scheme="https://androidperformance.com/en/categories/Android/"/>
    
    
    <category term="Android" scheme="https://androidperformance.com/en/tags/Android/"/>
    
    <category term="Perfetto" scheme="https://androidperformance.com/en/tags/Perfetto/"/>
    
    <category term="Performance" scheme="https://androidperformance.com/en/tags/Performance/"/>
    
    <category term="AI Agent" scheme="https://androidperformance.com/en/tags/AI-Agent/"/>
    
    <category term="SmartPerfetto" scheme="https://androidperformance.com/en/tags/SmartPerfetto/"/>
    
    <category term="MCP" scheme="https://androidperformance.com/en/tags/MCP/"/>
    
    <category term="Open Source" scheme="https://androidperformance.com/en/tags/Open-Source/"/>
    
  </entry>
  
  <entry>
    <title>Long-form Forecast: Phones May No Longer Start from Apps: How Agent OS Takes Over the Task Entry Point</title>
    <link href="https://androidperformance.com/en/2026/04/28/Agent-OS-Task-Entry/"/>
    <id>https://androidperformance.com/en/2026/04/28/Agent-OS-Task-Entry/</id>
    <published>2026-04-28T06:57:22.000Z</published>
    <updated>2026-05-10T23:29:51.052Z</updated>
    
    <content type="html"><![CDATA[<blockquote><p>Starting from Ming-Chi Kuo’s April 27, 2026 supply-chain report about an OpenAI phone, this article looks at the possible system shape after phones and AI merge, from the perspective of someone who works on Android phones.</p></blockquote><h2 id="Introduction-This-Is-Not-Just-a-New-Phone-Problem"><a href="#Introduction-This-Is-Not-Just-a-New-Phone-Problem" class="headerlink" title="Introduction: This Is Not Just a New Phone Problem"></a>Introduction: This Is Not Just a New Phone Problem</h2><p>The most interesting part of Kuo’s report is not the 2028 mass-production window. It is not whether MediaTek, Qualcomm, or Luxshare ends up in which supplier position either.</p><p>It pushes the question into the system layer:</p><p>If the user’s primary goal shifts from opening apps to completing tasks, what should a phone operating system look like?</p><p>That sounds like a UI question. From an Android practitioner’s perspective, it touches the whole system structure: Launcher, notifications, permissions, IPC, app capability declarations, model runtime, TEE, device-cloud sync, task state machines, audit logs, payment confirmation, and developer revenue sharing all need to be reconsidered.</p><p>Over the past few years, most discussions about AI phones have stayed at the feature layer. Vendors talk about AI photo editing, AI erase, AI summaries, AI search, AI assistants, and AI briefings. All of these can fit inside today’s Android or iOS architecture.</p><p>If OpenAI really builds an AI Agent phone, it will move the question from “how many AI features can be added to a phone” to “should the phone’s first entry point still start from app icons?”</p><p>The main line is this: Agent OS looks like a structural migration of mobile OS after the graphical interface era. The foreground moves from an app grid to a task stream. The background moves from app-owned capability to authorized capability. The system moves from managing processes and windows to managing tasks, context, and responsibility.</p><p>OpenAI does not have to build on Android, but Android is the more likely path because it inherits hardware adaptation, drivers, app compatibility, and supply-chain experience. If OpenAI wants to design the first screen, permissions, and task flow completely around Agent OS, it may also choose an “Android-compatible but not quite Android” path, or even build a Linux-based system and fill the service gap with the web, cloud execution, and an app compatibility layer.</p><p>Different OS choices will change go-to-market speed. They will not change the five things Agent OS must solve:</p><ol><li>The phone must continuously understand the user’s current state.</li><li>Apps must move from foreground entry points to background capability providers.</li><li>The system must have a task runtime that is recoverable, cancellable, and auditable.</li><li>Device-side and cloud-side execution must be split by data sensitivity and real-time needs.</li><li>Every cross-app, cross-device, and cross-cloud action must have permission, responsibility, and rollback boundaries.</li></ol><p>Without these five things, an AI phone is still just “a phone with an AI assistant.” Once they become system constraints, the phone starts moving toward Agent OS.</p><span id="more"></span><p><img src="/en/images/Agent-OS-Task-Entry/01-agent-os-five-things.png" alt="Five Things Agent OS Must Solve"></p><h2 id="Table-of-Contents"><a href="#Table-of-Contents" class="headerlink" title="Table of Contents"></a>Table of Contents</h2><p>The article follows six major questions.</p><ol><li><p>The starting point: OpenAI’s phone does not change hardware first. We first separate several possible OS paths for an OpenAI phone, then explain why the phone is still the Agent’s state center.</p></li><li><p>Entry migration: from app grid to task stream. Apps will not disappear, but their entry role will be downgraded. The real change lands on OS objects such as Task, Capability, Context, Artifact, Grant, and Audit.</p></li><li><p>The Android path: from super app to system service. Android will not be rebuilt from scratch in the short term. Agent OS is more likely to grow out of system services, A2A, AppFunctions, GUI Agents, and a Capability Router.</p></li><li><p>OpenAI’s fork: Android-based or not Android-based. A non-Android route is cleaner, but it must rebuild apps, identity, payment, service networks, and responsibility boundaries. The Android route is faster, but easier to drag back into the old app model.</p></li><li><p>Device-cloud, hardware, industry, and timeline. Device-cloud division of labor, data classification, on-device models, SoCs, five groups of players, the supply chain, and the 2026-2032 timeline will decide whether Agent phones can move from demos into daily use.</p></li><li><p>Product shape, market split, and responsibility distribution. Finally we return to the first screen, the China market, developer relations, responsibility distribution, and what Android practitioners should watch.</p></li></ol><h2 id="1-The-Starting-Point-OpenAI’s-Phone-Does-Not-Change-Hardware-First"><a href="#1-The-Starting-Point-OpenAI’s-Phone-Does-Not-Change-Hardware-First" class="headerlink" title="1. The Starting Point: OpenAI’s Phone Does Not Change Hardware First"></a>1. The Starting Point: OpenAI’s Phone Does Not Change Hardware First</h2><p>Kuo’s report points to several concrete directions: OpenAI is working with MediaTek and Qualcomm on phone processors; Luxshare handles assembly and system integration; hardware co-design may be involved; specifications and suppliers may converge by late 2026 or Q1 2027; the target is mass production in 2028.</p><p>If this is understood only as “OpenAI wants to build an iPhone competitor,” the analysis will go off track. Phone hardware is already a mature industry. OpenAI’s hard part is rarely bill of materials, cameras, industrial design, or finding a contract manufacturer. The hard question is: why would users hand their primary device to an AI company that has no app distribution power, no local-life service network, no payment network, no carrier channel, and no long-term phone support experience?</p><p>The answer cannot simply be “a stronger model.” A phone is not a benchmark device for models. Users handle identity, money, work, social relationships, transportation, health, family, and content consumption on phones every day. OpenAI’s opportunity is on the other side: bypass the fight for dwell time inside each app, and compete directly for task interpretation and task execution.</p><p>But “building a phone” can mean four different choices.</p><p>The first choice is standard Android. OpenAI can take the AOSP&#x2F;GMS stack, deeply customize Launcher, SystemUI, permissions, notifications, and the default assistant, keep Android app compatibility, and make the Agent a system-level entry point. This is the fastest path, and it looks most like a phone. The risk is limited control. Android’s security model, background restrictions, app permissions, Play policies, and OEM customization boundaries will all limit how far OpenAI can rewrite the user experience in one step.</p><p>The second choice is a deep AOSP fork. It still runs Android apps, but OpenAI defines the framework, default entry point, capability registration, task management, and cloud sync. Overseas, it can negotiate Google services. In China, it would almost need to build a separate service system. This path is feasible in engineering terms, but commercially difficult. Android app compatibility touches APKs, Google Play, push, maps, payment, accounts, subscriptions, anti-cheat, and vendor certification.</p><p>The third choice is “Android compatibility layer plus self-built Agent OS.” The bottom layer may still be Linux. The foreground is a task-flow system. Android apps run inside an isolated container or compatibility environment, similar to how desktop systems have run mobile apps before. OpenAI gets more design freedom in this system. It can treat apps as capability containers and weaken their UI as the main subject. The cost is higher compatibility work, power consumption, background limitations, and resistance from app vendors.</p><p>The fourth choice is a new OS that is not based on Android at all, and the first-generation device may not even be a traditional phone. OpenAI’s earlier hardware direction with Jony Ive’s team has often been understood as a more AI-native device. That does not conflict with Kuo’s phone report. OpenAI can first build a portable device with a weaker screen, stronger conversation, and heavier cloud execution, or build a phone-shaped device that does not aim for full app compatibility. It is cleaner, but it is hard to become the user’s primary phone.</p><p>My leaning is this: if the goal is 2028 mass production and high-end replacement demand, OpenAI probably will not completely abandon the Android ecosystem. The more realistic path is an AOSP or Android-compatible branch, plus a heavily customized Agent OS foreground. But this is a probability judgment, not an assumption. The following sections first analyze the Android route, then the non-Android route.</p><p>Before route analysis, one concept should be separated: OpenAI may not want to “make an Android phone.” It is more likely trying to build a task entry point that makes Android and iOS feel old. If users accept that entry point, first-generation hardware sales should not be the only metric. It will force every phone vendor to answer the same question:</p><p>Why should users still search through dozens of icons instead of seeing tasks that are happening, waiting for confirmation, already done, or ready to resume?</p><h3 id="Why-the-Phone-Is-Still-the-Agent’s-State-Center"><a href="#Why-the-Phone-Is-Still-the-Agent’s-State-Center" class="headerlink" title="Why the Phone Is Still the Agent’s State Center"></a>Why the Phone Is Still the Agent’s State Center</h3><p>The view that “the Agent can just live in the cloud” sees reasoning capability but misses the phone’s position in user life. Cloud models are larger, tools are richer, and costs can be centrally optimized, but the cloud lacks the user’s current state.</p><p>Completing tasks depends on language understanding, but also on the user’s immediate state. State is broader than a prompt plus static data such as contacts, calendar, and photos. It points to what is happening now, and how far the user is willing to let the system act on their behalf.</p><p>The phone is exactly the device with the most complete version of that state.</p><p>It knows where the user is, what they are looking at, what notification just arrived, which app was opened a minute ago, whether Bluetooth earbuds are connected, whether the watch detected activity, whether the screen is locked, whether payment credentials are available, whether the user just entered an airport, whether the car is parked nearby, how long until the next meeting, and whether family members are in the same location-sharing circle.</p><p>The cloud does not naturally get this state. It can have long-term memory, knowledge bases, browsers, code sandboxes, and powerful models, but it cannot see the scene in the user’s hand. It does not know whether the user can speak right now, which button on the current screen can be tapped, or whether biometric confirmation can be completed. If the cloud wants to behave as if it is present, it must get live state through the phone.</p><p>This is why OpenAI building a phone makes sense. However strong the ChatGPT app becomes, it is still an app: it appears when opened and leaves when closed. It has no system notification entry, no default right to confirm payments, no continuous semantic access to camera and screen, no cross-app task state, and no long-term permission to manage device state.</p><p>The boundary between an Agent phone and an AI app is here.</p><p>An AI app waits for the user to open it. An Agent phone observes events at the system layer, organizes tasks, waits for the right time, requests authorization, executes actions, and records results. The former is a very capable tool. The latter is a system-constrained agent.</p><p>Ordinary users will not describe it this way, but their behavior will push this change. When someone says, “Book my flight and hotel to Tokyo next Wednesday, keep it under 8,000, avoid red-eye flights, and send the itinerary to my colleagues,” the goal is to have a task decomposed, compared, confirmed, paid for, synced, and tracked. The goal is not to switch among Trip.com, Fliggy, maps, calendar, WeChat, email, and the company expense system.</p><p>When a parent says, “Check the class group and tell me what materials my child needs to submit this week,” the goal is to produce an executable checklist from group messages, the school mini-program, photos, calendar, and to-dos, then remind before the deadline. The goal is not to open WeChat and scan 200 messages, or ask a model to summarize a chat.</p><p>When a creator says, “Turn today’s footage into three short videos for Douyin, Xiaohongshu, and Channels,” they are not asking to open Jianying and tap buttons. They want material understanding, platform specs, copywriting, style selection, copyright checks, publishing plans, and metrics review.</p><p>None of these are single-app problems. They span apps, accounts, devices, cloud tools, and real-world fulfillment. The phone is the entry point because it holds state. The cloud is the amplifier because it carries long tasks. Apps are capability sources because services still sit behind apps.</p><p>So App -&gt; Agent means the app’s foreground status declines while its capability status rises. The app itself still exists.</p><h2 id="2-Entry-Migration-From-App-Grid-to-Task-Stream"><a href="#2-Entry-Migration-From-App-Grid-to-Task-Stream" class="headerlink" title="2. Entry Migration: From App Grid to Task Stream"></a>2. Entry Migration: From App Grid to Task Stream</h2><p>Many Agent OS discussions speak too absolutely: Agents will replace apps. That judgment is too crude.</p><p>As described above, apps will not disappear. The reason is simple: apps carry account systems, business relationships, payment risk control, content rights, private-domain relationships, membership benefits, customer support responsibility, and regulatory obligations. An Agent can operate a food-delivery app for the user, but restaurant supply, delivery networks, after-sales rules, coupons, invoices, and food safety responsibility still sit with the platform. An Agent can help book a hotel, but inventory, price, cancellation policy, and credit guarantees still sit with OTAs and hotel groups.</p><p>The change happens at the entry layer.</p><p>The old phone is an app icon grid: users pick an app first, then find the function inside the app. That model fits the era of humans actively operating software. The foreground of Agent OS is more like a task stream: users express goals first, and the system chooses capabilities. Apps move from “destination” to “capability source.” Users may not know which app was finally called, but the system must know, explain, authorize, audit, and assign responsibility.</p><p>Kuo’s concept image compresses this into three lines:</p><ul><li>App -&gt; Agent</li><li>Icon -&gt; Task</li><li>Grid -&gt; Stream</li></ul><p>These three lines work as product direction, but engineering must separate them.</p><p>App -&gt; Agent is not about wrapping every app in a chat UI. An Agent needs to understand the capabilities an app exposes, input constraints, output format, execution risk, and charging rules. For Android, this corresponds to a combination of AppFunctions, Intent, ContentProvider, ShareSheet, Shortcut including App Shortcuts and Sharing Shortcuts, Notification Action, Credential Manager, Wallet&#x2F;Payment SDKs, web APIs, and vendor-private interfaces. Slice has been marked deprecated by Google, so it should not be included in new designs.</p><p>Icon -&gt; Task is not about replacing app icons with task cards. Tasks need a state machine: created, planned, waiting for authorization, running, waiting for external response, failed, canceled, completed, rolled back. They also need Artifacts: tickets, orders, documents, calendar events, images, invoices, meeting notes, routes, code diffs. Users should not only see a spinning chat bubble.</p><p>Grid -&gt; Stream is not about making the home screen an information feed. A task stream must be controllable, collapsible, mutable, pausable, and traceable. Otherwise it becomes an even noisier notification center. An Agent that can appear proactively will be turned off quickly if it has no budget or restraint.</p><p>The mobile OS change hides behind these three conversions.</p><p>In the past, the OS managed processes, windows, permissions, and notifications. Agent OS must also manage tasks, context, capabilities, memory, and responsibility. Apps can continue to exist, but the first interface users face each day may no longer be a display case of apps. It may become a workbench of tasks.</p><h3 id="The-OS-Object-Model-Behind-One-Task"><a href="#The-OS-Object-Model-Behind-One-Task" class="headerlink" title="The OS Object Model Behind One Task"></a>The OS Object Model Behind One Task</h3><p><img src="/en/images/Agent-OS-Task-Entry/02-task-object-model.png" alt="Agent OS Task Object Model"></p><p>If we only say App -&gt; Agent, it quickly becomes an abstract judgment. In Android engineering language, a cross-app task must be split into at least the following objects.</p><p>The first object is Intent. Here it means the user’s goal, not Android Intent. It can come from voice, text, screenshot, camera, notification, clipboard, or an external device. If the user says “help me reimburse this invoice,” the system cannot just throw the sentence to a model. It must first identify the task type, involved apps, required accounts, possible credentials, company policy, network needs, and whether the user must be present to confirm.</p><p>The second object is Context. Here it means the minimum scene information required by the task, not Activity Context. A reimbursement task may need the invoice image, the approval entry in WeCom or Feishu, company reimbursement rules, invoice title, user identity, and the last template used for a similar reimbursement. The system must trim this information to what is sufficient for the task, without handing the whole album, whole chat history, or all company documents to the cloud.</p><p>The third object is Capability. The system must know what capabilities can finish the task: OCR, invoice verification, the enterprise app’s reimbursement AppFunction, browser form filling, company intranet API, file upload, and message notification. Each capability has a source, permission, cost, reliability, execution duration, and risk level.</p><p>The fourth object is Plan. The Agent will break the task into steps, but the plan should not live only inside model context. It should be recorded by the system as an inspectable structure: read invoice, extract fields, verify authenticity, open reimbursement entry, fill form, upload attachment, wait for user confirmation, submit, save receipt. Then the user, system, and developer can know where the task is.</p><p>The fifth object is Permission Grant. Traditional app permission asks “can this app access the camera?” Agent permission asks “can this reimbursement task read these three photos, access this company reimbursement entry, submit the form, and must submission be confirmed first?” It is shorter, finer-grained, and more dependent on task state than app permission.</p><p>The sixth object is Artifact. Task outputs include reimbursement drafts, submission receipts, invoice fields, approval numbers, failure screenshots, and operation logs, not just an answer sentence. These Artifacts must enter history and be available to later tasks.</p><p>The seventh object is Audit. What the Agent did, whom it called, which data it used, which step the user confirmed, which step was automatic, and where failure happened must all be traceable. Without Audit, once the Agent makes a mistake, neither users nor vendors can determine responsibility.</p><p>This object model relates to existing Android objects, but cannot be fully reused.</p><p>Activity is for UI. Service is for background execution. Broadcast is for event distribution. ContentProvider is for structured data. Intent is for component invocation. They solve how apps cooperate with each other. They do not solve how a cross-app goal keeps running, waits for user confirmation, migrates between cloud and device, or recovers after failure.</p><p>Agent OS needs to add task objects above these traditional objects, wrapping Activity and Service in a higher-level task semantics.</p><p>One way to understand the relationship is:</p><figure class="highlight plaintext"><table><tr><td class="gutter"><pre><span class="line">1</span><br><span class="line">2</span><br><span class="line">3</span><br><span class="line">4</span><br><span class="line">5</span><br><span class="line">6</span><br><span class="line">7</span><br><span class="line">8</span><br><span class="line">9</span><br><span class="line">10</span><br><span class="line">11</span><br></pre></td><td class="code"><pre><span class="line">Old Android objects:</span><br><span class="line">App / Activity / Service / Intent / Permission / Notification</span><br><span class="line"></span><br><span class="line">New Agent OS objects:</span><br><span class="line">Task / Step / Capability / Context / Artifact / Grant / Audit</span><br><span class="line"></span><br><span class="line">Migration direction:</span><br><span class="line">Users no longer directly manage Activity stacks; they manage Task state.</span><br><span class="line">Apps no longer expose only UI and Intent; they expose Capability.</span><br><span class="line">Permissions are no longer only long-term app grants; they are temporary Task grants.</span><br><span class="line">Notifications expand from app events into Task progress.</span><br></pre></td></tr></table></figure><p>This is also why Agent OS cannot be done by an independent app. A third-party app can maintain its own Tasks, but it has no authority to unify all apps’ capabilities, permissions, context, and audit records. Only the system layer can do that.</p><h3 id="The-Relationship-Between-Task-Stream-and-Notification-Center"><a href="#The-Relationship-Between-Task-Stream-and-Notification-Center" class="headerlink" title="The Relationship Between Task Stream and Notification Center"></a>The Relationship Between Task Stream and Notification Center</h3><p>The first thing the system layer must do is organize fragmented events into tasks. This is also the part most easily confused with the notification center.</p><p>Many vendors will start from notification center changes because notifications are natural entries for “something happened.” Directions such as Samsung Now Brief and Now Bar have value for exactly this reason. They try to reorganize fragmented events into “things the user needs to handle today,” and their value comes from reorganizing events into tasks.</p><p>But a task stream cannot simply equal a notification center.</p><p>A notification is an event an app sends to the user. A task is a goal the user or system needs to complete. Notifications can trigger tasks, and tasks can generate notifications, but they are not the same object.</p><p>For example, an airline app pushes “flight delayed by two hours.” That is a notification. After Agent OS receives it, it can generate a task: “Should pickup time, hotel check-in, meeting schedule, and colleague notification be adjusted?” This task reads calendar, maps, hotel orders, chat contacts, and company meeting arrangements, then asks the user to confirm. The notification is only the starting point. The task is the object the system must manage.</p><p>Another example: a school group sends 20 messages, and only one is about materials due tomorrow. A traditional notification center can only show app pushes. An AI summary can summarize the chat. Agent OS must go further and generate a task: “Print and fill the form before 9 p.m. tonight, and take it to school tomorrow morning.” It needs to connect files, printer, calendar, reminders, and family members.</p><p>So a task stream is more like a lightweight project manager. Its objects are life and work to-dos, not a notification list.</p><p>This brings a product constraint: the task stream must be restrained. A phone that proactively creates 30 tasks a day will be disabled quickly. The system needs reminder budgets, interruption levels, quiet hours, family&#x2F;work modes, and user feedback. The difficulty of a task stream is filtering out tasks that should not appear.</p><h2 id="3-The-Android-Path-From-Super-App-to-System-Service"><a href="#3-The-Android-Path-From-Super-App-to-System-Service" class="headerlink" title="3. The Android Path: From Super App to System Service"></a>3. The Android Path: From Super App to System Service</h2><p>Android has natural advantages for Agent OS, and obvious burdens.</p><p>The advantages are openness, modifiability, broad hardware coverage, OEM access to system permissions, and many reusable framework components. Binder fits high-frequency IPC on the same device. PackageManager fits capability registration. PermissionController fits authorization. ActivityTaskManager and WindowManager fit foreground&#x2F;background state. NotificationManager fits long-task visibility. AppSearch fits local indexing. Keystore and StrongBox fit credential protection. JobScheduler fits long-task scheduling. ContentProvider fits structured data access.</p><p>The burdens are fragmentation, historical permission baggage, the split between Google services and AOSP, too many vendor-private interfaces, complex background restrictions, and top apps’ natural suspicion toward automation. An Android Agent that wants to move from “can tap the screen” to “can reliably finish tasks” must cross three technical paths.</p><p>The first path is GUI Agent. It uses screenshots, accessibility, input injection, Virtual Display, UI hierarchy, OCR&#x2F;VLM, and similar methods to simulate a human operating apps. The advantage is that it covers long-tail apps without developer cooperation. The shortcomings are also obvious: it is slow, vulnerable to UI changes, and easily touches security boundaries. Payment, social, banking, and gaming platforms will naturally guard against it.</p><p>The Doubao phone pushed this path onto real devices. It showed the industry both usability and boundaries. System-level permissions, Virtual Display, on-device visual understanding, and cloud OpenClaw&#x2F;ArkClaw together can complete many cross-app actions. But third-party app restrictions also show that “tapping the screen like a human” cannot support the long-term main path.</p><p>The second path is structured capability. Android AppFunctions, Apple App Intents, vendor SDKs, MCP tools, and private APIs all fall into this category. It requires apps to actively declare “what I can do,” and provide parameters, permissions, return values, and risk levels. The advantage is stability, speed, and auditability. It fits operations such as payment, sending messages, creating calendar events, generating documents, and submitting orders. The drawback is developer cooperation, and top apps will not easily give up foreground entry.</p><p>The third path is Agent protocol. A2A solves how Agents discover each other, delegate tasks, pass messages, and deliver Artifacts. MCP solves how Agents use tools and data sources. On phones, they will not replace Android IPC, but coexist at different layers. On the same device, Binder is a better fit. Across devices and the cloud, network protocols fit better.</p><p>A more reasonable short-term Android structure looks like a router:</p><figure class="highlight plaintext"><table><tr><td class="gutter"><pre><span class="line">1</span><br><span class="line">2</span><br><span class="line">3</span><br><span class="line">4</span><br><span class="line">5</span><br><span class="line">6</span><br><span class="line">7</span><br><span class="line">8</span><br><span class="line">9</span><br><span class="line">10</span><br></pre></td><td class="code"><pre><span class="line">User goal</span><br><span class="line">  ↓</span><br><span class="line">On-device intent recognition and risk judgment</span><br><span class="line">  ↓</span><br><span class="line">Capability routing</span><br><span class="line">  ├─ AppFunctions / App Intents / private APIs: preferred</span><br><span class="line">  ├─ A2A / MCP: cross-Agent and cross-cloud tools</span><br><span class="line">  └─ GUI Agent: long-tail apps and temporary compatibility</span><br><span class="line">  ↓</span><br><span class="line">Task state, user confirmation, audit log, result archive</span><br></pre></td></tr></table></figure><p>This is also the mistake Android vendors should avoid in the short term: turning Agent OS into a super app with all permissions. A super app can make demos, but it cannot support a system architecture. The scalable long-term approach is to split the Agent into system services, capability declarations, task state machines, data classification, and user-visible control.</p><h3 id="Where-Existing-Android-Components-Can-Migrate"><a href="#Where-Existing-Android-Components-Can-Migrate" class="headerlink" title="Where Existing Android Components Can Migrate"></a>Where Existing Android Components Can Migrate</h3><p>Android does not start from zero. From a platform engineering perspective, many Agent OS parts can migrate from existing system abstractions.</p><p>PackageManager can continue discovering installed apps, but it needs to extend capability indexing. In the past, PackageManager cared about Activity, Service, Receiver, Provider, Permission, and Feature. Agent OS also needs to know which AppFunctions an app declares, whether it provides an AgentCard, which schemas the system can call, which capabilities need human confirmation, and which capabilities can only be used under enterprise policy.</p><p>PermissionController can continue handling authorization UI and permission records, but it needs task-level grants. Traditional permission is often “allow this app to access the camera.” Agent permission is more like “allow this task to read these three images and upload them to this service, but show a preview before upload.” This kind of grant should not be permanently attached to an app. It should bind to Task, Step, and Artifact.</p><p>ActivityTaskManager can continue providing foreground&#x2F;background state, task stacks, and window information, but Agent OS needs usable semantic snapshots, not raw copying of the user’s current screen. The system should expose structured summaries: current app, page type, actionable elements, sensitive regions, whether the user is typing, and whether a payment, verification code, or privacy screen is visible. Exposing raw screen content to the cloud brings high risk.</p><p>NotificationManager can become the natural outlet for task state. A long task should not stay only inside an assistant app. It should enter system notifications, lock screen, watch, and car. But notifications also need to upgrade: not just title and body, but state, progress, next action, risk prompt, pause&#x2F;cancel&#x2F;confirm buttons.</p><p>AppSearch can become part of local semantic indexing. The device needs to quickly find notes, files, calendar events, contacts, historical tasks, common places, and user preferences. AppSearch fits local indexing, but sensitive data must be split by policy. The system cannot dump everything into an index that an Agent can read freely.</p><p>ContentProvider remains the base for structured data access, but its permission model needs to be finer. An app may allow the Agent to read one order status, but not the full order history. It may allow reading an attachment in one chat, but not the whole chat context.</p><p>Keystore, StrongBox, TEE, and secure elements become more important. On an Agent phone, credentials, payments, Passkeys, enterprise certificates, private memory, and sensitive vector indexes all need hardware-level protection. The Agent can prepare actions, but final signing and confirmation should happen inside a security boundary.</p><p>JobScheduler, WorkManager, AlarmManager, and push can support long-task scheduling, but Agent tasks are more complex than ordinary background tasks. A task may run in the cloud while the device only waits for callbacks. It may execute halfway on device, lose network, and resume later. It may migrate across devices. The system needs to connect task state with the scheduling system.</p><p>RoleManager and default assistant roles will become key entry-point battlegrounds. Android has used RoleManager to manage default dialer, SMS, browser, assistant, and similar roles; input method uses a separate InputMethodManager path. Agent OS may need “default Agent,” “default task manager,” and “default capability router.” This will create a new contest among platform, OEM, and third-party assistants.</p><p>Put these components together and Android can take a pragmatic short-term evolution path:</p><figure class="highlight plaintext"><table><tr><td class="gutter"><pre><span class="line">1</span><br><span class="line">2</span><br><span class="line">3</span><br><span class="line">4</span><br><span class="line">5</span><br><span class="line">6</span><br><span class="line">7</span><br><span class="line">8</span><br><span class="line">9</span><br><span class="line">10</span><br><span class="line">11</span><br><span class="line">12</span><br><span class="line">13</span><br><span class="line">14</span><br><span class="line">15</span><br><span class="line">16</span><br><span class="line">17</span><br><span class="line">18</span><br><span class="line">19</span><br><span class="line">20</span><br></pre></td><td class="code"><pre><span class="line">SystemUI / Launcher</span><br><span class="line">  Show Task Stream, confirmation cards, and task history</span><br><span class="line"></span><br><span class="line">AgentManagerService</span><br><span class="line">  Manage Agent, Task, Capability, Grant, and Audit</span><br><span class="line"></span><br><span class="line">CapabilityRegistry</span><br><span class="line">  Aggregate AppFunctions, AgentCard, MCP tools, system capabilities, private extensions</span><br><span class="line"></span><br><span class="line">ContextService</span><br><span class="line">  Provide minimized semantic snapshots, not unbounded screen reading</span><br><span class="line"></span><br><span class="line">PolicyService</span><br><span class="line">  Handle data classification, user consent, enterprise policy, compliance rules</span><br><span class="line"></span><br><span class="line">ModelRuntimeService</span><br><span class="line">  Schedule on-device LLM/VLM/embedding/rerank/intent models</span><br><span class="line"></span><br><span class="line">CloudBridge</span><br><span class="line">  Sync Task, Artifact, Push, and Audit with cloud Agent runtime</span><br></pre></td></tr></table></figure><p>This structure does not require Android to be rebuilt immediately. It is more like adding a set of high-privilege system services to the current Android stack, then gradually opening developer interfaces. OEMs will likely implement it privately in the short term. Only later might AOSP, GMS, or industry protocols absorb it.</p><h3 id="The-Right-Position-for-A2A-on-Android"><a href="#The-Right-Position-for-A2A-on-Android" class="headerlink" title="The Right Position for A2A on Android"></a>The Right Position for A2A on Android</h3><p>A2A deserves a separate explanation because it is not just another “tool-calling” protocol.</p><p>A2A stands for Agent2Agent. It was launched by Google with 50+ partners in April 2025 and transferred to Linux Foundation governance in June 2025. Its official positioning is clear: allow Agents from different vendors, frameworks, and runtime environments to discover each other, delegate tasks, exchange progress, and deliver results.</p><p>Its design assumption is that Agents are black boxes to each other. A travel Agent does not need to know which model, prompt, tool, or database a reimbursement Agent uses internally. It only needs to know what the other side can do, how to authenticate, how to submit a task, what state the task is in, and what result will be returned.</p><p>This differs from MCP. MCP solves how an Agent calls tools, resources, and data sources. For example, an Agent uses MCP to access the filesystem, database, browser, Jira, or Feishu docs. A2A solves how an Agent calls another Agent. The former is more like a tool socket. The latter is more like a task delegation language.</p><p>This distinction is useful on phones.</p><p>If the user says, “Plan my Tokyo trip next month, keep it under 8,000, avoid red-eye flights, and send the itinerary to my colleagues,” the phone-side system Agent can read calendar, location, payment-confirmation state, and contacts. But it does not have to do everything itself. It can delegate flight and hotel comparison to a travel Agent, visa material checking to a document Agent, company travel rules to an enterprise Agent, and leave final confirmation and payment on the phone.</p><p>If every Agent has a private interface, this quickly becomes unmanageable. A2A tries to provide a common vocabulary.</p><p>The first term is AgentCard. It is the Agent’s capability card: who I am, what I can do, which inputs and outputs I support, what authentication I need, whether I support streaming, and whether I support push after task completion. On Android, it resembles a Manifest for Agents. An app or system service can declare “I have a travel Agent,” “I have an image-editing Agent,” or “I have an enterprise reimbursement Agent.” The system indexes these cards.</p><p>The second term is Task. A2A Task is a stateful work unit, not a single API request. It can be submitted, working, input-required, auth-required, completed, canceled, failed, rejected, unknown, and so on. This fits phones because real tasks often span time: ticket booking waits for price, food delivery waits for rider, approval waits for manager, video export waits for processing, reimbursement waits for submission. Users need to see task state, not just a model reply.</p><p>The third set of terms is Message &#x2F; Part &#x2F; Artifact. Message is a conversation turn in the task process. Part can be text, file, or structured data. Artifact is the deliverable. Phone Agents need to pass images, PDFs, spreadsheets, orders, calendar events, location, credential references, and operation results. Artifact is especially suitable for Agent OS because task results must be saved, shared, audited, and referenced later. A travel task’s Artifacts can include itinerary, hotel candidate table, budget table, calendar events, and payment confirmation record.</p><p>The fourth capability is Streaming and Push. Many phone tasks do not finish in seconds. Users cannot stare at a chat window while a cloud Agent completes research, comparison, approval, or video processing. A2A’s streaming updates and asynchronous callback semantics fit the pushback of “task started,” “more information needed,” “authorization needed,” “completed,” or “failed reason” to phone notifications, lock screen, and task stream.</p><p>So A2A’s value for Agent OS is not that it adds one more network protocol. Its value is standardizing several of the hardest objects in Agent collaboration: who can do what, what state the task is in, how the process communicates, and how results are delivered.</p><p>But A2A should not be inflated into the whole answer for Android Agent OS.</p><p>First, A2A is natively aimed at cross-system, cross-network, cross-vendor Agent communication. It fits a phone-side Agent calling cloud OpenClaw, ChatGPT Agent, enterprise Agent, car Agent, or home Agent, and it fits Agent delegation between companies.</p><p>Second, on the same Android device, A2A semantics are worth borrowing, but the transport layer should not simply copy HTTP&#x2F;JSON-RPC. Android’s local IPC path is Binder. Making local Agents go through loopback HTTP every time adds latency and bypasses existing UID, SELinux, permission, lifecycle, and other security models. A better direction is A2A over Binder: keep AgentCard, Task, Message, Artifact semantics, but use Binder for transport, with permissions and audit handled by system services.</p><p>Third, A2A needs a division of labor with AppFunctions. AppFunctions are structured functions for a system Agent to call local apps, such as <code>createNote(title, content)</code>, <code>searchPhotos(query)</code>, and <code>sendMessage(contact, text)</code>. A2A is for one Agent delegating a task to another Agent, such as “organize this batch of photos into a travel album” or “handle reimbursement according to company rules,” where autonomy, follow-up questions, and long execution are needed.</p><p>A more reasonable Android stack looks like this:</p><figure class="highlight plaintext"><table><tr><td class="gutter"><pre><span class="line">1</span><br><span class="line">2</span><br><span class="line">3</span><br><span class="line">4</span><br><span class="line">5</span><br><span class="line">6</span><br><span class="line">7</span><br><span class="line">8</span><br><span class="line">9</span><br><span class="line">10</span><br><span class="line">11</span><br></pre></td><td class="code"><pre><span class="line">User goal</span><br><span class="line">  ↓</span><br><span class="line">Phone-side system Agent</span><br><span class="line">  ├─ AppFunctions → local app atomic capabilities</span><br><span class="line">  ├─ MCP / private tools → cloud or local tools</span><br><span class="line">  ├─ GUI Agent → long-tail app compatibility path</span><br><span class="line">  └─ A2A → local / cloud / cross-device Agent collaboration</span><br><span class="line">        ├─ Cloud long-task Agent</span><br><span class="line">        ├─ Enterprise Agent</span><br><span class="line">        ├─ Car / home Agent</span><br><span class="line">        └─ Third-party service Agent</span><br></pre></td></tr></table></figure><p>Fourth, A2A still lacks pieces a phone OS must supply. It can describe Task state, but it does not own Android permission UI. It supports async callbacks, but does not guarantee strict event replay across all implementations. It can pass Artifacts, but it does not define data classification, device-cloud boundary, payment confirmation, or failure rollback for the system. Agent OS must add Policy, Consent, Audit, Retry, Idempotency, and user-visible control above A2A.</p><p>Therefore the better position for A2A on Android is this: it does not replace Binder, AppFunctions, or the permission system. It should become the public semantic layer for Agent collaboration. Android’s job is to translate that semantics into its own system services, IPC, task stream, and permission model.</p><h3 id="The-Three-Technical-Routes-Will-Coexist-for-a-Long-Time"><a href="#The-Three-Technical-Routes-Will-Coexist-for-a-Long-Time" class="headerlink" title="The Three Technical Routes Will Coexist for a Long Time"></a>The Three Technical Routes Will Coexist for a Long Time</h3><p><img src="/en/images/Agent-OS-Task-Entry/03-capability-router.png" alt="Agent OS Capability Router"></p><p>After separating GUI Agent, AppFunctions, and A2A, the conclusion is clear: all three will coexist for a long time, but they occupy different positions.</p><p>GUI Agent is the compatibility layer. It solves the problem of “developers have not cooperated, the app exposes no capability, and the user wants the task done now.” It fits long-tail apps, transition periods, and low-risk operations visible to the user. It should not be the default path for high-risk actions such as payment, messaging, settings changes, data deletion, or ordering.</p><p>AppFunctions &#x2F; App Intents are the local capability layer. They let apps tell the system in a structured way: I can create notes, send messages, create events, search products, submit orders, generate images, or export videos. They need developer cooperation, but once scaled, they are more reliable, faster, and safer than GUI Agent.</p><p>A2A &#x2F; MCP are the collaboration and tool layer. MCP targets tools and data sources. A2A targets discovery, delegation, and delivery among Agents. A phone-side Agent needs similar protocols to coordinate with cloud Agents, car Agents, computer Agents, and enterprise Agents. Protocols will not replace local APIs, but they make cross-device and cross-cloud tasks describable.</p><p>These three paths need a Capability Router. The user only expresses a goal. The system decides which path to use based on task type, risk level, available capabilities, network state, privacy level, and cost.</p><p>For example, “make this photo a little brighter” can be handled by an on-device model.</p><p>“Turn today’s meeting recording into minutes and send it to a Feishu group” should prefer transcription, documents, Feishu API or AppFunction, then ask the user to confirm sending.</p><p>“Compare three family trip routes for summer vacation, keep it under 20,000, and consider that the elderly cannot walk too much” can run long cloud queries and comparisons, while the phone syncs family calendar, location preferences, payment confirmation, and final choice.</p><p>“Cancel a subscription that is about to renew” is best if the app exposes structured capability. If not, GUI Agent can operate the settings page or webpage. When payment and account changes are involved, user confirmation is required.</p><p>This is why Agent OS is harder than an assistant app. An assistant app only needs to be a model entry point and apologize after failure. Once Agent OS promises execution, it faces real-world side effects. It cannot only be smart; it must be controllable, explainable, and recoverable.</p><h3 id="Short-term-Android-Agent-OS-Architecture-System-Services-Are-the-Main-Battlefield"><a href="#Short-term-Android-Agent-OS-Architecture-System-Services-Are-the-Main-Battlefield" class="headerlink" title="Short-term Android Agent OS Architecture: System Services Are the Main Battlefield"></a>Short-term Android Agent OS Architecture: System Services Are the Main Battlefield</h3><p><img src="/en/images/Agent-OS-Task-Entry/04-android-agentos-architecture.png" alt="Short-term Android Agent OS Architecture"></p><p>After the three Android paths, we can converge them into one system architecture.</p><p>This structure should not be treated as the final Agent OS architecture. It is more like a pragmatic Android evolution path from 2026 to 2028: keep Android and the kernel mainline, and add a group of Task-centered system services across SystemUI, Framework, permissions, notifications, on-device model runtime, and cloud Agent Runtime.</p><p>The architecture is easy to read.</p><p>The first layer is Agent UI &#x2F; Task Stream. Users see task state: running, waiting for confirmation, completed, failed, recoverable. They do not see model calls. Home screen, lock screen, notifications, floating entry points, and multi-device handoff become different outlets for task state.</p><p>The second layer is Agent Runtime. This is the semantic layer Android lacks most in the short term. TaskRuntime manages the state machine, Artifacts, cancellation, recovery, and rollback. ContextService provides minimized scene snapshots. CapabilityRouter routes among AppFunctions, A2A, MCP, and GUI Agent. MemoryService manages short context, long-term preferences, and deletable memory. Policy &#x2F; Consent &#x2F; Audit handles authorization, consent, risk classification, and responsibility records.</p><p>The third layer is Android Framework. Android does not need to write an OS from scratch. PackageManager, PermissionController, ActivityTaskManager, NotificationManager, AppSearch, ContentProvider, Credential, Keystore, StrongBox, JobScheduler, and RoleManager can all continue to work. The change is that these old objects are wrapped by a higher-level Task semantics.</p><p>The fourth layer is Sandbox &amp; Runtime. ART still runs Java&#x2F;Kotlin apps. Native runtime still handles high-performance execution. Isolated process, Privacy Sandbox SDK Runtime, Microdroid, or similar virtualization capabilities can carry stronger isolation. On-device model runtime, embedding, VLM preprocessing, and GUI automation sandbox should also be scheduled at this layer.</p><p>The fifth layer is HAL &#x2F; Kernel &#x2F; Hardware. It provides NPU&#x2F;GPU&#x2F;CPU, memory tiers, low-power sensor hub, TEE&#x2F;SE, Binder, SELinux, cgroup, seccomp, mmap CoW, TEE drivers, and other resource and security foundations. The kernel should not carry Agent task semantics. It should be responsible for resources, security, isolation, and performance.</p><p>On the right is Cloud Agent Runtime. An Agent phone must be a device-cloud organism. The cloud handles long-task sandboxing, browser, code tools, document tools, long-term memory, A2A gateway, push callbacks, and data policy. The device handles live context, privacy, confirmation, and braking. What synchronizes between them is Task, Artifact, authorization, audit, and state, not an unbounded chat transcript.</p><p>This structure contains several key choices.</p><p>First, put Task Runtime in a first-class position. The foreground of Agent OS is the task stream; the chat box is only one entry point. The system must manage task state, Artifacts, progress, failure, cancellation, rollback, and history. Without Task Runtime, Agent OS easily falls back into “assistant app plus notification.”</p><p>Second, separate Policy &#x2F; Consent &#x2F; Audit from Access manager. Agent operation on a phone is not ordinary permission asking. It needs to answer: is this task allowed, does this step require confirmation, is the result traceable, can the user revoke it, and who is responsible? Payment, messaging, file deletion, order submission, and external publishing all need audit and consent. The permission system can answer “can it access,” but cannot fully answer “should it execute.”</p><p>Third, distinguish Android, GMS, and vendor-built capabilities. AICore is Google’s system-app-based on-device foundation model service for Pixel and partner OEMs, hosting Gemini Nano. It is not part of AOSP, and Chinese ROMs do not naturally have it. Also note that Apple Private Cloud Compute (PCC) and Android Private Compute Core (also abbreviated PCC, hosted by Android System Intelligence) are different systems. They should not be conflated. Chinese vendors are more likely to replace them with self-built model services and local compliance clouds.</p><p>Fourth, do not describe ART as Agent Runtime. ART will continue to handle app execution, JIT&#x2F;AOT, profile optimization, and part of the process model. Agent Runtime is unlikely to evolve directly from ART. A more likely structure is Agent Runtime as system services and sandbox runtime, built above ART, native runtime, isolatedProcess, SDK Runtime, and Microdroid&#x2F;virtualization capabilities.</p><p>Fifth, split Memory. Agent “memory” has at least four types: current context snapshot, long-term user preferences, intermediate task state, and model KV&#x2F;cache plus embedding indexes. Their security level, lifecycle, storage location, and deletion mechanism are different. Calling all of them Semantic memory hides engineering boundaries.</p><p>The basic judgment for short-term Android Agent OS is that the main battlefield is not the kernel, not Launcher alone, and not a single super-assistant app. It is between Framework&#x2F;SystemUI&#x2F;privileged services and cloud Agent Runtime.</p><h4 id="At-the-Engineering-Service-Level-at-Least-Four-Groups-Are-Needed"><a href="#At-the-Engineering-Service-Level-at-Least-Four-Groups-Are-Needed" class="headerlink" title="At the Engineering-Service Level, at Least Four Groups Are Needed"></a>At the Engineering-Service Level, at Least Four Groups Are Needed</h4><p>If this architecture is further decomposed into Android engineering services, the Framework layer needs at least four groups.</p><p>The first group is Task services:</p><figure class="highlight plaintext"><table><tr><td class="gutter"><pre><span class="line">1</span><br><span class="line">2</span><br><span class="line">3</span><br><span class="line">4</span><br><span class="line">5</span><br></pre></td><td class="code"><pre><span class="line">TaskManagerService</span><br><span class="line">TaskStateStore</span><br><span class="line">ArtifactProvider</span><br><span class="line">TaskHistoryProvider</span><br><span class="line">TaskNotificationAdapter</span><br></pre></td></tr></table></figure><p>TaskManagerService creates, resumes, cancels, and schedules tasks. TaskStateStore saves task state and steps. ArtifactProvider manages task outputs. TaskHistoryProvider lets users and the system query history. TaskNotificationAdapter syncs tasks to notifications, lock screen, watch, and car.</p><p>This group decides whether Agent OS is more than a chat UI. Without it, the system cannot turn “help me do something” into a visible, controllable, recoverable object.</p><p>The second group is Capability services:</p><figure class="highlight plaintext"><table><tr><td class="gutter"><pre><span class="line">1</span><br><span class="line">2</span><br><span class="line">3</span><br><span class="line">4</span><br><span class="line">5</span><br></pre></td><td class="code"><pre><span class="line">CapabilityRegistryService</span><br><span class="line">AppFunctionIndexer</span><br><span class="line">AgentCardRegistry</span><br><span class="line">McpToolBridge</span><br><span class="line">GuiAutomationBroker</span><br></pre></td></tr></table></figure><p>CapabilityRegistryService aggregates all callable capabilities. AppFunctionIndexer handles Android AppFunctions. AgentCardRegistry handles local and remote Agent declarations. McpToolBridge connects tool services. GuiAutomationBroker manages temporary authorization and execution boundaries for GUI automation.</p><p>This group decides whether the system can find executable capability from a user goal. Without a unified index, the Agent can only guess with the model, and will fall back to unstable screen tapping.</p><p>The third group is Context and Memory services:</p><figure class="highlight plaintext"><table><tr><td class="gutter"><pre><span class="line">1</span><br><span class="line">2</span><br><span class="line">3</span><br><span class="line">4</span><br><span class="line">5</span><br></pre></td><td class="code"><pre><span class="line">ContextSnapshotService</span><br><span class="line">SemanticIndexService</span><br><span class="line">PreferenceMemoryService</span><br><span class="line">EphemeralTaskMemory</span><br><span class="line">MemoryDeletionService</span><br></pre></td></tr></table></figure><p>ContextSnapshotService provides the current scene’s minimum semantic snapshot. SemanticIndexService manages local indexes. PreferenceMemoryService saves long-term preferences. EphemeralTaskMemory saves intermediate state while tasks run. MemoryDeletionService provides visible deletion and verifiable deletion.</p><p>This group decides whether the Agent understands the user, and whether the user is willing to be understood. Once memory becomes a black box, trust drops quickly.</p><p>The fourth group is Policy and Security services:</p><figure class="highlight plaintext"><table><tr><td class="gutter"><pre><span class="line">1</span><br><span class="line">2</span><br><span class="line">3</span><br><span class="line">4</span><br><span class="line">5</span><br><span class="line">6</span><br></pre></td><td class="code"><pre><span class="line">AgentPolicyService</span><br><span class="line">ConsentManager</span><br><span class="line">AuditLogService</span><br><span class="line">RiskClassifier</span><br><span class="line">EnterprisePolicyAdapter</span><br><span class="line">SecureExecutionBroker</span><br></pre></td></tr></table></figure><p>AgentPolicyService handles data classification and execution rules. ConsentManager manages each confirmation. AuditLogService records calls and side effects. RiskClassifier judges action risk. EnterprisePolicyAdapter connects to company MDM or compliance policy. SecureExecutionBroker places payment, credentials, signing, Passkey, and high-sensitivity actions inside a security boundary.</p><p>This group decides whether the system can take responsibility. Without it, every new Agent permission is another incident entry point.</p><p>These four service groups can coexist with macro modules such as Agent scheduler, Memory manager, Context manager, and Access manager. Macro architecture helps people understand layers. Engineering decomposition explains what services must actually be added to the system. Agent OS system services are a set of task-, capability-, context-, and policy-coordinated services. They should not be reduced to four big boxes.</p><h4 id="Judgment-on-the-Kernel-Layer"><a href="#Judgment-on-the-Kernel-Layer" class="headerlink" title="Judgment on the Kernel Layer"></a>Judgment on the Kernel Layer</h4><p>Architecture diagrams can include wording such as “Linux kernel &#x2F; Agent OS kernel support,” but the language must be careful.</p><p>Agent OS does not need an “Agent kernel” in the short term. It needs existing Linux&#x2F;Android kernel capabilities to be used better: cgroup for resource control, SELinux for access constraints, seccomp for syscall restriction, Binder for local IPC, mmap CoW for sharing model weights, mmap + madvise or io_uring for on-demand weight loading, userfaultfd and similar mechanisms for ART GC and finer-grained memory management, and TEE drivers for secure hardware.</p><p>Agent semantics should not be pushed into the kernel. The kernel should answer resource, security, isolation, and performance questions. What a Task is, what an Artifact is, where user confirmation happens, and which data can go to the cloud should be handled in Framework, system services, and cloud policy.</p><p>Android vendors should make this clear early. Do not heavily modify the kernel mainline just for “Agent OS.” In the short term, the more valuable investment is System Server, HAL runtime, on-device model service, SystemUI, permission UI, and cloud protocols. Kernel optimization should serve model-weight sharing, low-power residency, sandbox isolation, and secure execution, not business semantics.</p><h2 id="4-OpenAI’s-Fork-Android-based-or-Not-Android-based"><a href="#4-OpenAI’s-Fork-Android-based-or-Not-Android-based" class="headerlink" title="4. OpenAI’s Fork: Android-based or Not Android-based"></a>4. OpenAI’s Fork: Android-based or Not Android-based</h2><p>After clarifying the Android route, we can return to OpenAI. We should not assume OpenAI must use Android.</p><p>If OpenAI does not build on Android, it gets a cleaner design space. The home screen can be a task stream from day one. Permissions can be designed around Agent tasks from day one. Apps are no longer the default center. Cloud long-term memory and subscriptions can be deeply bound. It does not have to compromise with Android history or force every function into the old Activity&#x2F;Intent&#x2F;Service&#x2F;Broadcast model.</p><p>But it immediately faces a harder question: where do the services users need every day come from?</p><p>The difficulty of phone OS extends from kernel, UI, drivers, and system APIs into the app and service network. WeChat, WhatsApp, Instagram, TikTok, YouTube, Uber, DoorDash, Google Maps, Alipay, Meituan, banks, company MDM, carrier services, government apps, school apps, access-control apps, and medical apps are also real-life entry points.</p><p>A non-Android OpenAI phone that wants to become a primary device must choose several compensation paths.</p><p>First, use Web&#x2F;PWA. Many services can be completed through the web. A cloud Agent can operate a browser, while the phone provides confirmation and credentials. But web still lags native apps in payment, notifications, offline use, performance, sensors, background execution, and local capability. Top platforms may also restrict automated access.</p><p>Second, use cloud app proxies. The Agent opens webpages, calls APIs, runs browsers, or simulates terminals in the cloud, while the phone only handles task entry and confirmation. This fits research, office work, shopping comparison, content processing, and lightweight services. It does not fit high-sensitivity payment, IM, banking, games, ride-hailing live location, or local device control.</p><p>Third, use an Android compatibility layer. The foreground is not Android, but it can run Android apps. This preserves service coverage, but the engineering difficulty and legal&#x2F;commercial negotiation are heavy. App vendors may also restrict the environment through device certification, integrity checks, and risk-control strategies.</p><p>Fourth, start as a companion device. Let the OpenAI device be the task entry, voice entry, memory entry, and cloud Agent entry, while relying on the user’s existing iPhone&#x2F;Android for sensitive actions. This avoids the pressure of replacing the primary device, but it raises the question: why not just use the ChatGPT app on the phone?</p><p>Fifth, target enterprise or high-end narrow scenarios. For example, an AI work phone for frequent business travelers, creators, developers, salespeople, doctors, lawyers, and researchers. It does not need to cover all consumer services immediately. If it wins high-value tasks, it can validate the Agent OS product form.</p><p>So the non-Android route is feasible, but it must accept a reality: without app compatibility, it is hard to become the first phone; with app compatibility, the old app model drags it back. If OpenAI wants a new OS, the more realistic path is to make task stream, cloud Agent, subscription, and a few high-value services work deeply first, then gradually expand callable capabilities.</p><p>From a system architecture perspective, the non-Android route still cannot avoid similar modules:</p><figure class="highlight plaintext"><table><tr><td class="gutter"><pre><span class="line">1</span><br><span class="line">2</span><br><span class="line">3</span><br><span class="line">4</span><br><span class="line">5</span><br><span class="line">6</span><br><span class="line">7</span><br><span class="line">8</span><br><span class="line">9</span><br></pre></td><td class="code"><pre><span class="line">Task Stream Shell</span><br><span class="line">  ↓</span><br><span class="line">Agent Runtime / Policy / Memory / Capability Registry</span><br><span class="line">  ↓</span><br><span class="line">App Compatibility Layer / Web Runtime / Cloud Tool Runtime</span><br><span class="line">  ↓</span><br><span class="line">Linux or custom kernel primitives</span><br><span class="line">  ↓</span><br><span class="line">SoC, secure element, sensors, modem, power management</span><br></pre></td></tr></table></figure><p>It may not be called Android, but the underlying principles remain similar. An OS must manage identity, permissions, processes, storage, network, display, input, sensors, security, and developer interfaces. Agent OS raises “tasks” and “capability calls” to a higher priority. It does not eliminate the basics.</p><p>In other words, the Android versus non-Android difference is not “whether there is an Agent.” It is “how to carry the old world.” The Android route carries the old world through compatibility and adds task stream in the foreground. The non-Android route defines a new world through task stream, then fills old-world gaps with web, cloud, and compatibility layers.</p><p>The former is steadier. The latter is cleaner. The former is easier to evolve gradually. The latter is more likely to produce a paradigm sample. OpenAI’s advantage is exactly that it has no App Store, no Launcher, and no OEM legacy baggage, so it can dare to put task stream on the first screen. Its weakness also comes from here: it has none of that baggage, and none of those assets.</p><h3 id="Three-Prototype-Forms-for-a-Non-Android-Route"><a href="#Three-Prototype-Forms-for-a-Non-Android-Route" class="headerlink" title="Three Prototype Forms for a Non-Android Route"></a>Three Prototype Forms for a Non-Android Route</h3><p>If OpenAI really does not use Android, it probably will not start with a “complete phone OS.” Three prototype types are more likely.</p><p>The first is a task-terminal phone.</p><p>It has a screen, cellular network, camera, and voice entry. It may make calls and receive SMS, but the first screen is not an app grid at all. Its main interface is a ChatGPT Task Stream: pending tasks, running tasks, tasks waiting for confirmation, completed Artifacts. App compatibility depends on web, cloud browser, and a few native services. It looks like a phone, but does not try to fully copy an Android phone.</p><p>This device fits high-end users and high-value tasks: business travel, research writing, creative editing, sales follow-up, personal assistant work, developer workflows. It may not cover every life scenario, but it can establish a sample around “reducing cross-app operations.”</p><p>The second is a phone companion device.</p><p>It does not fight to be the first phone. It binds to the user’s existing iPhone or Android. It handles voice, memory, task initiation, cloud Agent, photo understanding, and lightweight confirmation. Actions involving payment, IM, banking, or company MDM still return to the primary phone for confirmation.</p><p>The advantage is lower entry cost and no need to solve app compatibility all at once. The disadvantage is the obvious user question: why not use the ChatGPT app on the phone? So it must be clearly better in always-on presence, low interruption, capture, and task continuity.</p><p>The third is an enterprise&#x2F;professional device.</p><p>OpenAI can first target high-value professions with an Agent OS device: doctors checking information and writing records, lawyers organizing cases and contracts, salespeople following up customers, researchers collecting information, journalists organizing interviews, creators processing material, developers handling code tasks. These devices do not need every consumer app to be compatible. They need deep cooperation with professional tools, enterprise systems, browsers, and filesystems.</p><p>This route sounds less like a mass-market phone, but it fits the early economics of Agent OS better. How much ordinary users will pay for “opening fewer apps” is uncertain. How much professional users will pay for “saving one hour of high-value work every day” is easier to calculate.</p><h3 id="The-Cost-of-OpenAI-Not-Using-Android"><a href="#The-Cost-of-OpenAI-Not-Using-Android" class="headerlink" title="The Cost of OpenAI Not Using Android"></a>The Cost of OpenAI Not Using Android</h3><p>The cost of a non-Android route can be split into six categories.</p><p>First is app availability. Without Android&#x2F;iOS native apps, many services can only use web or cloud proxies. The hardest things to replace in daily life are apps with payment, risk control, messaging, location, push, and local device capability, not webpages that a browser can open.</p><p>Second is accounts and identity. A phone is an identity container. Passkeys, SIM&#x2F;eSIM, carriers, bank certificates, company MDM, government services, and family sharing all require long-term accumulation and certification. A new OS must rebuild these relationships.</p><p>Third is developer motivation. Why would developers expose capabilities to OpenAI Agent OS? For new users, revenue share, lower support costs, or because users will abandon apps that do not integrate? Before installed base exists, this is hard to answer.</p><p>Fourth is platform responsibility. When an Agent submits an order, sends a message, publishes content, or handles a bill on behalf of the user, who is responsible when something goes wrong: user, OpenAI, service app, or merchant? Traditional OS can say “the app is responsible.” Agent OS cannot cut responsibility that easily.</p><p>Fifth is supply chain and support. Phones are low-tolerance hardware products. Baseband, antenna, RF, thermal design, battery life, drop resistance, repair, spare parts, regional certification, and carrier testing are not AI-company strengths. System manufacturing partners such as Luxshare can help, but product responsibility remains with the brand.</p><p>Sixth is user migration. Users will not abandon iMessage, WeChat history, photo libraries, wallets, health data, membership benefits, and car keys just because of a new entry point. OpenAI must provide a path of coexistence first, migration later.</p><p>So the non-Android route is better suited to defining a sample than becoming the global primary phone on day one. It can prove the value of task stream and cloud Agent, then force Android and iOS to absorb that form.</p><h3 id="If-OpenAI-Uses-Android-What-Must-It-Solve"><a href="#If-OpenAI-Uses-Android-What-Must-It-Solve" class="headerlink" title="If OpenAI Uses Android, What Must It Solve?"></a>If OpenAI Uses Android, What Must It Solve?</h3><p>Using Android is not easy either.</p><p>First, it must decide its relationship with Google. Does it use GMS? Does it preload Play Store? How does the default assistant compete with Gemini? Can AppFunctions, AICore, and Android AI APIs be deeply used by OpenAI? Without GMS, overseas app availability is affected. With GMS, system entry is constrained by platform rules.</p><p>Second, it must decide the position of Android apps inside the task stream. Does it keep a traditional Launcher, or put Launcher as a secondary entry? Does it always let users return to the app grid, or aggressively push Task Stream? The first generation probably must keep a fallback; otherwise users will feel unsafe at critical moments.</p><p>Third, it must solve permission credibility. If an OpenAI system assistant asks to read screen, notifications, calendar, location, photos, and messages, users will be highly sensitive. It must provide clearer explanations than ordinary Android permissions: which data is processed on device, which goes to the cloud, which is used only for this task, which will be remembered, and which will never be remembered.</p><p>Fourth, it must negotiate with top apps. Without structured capabilities, an OpenAI phone can only rely on GUI Agent to tap screens. If it relies on GUI Agent to tap screens, top apps will restrict it quickly. OpenAI must give service providers a reason: letting the Agent call you brings more transactions, less support cost, higher conversion, and divisible responsibility.</p><p>Fifth, it must manage hardware and model power consumption. If a ChatGPT-level experience continuously uses network, NPU, microphone, camera, and screen, users will feel heat and battery drain before they feel intelligence. The first hard metric of an Agent phone may become “after a full day always on, does the user still want to keep it enabled?” Model ranking is only part of the answer.</p><p>This is the difficulty of the Android route: it can become a phone faster, but is more easily dragged back by the old phone paradigm. A non-Android route can look more like Agent OS, but is harder to make into a phone.</p><h2 id="5-Device-Cloud-Hardware-Industry-and-Timeline"><a href="#5-Device-Cloud-Hardware-Industry-and-Timeline" class="headerlink" title="5. Device-Cloud, Hardware, Industry, and Timeline"></a>5. Device-Cloud, Hardware, Industry, and Timeline</h2><p>Doubao phone and device-cloud combinations such as OpenClaw&#x2F;ArkClaw provide a useful observation point: AI phones need device and cloud to work together. They cannot stop at on-device model plus cloud chat.</p><p>The device-side role is not to run a small model for show. The device must do five things.</p><p>First, real-time sensing. Screen, notifications, location, camera, microphone, Bluetooth, sensors, foreground Activity, clipboard, and system settings are only known on device.</p><p>Second, low-latency judgment. Wake word, intent classification, risk judgment, simple summaries, on-device embeddings, and on-device VLM preprocessing require low power and low latency. They are not suitable for cloud every time.</p><p>Third, privacy closure. Payment credentials, biometrics, health data, private IM content, sensitive photos, precise location, and company-managed data cannot be freely read by the cloud. The device needs private compute areas and minimal context trimming.</p><p>Fourth, final confirmation. The Agent can suggest and prepare, but money, messages, orders, deletion, publication, and authorization often need user confirmation on device. Confirmation carries responsibility boundaries and cannot be treated as ordinary UI detail.</p><p>Fifth, interruption and braking. Users must be able to stop tasks, revoke grants, view history, and delete memory at any time. This control should be held by the device-side system, not hidden inside a cloud conversation.</p><p>The cloud’s role is not just “a larger model” either. The cloud must carry long tasks that the device should not bear.</p><p>First, long-running execution. Booking travel, organizing research, reviewing contracts, writing reports, editing videos, running code, comparing prices, and contacting multiple services are not one-request tasks. They may last minutes, hours, or days.</p><p>Second, tool environments. Browsers, code sandboxes, filesystems, crawlers, document processing, spreadsheets, image generation, and audio&#x2F;video processing can be started from device, but should not all be hosted there.</p><p>Third, long-term memory. User preferences, style, common routes, work habits, family relationships, and project context need to accumulate across devices, sessions, and years. The device can store indexes and sensitive truths. The cloud can store memory graphs filtered by policy.</p><p>Fourth, Agent collaboration. Complex tasks split into sub-tasks: research, comparison, execution, verification, writing, scheduling, notification. The cloud is better suited to running multiple isolated sub-Agents at the same time.</p><p>Fifth, cross-device continuity. The user starts a task on phone, continues editing on computer, hears progress in earbuds, confirms a route in the car. The Agent should bind to user identity and task state, not a single device.</p><p>The device-cloud boundary needs a protocol layer containing task state, messages, Artifacts, permissions, data classification, push callbacks, failure recovery, and audit identifiers. Plain HTTPS APIs are not enough. A2A’s Task, Message, Part, Artifact, streaming, and push notification designs can be references. Android local execution may not use HTTP A2A, but these abstractions fit Binder or internal system services well.</p><p>From device-cloud division of labor, future Agent-phone SoC design will also change. In the past, phone chips emphasized CPU&#x2F;GPU&#x2F;NPU peaks, ISP, baseband, and power. Agent phones add several persistent pressures:</p><ul><li>Low-power NPU use from continuous context understanding.</li><li>Memory pressure from multi-task state, embeddings, KV cache, and indexes.</li><li>Always-on scheduling of camera, microphone, sensors, and model preprocessing.</li><li>TEE&#x2F;StrongBox&#x2F;secure element hosting of credentials, payments, and private memory.</li><li>Network, push, resume, and background wakeups from device-cloud round trips.</li></ul><p>This explains why OpenAI, if serious about Agent phones, would care about processor co-design rather than only buying an off-the-shelf flagship SoC. AI Agent phone processors need to reallocate budget around continuous context, memory tiers, low-power sensing, and secure execution. They cannot be understood only as “phone chips with a larger NPU.”</p><h3 id="Data-Classification-Decides-Device-Cloud-Routing"><a href="#Data-Classification-Decides-Device-Cloud-Routing" class="headerlink" title="Data Classification Decides Device-Cloud Routing"></a>Data Classification Decides Device-Cloud Routing</h3><p><img src="/en/images/Agent-OS-Task-Entry/05-data-classification-routing.png" alt="Data Classification Determines Device-Cloud Routing"></p><p>Device-cloud division should not be decided only by model size. A more reasonable method is to decide jointly by data sensitivity, real-time needs, task duration, and side-effect risk.</p><p>Phone data can be roughly split into five layers.</p><p>L0 is public data. Weather, public webpages, public product information, and public traffic information can be processed directly in the cloud.</p><p>L1 is low-sensitivity personal data. For example, a user-provided requirement, current city, preferred hotel type, or public calendar title. This can go to the cloud after authorization, but should have a purpose and expiry.</p><p>L2 is medium-sensitivity personal data. For example, full calendar, shopping history, common contacts, location history, file summaries, and work project names. This can go to the cloud, but should be trimmed, desensitized, or temporarily authorized by task.</p><p>L3 is high-sensitivity data. For example, chat content, original photos, health data, precise location, company files, family relationships, and financial information. This should be processed on device by default. Only when the user explicitly confirms and the task requires it should the minimum slice be sent.</p><p>L4 is data that must not leave the device. For example, biometrics, payment keys, Passkey private keys, bank verification codes, enterprise certificates, and device keys. This data can only be used inside the device security boundary. The cloud should receive at most “user confirmed” or “signature completed.”</p><p>Device-cloud routing should work like this:</p><figure class="highlight plaintext"><table><tr><td class="gutter"><pre><span class="line">1</span><br><span class="line">2</span><br><span class="line">3</span><br><span class="line">4</span><br><span class="line">5</span><br><span class="line">6</span><br><span class="line">7</span><br><span class="line">8</span><br><span class="line">9</span><br><span class="line">10</span><br><span class="line">11</span><br></pre></td><td class="code"><pre><span class="line">User task</span><br><span class="line">  ↓</span><br><span class="line">Identify task type and risk</span><br><span class="line">  ↓</span><br><span class="line">Split required data</span><br><span class="line">  ↓</span><br><span class="line">Classify by L0-L4</span><br><span class="line">  ↓</span><br><span class="line">On-device processing / desensitized cloud / one-time grant / cloud forbidden</span><br><span class="line">  ↓</span><br><span class="line">Record audit and expiry</span><br></pre></td></tr></table></figure><p>This mechanism sounds tedious, but it is the prerequisite for trust. Users already feel sensitive when authorizing an app to access the photo library. An Agent phone reads much more context. Without data classification, it becomes more black-box-like than any app.</p><p>Android vendors have an opportunity here: make data boundaries visible in system UI. For example, a task card can clearly show:</p><ul><li>This task used 2 images, 1 calendar event, and 3 public webpages.</li><li>What went to the cloud was invoice fields, not the original album.</li><li>Payment credentials did not leave the device.</li><li>Temporary context will be deleted 24 hours after task completion.</li><li>The user can delete Artifacts and memory in task history.</li></ul><p>This UI does not have to be flashy, but it is more persuasive than a slogan about privacy.</p><h3 id="Cloud-Agent-Is-Not-a-Stateless-API"><a href="#Cloud-Agent-Is-Not-a-Stateless-API" class="headerlink" title="Cloud Agent Is Not a Stateless API"></a>Cloud Agent Is Not a Stateless API</h3><p>Many phone teams are used to treating the cloud as an API: the device sends a request, the cloud returns a result. That model does not fit Agent phones.</p><p>Complex tasks need the cloud to keep state. When the user asks the Agent to research travel plans, the cloud opens webpages, records candidate hotels, compares flights, saves a budget table, waits for price changes, and generates itinerary documents. These intermediate states cannot be stuffed back into the prompt every time, and they cannot restart every time.</p><p>A cloud Agent is more like a user-specific workspace. It can be a combination of container, microVM, browser session, filesystem, vector database, task queue, and tool set. Each user’s task needs isolation. Each task’s files and credentials need isolation. When the task ends, cleanup must be possible.</p><p>This is where cloud Agent approaches such as OpenClaw&#x2F;ArkClaw have value: the cloud gives the user a long-running execution environment, not just a larger model for the phone. It can run browsers, code, documents, spreadsheets, and image tools; it can continue while the user is offline; it can push back to the phone when confirmation is needed.</p><p>But this cloud shape also has three risks.</p><p>First is cost. An always-on or semi-always-on cloud Agent is much more expensive than ordinary API calls. Subscription, hardware bundling, task quotas, and enterprise payment will become part of the business model.</p><p>Second is security. The more tools a cloud Agent gets, the more it needs sandbox isolation, network access control, file access control, credential minimization, and prompt-injection defense. It cannot leak files or place orders for the user just because it read malicious instructions on a webpage.</p><p>Third is explainability. Users should not only know that “the cloud handled it for you.” They need to see task steps, call sources, generation basis, and final confirmation points. The longer the task, the less comfortable users become without explanation.</p><p>So device-cloud architecture cannot be simplified to “small device, big cloud.” The device handles scene, privacy, confirmation, and braking. The cloud handles long tasks, tools, memory, and concurrency. The protocol layer manages state, authorization, Artifacts, and audit.</p><h3 id="Do-Not-Overstate-or-Understate-the-On-device-Model"><a href="#Do-Not-Overstate-or-Understate-the-On-device-Model" class="headerlink" title="Do Not Overstate or Understate the On-device Model"></a>Do Not Overstate or Understate the On-device Model</h3><p>On-device models will not replace cloud models in the short term. Power, memory, thermal design, and cost constraints on phones mean they are not suitable for all complex reasoning. But on-device models are not supporting actors either.</p><p>They are best suited to five kinds of work.</p><p>First is wake and intent classification. When a user sentence arrives, the device first judges whether cloud is needed, whether privacy is involved, and whether the task can be handled locally.</p><p>Second is context trimming. The device trims screen, notifications, calendar, photos, and files down to the minimum slices needed by the task, then decides what can go to the cloud.</p><p>Third is privacy-sensitive understanding. Fraud-call detection, verification-code recognition, health anomaly prompts, private photo classification, and company-file summaries can be done or preprocessed on device.</p><p>Fourth is fast feedback. Translation, summaries, rewriting, simple Q&amp;A, local image editing, and speech-to-text are latency-sensitive. On-device models have an advantage.</p><p>Fifth is failure fallback. When the network is down, weak, cloud-congested, or cloud permission is disabled, the device must provide a minimum usable capability.</p><p>This is also the value of processor co-design. Agent phones need not only high compute, but also low-power always-on models, fast cold start, model-weight sharing, embedding indexes, KV&#x2F;cache management, and secure memory. NPU peak numbers only explain part of the experience. Continuous operation determines whether users keep the Agent enabled.</p><h3 id="The-Different-Positions-of-Five-Groups-of-Players"><a href="#The-Different-Positions-of-Five-Groups-of-Players" class="headerlink" title="The Different Positions of Five Groups of Players"></a>The Different Positions of Five Groups of Players</h3><p>OpenAI’s position is the most special. It has models, consumer brand, subscription relationship, and global developer attention, with no traditional phone baggage. It can aggressively put Task Stream on the first screen, treat apps as background capabilities, bind subscription to hardware, and differentiate through cloud long tasks. Its problems are also clear: lack of local services, payments, maps, social networks, and channels; China almost certainly requires local partners; callable rights for apps need to be renegotiated; first-generation hardware reliability pressure is high.</p><p>Apple’s advantages are on-device hardware, system permissions, privacy brand, App Store, App Intents, and user trust. It does not need to radically change the home screen to weave Siri, Spotlight, notifications, Shortcuts, App Intents, and Private Cloud Compute together. Apple’s constraint is that it does not want to hurt the App Store or existing usage habits. It will be slow, but slow does not mean weak. If Apple makes task suggestions, App Intents, and system confirmation work well, user migration cost is low.</p><p>Google + Samsung is the standardization path for the Android camp. Google has Android, Gemini, AppFunctions, A2A, and cloud. Samsung has high-end hardware, Galaxy AI, Now Brief, Bixby, Now Bar, and global users. Samsung’s willingness to hand system entry to multi-Agent combinations makes it an important test bed for Android. The difficulty is dispersed interests: Google, Samsung, Qualcomm, MediaTek, OEMs, carriers, top apps, and regional regulators all influence system choices.</p><p>ByteDance Doubao is one of the most valuable samples in China. Doubao phone, system-level permissions, Virtual Display, UI-TARS, OpenClaw&#x2F;ArkClaw internal directions, and the public-facing Coze Space-style cloud Agent environment push “AI operates apps for users” from slides to devices. Its value is not sales, but showing two things early: Agent phones are feasible, and third-party apps will push back. ByteDance has Chinese content, video creation, office tools, models, advertising, and e-commerce services, but no dominant mainstream phone OS. To move forward, it must go from “can tap screens” to “protocol calls, auditable authorization, and commercial distribution.”</p><p>Huawei, Xiaomi, OPPO, vivo, and Honor have system permissions, hardware, channels, local services, and compliance capability. They are well positioned to build a Chinese version of Agent OS, but are also most likely to build separate systems. If every vendor has its own skill protocol, memory format, AgentCard, payment confirmation, and task state, developers will relive adaptation hell. The Chinese Android camp should not rely only on one more AI assistant inside the ROM. It needs a relatively stable common language for capability declaration, permission authorization, task state, data classification, and audit records.</p><p>Another group cannot be ignored: top apps. They may not want to be called by Agents. For WeChat, Taobao, Alipay, Meituan, Douyin, banks, and games, the foreground entry point is a business asset. If an Agent takes the entry point away, platforms will worry that user relationships, ads, transaction share, risk control, and responsibility are all rewritten. In the next few years, the largest negotiation in Agent OS will happen among system vendors, AI vendors, and top apps. The question is how entry, data, and responsibility are redistributed.</p><h4 id="The-Real-Constraints-of-the-Five-Groups"><a href="#The-Real-Constraints-of-the-Five-Groups" class="headerlink" title="The Real Constraints of the Five Groups"></a>The Real Constraints of the Five Groups</h4><p>To avoid turning each company’s path into slogans, place them in one constraint table.</p><table><thead><tr><th>Player</th><th>Strongest resource</th><th>Biggest constraint</th><th>More likely first form</th></tr></thead><tbody><tr><td>OpenAI</td><td>Models, brand, subscriptions, cloud Agent</td><td>App callable rights, local services, hardware support</td><td>Task-stream-first AI phone or high-end task device</td></tr><tr><td>Apple</td><td>On-device hardware, OS, privacy, App Store</td><td>Cannot hurt App Store and existing habits</td><td>Siri + App Intents + system task suggestions</td></tr><tr><td>Google + Samsung</td><td>Android standards, Gemini, hardware, global channels</td><td>Dispersed camp interests and different OEM incentives</td><td>AppFunctions + Galaxy AI + Now Brief</td></tr><tr><td>ByteDance Doubao</td><td>Chinese content, cloud, models, video&#x2F;office&#x2F;e-commerce</td><td>No mainstream OS control, top-app resistance</td><td>System assistant + cloud OpenClaw + own services</td></tr><tr><td>Chinese OEMs</td><td>System permissions, channels, local compliance, hardware</td><td>Protocol fragmentation, model and service differences</td><td>ROM-level Agent + local service cooperation</td></tr></tbody></table><p>In this table, OpenAI’s advantage is the opposite of other players. Traditional phone vendors have phones but lack a strong enough Agent entry point. OpenAI has the Agent entry point but lacks the most troublesome service relationships in the phone world. It is moving from task entry toward hardware. Other vendors are moving from hardware and system permissions toward task entry.</p><p>The two sides will meet around 2028.</p><p>If OpenAI does well enough, it proves that “task stream first” is feasible. Traditional vendors will absorb its interaction and task model.</p><p>If OpenAI hardware fails, it still leaves boundary experience: which tasks users are willing to give to an Agent, which services must return to apps, which permissions users cannot accept, and which hardware forms do not fit always-on operation.</p><p>That is its disruptive value. It does not have to become the largest phone vendor to change the phone industry.</p><h4 id="Why-Supply-chain-Signals-Are-Worth-Watching"><a href="#Why-Supply-chain-Signals-Are-Worth-Watching" class="headerlink" title="Why Supply-chain Signals Are Worth Watching"></a>Why Supply-chain Signals Are Worth Watching</h4><p>Kuo’s report puts MediaTek, Qualcomm, and Luxshare together. That is already beyond ordinary supply-chain gossip. If it is true, OpenAI’s target covers two layers: finding manufacturing partners, and participating in system design, SoC definition, and manufacturing coordination.</p><p>Agent phones will change SoC requirements.</p><p>Traditional flagship SoCs emphasize peaks: CPU single-core and multi-core, GPU, NPU TOPS, ISP, baseband. Agent phones need these too, but they care more about sustained load.</p><p>An always-on Agent will not run a big model once every ten minutes and stop. It will continuously listen for low-power events, maintain small context, frequently run embedding and rerank, occasionally call a VLM to inspect screen or camera, sync cloud tasks in the background, wait for push, and bring confirmation cards to the foreground.</p><p>This shifts pressure to several places.</p><p>First is low-power sensing. Voice, movement, location, Bluetooth, calendar, and notification events must be processed continuously without waking big cores and big models every time. Sensor hub, DSP, small NPU, and always-on island become more important.</p><p>Second is memory hierarchy. Model weights, KV cache, embedding indexes, task state, and screen semantic snapshots compete with traditional apps for memory. The difference among 8GB, 12GB, and 16GB will show up in background retention and whether multiple Agent sub-tasks can be carried at once.</p><p>Third is secure storage. Agents touch credential references, payment confirmation, private preferences, company materials, and identity tokens. StrongBox, TEE, secure elements, encrypted storage, and remote attestation move from “security specs” into user experience.</p><p>Fourth is network and push. Device-cloud tasks round-trip more often than ordinary app requests and depend more on reliable push. Task interruption, retry, weak-network recovery, roaming, and airplane-mode recovery all need design.</p><p>Fifth is heat and battery. Users will not accept a phone that heats up and drains visibly because AI is always on. Agent phone success may be decided by a plain question: if enabled by default all day, is battery life still trustworthy?</p><p>MediaTek and Qualcomm each have a position here. Qualcomm is strong in high-end Android, baseband, NPU, and global flagship cooperation. MediaTek is strong in cost, integration, and flexible cooperation with some OEMs. OpenAI contacting both can be reasonably understood as comparing different SoC definition paths, not necessarily having locked one traditional phone plan.</p><p>Luxshare’s role is also worth watching. It is not just contract manufacturing. If an AI Agent phone rewrites hardware interaction, it may involve new buttons, microphone arrays, sensor layout, thermal design, antenna space, secure-element placement, and always-on display strategy. System co-design matters more than ordinary ODM work.</p><p>But judgment should stay restrained. A supply-chain report being true does not mean the product will succeed. In hardware, prototype, EVT, DVT, PVT, mass production, channels, and support can all change direction. For Android practitioners, the more valuable observation is how OpenAI defines Agent phone SoC, permissions, entry point, and device-cloud division, rather than betting on phone sales.</p><h3 id="2026-to-2032-What-Is-More-Likely-to-Happen"><a href="#2026-to-2032-What-Is-More-Likely-to-Happen" class="headerlink" title="2026 to 2032: What Is More Likely to Happen"></a>2026 to 2032: What Is More Likely to Happen</h3><p><img src="/en/images/Agent-OS-Task-Entry/06-timeline-and-players.png" alt="Agent OS Timeline and Players"></p><p>2026 to 2027 is the stage of “assistant moves forward, app grid remains.”</p><p>In this stage, vendors will hand long-press side buttons, voice, earbuds, lock screen, notifications, and floating entry points to AI assistants. Now Brief, Now Bar, system briefings, smart notifications, cross-app summaries, screen Q&amp;A, on-device image editing, live translation, and meeting minutes will keep spreading. GUI Agents will appear in some tasks. AppFunctions &#x2F; App Intents will expand from top scenarios.</p><p>The experience will be mixed. Many features will look like AI phones, but are still old OS plus assistant. Users will feel that “good tasks are amazing, bad tasks are awkward.” This stage first exposes four engineering gaps: task state, permission confirmation, capability routing, and failure recovery.</p><p>2028 may be the window for an external reference.</p><p>If an OpenAI phone enters mass production as Kuo reported, it may not immediately take mainstream share from iPhone or Galaxy. But it can provide an industry reference: can the home screen not start from apps? Can tasks become first-class OS objects? Can hardware subscription merge with cloud Agent? Can phone SoCs be designed around continuous context? Can users accept a more proactive task stream?</p><p>Even if OpenAI’s first phone has limited sales, it may play the defining-sample role that early Surface, Pixel, or Vision Pro played. It can expand review metrics from “camera, battery, screen, benchmark” to “task completion rate, confirmation design, privacy classification, long-task recovery, cross-device continuity, app callability.”</p><p>From 2029 to 2030, app entry points will begin to retreat more visibly into the background.</p><p>This does not mean app icons disappear. What is more likely is that high-frequency user operations are gradually absorbed by task streams. The home screen may have three persistent views: conversation, task, memory. Notification center becomes a task status panel. App Store gains a capability-store attribute. Developers submit not only apps, but callable functions, schemas, pricing, permissions, and result formats.</p><p>At that point, phone vendors will find that the Launcher problem has expanded from desktop layout into a task operating system. Whoever better understands user state, schedules capabilities, and controls risk owns the next entry layer.</p><p>From 2031 to 2032, multi-device Agents will begin to exceed single-phone Agents.</p><p>The phone remains central, but it is no longer the only entry. Glasses handle vision, earbuds handle voice, watches&#x2F;rings handle physiological signals, cars handle travel, computers handle complex editing, TVs handle family content, and home devices handle spatial state. The phone becomes the identity, authorization, confirmation, and high-compute local node.</p><p>At that stage, the Agent OS object is no longer one device, but the user’s device group. A task starts on the phone, continues on the computer, reminds in earbuds, confirms a route in the car, and announces through the home speaker. The OS boundary expands from “device operating system” to “personal task system.”</p><h4 id="Use-Real-Task-Types-to-Test-the-Timeline"><a href="#Use-Real-Task-Types-to-Test-the-Timeline" class="headerlink" title="Use Real Task Types to Test the Timeline"></a>Use Real Task Types to Test the Timeline</h4><p>A timeline written only by year looks like a prediction list. A better way is to watch when different task types become stable.</p><p>The first type is information organization: meeting minutes, webpage summaries, notification organization, email drafts, travel plan comparison, information collection. These tasks do not depend heavily on high-risk actions or deep top-app interfaces. They will mature quickly in 2026-2027. They will be the first reasons users accept Agent phones.</p><p>The second type is light execution: creating calendar events, generating to-dos, saving files, sending to self, organizing albums, setting reminders, simple shopping comparison. These need system permissions and some app cooperation, but risk is low. They fit AppFunctions, App Intents, and system capabilities, and will enter high frequency around 2027.</p><p>The third type is transaction tasks: booking tickets, booking hotels, ordering food, hailing rides, buying products, canceling subscriptions, reimbursement, bill payment. These involve payment, price, after-sales, responsibility, and risk control. GUI Agent can demonstrate them first, but stable execution needs platform cooperation and structured capability. Large-scale stability may come after 2028.</p><p>The fourth type is social and content publishing: sending WeChat messages, replying to emails, posting to Weibo, Xiaohongshu, or Douyin, commenting, direct messaging. The risk here is not only technical, but also tone, relationships, and consequences. Agents can draft and suggest, but direct sending will be cautious. Before trust is built, confirmation is hard to remove.</p><p>The fifth type is high-sensitivity tasks: banking, securities, insurance, healthcare, government services, company approval, contract signing, identity authentication. These will open latest and best test Agent OS permission and audit design. Without strong confirmation, strong audit, and strong responsibility boundaries, platforms will not let them in.</p><p>The development speed of these five task types is more valuable than the question “which year will Agent OS appear?”</p><p>From 2026 to 2027, information organization and light execution mature.</p><p>From 2028 to 2030, transaction tasks begin to be stably absorbed by system-level Agents.</p><p>After 2030, social delegation and high-sensitivity tasks may open within specific boundaries.</p><p>This also explains why even if OpenAI’s first phone exists, it will not replace all apps at the beginning. It is more likely to make information organization, long tasks, research, creation, and light execution strong first, then gradually touch transactions and high-sensitivity tasks.</p><h2 id="6-Product-Shape-Market-Split-and-Responsibility-Distribution"><a href="#6-Product-Shape-Market-Split-and-Responsibility-Distribution" class="headerlink" title="6. Product Shape, Market Split, and Responsibility Distribution"></a>6. Product Shape, Market Split, and Responsibility Distribution</h2><p>If the Agent OS phone from 2028 to 2032 is compressed into one product shape, it probably will not be a full-screen chatbot.</p><p>Chat must remain because natural language is a low-cost entry. But chat is not the destination. Users do not want to talk to the phone all day. They want the phone to interrupt less, switch less, forget less, and ask for repeated input less.</p><p>The more likely first screen is a task stream.</p><p>In the morning, the phone shows tasks that need confirmation today: flight-change suggestions, meeting-material summaries, children’s school materials, bill due reminders, fitness plan, and research results completed by the cloud last night. Each task has state, source, next step, risk, and confirmation button.</p><p>During the day, the user says, “Mark the contract risks in this PDF and give me a shareable version before 3 p.m.” The phone sends the file to a cloud sandbox, keeps sensitive-field indexes on device, and the cloud generates the report. When complete, it pushes back a task card. After user confirmation, the system calls an office app to send it.</p><p>At night, the user says, “Take my parents to Yunnan next month, do not make it tiring, budget 15,000.” The cloud runs routes and hotels. The device reads family calendar and weather preferences. Hours later, the system provides three plans. The user does not need to stay in the chat window.</p><p>Behind these experiences are three UI levels.</p><p>The first is Task Stream. It combines home screen, notifications, and lock screen, managing tasks that wait for confirmation, are running, are completed, or failed.</p><p>The second is Capability View. Users or developers can view which apps, services, and Agents can be called, what they can do, what permission range they have, and what price and risk they carry.</p><p>The third is Memory View. Users can see preferences, projects, relationships, common information the Agent remembers, and can edit or delete them.</p><p>These three views will gradually replace part of app-grid time. The app grid remains, just as filesystems and command lines remain. It is simply no longer the starting point for most users to complete tasks.</p><h3 id="What-the-First-Screen-May-Become"><a href="#What-the-First-Screen-May-Become" class="headerlink" title="What the First Screen May Become"></a>What the First Screen May Become</h3><p><img src="/en/images/Agent-OS-Task-Entry/07-first-screen.png" alt="Agent Phone First Screen"></p><p>The first screen is unlikely to be only one big chat box. A pure chat entry has two problems: users must constantly express themselves, and task state is invisible.</p><p>A more reasonable first screen may have four blocks.</p><p>The first block is current tasks. It shows running, waiting-for-confirmation, and near-deadline tasks. Each task card has source, state, next step, and risk prompt.</p><p>The second block is today’s state. It summarizes calendar, weather, travel, health, messages, bills, and family matters without filling the screen with everything.</p><p>The third block is quick expression. Users can create new tasks through voice, text, screenshot, photo, or shared content.</p><p>The fourth block is app fallback. Users can still open the traditional app grid, especially when the Agent is unreliable, when the user wants to operate manually, or when the task is high-risk.</p><p>The ratio among these four blocks will vary by user. Heavy users rely more on task stream. Conservative users still center on the app grid. The system should not force everyone into Agent mode immediately.</p><h3 id="The-Position-of-Generative-UI"><a href="#The-Position-of-Generative-UI" class="headerlink" title="The Position of Generative UI"></a>The Position of Generative UI</h3><p>Future phone interfaces will not choose only between app UI and chat UI. Generative UI will become part of task results.</p><p>When the user says, “Give me three family-trip plans for Yunnan,” the system should not only return a paragraph or jump to an app. A better result is an interactive panel: budget, route, hotel, transport, elder-friendliness, cancellation policy, weather risk, and options needing confirmation. The user can adjust preferences inside the panel, and the Agent continues execution.</p><p>When the user says, “Rewrite this report for my boss,” the system can generate a comparison view, revision suggestions, source references, risk prompts, and one-click export, instead of dumping a new paragraph into chat.</p><p>The key to Generative UI is turning intermediate task state into an operable interface, not showing off. This lets users participate in decisions instead of handing all judgment to the model.</p><p>For Android, Generative UI raises new questions for View&#x2F;Compose&#x2F;WebView: where does the UI come from, who is responsible for security, can it call system capabilities, can it embed third-party services, can it be screenshot-audited, and can it recover offline? Eventually it still returns to Task, Capability, Policy, and Artifact.</p><h3 id="Memory-View-Becomes-the-Trust-Entry"><a href="#Memory-View-Becomes-the-Trust-Entry" class="headerlink" title="Memory View Becomes the Trust Entry"></a>Memory View Becomes the Trust Entry</h3><p>The smarter an AI phone becomes, the more users will ask one question: why do you know that?</p><p>This makes Memory View crucial. Users need to see what preferences, projects, contact relationships, common addresses, writing style, and travel taboos the Agent remembers. They also need to edit, delete, and pause memory.</p><p>Memory UI should not be buried like a privacy list in Settings. It should become one of Agent OS’s common interfaces. Memory is the long-term contract between user and Agent. Backend technology is only one part.</p><p>A good memory interface should support:</p><ul><li>Viewing by topic: travel, work, family, health, shopping, writing.</li><li>Viewing by source: from conversation, calendar, files, or manual user input.</li><li>Viewing by sensitivity: ordinary preference, high-sensitivity information, data that must not leave the device.</li><li>Expiry: some preferences are valid only for this trip, project, or month.</li><li>Correction: users can say “this is not my preference, it was a one-time situation.”</li></ul><p>Without Memory View, the Agent gradually becomes an unexplained black box. With Memory View, users may be willing to hand it more tasks.</p><h3 id="China-Will-Follow-an-Independent-Path"><a href="#China-Will-Follow-an-Independent-Path" class="headerlink" title="China Will Follow an Independent Path"></a>China Will Follow an Independent Path</h3><p>After product shape, China needs a separate look. The China market will not simply copy OpenAI’s phone route.</p><p>First, OpenAI can hardly enter China’s primary-phone market directly. Model compliance, data cross-border rules, app stores, local payment, maps, IM, local-life services, government relations, and carrier relations are each complex enough.</p><p>Second, Chinese users’ high-frequency services concentrate in a small number of super apps and local platforms. An Agent that wants to finish tasks must deal with WeChat, Alipay, Taobao, Meituan, Douyin, JD, Didi, banks, and government services. This involves technical, commercial, and compliance problems at the same time.</p><p>Third, Chinese Android vendors have stronger ROM customization capability and more complex vendor fragmentation. Each can build its own AI assistant, but without common capability standards, developers and top apps will not want to adapt separately for each vendor.</p><p>Fourth, the Doubao route will remain referential. It connects system permissions, Chinese content, cloud Agent, GUI automation, and its own app network, showing that Chinese companies may build a different Agent phone from Apple&#x2F;Google&#x2F;OpenAI. It also reminds everyone that the right to be legally called by other apps may be scarcer than model parameters.</p><p>The China market is more likely to have multiple forces coexist:</p><ul><li>Huawei follows its own system and services on HarmonyOS NEXT.</li><li>Xiaomi, OPPO, vivo, and Honor strengthen system Agents in Android&#x2F;AOSP systems.</li><li>ByteDance, Tencent, Alibaba, Meituan, and other service platforms provide their own Agent capabilities and developer tools.</li><li>Top apps defend against GUI automation, but open structured capabilities when commercial returns are clear.</li><li>Domestic protocols borrow from A2A&#x2F;MCP&#x2F;AppFunctions while adding local compliance, data classification, real-name, payment, and risk-control fields.</li></ul><p>This path will not be as clean as OpenAI’s ideal, but it will fit Chinese service reality better. For Android phone practitioners, the more important question is whether system permissions, on-device models, domestic cloud, top apps, payment confirmation, and task audit can combine into a credible execution system, not whether another ChatGPT is rebuilt.</p><h4 id="Three-Product-Lines-in-China"><a href="#Three-Product-Lines-in-China" class="headerlink" title="Three Product Lines in China"></a>Three Product Lines in China</h4><p>China is more likely to have three product lines at the same time, not one Agent OS.</p><p>The first is the OEM system-assistant line. Huawei, Xiaomi, OPPO, vivo, and Honor will keep moving assistants into the system layer, connecting photos, notifications, calendar, files, cars, homes, and wearables. Their advantage is system permissions and hardware entry. Their weakness is that model and service coverage may not be strongest.</p><p>The second is the service-platform Agent line. ByteDance, Tencent, Alibaba, Meituan, Baidu, JD, and others will package their content, transaction, office, and local-life capabilities into Agents or tools. Their advantage is services and user behavior. Their weakness is that they do not get full system permissions and may not become the default entry.</p><p>The third is the enterprise and vertical Agent line. Finance, healthcare, government, education, manufacturing, and retail will have their own controlled Agents. They care more about compliance, data boundaries, and audit, and will not easily integrate with consumer general assistants.</p><p>These three lines will cooperate and guard against each other. OEMs want to be the default entry. Service platforms want to protect user relationships. Industry systems want to keep data boundaries. Whether Agent OS becomes large in China depends not only on model level, but also on whether these three lines can form an acceptable cooperation model.</p><p>For users, the best experience is a system-level Agent that can call multiple platform services. For platforms, the safest method is to expose controlled capabilities, not all data and UI. For regulators, the most acceptable design is that every high-risk action has identity, authorization, audit, and responsibility. The overlap acceptable to all three parties is the viable area for China’s Agent phone.</p><h4 id="What-Doubao-Phone-Reminds-the-Industry"><a href="#What-Doubao-Phone-Reminds-the-Industry" class="headerlink" title="What Doubao Phone Reminds the Industry"></a>What Doubao Phone Reminds the Industry</h4><p>The biggest value of Doubao phone is not that it “built an AI phone,” but that it exposed a group of hidden problems early.</p><p>First, system-level permissions are useful. Without them, an Agent can hardly understand the screen, operate apps, receive notifications, or maintain background tasks. The capability gap between an AI app and a system Agent is large.</p><p>Second, GUI Agent is impactful. It lets users see for the first time that “the phone can really operate apps for me.” Even if unstable, it changes imagination.</p><p>Third, top apps will push back. Platforms will not unconditionally accept an external Agent entering their transaction, social, and content scenarios. They will restrict it from security, risk control, user experience, and commercial-interest angles.</p><p>Fourth, an owned service network matters. ByteDance can connect Doubao, Douyin, Jianying, Feishu, Volcano Engine, content, and ads, so it has more service support for an Agent phone than a pure hardware vendor. If other OEMs rely only on models and system permissions, service depth will be insufficient.</p><p>Fifth, user acceptance may be higher than expected, but trust building will be slower than expected. Users will be attracted by “it can help me tap apps,” while also worrying about “what did it see, will it tap randomly, will it leak data?”</p><p>These five points matter for all Android vendors. Agent phones will not stay in the smooth execution shown in promotional videos. They will repeatedly balance system permissions, third-party relationships, and user trust.</p><h3 id="Several-Boundary-Judgments"><a href="#Several-Boundary-Judgments" class="headerlink" title="Several Boundary Judgments"></a>Several Boundary Judgments</h3><p>After product and market, the boundaries should be put on the table.</p><p>First, Agents will not replace apps all at once. They will replace entry points first, then part of cross-app operations, and only later change app business forms. Apps remain service providers, but must accept being called by system-level Agents.</p><p>Second, GUI Agent is a necessary transition, not the long-term answer. It can prove demand and cover long-tail apps, but it should not carry high-risk actions. The long-term answer is structured capability, system-level authorization, and auditable tasks.</p><p>Third, on-device privacy becomes a brand differentiator. Users can accept smarter Agents, but not secret learning and secret execution. Which data stays on device, which goes to cloud, who can audit, how deletion works, and how errors are traced must be clear from day one.</p><p>Fourth, OpenAI’s hardware value may not come from sales. It is more like an industry pressure source. As long as it produces a daily-usable task stream, Android vendors and Apple will be forced to explain why their OS still starts from an app grid.</p><p>Fifth, Android’s opportunity is standardization. If AppFunctions, A2A, MCP, on-device model services, permission systems, task state, and notification entry points form a stable combination, Android does not need each vendor to build a private Agent OS. Conversely, if every vendor privatizes it, developers will escape back to web and top platforms.</p><p>Sixth, a non-Android route has a chance, but is hard to become a primary phone directly. It may first appear as a high-end AI device, companion device, or narrow work phone. Only after app compatibility, service coverage, and trust mechanisms are complete can it move into primary-phone position.</p><p>Seventh, Agent OS competition expands from models to systems. Models determine the ceiling of understanding and planning. OS determines whether the Agent can see state, call capabilities, obtain authorization, execute actions, recover failures, and take responsibility. A model without OS permission can only wait for the user to bring problems to it. An OS-constrained Agent can keep working inside the user’s life.</p><h3 id="Back-to-OpenAI-Why-Its-Disruption-Matters"><a href="#Back-to-OpenAI-Why-Its-Disruption-Matters" class="headerlink" title="Back to OpenAI: Why Its Disruption Matters"></a>Back to OpenAI: Why Its Disruption Matters</h3><p>Now return to OpenAI building a phone. The point is no longer only whether the hardware rumor is true. It puts industry questions back on the table. If the device is eventually confirmed, there are roughly two outcomes.</p><p>One outcome is an AI Agent phone based on Android or Android compatibility. Then it gives the Android camp an assignment: why can an outsider put task stream on the first screen while traditional OEMs still stuff AI features into Settings, Gallery, and assistant apps?</p><p>The other outcome is a more Agent OS-like new device without Android. Then it gives the industry another assignment: without app-grid history, how should a phone or portable device organize tasks, memory, permissions, and cloud execution?</p><p>Whichever path happens, it makes the phone industry ask the right question.</p><p>For more than ten years, phone OS competition has centered on screens, apps, imaging, performance, and services. Over the next few years, competition will gradually move toward: who can manage user state, who can organize tasks, who can make apps reliably expose capabilities, who can draw privacy boundaries between device and cloud, and who can make users trust a system that acts proactively.</p><p>From an Android phone practitioner’s perspective, Agent OS will not overturn Android or iOS overnight. More likely, Android and iOS both grow parts of Agent OS. OpenAI, ByteDance, Google, Apple, Samsung, Huawei, Xiaomi, OPPO, vivo, and Honor all start from their own resources and compete for the task entry point.</p><p>The risk is that the industry keeps understanding AI phones as a set of feature points. If the industry only builds AI summaries, AI photo editing, AI search, and AI voice assistants, then once OpenAI builds a usable Task Stream, it will push the problem into the system layer.</p><p>This pressure will not stay inside OS vendors. Once Task Stream enters the home screen, apps must answer whether they are willing to be called. Service platforms must answer how transactions and attribution are shared. The system must answer who is responsible after mistakes. So the next thing to watch is how developers, business, and responsibility are redistributed.</p><h3 id="Developers-Business-and-Responsibility-Will-Be-Redistributed"><a href="#Developers-Business-and-Responsibility-Will-Be-Redistributed" class="headerlink" title="Developers, Business, and Responsibility Will Be Redistributed"></a>Developers, Business, and Responsibility Will Be Redistributed</h3><p>Agent OS changes the relationship between developers and platforms.</p><p>In the app era, developers competed for install, open, dwell time, payment, and return visits. App icon was the entry. Push was recall. App stores were distribution. Ads and subscriptions were monetization.</p><p>In the Agent OS era, developers must compete for a new thing: being selected by the Agent.</p><p>When the user says “order a bouquet for me,” which service does the system choose? By price, distance, reputation, fulfillment, historical preference, platform partnership, commission, or the user’s past habit? This selection power used to belong to the user and search&#x2F;app stores. It may move to Agent and system.</p><p>This will bring new developer interfaces.</p><p>Apps need to declare capabilities: I can order flowers, check inventory, book, cancel, refund, and issue invoices.</p><p>Apps need to declare constraints: which cities are available, which actions need login, which actions need user confirmation, and when cancellation is unavailable.</p><p>Apps need to declare price and share: how orders brought by Agents are attributed, whether the system or AI platform takes a commission, and whether coupons can be used.</p><p>Apps need responsibility interfaces: who is responsible for order failure, how refunds are handled, where customer support entry is, and how audit logs connect.</p><p>This is not a pure technical API. It changes the app’s business position.</p><p>Top apps will worry about losing entry, so they will require brand display, user confirmation, transaction attribution, and risk-control authority. Smaller apps may be more willing to integrate because Agents can bring new traffic. System vendors will want to build capability stores. AI vendors will want to own the task entry point.</p><p>Developer platforms also change. Future developer docs will not only teach UI writing. They will teach capability schemas, callable action definitions, Artifact returns, Agent-induced error handling, sandbox testing, and revenue sharing.</p><p>Android AppFunctions is the beginning of this direction. It lets apps expose capabilities to systems and Agents. To support full Agent OS, more complicated business and responsibility layers are needed.</p><h4 id="The-New-Ranking-Problem"><a href="#The-New-Ranking-Problem" class="headerlink" title="The New Ranking Problem"></a>The New Ranking Problem</h4><p>Agent OS creates a ranking problem similar to search.</p><p>When the user says, “Find a nearby restaurant suitable for kids,” which restaurant does the Agent choose? User preference, friend recommendation, platform ranking, ads, commission, or model judgment? If Agent results affect transactions, transparency and fairness appear.</p><p>In the search era, users could see multiple links. In the app era, users could open multiple apps and compare. In the Agent era, if the system directly gives one suggestion, the selection process becomes less visible.</p><p>This creates new product requirements:</p><ul><li>Mark commercial recommendations.</li><li>Allow users to see candidates.</li><li>Allow users to specify preferences and disable platforms.</li><li>Provide comparison basis for high-value transactions.</li><li>Keep audit records for enterprise and regulatory scenarios.</li></ul><p>OpenAI, Google, Apple, Android OEMs, ByteDance, Alibaba, Tencent, and Meituan will all face pressure here. Agents save users time, but cannot turn user choice into invisible commercial allocation.</p><h4 id="Responsibility-Spreads-from-Apps-to-the-System"><a href="#Responsibility-Spreads-from-Apps-to-the-System" class="headerlink" title="Responsibility Spreads from Apps to the System"></a>Responsibility Spreads from Apps to the System</h4><p>When a traditional app fails, responsibility is relatively clear. If food delivery is wrong, find the food-delivery platform. If payment fails, find the payment platform. If navigation is wrong, find the map. The OS mostly provides capabilities and security boundaries.</p><p>When Agent OS fails, responsibility becomes more complicated.</p><p>If the Agent misunderstands the user and books the wrong hotel, is the model responsible or the user?</p><p>If the Agent understands correctly but calls a more expensive service, is the system recommendation responsible or the service platform?</p><p>If GUI automation taps the wrong button, is the executor responsible, the app UI change responsible, or the system responsible for missing second confirmation?</p><p>If a cloud Agent is induced by webpage prompt injection and leaks user files, is the cloud sandbox, model, webpage, or user authorization responsible?</p><p>These questions force system design. Not every action can be automatic. Not all data can enter the model. Not every result can be submitted directly. Agent OS must treat “high-risk actions require confirmation” as a base rule, not a post-launch popup.</p><p>High-risk actions will keep user confirmation for a long time. Payment, messaging, publishing content, deleting data, signing contracts, submitting government services, financial trading, and medical advice will not become fully automatic quickly. The Agent can prepare, compare, fill forms, and explain, but the last step should return control to the user.</p><p>Keeping confirmation rights for high-risk actions with the user is a prerequisite for sustainable Agent OS.</p><h3 id="Observations-from-an-Android-Phone-Practitioner’s-Perspective"><a href="#Observations-from-an-Android-Phone-Practitioner’s-Perspective" class="headerlink" title="Observations from an Android Phone Practitioner’s Perspective"></a>Observations from an Android Phone Practitioner’s Perspective</h3><p>This section does not need to become an action plan. Professional teams already understand side-button entry, permission UI, on-device models, cloud tasks, and developer interfaces. The more valuable move is to narrow the observation angle: in the next few years, the Android camp’s test point will shift from “is there an AI assistant” to whether AI can enter the system object model.</p><p>The first observation point is Task. If tasks still exist only inside chat history, the Agent cannot really enter the system layer. Only when tasks have state, progress, Artifacts, cancellation, recovery, and history can they enter home screen, notifications, lock screen, car, and watch.</p><p>The second observation point is Capability. GUI Agent will continue to exist, but it is more like a compatibility path. Stable experience depends on whether AppFunctions, AgentCard, MCP tools, system-private capabilities, and top-app partnership interfaces can be uniformly indexed, routed, and audited.</p><p>The third observation point is permission and memory. The stronger an Agent phone becomes, the more it must explain “what data this task used, which data went to the cloud, which stayed on device, which will be remembered, and which can be deleted.” This must land in system UI and audit records, not stay as a privacy slogan.</p><p>The fourth observation point is device-cloud state. If a cloud Agent is only a stateless chat API, it cannot carry long tasks. The device cannot be only an entry point either. It must handle scene, confirmation, braking, and sensitive-data boundaries. What syncs between device and cloud should be tasks, Artifacts, authorizations, and audit, not an ever-growing chat context.</p><p>If an OpenAI phone appears, its meaning for Android may be here: it may not answer every question well, but it will make the industry see the importance of these system objects again. For practitioners, this section is a prompt: do not only look at how many AI features a launch event adds. Look at whether task, capability, permission, memory, and device-cloud state become OS-managed objects.</p><h2 id="Final-Judgment"><a href="#Final-Judgment" class="headerlink" title="Final Judgment"></a>Final Judgment</h2><p>Return to the five things in the introduction: state understanding, capability providers, task runtime, device-cloud division, and cross-boundary execution. Compress the whole article into six sentences.</p><p>First, phones will not be replaced by Agents. Phones will become the Agent’s most important state node.</p><p>Second, apps will not disappear, but their foreground entry role will gradually decline, while capability interfaces gain weight.</p><p>Third, Android’s short-term path keeps the existing system and adds a task system across Framework&#x2F;SystemUI&#x2F;permissions&#x2F;notifications&#x2F;on-device models&#x2F;cloud protocols.</p><p>Fourth, OpenAI may or may not build on Android. Without Android, it has more freedom but a harder time carrying app services. With Android, it enters the phone market faster but is constrained by the old system.</p><p>Fifth, Agent OS success depends not only on models, but on task runtime, capability routing, data classification, user confirmation, audit, device-cloud collaboration, and developer relationships.</p><p>Sixth, if an OpenAI phone appears around 2028, its greatest impact may come from the sample of a “task-stream-first phone.” Sales may not be the only metric.</p><p>For Android phone practitioners, this is not a distant concept. Every system AI entry point, permission dialog, AppFunction, on-device model service, and notification redesign being built now will decide whether the future Agent OS can be caught.</p><p>If AI phones are still understood as a collection of gallery, search, summary, and voice-assistant features, this change will be underestimated.</p><p>If they are understood as “phones starting to manage tasks,” the question becomes much clearer.</p><p>The next phone’s first screen may not immediately lose apps.</p><p>But it will look less and less like an app display case.</p><p>It will look more like a task entry point that is constrained by the system, authorized by the user, and able to keep working.</p><h2 id="References-and-Sources"><a href="#References-and-Sources" class="headerlink" title="References and Sources"></a>References and Sources</h2><ul><li>Ming-Chi Kuo’s supply-chain report about OpenAI, MediaTek, Qualcomm, Luxshare, and a 2028 AI Agent phone: <a href="https://www.frandroid.com/?p=3078665">Frandroid</a>, <a href="https://www.techritual.com/2026/04/27/516509/">Techritual</a>, <a href="https://www.qore.com/ai/openai-prepara-un-smartphone-con-ia-para-2028/">Qore</a></li><li>OpenAI and Jony Ive &#x2F; io hardware background: <a href="https://openai.com/sam-and-jony/">OpenAI - A letter from Sam &amp; Jony</a>, <a href="https://www.npr.org/2025/05/22/nx-s1-5407548/openai-jony-ive-io-deal-ai-devices">NPR</a></li><li>Android AppFunctions documentation: <a href="https://developer.android.com/ai/appfunctions">Android Developers - AppFunctions</a></li><li>A2A protocol materials and Linux Foundation news: <a href="https://a2a-protocol.org/latest/">A2A Protocol</a>, <a href="https://www.linuxfoundation.org/press/linux-foundation-launches-the-agent2agent-protocol-project-to-enable-secure-intelligent-communication-between-ai-agents">Linux Foundation A2A project</a></li><li>Samsung Galaxy AI and system-entry direction: <a href="https://news.samsung.com/us/">Samsung Newsroom</a>, <a href="https://news.samsung.com/global/samsung-advances-galaxy-ai-and-its-connected-ecosystem-at-mwc-2026">Samsung MWC 2026</a></li><li>Doubao phone, Nubia M153, and third-party app restrictions: <a href="https://www.scmp.com/business/china-business/article/3335404/bytedances-agentic-ai-smartphone-dials-digital-backlash-chinas-top-apps">SCMP</a>, <a href="https://technode.com/2025/12/15/bytedance-denies-reports-of-regulatory-meeting-over-doubao-ai-phone/">TechNode</a>, <a href="https://www.business-standard.com/world-news/bytedance-ai-phone-doubao-nubia-zte-app-blocks-user-control-china-125120800459_1.html">Business Standard</a></li></ul>]]></content>

    
    
    <summary type="html">&lt;blockquote&gt;
&lt;p&gt;Starting from Ming-Chi Kuo’s April 27, 2026 supply-chain report about an OpenAI phone, this article looks at the possible system shape after phones and AI merge, from the perspective of someone who works on Android phones.&lt;/p&gt;
&lt;/blockquote&gt;
&lt;h2 id=&quot;Introduction-This-Is-Not-Just-a-New-Phone-Problem&quot;&gt;&lt;a href=&quot;#Introduction-This-Is-Not-Just-a-New-Phone-Problem&quot; class=&quot;headerlink&quot; title=&quot;Introduction: This Is Not Just a New Phone Problem&quot;&gt;&lt;/a&gt;Introduction: This Is Not Just a New Phone Problem&lt;/h2&gt;&lt;p&gt;The most interesting part of Kuo’s report is not the 2028 mass-production window. It is not whether MediaTek, Qualcomm, or Luxshare ends up in which supplier position either.&lt;/p&gt;
&lt;p&gt;It pushes the question into the system layer:&lt;/p&gt;
&lt;p&gt;If the user’s primary goal shifts from opening apps to completing tasks, what should a phone operating system look like?&lt;/p&gt;
&lt;p&gt;That sounds like a UI question. From an Android practitioner’s perspective, it touches the whole system structure: Launcher, notifications, permissions, IPC, app capability declarations, model runtime, TEE, device-cloud sync, task state machines, audit logs, payment confirmation, and developer revenue sharing all need to be reconsidered.&lt;/p&gt;
&lt;p&gt;Over the past few years, most discussions about AI phones have stayed at the feature layer. Vendors talk about AI photo editing, AI erase, AI summaries, AI search, AI assistants, and AI briefings. All of these can fit inside today’s Android or iOS architecture.&lt;/p&gt;
&lt;p&gt;If OpenAI really builds an AI Agent phone, it will move the question from “how many AI features can be added to a phone” to “should the phone’s first entry point still start from app icons?”&lt;/p&gt;
&lt;p&gt;The main line is this: Agent OS looks like a structural migration of mobile OS after the graphical interface era. The foreground moves from an app grid to a task stream. The background moves from app-owned capability to authorized capability. The system moves from managing processes and windows to managing tasks, context, and responsibility.&lt;/p&gt;
&lt;p&gt;OpenAI does not have to build on Android, but Android is the more likely path because it inherits hardware adaptation, drivers, app compatibility, and supply-chain experience. If OpenAI wants to design the first screen, permissions, and task flow completely around Agent OS, it may also choose an “Android-compatible but not quite Android” path, or even build a Linux-based system and fill the service gap with the web, cloud execution, and an app compatibility layer.&lt;/p&gt;
&lt;p&gt;Different OS choices will change go-to-market speed. They will not change the five things Agent OS must solve:&lt;/p&gt;
&lt;ol&gt;
&lt;li&gt;The phone must continuously understand the user’s current state.&lt;/li&gt;
&lt;li&gt;Apps must move from foreground entry points to background capability providers.&lt;/li&gt;
&lt;li&gt;The system must have a task runtime that is recoverable, cancellable, and auditable.&lt;/li&gt;
&lt;li&gt;Device-side and cloud-side execution must be split by data sensitivity and real-time needs.&lt;/li&gt;
&lt;li&gt;Every cross-app, cross-device, and cross-cloud action must have permission, responsibility, and rollback boundaries.&lt;/li&gt;
&lt;/ol&gt;
&lt;p&gt;Without these five things, an AI phone is still just “a phone with an AI assistant.” Once they become system constraints, the phone starts moving toward Agent OS.&lt;/p&gt;</summary>


    <category term="AI" scheme="https://androidperformance.com/en/categories/AI/"/>
    
    
    <category term="Android" scheme="https://androidperformance.com/en/tags/Android/"/>
    
    <category term="Agent OS" scheme="https://androidperformance.com/en/tags/Agent-OS/"/>
    
    <category term="AI" scheme="https://androidperformance.com/en/tags/AI/"/>
    
    <category term="OpenAI" scheme="https://androidperformance.com/en/tags/OpenAI/"/>
    
    <category term="Mobile OS" scheme="https://androidperformance.com/en/tags/Mobile-OS/"/>
    
  </entry>
  
  <entry>
    <title>SmartPerfetto Architecture Q&amp;A: 8 In-Depth Technical Questions</title>
    <link href="https://androidperformance.com/en/2026/04/10/SmartPerfetto-Architecture-Deep-Dive-QA/"/>
    <id>https://androidperformance.com/en/2026/04/10/SmartPerfetto-Architecture-Deep-Dive-QA/</id>
    <published>2026-04-10T03:00:00.000Z</published>
    <updated>2026-05-10T23:29:51.062Z</updated>
    
    <content type="html"><![CDATA[<h1 id="SmartPerfetto-Architecture-Q-amp-A"><a href="#SmartPerfetto-Architecture-Q-amp-A" class="headerlink" title="SmartPerfetto Architecture Q&amp;A"></a>SmartPerfetto Architecture Q&amp;A</h1><blockquote><p>This article collects technical questions received after publishing <a href="/2026/04/10/SmartPerfetto-Architecture-Deep-Dive/">From Trace to Insight: Harness Engineering in SmartPerfetto AI Agent</a> and discusses them in Q&amp;A format.</p></blockquote><span id="more"></span><hr><h2 id="Q1-Why-build-a-custom-YAML-Skill-system-instead-of-using-Claude-Code’s-standard-Skills"><a href="#Q1-Why-build-a-custom-YAML-Skill-system-instead-of-using-Claude-Code’s-standard-Skills" class="headerlink" title="Q1: Why build a custom YAML Skill system instead of using Claude Code’s standard Skills?"></a>Q1: Why build a custom YAML Skill system instead of using Claude Code’s standard Skills?</h2><p><strong>Question context:</strong> Claude Code’s Skill system supports placing deterministic scripts in a <code>scripts/</code> directory to avoid LLM generalization. Since you can use scripts&#x2F; to execute fixed SQL, why build a separate YAML Skill system? Isn’t a YAML Skill essentially a tool that lets performance engineers execute SQL according to predefined rules?</p><h3 id="Key-distinction-The-two-Skill-systems-operate-at-different-layers"><a href="#Key-distinction-The-two-Skill-systems-operate-at-different-layers" class="headerlink" title="Key distinction: The two Skill systems operate at different layers"></a>Key distinction: The two Skill systems operate at different layers</h3><p>Claude Code Skills and SmartPerfetto YAML Skills solve problems at different stages:</p><figure class="highlight plaintext"><table><tr><td class="gutter"><pre><span class="line">1</span><br><span class="line">2</span><br><span class="line">3</span><br><span class="line">4</span><br><span class="line">5</span><br></pre></td><td class="code"><pre><span class="line">Development stage (when I write code):</span><br><span class="line">  Claude Code + Skills/Hooks → helps me develop SmartPerfetto</span><br><span class="line"></span><br><span class="line">Runtime stage (when users analyze traces):</span><br><span class="line">  SmartPerfetto Backend + YAML Skills → helps users analyze performance data</span><br></pre></td></tr></table></figure><p>Claude Code’s Skills run in the developer’s terminal as CLI tool extensions. SmartPerfetto’s YAML Skills run in the Skill Engine within the Express backend, invoked by the Agent at runtime through the MCP tool <code>invoke_skill</code>. The execution environments, invocation methods, and data flows are completely different.</p><h3 id="Even-focusing-only-on-“deterministic-execution-”-YAML-Skills-have-several-targeted-designs"><a href="#Even-focusing-only-on-“deterministic-execution-”-YAML-Skills-have-several-targeted-designs" class="headerlink" title="Even focusing only on “deterministic execution,” YAML Skills have several targeted designs"></a>Even focusing only on “deterministic execution,” YAML Skills have several targeted designs</h3><p><strong>1. Parameterized SQL, not fixed scripts</strong></p><p>Performance analysis SQL isn’t hardcoded – the same Skill needs to accept different parameters (process names, time ranges, frame ID lists):</p><figure class="highlight yaml"><table><tr><td class="gutter"><pre><span class="line">1</span><br><span class="line">2</span><br><span class="line">3</span><br><span class="line">4</span><br><span class="line">5</span><br><span class="line">6</span><br><span class="line">7</span><br><span class="line">8</span><br><span class="line">9</span><br><span class="line">10</span><br></pre></td><td class="code"><pre><span class="line"><span class="attr">steps:</span></span><br><span class="line">  <span class="bullet">-</span> <span class="attr">id:</span> <span class="string">thread_state_distribution</span></span><br><span class="line">    <span class="attr">type:</span> <span class="string">atomic</span></span><br><span class="line">    <span class="attr">sql:</span> <span class="string">|</span></span><br><span class="line"><span class="string">      SELECT state, SUM(dur) as total_dur</span></span><br><span class="line"><span class="string">      FROM thread_state ts</span></span><br><span class="line"><span class="string">      JOIN thread_track tt ON ts.track_id = tt.id</span></span><br><span class="line"><span class="string">      WHERE tt.utid = $&#123;main_thread_utid&#125;</span></span><br><span class="line"><span class="string">        AND ts.ts BETWEEN $&#123;start_ts&#125; AND $&#123;end_ts&#125;</span></span><br><span class="line"><span class="string">      GROUP BY state</span></span><br></pre></td></tr></table></figure><p><code>$&#123;main_thread_utid&#125;</code> and <code>$&#123;start_ts&#125;</code> are parameters passed in when Claude calls <code>invoke_skill</code>. The YAML Skill Engine performs parameter substitution before executing the SQL. With scripts&#x2F;, you’d either write shell scripts that accept parameters and concatenate SQL (prone to injection issues) or write full Python&#x2F;Node scripts – far more complex than YAML.</p><p><strong>2. Self-describing output format (DataEnvelope)</strong></p><figure class="highlight yaml"><table><tr><td class="gutter"><pre><span class="line">1</span><br><span class="line">2</span><br><span class="line">3</span><br><span class="line">4</span><br><span class="line">5</span><br></pre></td><td class="code"><pre><span class="line"><span class="attr">display:</span></span><br><span class="line">  <span class="attr">level:</span> <span class="string">detail</span></span><br><span class="line">  <span class="attr">columns:</span></span><br><span class="line">    <span class="bullet">-</span> &#123; <span class="attr">name:</span> <span class="string">state</span>, <span class="attr">type:</span> <span class="string">string</span> &#125;</span><br><span class="line">    <span class="bullet">-</span> &#123; <span class="attr">name:</span> <span class="string">total_dur</span>, <span class="attr">type:</span> <span class="string">duration</span> &#125;</span><br></pre></td></tr></table></figure><p>Each step declares the output columns’ names and types. The frontend automatically renders tables based on this schema – <code>duration</code> types are automatically formatted as ms, <code>timestamp</code> types support click-to-navigate to the Perfetto timeline. With scripts&#x2F;, the output is free-form text that the frontend can’t automatically render.</p><p><strong>3. Composable (composite + iterator)</strong></p><p>A composite Skill can reference multiple atomic Skills, and iterators can traverse data rows for per-frame analysis. This composition is declarative in YAML, with the Skill Engine handling orchestration. The scripts&#x2F; approach would require writing your own orchestration logic for the same composition.</p><p><strong>4. Designed for performance engineers, not developers</strong></p><p>The questioner got it right: YAML Skills are essentially a tool that lets performance engineers contribute analysis logic through predefined rules. Performance engineers know which SQL to query and which metrics to examine, but they don’t necessarily know TypeScript. The YAML format lets them directly define SQL queries and output formats without touching backend code. After modifications, changes take effect by simply refreshing the browser in DEV mode.</p><h3 id="Comparison-summary"><a href="#Comparison-summary" class="headerlink" title="Comparison summary"></a>Comparison summary</h3><table><thead><tr><th>Dimension</th><th>Claude Code scripts&#x2F;</th><th>SmartPerfetto YAML Skill</th></tr></thead><tbody><tr><td>Runtime environment</td><td>Developer terminal (CLI)</td><td>Express backend (runtime)</td></tr><tr><td>Caller</td><td>Developer via <code>/skill</code> command</td><td>Agent via <code>invoke_skill</code> MCP tool</td></tr><tr><td>Parameterization</td><td>Must handle yourself</td><td>&#96;${param</td></tr><tr><td>Output format</td><td>Free-form text</td><td>DataEnvelope (schema-driven)</td></tr><tr><td>Frontend rendering</td><td>Not involved</td><td>Automatic tables&#x2F;charts</td></tr><tr><td>Composition</td><td>Manual orchestration</td><td>composite &#x2F; iterator &#x2F; conditional</td></tr><tr><td>Contribution barrier</td><td>Must write scripts</td><td>Just YAML + SQL</td></tr></tbody></table><p>The two are not alternatives but solve different problems at different layers.</p><hr><h2 id="Q2-How-exactly-is-“deterministic-flexible”-implemented"><a href="#Q2-How-exactly-is-“deterministic-flexible”-implemented" class="headerlink" title="Q2: How exactly is “deterministic + flexible” implemented?"></a>Q2: How exactly is “deterministic + flexible” implemented?</h2><p><strong>Question context:</strong> The article says “known scenarios use Strategy files to constrain mandatory checks, but within each phase, the specific queries and deep drill directions are autonomously decided by Claude.” Where is the boundary between constraint and autonomy? How exactly is this achieved?</p><h3 id="Three-layer-mechanism-working-together"><a href="#Three-layer-mechanism-working-together" class="headerlink" title="Three-layer mechanism working together"></a>Three-layer mechanism working together</h3><p>This hybrid design relies on three layers working in concert: Strategy files define “what must be done,” Planning Gate enforces “plan before acting,” and Verifier performs post-hoc checks on “whether it was actually done.”</p><h3 id="Layer-1-Strategy-files-–-hard-constraints-alongside-soft-guidance"><a href="#Layer-1-Strategy-files-–-hard-constraints-alongside-soft-guidance" class="headerlink" title="Layer 1: Strategy files – hard constraints alongside soft guidance"></a>Layer 1: Strategy files – hard constraints alongside soft guidance</h3><p>Taking the scrolling analysis <code>scrolling.strategy.md</code> as an example, it defines multiple analysis phases, but the constraint strength differs across phases:</p><p><strong>Hard constraints (must execute; skipping triggers verification errors):</strong></p><p>Phase 1.9 root cause deep drill is the most strictly constrained phase, with the strategy file using red circle markers and “prohibited” language:</p><figure class="highlight markdown"><table><tr><td class="gutter"><pre><span class="line">1</span><br><span class="line">2</span><br><span class="line">3</span><br><span class="line">4</span><br><span class="line">5</span><br><span class="line">6</span><br><span class="line">7</span><br><span class="line">8</span><br><span class="line">9</span><br><span class="line">10</span><br></pre></td><td class="code"><pre><span class="line"><span class="strong">**Phase 1.9 -- Root Cause Deep Drill (Red circle mandatory, cannot skip):**</span></span><br><span class="line"></span><br><span class="line">For each reason<span class="emphasis">_code accounting for &gt;15% in `batch_</span>frame<span class="emphasis">_root_</span>cause`,</span><br><span class="line">you <span class="strong">**must**</span> select the most severe frame for deep drilling.</span><br><span class="line"><span class="strong">**Prohibited:**</span> drawing conclusions solely from <span class="code">`batch_frame_root_cause`</span> statistical classifications.</span><br><span class="line"></span><br><span class="line">| Condition                     | Deep drill action                                   |</span><br><span class="line">| Any reason<span class="emphasis">_code Q4&gt;20%        | invoke_</span>skill(&quot;blocking<span class="emphasis">_chain_</span>analysis&quot;, ...)        |</span><br><span class="line">| binder<span class="emphasis">_overlap &gt;5ms           | invoke_</span>skill(&quot;binder<span class="emphasis">_root_</span>cause&quot;, ...)              |</span><br><span class="line">| ...</span><br></pre></td></tr></table></figure><p><strong>Soft guidance (suggested but skippable):</strong></p><p>Phase 1.5 (architecture-aware branching) and Phase 1.7 (root cause branching) use suggestive language like “switch to” and “note,” allowing Claude to decide whether to execute based on actual data:</p><figure class="highlight markdown"><table><tr><td class="gutter"><pre><span class="line">1</span><br><span class="line">2</span><br><span class="line">3</span><br><span class="line">4</span><br><span class="line">5</span><br></pre></td><td class="code"><pre><span class="line"><span class="strong">**Phase 1.5 -- Architecture-Aware Branching:**</span></span><br><span class="line"></span><br><span class="line">| Architecture | Adjustment action |</span><br><span class="line">| Flutter      | Switch to flutter<span class="emphasis">_scrolling_</span>analysis |</span><br><span class="line">| WebView      | Note CrRendererMain thread |</span><br></pre></td></tr></table></figure><p>The entire content of the Strategy file is injected verbatim into the System Prompt, with a hard constraint statement added at injection time:</p><figure class="highlight plaintext"><table><tr><td class="gutter"><pre><span class="line">1</span><br><span class="line">2</span><br></pre></td><td class="code"><pre><span class="line">Scene Strategy (must be strictly followed)</span><br><span class="line">For the following common scenarios, proven analysis pipelines exist. All phases must be fully executed and cannot be skipped.</span><br></pre></td></tr></table></figure><p>Claude sees these phase definitions, red circle markers, and “prohibited” language directly in the System Prompt.</p><h3 id="Layer-2-Planning-Gate-–-forces-planning-first-but-doesn’t-limit-plan-content"><a href="#Layer-2-Planning-Gate-–-forces-planning-first-but-doesn’t-limit-plan-content" class="headerlink" title="Layer 2: Planning Gate – forces planning first, but doesn’t limit plan content"></a>Layer 2: Planning Gate – forces planning first, but doesn’t limit plan content</h3><p>Before executing any SQL queries or Skill invocations, Claude must first call <code>submit_plan</code> to submit an analysis plan. Calling <code>execute_sql</code> or <code>invoke_skill</code> without submitting a plan is directly rejected:</p><figure class="highlight typescript"><table><tr><td class="gutter"><pre><span class="line">1</span><br><span class="line">2</span><br><span class="line">3</span><br><span class="line">4</span><br></pre></td><td class="code"><pre><span class="line"><span class="keyword">function</span> <span class="title function_">requirePlan</span>(<span class="params">toolName: <span class="built_in">string</span></span>): <span class="built_in">string</span> | <span class="literal">null</span> &#123;</span><br><span class="line">  <span class="keyword">if</span> (analysisPlanRef.<span class="property">current</span>) <span class="keyword">return</span> <span class="literal">null</span>;  <span class="comment">// Plan exists, allow</span></span><br><span class="line">  <span class="keyword">return</span> <span class="string">`Must call submit_plan to submit an analysis plan before using <span class="subst">$&#123;toolName&#125;</span>`</span>;</span><br><span class="line">&#125;</span><br></pre></td></tr></table></figure><p>The key point is: <strong>the Gate only requires a plan to exist, not that it precisely matches the Strategy’s phases.</strong> Claude can submit any plan structure – it can merge Phase 1 and 1.5, add extra steps not mentioned in the Strategy, or adjust deep drill directions based on preliminary data.</p><p>When submitting a plan, the system performs scene-aware keyword checking (e.g., for scrolling scenarios, checking whether the plan mentions “frames,” “jank,” etc.), but this is only at the <strong>warning level</strong> – the plan is accepted even without these keywords.</p><p>The purpose of this design is: force Claude to think clearly about what it wants to do before acting (planning discipline), without restricting how it thinks (planning freedom).</p><h3 id="Layer-3-Verifier-–-multi-dimensional-post-hoc-checking"><a href="#Layer-3-Verifier-–-multi-dimensional-post-hoc-checking" class="headerlink" title="Layer 3: Verifier – multi-dimensional post-hoc checking"></a>Layer 3: Verifier – multi-dimensional post-hoc checking</h3><p>There can be gaps between planning and execution – Claude might submit a plan but actually skip a critical step. The Verifier performs multi-dimensional post-hoc checks after analysis completes, primarily using heuristic behavioral checks while supplementing with plan&#x2F;hypothesis&#x2F;scene completeness validation:</p><p><strong>a) Scene completeness check</strong> – whether the analysis output covers the scene’s core content:</p><figure class="highlight typescript"><table><tr><td class="gutter"><pre><span class="line">1</span><br><span class="line">2</span><br><span class="line">3</span><br><span class="line">4</span><br><span class="line">5</span><br><span class="line">6</span><br><span class="line">7</span><br><span class="line">8</span><br><span class="line">9</span><br><span class="line">10</span><br><span class="line">11</span><br></pre></td><td class="code"><pre><span class="line"><span class="comment">// Scrolling scenario: check if significant jank exists but Phase 1.9 deep drill was skipped</span></span><br><span class="line"><span class="keyword">case</span> <span class="string">&#x27;scrolling&#x27;</span>: &#123;</span><br><span class="line">  <span class="keyword">const</span> hasSignificantJank = <span class="comment">/* detect if text mentions significant frame drops */</span>;</span><br><span class="line">  <span class="keyword">const</span> hasDeepDrill = <span class="comment">/* detect if blocking_chain / binder_root_cause etc. were called */</span>;</span><br><span class="line">  <span class="keyword">if</span> (hasSignificantJank &amp;&amp; !hasDeepDrill) &#123;</span><br><span class="line">    issues.<span class="title function_">push</span>(&#123;</span><br><span class="line">      <span class="attr">severity</span>: <span class="string">&#x27;error&#x27;</span>,</span><br><span class="line">      <span class="attr">message</span>: <span class="string">&#x27;Scrolling analysis has jank but missing Phase 1.9 root cause deep drill -- reason_code is just a classification label, not the real root cause&#x27;</span></span><br><span class="line">    &#125;);</span><br><span class="line">  &#125;</span><br><span class="line">&#125;</span><br></pre></td></tr></table></figure><p><strong>b) Hypothesis closure check</strong> – whether all <code>submit_hypothesis</code> calls have corresponding <code>resolve_hypothesis</code> calls.</p><p><strong>c) Causal chain depth check</strong> – whether CRITICAL&#x2F;HIGH severity findings contain sufficient causal connectors and mechanistic terminology (heuristic text matching).</p><p><strong>d) Optional LLM review</strong> – using an independent Haiku model for evidence support verification (can be disabled).</p><p>If the check finds ERROR-level issues, it triggers a Correction Prompt for Claude to fill in the gaps.</p><p>Note that the Verifier <strong>does not check whether Claude’s plan phases match the Strategy’s phase numbers</strong> – it checks whether “critical analysis actions are reflected in the output,” not whether “the plan format is correct.”</p><h3 id="The-complete-constraint-spectrum"><a href="#The-complete-constraint-spectrum" class="headerlink" title="The complete constraint spectrum"></a>The complete constraint spectrum</h3><p>Layering all three mechanisms together, different phases form a spectrum of constraint strength:</p><table><thead><tr><th>Phase</th><th>Strategy tone</th><th align="center">Planning Gate</th><th align="center">Verifier check</th><th align="center">Constraint strength</th></tr></thead><tbody><tr><td>Phase 1 (overview)</td><td>Suggestive</td><td align="center">Plan required</td><td align="center">Not individually checked</td><td align="center">Medium</td></tr><tr><td>Phase 1.5 (architecture branch)</td><td>Suggestive</td><td align="center">–</td><td align="center">Not checked</td><td align="center">Low</td></tr><tr><td>Phase 1.7 (root cause branch)</td><td>Suggestive + conditional</td><td align="center">–</td><td align="center">Not checked</td><td align="center">Low</td></tr><tr><td>Phase 1.9 (root cause deep drill)</td><td><strong>Must&#x2F;Prohibited</strong></td><td align="center">–</td><td align="center"><strong>Checks if deep drill tools were called</strong></td><td align="center"><strong>High</strong></td></tr><tr><td>Phase 2 (supplementary deep drill)</td><td>Optional</td><td align="center">–</td><td align="center">Not checked</td><td align="center">None</td></tr><tr><td>Phase 3 (comprehensive conclusion)</td><td>Must cover distribution</td><td align="center">–</td><td align="center">Checks conclusion completeness</td><td align="center">Medium</td></tr></tbody></table><p>Meanwhile, <code>general.strategy.md</code> (the fallback when no scene matches) is entirely soft guidance: it only provides a routing decision tree based on the user’s focus direction (CPU -&gt; cpu_analysis, memory -&gt; memory_analysis), with no mandatory phases. Claude has complete autonomy in the general scenario.</p><h3 id="One-sentence-summary"><a href="#One-sentence-summary" class="headerlink" title="One-sentence summary"></a>One-sentence summary</h3><p><strong>Strategy files tell Claude “analyzing scrolling issues requires at least these steps,” Planning Gate ensures it thinks before acting, and Verifier post-checks whether critical steps were actually performed.</strong> But within this framework, what specific data to query, which tools to use, and in what order – all of these are autonomously decided by Claude based on actual data.</p><hr><h2 id="Q3-What’s-the-biggest-difference-between-Agent-and-Workflow-Where-are-the-Agent’s-capability-boundaries-and-what-determines-them"><a href="#Q3-What’s-the-biggest-difference-between-Agent-and-Workflow-Where-are-the-Agent’s-capability-boundaries-and-what-determines-them" class="headerlink" title="Q3: What’s the biggest difference between Agent and Workflow? Where are the Agent’s capability boundaries and what determines them?"></a>Q3: What’s the biggest difference between Agent and Workflow? Where are the Agent’s capability boundaries and what determines them?</h2><p><strong>Question context:</strong> In building our Agent, we went from initially assuming the Agent could understand and make decisions about every Skill given to it, to now having essentially hardcoded a decision tree in the Skills. The stepping stones along the way were always: “we assumed the Agent had capability X, but it didn’t,” causing its output to deviate from our expectations, so we kept adding boundaries to the Skills until it became a hardcoded Workflow.</p><h3 id="The-essential-difference-Who-holds-decision-making-authority"><a href="#The-essential-difference-Who-holds-decision-making-authority" class="headerlink" title="The essential difference: Who holds decision-making authority"></a>The essential difference: Who holds decision-making authority</h3><p>Agent and Workflow aren’t two tools or two frameworks – they’re two ends of the same spectrum:</p><figure class="highlight plaintext"><table><tr><td class="gutter"><pre><span class="line">1</span><br><span class="line">2</span><br><span class="line">3</span><br><span class="line">4</span><br><span class="line">5</span><br></pre></td><td class="code"><pre><span class="line">Hardcoded Workflow &lt;------------------------------------&gt; Fully Autonomous Agent</span><br><span class="line">  |                                                              |</span><br><span class="line">  Developer controls every branch                     LLM decides everything</span><br><span class="line">  |                                                              |</span><br><span class="line">  High determinism, low flexibility                   Low determinism, high flexibility</span><br></pre></td></tr></table></figure><table><thead><tr><th>Dimension</th><th>Workflow</th><th>Agent</th></tr></thead><tbody><tr><td>Control flow</td><td>Developer hardcodes <code>if/else</code> in code</td><td>LLM autonomously selects next step</td></tr><tr><td>Tool selection</td><td>Predefined execution order</td><td>LLM selects on-demand based on data</td></tr><tr><td>Branch conditions</td><td>Conditional logic in code</td><td>LLM reasoning</td></tr><tr><td>Failure handling</td><td><code>try/catch</code> + retry logic</td><td>LLM self-reflection + direction change</td></tr><tr><td>Predictability</td><td>Highly deterministic</td><td>Highly uncertain</td></tr><tr><td>Adapting to new scenarios</td><td>Developer must add branches</td><td>Can explore autonomously</td></tr></tbody></table><p><strong>But in engineering practice, almost no one operates at either extreme of the spectrum.</strong> Pure Workflows can’t handle unknown scenarios; pure Agents are unreliable on critical steps. Real-world production systems sit somewhere in the middle.</p><h3 id="The-root-cause-of-your-pitfalls-Making-global-assumptions-about-Agent-capabilities"><a href="#The-root-cause-of-your-pitfalls-Making-global-assumptions-about-Agent-capabilities" class="headerlink" title="The root cause of your pitfalls: Making global assumptions about Agent capabilities"></a>The root cause of your pitfalls: Making global assumptions about Agent capabilities</h3><p>“Defaulting to ‘Agent can understand everything’ -&gt; discovering it can’t -&gt; constantly adding constraints -&gt; becoming a hardcoded Workflow” – the fundamental problem with this path is: <strong>making a one-size-fits-all judgment about Agent capabilities.</strong></p><p>But Agent capabilities vary enormously across different tasks:</p><table><thead><tr><th>Capability dimension</th><th>LLM reliability</th><th>Who should handle it</th></tr></thead><tbody><tr><td><strong>Intent understanding</strong> (what the user wants)</td><td>High</td><td>Agent (though simple scenarios can use keyword matching instead)</td></tr><tr><td><strong>Plan formulation</strong> (how many steps, what order)</td><td>Medium</td><td>Needs a constraint framework: Strategy files provide structure, LLM fills in details</td></tr><tr><td><strong>Data collection</strong> (what to query)</td><td>Medium</td><td>Semi-autonomous: Skills define what to query, Agent decides order and parameters</td></tr><tr><td><strong>Data reasoning</strong> (attribution after seeing data)</td><td>High</td><td>Agent – this is LLM’s greatest value</td></tr><tr><td><strong>Precise computation</strong> (numerical statistics)</td><td>Very low</td><td>Tool system (SQL &#x2F; Skill Engine)</td></tr><tr><td><strong>Self-evaluation</strong> (knowing if it’s right)</td><td>Low</td><td>External Verifier; don’t trust Agent self-assessment</td></tr></tbody></table><p>The correct approach isn’t “choose Agent globally or choose Workflow globally,” but <strong>assign by task</strong>:</p><figure class="highlight plaintext"><table><tr><td class="gutter"><pre><span class="line">1</span><br><span class="line">2</span><br><span class="line">3</span><br><span class="line">4</span><br><span class="line">5</span><br></pre></td><td class="code"><pre><span class="line">Scene recognition     -&gt; Workflow (deterministic logic, no LLM needed)</span><br><span class="line">Data collection       -&gt; Semi-Workflow (Skills define what to query, Agent decides order and params)</span><br><span class="line">Reasoning/attribution -&gt; Agent (this is LLM&#x27;s core value; given enough data, it performs well)</span><br><span class="line">Output formatting     -&gt; Workflow (templated, deterministic)</span><br><span class="line">Quality verification  -&gt; Workflow (rule checking) + Agent (LLM review)</span><br></pre></td></tr></table></figure><h3 id="SmartPerfetto’s-approach-A-constraint-strength-spectrum"><a href="#SmartPerfetto’s-approach-A-constraint-strength-spectrum" class="headerlink" title="SmartPerfetto’s approach: A constraint strength spectrum"></a>SmartPerfetto’s approach: A constraint strength spectrum</h3><p>SmartPerfetto doesn’t choose between Agent and Workflow; instead, it sets different constraint strengths for different analysis phases (detailed in Q2). Here we re-examine this design from the “capability boundary” perspective:</p><p><strong>High constraint (Phase 1.9 root cause deep drill) – because the Agent is unreliable at “deciding whether to deep drill”:</strong></p><figure class="highlight markdown"><table><tr><td class="gutter"><pre><span class="line">1</span><br><span class="line">2</span><br><span class="line">3</span><br><span class="line">4</span><br><span class="line">5</span><br><span class="line">6</span><br><span class="line">7</span><br></pre></td><td class="code"><pre><span class="line"><span class="section"># Phase 1.9 in scrolling.strategy.md</span></span><br><span class="line"></span><br><span class="line"><span class="strong">**Phase 1.9 -- Root Cause Deep Drill (Red circle mandatory, cannot skip):**</span></span><br><span class="line"></span><br><span class="line">For each reason<span class="emphasis">_code accounting for &gt;15% in batch_</span>frame<span class="emphasis">_root_</span>cause,</span><br><span class="line">you <span class="strong">**must**</span> select the most severe frame for deep drilling.</span><br><span class="line"><span class="strong">**Prohibited:**</span> drawing conclusions solely from batch<span class="emphasis">_frame_</span>root<span class="emphasis">_cause statistical classifications.</span></span><br></pre></td></tr></table></figure><p>Why the hard constraint? Because we found the Agent has a systematic bias: <strong>it tends to jump straight to conclusions after getting overview data, skipping the deep drill.</strong> This isn’t because the model isn’t smart enough – Claude is perfectly capable of root cause deep drilling – but because the model exhibits “path dependency”: overview data already contains statistical classifications (<code>reason_code</code>), and for the model, “using classification labels directly for conclusions” has much lower cognitive cost than “spending 3 tool-call rounds doing per-frame deep drilling.”</p><p><strong>Low constraint (Phase 1.5 architecture branch) – because the Agent is reliable enough at “selecting tools based on data”:</strong></p><figure class="highlight markdown"><table><tr><td class="gutter"><pre><span class="line">1</span><br><span class="line">2</span><br><span class="line">3</span><br><span class="line">4</span><br><span class="line">5</span><br><span class="line">6</span><br><span class="line">7</span><br></pre></td><td class="code"><pre><span class="line"><span class="section"># Phase 1.5 in scrolling.strategy.md</span></span><br><span class="line"></span><br><span class="line"><span class="strong">**Phase 1.5 -- Architecture-Aware Branching:**</span></span><br><span class="line"></span><br><span class="line">| Architecture | Adjustment action |</span><br><span class="line">| Flutter      | Switch to flutter<span class="emphasis">_scrolling_</span>analysis |</span><br><span class="line">| WebView      | Note CrRendererMain thread |</span><br></pre></td></tr></table></figure><p>This uses suggestive language like “switch to” and “note” without enforcement. Because the architecture detection result (Flutter&#x2F;WebView&#x2F;Standard) has already been placed in the system prompt by deterministic code, the Agent has a high probability of selecting the correct Skill after seeing this information.</p><p><strong>Zero constraint (general scenario) – because the Agent’s autonomous exploration is the only option:</strong></p><figure class="highlight yaml"><table><tr><td class="gutter"><pre><span class="line">1</span><br><span class="line">2</span><br><span class="line">3</span><br><span class="line">4</span><br><span class="line">5</span><br><span class="line">6</span><br><span class="line">7</span><br></pre></td><td class="code"><pre><span class="line"><span class="comment"># general.strategy.md -- only a routing decision tree, no mandatory steps</span></span><br><span class="line"></span><br><span class="line"><span class="attr">Scene:</span> <span class="string">general</span></span><br><span class="line"><span class="attr">priority:</span> <span class="number">99</span></span><br><span class="line"></span><br><span class="line"><span class="string">The</span> <span class="string">current</span> <span class="string">query</span> <span class="string">did</span> <span class="string">not</span> <span class="string">match</span> <span class="string">a</span> <span class="string">specific</span> <span class="string">scene</span> <span class="string">strategy.</span> <span class="string">Based</span> <span class="string">on</span> <span class="string">the</span> <span class="string">user&#x27;s</span></span><br><span class="line"><span class="string">focus</span> <span class="string">direction,</span> <span class="string">use</span> <span class="string">the</span> <span class="string">following</span> <span class="string">decision</span> <span class="string">tree</span> <span class="string">to</span> <span class="string">select</span> <span class="string">the</span> <span class="string">appropriate</span> <span class="string">analysis</span> <span class="string">path.</span></span><br></pre></td></tr></table></figure><p>The general scenario has zero hard constraints because entering general means the user’s question exceeds predefined scenarios, and a Workflow can’t handle it. At this point, the only option is to trust the Agent’s autonomous exploration capability.</p><h3 id="What-determines-Agent-capability-boundaries"><a href="#What-determines-Agent-capability-boundaries" class="headerlink" title="What determines Agent capability boundaries"></a>What determines Agent capability boundaries</h3><p>Agent capability boundaries don’t depend on model parameter count or benchmark scores, but on three engineering factors:</p><p><strong>1. Observation capability – what data can the Agent “see”</strong></p><p>The same model, given structured L2 per-frame data from the <code>scrolling_analysis</code> Skill vs. writing SQL to query raw tables itself, produces significantly different analysis quality. The Agent’s ceiling is determined by the data tools you provide. SmartPerfetto uses 164 YAML Skills to encapsulate domain experts’ query logic; the Agent gets processed, structured analysis data through <code>invoke_skill</code>, not raw millions of trace events.</p><p><strong>2. Constraint framework – within what bounds does the Agent make decisions</strong></p><p>An unconstrained Agent is like an intern without a task checklist – knowledgeable enough but unsure what to do first. Strategy files, Planning Gate, and Verifier together define the Agent’s decision boundaries: Strategy tells it “at minimum, what must be done,” Planning Gate forces it to “think before acting,” and Verifier post-checks “whether the analysis is sufficient” (heuristic checks + hypothesis closure + scene completeness + optional LLM review).</p><p><strong>3. Feedback quality – can the Agent be corrected when wrong</strong></p><p>A significant proportion of Agent findings have issues (shallow attribution, false positives, missing critical steps). Relying solely on model self-correction has limited effectiveness. SmartPerfetto uses multi-layer verification + external correction prompts to close the loop:</p><figure class="highlight plaintext"><table><tr><td class="gutter"><pre><span class="line">1</span><br><span class="line">2</span><br><span class="line">3</span><br></pre></td><td class="code"><pre><span class="line">Verifier finds ERROR -&gt; Generates Correction Prompt -&gt; Triggers SDK retry</span><br><span class="line">                        ^                              |</span><br><span class="line">                  Learned patterns &lt;- Accumulated historical misjudgment patterns</span><br></pre></td></tr></table></figure><h3 id="Addendum-Strategy-files-are-SOPs-and-that’s-fine"><a href="#Addendum-Strategy-files-are-SOPs-and-that’s-fine" class="headerlink" title="Addendum: Strategy files are SOPs, and that’s fine"></a>Addendum: Strategy files are SOPs, and that’s fine</h3><p>Some might point out that <code>scrolling.strategy.md</code> reads like an SOP (Standard Operating Procedure) – with numbered Phases, condition tables, mandatory items, and even explicit <code>invoke_skill(&quot;scrolling_analysis&quot;, &#123;...&#125;)</code>. How is this different from “hardcoding a decision tree in Skills”?</p><p><strong>Let’s be direct: in the data collection phase, SmartPerfetto’s scrolling analysis is a Workflow.</strong> Strategy files are SOPs that encode domain experts’ analysis experience into deterministic steps. This is intentional.</p><p>The key is understanding what the SOP covers and what it doesn’t:</p><p><strong>What the SOP can cover (data collection) – what Strategy files do:</strong></p><figure class="highlight plaintext"><table><tr><td class="gutter"><pre><span class="line">1</span><br><span class="line">2</span><br><span class="line">3</span><br><span class="line">4</span><br><span class="line">5</span><br></pre></td><td class="code"><pre><span class="line">scrolling.strategy.md:</span><br><span class="line">  Phase 1:   &quot;Invoke scrolling_analysis&quot;                &lt;- Hardcoded what data to collect</span><br><span class="line">  Phase 1.5: &quot;Flutter switches to flutter_scrolling_analysis&quot; &lt;- Hardcoded conditional branch</span><br><span class="line">  Phase 1.7: Condition table -&gt; deep drill actions      &lt;- Hardcoded if/then table</span><br><span class="line">  Phase 1.9: &quot;Red circle reason_code &gt;15% must deep drill&quot;  &lt;- Hardcoded mandatory items</span><br></pre></td></tr></table></figure><p><strong>What the SOP can’t cover (reasoning&#x2F;attribution) – where the Agent’s value lies:</strong></p><figure class="highlight plaintext"><table><tr><td class="gutter"><pre><span class="line">1</span><br><span class="line">2</span><br><span class="line">3</span><br><span class="line">4</span><br></pre></td><td class="code"><pre><span class="line">- Among 47 jank frames, which share the same root cause? (Data clustering)</span><br><span class="line">- Among 19 workload_heavy frames, which is &quot;most severe&quot; and worth deep drilling? (Priority judgment)</span><br><span class="line">- Deep drill reveals Binder blocking 23ms + thermal throttling simultaneously; what&#x27;s the causal direction? (Causal reasoning)</span><br><span class="line">- How should the final conclusion be organized? How to differentiate recommendations for App developers vs. platform engineers? (Expression decisions)</span><br></pre></td></tr></table></figure><p><strong>Different scenarios have different SOP levels:</strong></p><table><thead><tr><th>Strategy file</th><th>SOP level</th><th>Reason</th></tr></thead><tbody><tr><td><code>scrolling.strategy.md</code></td><td><strong>High</strong> – Phase numbers + condition tables + mandatory items</td><td>Scrolling analysis methodology is most mature; optimal data collection paths are known</td></tr><tr><td><code>startup.strategy.md</code></td><td><strong>Medium-high</strong> – Has Phase structure, but deep drill directions are more open</td><td>Startup scenarios are more diverse (cold&#x2F;warm&#x2F;hot, different bottlenecks)</td></tr><tr><td><code>anr.strategy.md</code></td><td><strong>Medium</strong> – 2-skill pipeline, but root cause analysis relies entirely on reasoning</td><td>ANR root causes are highly diverse</td></tr><tr><td><code>general.strategy.md</code></td><td><strong>Low</strong> – Only a routing decision tree, no mandatory items</td><td>Unknown scenarios, impossible to turn into an SOP</td></tr></tbody></table><p><code>scrolling.strategy.md</code> has the highest SOP level because scrolling analysis methodology is the most mature. <code>general.strategy.md</code> has almost no SOP because user questions are completely unpredictable.</p><p><strong>So the correct understanding is: SmartPerfetto &#x3D; “SOP-driven data collection + Agent-driven reasoning&#x2F;attribution.”</strong></p><p>The SOP addresses “what data to look at, at minimum, when analyzing scrolling issues” – this question has a deterministic answer, and using an SOP is correct. The Agent addresses “how to reason about causality and organize conclusions after getting the data” – this question differs for every trace and can’t be turned into an SOP.</p><p><strong>Back to your pitfalls: The problem isn’t “Skills becoming SOPs” – the data collection phase should use SOPs. The problem is “the SOP consuming the reasoning” – if the SOP hardcodes even the conclusions (“if you see X, output Y”), the Agent truly degrades into a Workflow. The key is letting the SOP stop at data collection and leaving reasoning to the Agent.</strong></p><h3 id="One-sentence-summary-1"><a href="#One-sentence-summary-1" class="headerlink" title="One-sentence summary"></a>One-sentence summary</h3><p><strong>The difference between Agent and Workflow isn’t “intelligent vs. hardcoded,” but “how decision-making authority is allocated.” Agent capability boundaries are jointly determined by “observation capability x constraint framework x feedback quality.” The correct approach is to allocate decision-making authority by task – granting autonomy where the Agent is reliable, adding constraints where it isn’t – rather than making a one-size-fits-all choice.</strong></p><hr><h2 id="Q4-Does-the-Agent-architecture-need-improvement-from-a-business-perspective"><a href="#Q4-Does-the-Agent-architecture-need-improvement-from-a-business-perspective" class="headerlink" title="Q4: Does the Agent architecture need improvement from a business perspective?"></a>Q4: Does the Agent architecture need improvement from a business perspective?</h2><p><strong>Question context:</strong> Agent architecture has gone through different designs and evolutions – from the initial ReAct architecture to LangGraph’s node-based architecture. How do different Agent architecture designs affect it? When building your own business Agent, should you consider the architecture’s impact on Agent performance? For example, SmartPerfetto has added different Skill loading modes on top of the Claude Agent SDK based on business understanding.</p><h3 id="Essential-differences-of-three-mainstream-architectures"><a href="#Essential-differences-of-three-mainstream-architectures" class="headerlink" title="Essential differences of three mainstream architectures"></a>Essential differences of three mainstream architectures</h3><table><thead><tr><th>Architecture</th><th>Control flow model</th><th>Developer role</th><th>Best suited for</th></tr></thead><tbody><tr><td><strong>ReAct</strong></td><td>Linear loop: Think -&gt; Act -&gt; Observe -&gt; Think…</td><td>Define tools</td><td>Simple tasks with few tools and short paths</td></tr><tr><td><strong>LangGraph Node-based</strong></td><td>DAG graph: nodes&#x3D;steps, edges&#x3D;conditional jumps</td><td>Design graph structure + define nodes + write jump conditions</td><td>Deterministic processes with clear steps and limited branches</td></tr><tr><td><strong>Native SDK</strong></td><td>SDK manages turn loop, developer only defines tools</td><td>Define tools + inject context</td><td>Many tools, unpredictable paths, requiring LLM autonomous orchestration</td></tr></tbody></table><p>Their core difference lies in <strong>“who decides what to do next”</strong>:</p><ul><li><strong>ReAct</strong>: LLM makes complete decisions at every step (what to think, what to do, which tool to use); the framework just forwards</li><li><strong>LangGraph</strong>: Developers predefine all possible paths (nodes + edges); LLM only makes local decisions within nodes</li><li><strong>Native SDK</strong>: SDK manages the conversation loop, LLM autonomously selects tools, developers indirectly constrain through system prompts and tool design</li></ul><h3 id="Why-SmartPerfetto-chose-Native-SDK-custom-constraint-layers"><a href="#Why-SmartPerfetto-chose-Native-SDK-custom-constraint-layers" class="headerlink" title="Why SmartPerfetto chose Native SDK + custom constraint layers"></a>Why SmartPerfetto chose Native SDK + custom constraint layers</h3><p>SmartPerfetto’s architecture is <strong>Claude Agent SDK (Native SDK) + three constraint layers (Strategy&#x2F;Planning Gate&#x2F;Verifier)</strong>:</p><figure class="highlight plaintext"><table><tr><td class="gutter"><pre><span class="line">1</span><br><span class="line">2</span><br><span class="line">3</span><br><span class="line">4</span><br><span class="line">5</span><br><span class="line">6</span><br><span class="line">7</span><br><span class="line">8</span><br></pre></td><td class="code"><pre><span class="line">Claude Agent SDK provides:              SmartPerfetto custom-built:</span><br><span class="line">+- Turn loop (auto multi-turn mgmt)     +- Scene Classification (scene routing, &lt;1ms)</span><br><span class="line">+- Tool dispatching (MCP tool calls)     +- Strategy Injection (inject analysis strategy by scene)</span><br><span class="line">+- Streaming (SSE event stream)          +- Planning Gate (force plan before execute)</span><br><span class="line">+- Session resume (multi-turn recovery)  +- Verifier (post-hoc verification + correction retry)</span><br><span class="line">+- Sub-agent orchestration               +- ArtifactStore (3-level cache for token compression)</span><br><span class="line">                                         +- Conditional Tool Loading (inject/hide tools by scene)</span><br><span class="line">                                         +- Cross-Session Memory (pattern memory + negative memory)</span><br></pre></td></tr></table></figure><p><strong>Why not LangGraph?</strong></p><p>The root cause reasoning paths in performance analysis are <strong>unpredictable</strong>. The same “scrolling stuttering” could be caused by:</p><ul><li>Binder blocking -&gt; needs to trace thread state on the system_server side</li><li>Slow GPU rendering -&gt; needs to check GPU frequency and fence wait</li><li>GC pauses -&gt; needs to examine Java heap and GC events</li><li>Thermal throttling -&gt; needs to check thermal zone and CPU frequency</li><li>Lock contention -&gt; needs to check monitor contention</li><li>A combination of multiple causes above</li></ul><p>With LangGraph, you’d need to predefine a DAG node and jump condition for every root cause path. With 21 reason_codes in performance analysis, each combinable with deep drills, the combinatorial explosion of paths makes the DAG graph unmaintainable.</p><p>The more fundamental problem is: <strong>before seeing the data, you don’t know which path to take.</strong> LangGraph’s DAG graph assumes the developer can predict all branch conditions in advance, but performance analysis branch conditions depend on runtime data.</p><p><strong>Advantages of the Native SDK architecture:</strong></p><p>LLM autonomously selects tool paths, but three constraint layers ensure critical steps aren’t skipped:</p><figure class="highlight python"><table><tr><td class="gutter"><pre><span class="line">1</span><br><span class="line">2</span><br><span class="line">3</span><br><span class="line">4</span><br><span class="line">5</span><br><span class="line">6</span><br><span class="line">7</span><br><span class="line">8</span><br><span class="line">9</span><br></pre></td><td class="code"><pre><span class="line"><span class="comment"># LangGraph requires predefined DAG:</span></span><br><span class="line">graph.add_edge(<span class="string">&quot;overview&quot;</span>, <span class="string">&quot;check_binder&quot;</span>)</span><br><span class="line">graph.add_edge(<span class="string">&quot;overview&quot;</span>, <span class="string">&quot;check_gpu&quot;</span>)</span><br><span class="line">graph.add_edge(<span class="string">&quot;overview&quot;</span>, <span class="string">&quot;check_gc&quot;</span>)</span><br><span class="line"><span class="comment"># ... every new root cause requires modifying the graph structure</span></span><br><span class="line"></span><br><span class="line"><span class="comment"># SmartPerfetto Strategy only needs to declare:</span></span><br><span class="line"><span class="comment"># &quot;For each reason_code accounting for &gt;15%, must select the most severe frame for deep drill&quot;</span></span><br><span class="line"><span class="comment"># Agent autonomously decides which specific deep drill tool to call</span></span><br></pre></td></tr></table></figure><h3 id="Key-business-driven-architectural-designs"><a href="#Key-business-driven-architectural-designs" class="headerlink" title="Key business-driven architectural designs"></a>Key business-driven architectural designs</h3><p>The following are architectural improvements SmartPerfetto made based on business understanding, each directly corresponding to a business problem:</p><p><strong>1. Conditional tool loading – reduce the Agent’s decision space</strong></p><p>SmartPerfetto has up to 20 MCP tools total (9 always-on + 11 conditionally injected), but only a subset is injected per analysis:</p><figure class="highlight typescript"><table><tr><td class="gutter"><pre><span class="line">1</span><br><span class="line">2</span><br><span class="line">3</span><br><span class="line">4</span><br><span class="line">5</span><br><span class="line">6</span><br><span class="line">7</span><br><span class="line">8</span><br><span class="line">9</span><br><span class="line">10</span><br><span class="line">11</span><br></pre></td><td class="code"><pre><span class="line"><span class="comment">// claudeMcpServer.ts -- switch tool sets by mode</span></span><br><span class="line"></span><br><span class="line"><span class="keyword">if</span> (options.<span class="property">lightweight</span>) &#123;</span><br><span class="line">  <span class="comment">// Factual queries (e.g., &quot;what&#x27;s the frame rate&quot;): only 3 tools</span></span><br><span class="line">  toolEntries = [executeSql, invokeSkill, lookupSqlSchema];</span><br><span class="line">&#125; <span class="keyword">else</span> &#123;</span><br><span class="line">  <span class="comment">// Full analysis: 9 always-on (incl. recall_patterns) + conditionally inject by context</span></span><br><span class="line">  <span class="comment">// Comparison mode -&gt; inject compare_skill, execute_sql_on, get_comparison_context</span></span><br><span class="line">  <span class="comment">// Hypothesis management -&gt; inject submit_hypothesis, resolve_hypothesis, flag_uncertainty</span></span><br><span class="line">  <span class="comment">// Planning tools -&gt; inject submit_plan, update_plan_phase, revise_plan</span></span><br><span class="line">&#125;</span><br></pre></td></tr></table></figure><p><strong>Business reason:</strong> More tools means higher probability of the Agent selecting the wrong one. A query that just needs a quick answer to “what’s the frame rate,” if presented with a dozen planning&#x2F;hypothesis&#x2F;comparison tools, might lead the Agent to over-analyze.</p><p><strong>2. Sub-Agent scene gating – avoid unnecessary parallel overhead</strong></p><figure class="highlight typescript"><table><tr><td class="gutter"><pre><span class="line">1</span><br><span class="line">2</span><br><span class="line">3</span><br><span class="line">4</span><br><span class="line">5</span><br><span class="line">6</span><br><span class="line">7</span><br><span class="line">8</span><br><span class="line">9</span><br><span class="line">10</span><br></pre></td><td class="code"><pre><span class="line"><span class="comment">// claudeAgentDefinitions.ts -- only enable sub-agents in complex scenarios</span></span><br><span class="line"></span><br><span class="line"><span class="keyword">const</span> <span class="variable constant_">ORCHESTRATOR_ONLY_TOOLS</span> = <span class="keyword">new</span> <span class="title class_">Set</span>([</span><br><span class="line">  <span class="string">&#x27;submit_plan&#x27;</span>, <span class="string">&#x27;update_plan_phase&#x27;</span>, <span class="string">&#x27;revise_plan&#x27;</span>,</span><br><span class="line">  <span class="string">&#x27;submit_hypothesis&#x27;</span>, <span class="string">&#x27;resolve_hypothesis&#x27;</span>, <span class="string">&#x27;flag_uncertainty&#x27;</span>,</span><br><span class="line">  <span class="string">&#x27;compare_skill&#x27;</span>, <span class="string">&#x27;execute_sql_on&#x27;</span>, <span class="string">&#x27;get_comparison_context&#x27;</span>,</span><br><span class="line">]);</span><br><span class="line"></span><br><span class="line"><span class="comment">// Sub-agents only get data collection tools, not planning/hypothesis tools</span></span><br><span class="line"><span class="comment">// Design principle: sub-agents collect evidence, orchestrator makes diagnosis</span></span><br></pre></td></tr></table></figure><table><thead><tr><th>Scenario</th><th>Sub-Agent configuration</th><th>Reason</th></tr></thead><tbody><tr><td>scrolling</td><td>frame-expert + system-expert</td><td>Frame analysis and system analysis are suitable for splitting, coordinated by orchestrator</td></tr><tr><td>startup</td><td>startup-expert + system-expert</td><td>Startup phase analysis and resource contention analysis are suitable for splitting</td></tr><tr><td>anr</td><td>No sub-agent</td><td>ANR is a 2-skill pipeline; extra sub-agents would only add overhead</td></tr></tbody></table><blockquote><p>Note: The actual parallelism of sub-agents depends on the SDK’s internal scheduling strategy. We design prompts for parallel evidence collection, but actual execution may be sequential.</p></blockquote><p><strong>3. Lightweight vs Full dual mode – quick Q&amp;A doesn’t go through the full pipeline</strong></p><p>When users ask “what’s the frame rate of this trace,” there’s no need to go through the full Planning -&gt; Skill -&gt; Verification pipeline. SmartPerfetto’s <code>ClaudeRuntime</code> performs complexity classification at the entry point:</p><figure class="highlight cpp"><table><tr><td class="gutter"><pre><span class="line">1</span><br><span class="line">2</span><br><span class="line">3</span><br><span class="line">4</span><br><span class="line">5</span><br><span class="line">6</span><br><span class="line">7</span><br><span class="line">8</span><br><span class="line">9</span><br></pre></td><td class="code"><pre><span class="line"><span class="built_in">analyze</span>(query)</span><br><span class="line">  |</span><br><span class="line">queryComplexity === <span class="string">&#x27;quick&#x27;</span></span><br><span class="line">  -&gt; <span class="built_in">analyzeQuick</span>(): <span class="number">3</span> tools, no Planning Gate, no Verifier</span><br><span class="line">  -&gt; Directly answers factual questions</span><br><span class="line"></span><br><span class="line">queryComplexity === <span class="string">&#x27;full&#x27;</span></span><br><span class="line">  -&gt; Full pipeline: Planning -&gt; Skill -&gt; Verification -&gt; Correction</span><br><span class="line">  -&gt; Systematic analysis</span><br></pre></td></tr></table></figure><p><strong>Business reason:</strong> A significant proportion of user questions are factual queries (“what’s the frame rate,” “is there an ANR”), and running the full pipeline would unnecessarily increase latency.</p><h3 id="Answering-“whether-architecture-needs-business-driven-improvement”"><a href="#Answering-“whether-architecture-needs-business-driven-improvement”" class="headerlink" title="Answering “whether architecture needs business-driven improvement”"></a>Answering “whether architecture needs business-driven improvement”</h3><p><strong>Yes, but the improvement direction isn’t switching the underlying framework (ReAct -&gt; LangGraph), but adding business constraint layers on top of the existing framework.</strong> Specific recommendations:</p><ol><li><p><strong>Extract Strategy files from your Skill decision tree</strong>: Rewrite the hardcoded <code>if/else</code> decision logic in code as natural language analysis strategies (Markdown files), injected into the system prompt by scene. This way, domain experts can directly modify analysis logic without touching code.</p></li><li><p><strong>Add a Planning Gate</strong>: The <code>requirePlan()</code> implementation is extremely simple (under 10 lines of code), but the effect is significant – forcing the Agent to think before acting empirically reduces going off-track dramatically.</p></li><li><p><strong>Add a post-hoc Verifier</strong>: Don’t check whether the Agent’s intermediate steps are “correct” (this is hard to judge); only check whether critical steps “happened” (this is easy to judge).</p></li><li><p><strong>Dynamically adjust tool sets and constraint strength by scenario&#x2F;complexity</strong>: Not all queries need the same analysis depth; give simple queries a fast path.</p></li></ol><h3 id="One-sentence-summary-2"><a href="#One-sentence-summary-2" class="headerlink" title="One-sentence summary"></a>One-sentence summary</h3><p><strong>Architecture choice is a business problem, not a technical one. ReAct&#x2F;LangGraph&#x2F;SDK are just different implementations of control flow – what truly affects Agent performance is the constraint layer you build on top of the control flow. SmartPerfetto chose Native SDK not because it’s the most advanced, but because performance analysis root cause paths are unpredictable, and predefined DAGs are less effective than letting the Agent explore autonomously within a constraint framework.</strong></p><hr><h2 id="Q5-How-should-a-performance-AI-agent-handle-scene-recognition"><a href="#Q5-How-should-a-performance-AI-agent-handle-scene-recognition" class="headerlink" title="Q5: How should a performance AI agent handle scene recognition?"></a>Q5: How should a performance AI agent handle scene recognition?</h2><p><strong>Question context:</strong> We want to do scene recognition and route to the correct Skill. When building this, should we rely more on “user utterance” or “logs,” or is there a better approach? Several paths for scene recognition each have issues: code matching (keyword matching leads to results that are too broad or too narrow), LLM understanding (LLM understanding isn’t necessarily accurate), log reconstruction (can filter for scrolling presence, but that may not be what the user cares about).</p><h3 id="SmartPerfetto’s-approach-Three-signal-layers-with-clear-division-of-labor"><a href="#SmartPerfetto’s-approach-Three-signal-layers-with-clear-division-of-labor" class="headerlink" title="SmartPerfetto’s approach: Three signal layers with clear division of labor"></a>SmartPerfetto’s approach: Three signal layers with clear division of labor</h3><p>SmartPerfetto’s scene recognition doesn’t rely on a single signal source but uses three signal layers working together, each solving a different problem:</p><figure class="highlight plaintext"><table><tr><td class="gutter"><pre><span class="line">1</span><br><span class="line">2</span><br><span class="line">3</span><br></pre></td><td class="code"><pre><span class="line">Layer 1: User utterance -- keyword matching -&gt; scene type (scrolling / startup / anr / ...)</span><br><span class="line">Layer 2: Trace data -- deterministic detection -&gt; architecture info (Flutter / WebView / Standard / Compose)</span><br><span class="line">Layer 3: Data completeness -- table existence checks -&gt; available analysis dimensions (GPU data available? thermal throttling data available?)</span><br></pre></td></tr></table></figure><p><strong>Layer 1: User utterance (keyword matching, &lt;1ms)</strong></p><figure class="highlight typescript"><table><tr><td class="gutter"><pre><span class="line">1</span><br><span class="line">2</span><br><span class="line">3</span><br><span class="line">4</span><br><span class="line">5</span><br><span class="line">6</span><br><span class="line">7</span><br><span class="line">8</span><br><span class="line">9</span><br><span class="line">10</span><br><span class="line">11</span><br><span class="line">12</span><br><span class="line">13</span><br><span class="line">14</span><br><span class="line">15</span><br><span class="line">16</span><br><span class="line">17</span><br><span class="line">18</span><br></pre></td><td class="code"><pre><span class="line"><span class="comment">// sceneClassifier.ts -- 46 lines of code, handles all scene classification</span></span><br><span class="line"></span><br><span class="line"><span class="keyword">export</span> <span class="keyword">function</span> <span class="title function_">classifyScene</span>(<span class="params">query: <span class="built_in">string</span></span>): <span class="title class_">SceneType</span> &#123;</span><br><span class="line">  <span class="keyword">const</span> scenes = <span class="title function_">getRegisteredScenes</span>();  <span class="comment">// Loaded from 12 .strategy.md YAML frontmatters</span></span><br><span class="line">  <span class="keyword">const</span> lower = query.<span class="title function_">toLowerCase</span>();</span><br><span class="line"></span><br><span class="line">  <span class="keyword">const</span> sorted = scenes</span><br><span class="line">    .<span class="title function_">filter</span>(<span class="function"><span class="params">s</span> =&gt;</span> s.<span class="property">scene</span> !== <span class="string">&#x27;general&#x27;</span>)</span><br><span class="line">    .<span class="title function_">sort</span>(<span class="function">(<span class="params">a, b</span>) =&gt;</span> a.<span class="property">priority</span> - b.<span class="property">priority</span>);  <span class="comment">// ANR(1) &gt; startup(2) &gt; scrolling(3) &gt; ...</span></span><br><span class="line"></span><br><span class="line">  <span class="keyword">for</span> (<span class="keyword">const</span> scene <span class="keyword">of</span> sorted) &#123;</span><br><span class="line">    <span class="comment">// Match compound patterns first (more specific, e.g., &quot;startup.*slow&quot;)</span></span><br><span class="line">    <span class="keyword">if</span> (scene.<span class="property">compoundPatterns</span>.<span class="title function_">some</span>(<span class="function"><span class="params">p</span> =&gt;</span> p.<span class="title function_">test</span>(query))) <span class="keyword">return</span> scene.<span class="property">scene</span>;</span><br><span class="line">    <span class="comment">// Then match single keywords</span></span><br><span class="line">    <span class="keyword">if</span> (scene.<span class="property">keywords</span>.<span class="title function_">some</span>(<span class="function"><span class="params">k</span> =&gt;</span> lower.<span class="title function_">includes</span>(k))) <span class="keyword">return</span> scene.<span class="property">scene</span>;</span><br><span class="line">  &#125;</span><br><span class="line">  <span class="keyword">return</span> <span class="string">&#x27;general&#x27;</span>;  <span class="comment">// Fallback</span></span><br><span class="line">&#125;</span><br></pre></td></tr></table></figure><p>Keywords are defined in each Strategy file’s YAML frontmatter, not hardcoded in TypeScript:</p><figure class="highlight yaml"><table><tr><td class="gutter"><pre><span class="line">1</span><br><span class="line">2</span><br><span class="line">3</span><br><span class="line">4</span><br><span class="line">5</span><br><span class="line">6</span><br><span class="line">7</span><br><span class="line">8</span><br><span class="line">9</span><br><span class="line">10</span><br><span class="line">11</span><br><span class="line">12</span><br><span class="line">13</span><br><span class="line">14</span><br><span class="line">15</span><br><span class="line">16</span><br><span class="line">17</span><br></pre></td><td class="code"><pre><span class="line"><span class="comment"># scrolling.strategy.md frontmatter</span></span><br><span class="line"><span class="attr">keywords:</span></span><br><span class="line">  <span class="bullet">-</span> <span class="string">滑动</span></span><br><span class="line">  <span class="bullet">-</span> <span class="string">卡顿</span></span><br><span class="line">  <span class="bullet">-</span> <span class="string">掉帧</span></span><br><span class="line">  <span class="bullet">-</span> <span class="string">jank</span></span><br><span class="line">  <span class="bullet">-</span> <span class="string">scroll</span></span><br><span class="line">  <span class="bullet">-</span> <span class="string">fps</span></span><br><span class="line">  <span class="bullet">-</span> <span class="string">帧</span></span><br><span class="line">  <span class="bullet">-</span> <span class="string">frame</span></span><br><span class="line">  <span class="bullet">-</span> <span class="string">列表</span></span><br><span class="line">  <span class="bullet">-</span> <span class="string">流畅</span></span><br><span class="line">  <span class="bullet">-</span> <span class="string">fling</span></span><br><span class="line">  <span class="bullet">-</span> <span class="string">stuttering</span></span><br><span class="line">  <span class="bullet">-</span> <span class="string">dropped</span> <span class="string">frame</span></span><br><span class="line">  <span class="bullet">-</span> <span class="string">不流畅</span></span><br><span class="line">  <span class="comment"># ... 30+ keywords total</span></span><br></pre></td></tr></table></figure><p><strong>Why keyword matching instead of LLM?</strong></p><ol><li><strong>Cost</strong>: Scene classification executes at the entry of every analysis; keyword matching is &lt;1ms + 0 tokens; LLM calls take ~500ms + ~500 tokens</li><li><strong>Determinism</strong>: The cost of misclassification is very high (injecting the wrong Strategy file); keyword matching behavior is fully predictable</li><li><strong>Sufficiently accurate</strong>: In the performance analysis domain, user queries are highly formatted – someone saying “scrolling stuttering” is asking about scrolling, someone saying “slow startup” is asking about startup. No LLM needed to “understand” this</li></ol><p><strong>What about cases where keyword matching falls short?</strong></p><p>Keyword matching does have boundaries – when a user says “why is this app slow,” keywords can’t determine whether it’s slow startup or slow scrolling. SmartPerfetto handles this by: <strong>falling back to the <code>general</code> scene when no match is found</strong>, letting the Agent autonomously choose a direction within the general strategy’s routing decision tree.</p><figure class="highlight yaml"><table><tr><td class="gutter"><pre><span class="line">1</span><br><span class="line">2</span><br><span class="line">3</span><br><span class="line">4</span><br><span class="line">5</span><br><span class="line">6</span><br></pre></td><td class="code"><pre><span class="line"><span class="comment"># general.strategy.md -- no hard constraints, only routing suggestions</span></span><br><span class="line"></span><br><span class="line"><span class="string">|</span> <span class="string">User</span> <span class="string">focus</span> <span class="string">direction</span>         <span class="string">|</span> <span class="string">Recommended</span> <span class="string">path</span> <span class="string">|</span></span><br><span class="line"><span class="string">|</span> <span class="string">CPU</span> <span class="string">/</span> <span class="string">scheduling</span> <span class="string">/</span> <span class="string">threads</span>   <span class="string">|</span> <span class="string">invoke_skill(&quot;cpu_analysis&quot;)</span> <span class="string">|</span></span><br><span class="line"><span class="string">|</span> <span class="string">Memory</span> <span class="string">/</span> <span class="string">OOM</span> <span class="string">/</span> <span class="string">leaks</span>         <span class="string">|</span> <span class="string">invoke_skill(&quot;memory_analysis&quot;)</span> <span class="string">|</span></span><br><span class="line"><span class="string">|</span> <span class="string">Unknown</span> <span class="string">direction</span>            <span class="string">|</span> <span class="string">invoke_skill(&quot;scene_reconstruction&quot;)</span> <span class="string">-&gt;</span> <span class="string">route</span> <span class="string">by</span> <span class="string">scene</span> <span class="string">|</span></span><br></pre></td></tr></table></figure><p>The core idea of this design is: <strong>don’t try to achieve 100% accurate classification at the entry point; instead, let accurate cases take the fast path (keywords -&gt; Strategy), and uncertain cases take the exploration path (general -&gt; Agent autonomous routing).</strong></p><p><strong>Layer 2: Trace data – architecture detection (deterministic code)</strong></p><p>Scene classification only resolves “what the user wants to analyze,” but the same scenario (e.g., scrolling) requires completely different analysis paths under different rendering architectures:</p><table><thead><tr><th>Architecture</th><th>Rendering pipeline</th><th>Analysis differences</th></tr></thead><tbody><tr><td>Standard Android</td><td>UI Thread -&gt; RenderThread -&gt; SurfaceFlinger</td><td>Dual-track analysis of main thread + RenderThread</td></tr><tr><td>Flutter TextureView</td><td>1.ui -&gt; 1.raster -&gt; JNISurfaceTexture -&gt; RenderThread updateTexImage</td><td>Dual-pipeline; need to analyze Flutter engine threads + texture bridging</td></tr><tr><td>Flutter SurfaceView</td><td>1.ui -&gt; 1.raster -&gt; BufferQueue -&gt; SurfaceFlinger</td><td>Single pipeline; doesn’t go through RenderThread</td></tr><tr><td>WebView</td><td>CrRendererMain -&gt; Viz Compositor</td><td>Chromium rendering pipeline; different thread names</td></tr><tr><td>Compose</td><td>UI Thread (Composition) -&gt; RenderThread</td><td>Similar to Standard but with Composition phase</td></tr></tbody></table><p>Architecture detection is delegated to the YAML skill <code>rendering_pipeline_detection</code> – it performs thread&#x2F;Slice signal collection, pipeline scoring, and sub-variant determination at the SQL layer, supporting 24 fine-grained rendering architectures. The TypeScript side (<code>architectureDetector.ts</code>) is only responsible for calling the skill and mapping results; it doesn’t do direct if&#x2F;else judgments:</p><figure class="highlight cpp"><table><tr><td class="gutter"><pre><span class="line">1</span><br><span class="line">2</span><br><span class="line">3</span><br><span class="line">4</span><br></pre></td><td class="code"><pre><span class="line"><span class="function">rendering_pipeline_detection <span class="title">skill</span> <span class="params">(SQL)</span></span></span><br><span class="line"><span class="function">  -&gt; Collect thread <span class="title">signals</span> <span class="params">(<span class="number">1.u</span>i / <span class="number">1.</span>raster / CrRendererMain / RenderThread ...)</span></span></span><br><span class="line"><span class="function">  -&gt; Pipeline <span class="title">scoring</span> <span class="params">(FLUTTER_TEXTUREVIEW / WEBVIEW_BLINK / ANDROID_VIEW_STANDARD ...)</span></span></span><br><span class="line"><span class="function">  -&gt; architectureDetector.ts maps to ArchitectureInfo type</span></span><br></pre></td></tr></table></figure><p>Detection results are injected into the system prompt (via templates like <code>arch-flutter.template.md</code>), and the Agent selects the corresponding analysis tools after seeing the architecture information.</p><p><strong>Layer 3: Data completeness – capability register</strong></p><p>Different trace capture configurations yield different available data dimensions. Some traces lack GPU frequency data; others lack thermal zone data. SmartPerfetto probes the availability of 18 data dimensions before analysis begins:</p><figure class="highlight plaintext"><table><tr><td class="gutter"><pre><span class="line">1</span><br><span class="line">2</span><br><span class="line">3</span><br><span class="line">4</span><br><span class="line">5</span><br></pre></td><td class="code"><pre><span class="line">frame_rendering: OK (456 rows)</span><br><span class="line">cpu_scheduling: OK (12000 rows)</span><br><span class="line">gpu: MISSING (no gpu_frequency counter)</span><br><span class="line">thermal_throttling: OK (4 zones)</span><br><span class="line">binder_ipc: OK (890 transactions)</span><br></pre></td></tr></table></figure><p>This information is likewise injected into the system prompt, telling the Agent which dimensions can be analyzed and which lack data. This prevents the Agent from invoking a Skill with no data backing, getting empty results, then switching directions – such trial-and-error wastes 1-2 tool calls’ worth of tokens.</p><h3 id="Evaluating-the-three-paths-from-the-question"><a href="#Evaluating-the-three-paths-from-the-question" class="headerlink" title="Evaluating the three paths from the question"></a>Evaluating the three paths from the question</h3><p><strong>1. Code matching (keywords): Viable, but needs well-designed fallback</strong></p><p>The questioner said “keyword matching leads to results that are too broad or too narrow.” SmartPerfetto’s experience:</p><ul><li><strong>Priority ordering</strong> solves the “too broad” problem: ANR(1) &gt; startup(2) &gt; scrolling(3); when multiple keywords match simultaneously, take the highest priority</li><li><strong>Compound patterns</strong> improve precision: <code>/startup.*slow/</code> is more precise than matching “startup” alone</li><li><strong><code>general</code> fallback</strong> solves the “too narrow” problem: when nothing matches, don’t guess – hand it to Agent for autonomous exploration</li></ul><p><strong>2. LLM understanding: Not recommended for the classification entry point; can be used in the fallback path</strong></p><p>LLM classification in SmartPerfetto isn’t Layer 1 but rather the Agent’s autonomous routing within the <code>general</code> scenario – at that point, the Agent already has trace data and can make more accurate judgments combined with the data.</p><p><strong>3. Log reconstruction: Suitable as a supplementary signal for Layer 2</strong></p><p>Logs can tell you “what’s in the trace” (whether scrolling events exist, whether ANR exists), but can’t tell you “what the user cares about.” SmartPerfetto’s data completeness probing plays exactly this role – it doesn’t participate in scene classification but provides the Agent with data availability information.</p><h3 id="One-sentence-summary-3"><a href="#One-sentence-summary-3" class="headerlink" title="One-sentence summary"></a>One-sentence summary</h3><p><strong>Scene recognition shouldn’t try to solve all problems with a single signal source. Use keyword matching for fast routing (accurate cases), use <code>general</code> fallback for Agent autonomous exploration (uncertain cases), and use trace data for architecture and completeness supplementation. Keyword matching + priority ordering + compound patterns + fallback strategy – 46 lines of code is sufficient.</strong></p><hr><h2 id="Q6-How-to-better-leverage-AI-autonomous-exploration-in-“deterministic-steps-AI-exploration”"><a href="#Q6-How-to-better-leverage-AI-autonomous-exploration-in-“deterministic-steps-AI-exploration”" class="headerlink" title="Q6: How to better leverage AI autonomous exploration in “deterministic steps + AI exploration”?"></a>Q6: How to better leverage AI autonomous exploration in “deterministic steps + AI exploration”?</h2><p><strong>Question context:</strong> We’ve found in production that when AI explores autonomously and drills into root causes, it tends to go off track and give incorrect results. For example, in the SmartPerfetto blog post example – after identifying RenderThread being blocked by Binder in the earlier steps (based on deterministic steps), are the subsequent hypothesis formations and validations pure AI, or do we give the AI some common causes as guidance for Binder blocking and let it investigate on its own?</p><h3 id="First-answering-the-core-question-It’s-neither-pure-AI-nor-hardcoded-guidance"><a href="#First-answering-the-core-question-It’s-neither-pure-AI-nor-hardcoded-guidance" class="headerlink" title="First, answering the core question: It’s neither pure AI nor hardcoded guidance"></a>First, answering the core question: It’s neither pure AI nor hardcoded guidance</h3><p>SmartPerfetto’s approach is <strong>structured reasoning framework + on-demand knowledge injection</strong>:</p><figure class="highlight plaintext"><table><tr><td class="gutter"><pre><span class="line">1</span><br><span class="line">2</span><br><span class="line">3</span><br><span class="line">4</span><br><span class="line">5</span><br><span class="line">6</span><br><span class="line">7</span><br><span class="line">8</span><br><span class="line">9</span><br><span class="line">10</span><br><span class="line">11</span><br></pre></td><td class="code"><pre><span class="line">Deterministic steps produce data</span><br><span class="line">  |</span><br><span class="line">Agent forms hypothesis (autonomous, but constrained by reasoning framework)</span><br><span class="line">  |</span><br><span class="line">Agent selects verification tool (autonomous, but guided by Strategy suggestions)</span><br><span class="line">  |</span><br><span class="line">Verification result feedback</span><br><span class="line">  |</span><br><span class="line">Hypothesis confirmed -&gt; go deeper / Hypothesis rejected -&gt; backtrack and change direction</span><br><span class="line">  |</span><br><span class="line">Verifier post-hoc check</span><br></pre></td></tr></table></figure><p>Three key mechanisms make AI autonomous exploration more reliable:</p><h3 id="Mechanism-1-Hypothesis-management-tools-–-adding-structure-to-the-reasoning-process"><a href="#Mechanism-1-Hypothesis-management-tools-–-adding-structure-to-the-reasoning-process" class="headerlink" title="Mechanism 1: Hypothesis management tools – adding structure to the reasoning process"></a>Mechanism 1: Hypothesis management tools – adding structure to the reasoning process</h3><p>SmartPerfetto provides <code>submit_hypothesis</code> and <code>resolve_hypothesis</code> as two MCP tools. Instead of letting the Agent reason implicitly in internal monologue, it <strong>forces externalization</strong>:</p><figure class="highlight sql"><table><tr><td class="gutter"><pre><span class="line">1</span><br><span class="line">2</span><br><span class="line">3</span><br><span class="line">4</span><br><span class="line">5</span><br><span class="line">6</span><br><span class="line">7</span><br><span class="line">8</span><br><span class="line">9</span><br><span class="line">10</span><br><span class="line">11</span><br><span class="line">12</span><br><span class="line">13</span><br><span class="line">14</span><br><span class="line">15</span><br><span class="line">16</span><br></pre></td><td class="code"><pre><span class="line">Agent calls:</span><br><span class="line">  submit_hypothesis(&#123;</span><br><span class="line">    description: &quot;system_server slow Binder response causing RenderThread blocking&quot;,</span><br><span class="line">    expected_evidence: &quot;system_server&#x27;s corresponding Binder transaction thread_state shows prolonged Runnable/Sleeping&quot;</span><br><span class="line">  &#125;)</span><br><span class="line"></span><br><span class="line">Agent calls:</span><br><span class="line">  execute_sql(&quot;SELECT ... FROM thread_state WHERE utid = ... AND ts BETWEEN ...&quot;)</span><br><span class="line"></span><br><span class="line">Agent calls:</span><br><span class="line">  resolve_hypothesis(&#123;</span><br><span class="line">    id: &quot;h1&quot;,</span><br><span class="line">    outcome: &quot;rejected&quot;,</span><br><span class="line">    evidence: &quot;system_server Binder thread state is normal, response time &lt;2ms,</span><br><span class="line">              RenderThread blocking cause is dequeueBuffer waiting for SurfaceFlinger&quot;</span><br><span class="line">  &#125;)</span><br></pre></td></tr></table></figure><p><strong>Why is this effective?</strong> The hypothesis management tools force the Agent to explicitly declare “what I’m verifying” and “what I expect to see” before taking action. This has two benefits:</p><ol><li><strong>Prevents goal drift</strong> – the Agent won’t forget what it originally wanted to verify while collecting data</li><li><strong>Auditable</strong> – every hypothesis has a complete record; the Verifier can check whether all hypotheses were resolved</li></ol><h3 id="Mechanism-2-Knowledge-injection-–-not-hardcoded-guidance-but-on-demand-domain-knowledge-loading"><a href="#Mechanism-2-Knowledge-injection-–-not-hardcoded-guidance-but-on-demand-domain-knowledge-loading" class="headerlink" title="Mechanism 2: Knowledge injection – not hardcoded guidance, but on-demand domain knowledge loading"></a>Mechanism 2: Knowledge injection – not hardcoded guidance, but on-demand domain knowledge loading</h3><blockquote><p>“Could we give the AI some common causes as guidance for Binder blocking?”</p></blockquote><p>Yes, but not hardcoded in Skills. Instead, it’s loaded <strong>on demand</strong> through the <code>lookup_knowledge</code> MCP tool. After discovering Binder blocking, the Agent can call:</p><figure class="highlight plaintext"><table><tr><td class="gutter"><pre><span class="line">1</span><br></pre></td><td class="code"><pre><span class="line">invoke lookup_knowledge(&quot;binder-ipc&quot;)</span><br></pre></td></tr></table></figure><p>This returns a Binder IPC knowledge template (<code>knowledge-binder-ipc.template.md</code>) containing:</p><ul><li>Classification of typical Binder transaction blocking causes (server-side busy, process frozen, CPU scheduling delay, oneway queue full)</li><li>Investigation paths and key metrics for each cause</li><li>Common misdiagnosis scenarios (e.g., oneway transactions don’t block the caller)</li></ul><p><strong>Key design: Knowledge is actively pulled by the Agent, not force-injected by the system.</strong> There are currently 8 knowledge templates (rendering-pipeline, binder-ipc, gc-dynamics, cpu-scheduler, thermal-throttling, lock-contention, startup-root-causes, data-sources). If all templates were pre-injected into the system prompt, it would consume a large number of tokens and most would be irrelevant. Through on-demand loading via MCP tools, the Agent only retrieves the relevant domain background knowledge when needed.</p><p>SmartPerfetto also provides <strong>conditional deep drill suggestion tables</strong> in Strategy files, which is another form of guidance:</p><figure class="highlight markdown"><table><tr><td class="gutter"><pre><span class="line">1</span><br><span class="line">2</span><br><span class="line">3</span><br><span class="line">4</span><br><span class="line">5</span><br><span class="line">6</span><br><span class="line">7</span><br><span class="line">8</span><br></pre></td><td class="code"><pre><span class="line"><span class="section"># scrolling.strategy.md Phase 1.9</span></span><br><span class="line"></span><br><span class="line">| Condition                         | Deep drill action |</span><br><span class="line">| Any reason<span class="emphasis">_code Q4&gt;20%            | invoke_</span>skill(&quot;blocking<span class="emphasis">_chain_</span>analysis&quot;, ...) |</span><br><span class="line">| binder<span class="emphasis">_overlap &gt;5ms               | invoke_</span>skill(&quot;binder<span class="emphasis">_root_</span>cause&quot;, ...) |</span><br><span class="line">| cpu<span class="emphasis">_runnable_</span>ratio &gt;30%           | invoke<span class="emphasis">_skill(&quot;cpu_</span>analysis&quot;, ...) |</span><br><span class="line">| thermal<span class="emphasis">_throttle detected         | invoke_</span>skill(&quot;thermal<span class="emphasis">_throttling&quot;, ...) |</span></span><br><span class="line"><span class="emphasis">| gc_</span>pause<span class="emphasis">_total &gt;10ms              | invoke_</span>skill(&quot;gc<span class="emphasis">_analysis&quot;, ...) |</span></span><br></pre></td></tr></table></figure><p>This table isn’t a hardcoded decision tree – it’s a <strong>lookup table</strong> for the Agent. The Agent decides which row to follow based on metric values in the data. If the data doesn’t match any row, the Agent can explore autonomously.</p><h3 id="Mechanism-3-ReAct-Reasoning-Nudge-–-triggering-reflection-when-tools-return-results"><a href="#Mechanism-3-ReAct-Reasoning-Nudge-–-triggering-reflection-when-tools-return-results" class="headerlink" title="Mechanism 3: ReAct Reasoning Nudge – triggering reflection when tools return results"></a>Mechanism 3: ReAct Reasoning Nudge – triggering reflection when tools return results</h3><p>During the <strong>first few</strong> successful returns from data tools (<code>execute_sql</code> &#x2F; <code>invoke_skill</code>), SmartPerfetto appends a reasoning prompt at the end of the result:</p><figure class="highlight typescript"><table><tr><td class="gutter"><pre><span class="line">1</span><br><span class="line">2</span><br><span class="line">3</span><br><span class="line">4</span><br><span class="line">5</span><br><span class="line">6</span><br><span class="line">7</span><br><span class="line">8</span><br></pre></td><td class="code"><pre><span class="line"><span class="comment">// claudeMcpServer.ts</span></span><br><span class="line"></span><br><span class="line"><span class="keyword">const</span> <span class="variable constant_">REASONING_NUDGE</span> = <span class="string">&#x27;\n\n[REFLECT] Before executing the next step: &#x27;</span> +</span><br><span class="line">  <span class="string">&#x27;What are the key findings from this data? Does it support/refute your hypothesis? &#x27;</span> +</span><br><span class="line">  <span class="string">&#x27;If there are important inferences, please record them using submit_hypothesis or write_analysis_note.&#x27;</span>;</span><br><span class="line"></span><br><span class="line"><span class="comment">// Only appended during the first N data tool calls, then stopped (to control token cost)</span></span><br><span class="line"><span class="keyword">const</span> <span class="variable constant_">REASONING_NUDGE_MAX_CALLS</span> = <span class="number">4</span>;</span><br></pre></td></tr></table></figure><p><strong>Extremely low cost (~20 tokens&#x2F;call, ~80 tokens total for the first 4 calls), but significantly effective.</strong> The reason it’s not applied throughout is to control token overhead in the latter half of analysis – the first few nudges already establish the pattern of “receive data -&gt; reflect first -&gt; then act.” Without this nudge, the Agent tends to call tools consecutively without pausing to think – collecting data 5 times without forming any intermediate conclusions, resulting in poor final summary quality.</p><h3 id="Walking-through-the-complete-flow-with-the-Binder-example-from-the-article"><a href="#Walking-through-the-complete-flow-with-the-Binder-example-from-the-article" class="headerlink" title="Walking through the complete flow with the Binder example from the article"></a>Walking through the complete flow with the Binder example from the article</h3><figure class="highlight sql"><table><tr><td class="gutter"><pre><span class="line">1</span><br><span class="line">2</span><br><span class="line">3</span><br><span class="line">4</span><br><span class="line">5</span><br><span class="line">6</span><br><span class="line">7</span><br><span class="line">8</span><br><span class="line">9</span><br><span class="line">10</span><br><span class="line">11</span><br><span class="line">12</span><br><span class="line">13</span><br><span class="line">14</span><br><span class="line">15</span><br><span class="line">16</span><br><span class="line">17</span><br><span class="line">18</span><br><span class="line">19</span><br><span class="line">20</span><br><span class="line">21</span><br><span class="line">22</span><br><span class="line">23</span><br><span class="line">24</span><br><span class="line">25</span><br><span class="line">26</span><br><span class="line">27</span><br><span class="line">28</span><br><span class="line">29</span><br><span class="line">30</span><br><span class="line">31</span><br><span class="line">32</span><br><span class="line">33</span><br><span class="line">34</span><br><span class="line">35</span><br><span class="line">36</span><br><span class="line">37</span><br><span class="line">38</span><br><span class="line">39</span><br><span class="line">40</span><br><span class="line">41</span><br><span class="line">42</span><br><span class="line">43</span><br><span class="line">44</span><br><span class="line">45</span><br></pre></td><td class="code"><pre><span class="line"><span class="number">1.</span> <span class="keyword">Start</span> <span class="keyword">with</span> overview <span class="operator">-</span><span class="operator">&gt;</span> discovers <span class="number">47</span> jank frames, P90 <span class="operator">=</span> <span class="number">23.5</span>ms</span><br><span class="line">   [<span class="keyword">Deterministic</span>: invoke_skill(&quot;scrolling_analysis&quot;)]</span><br><span class="line"></span><br><span class="line"><span class="number">2.</span> Decide direction based <span class="keyword">on</span> overview <span class="operator">-</span><span class="operator">&gt;</span> <span class="number">40</span><span class="operator">%</span> stuck <span class="keyword">in</span> APP phase, prioritize App side</span><br><span class="line">   [<span class="keyword">Deterministic</span>: data<span class="operator">-</span>driven, Strategy file suggestion]</span><br><span class="line"></span><br><span class="line"><span class="number">3.</span> <span class="keyword">Select</span> representative frame <span class="keyword">for</span> deep drill <span class="operator">-</span><span class="operator">&gt;</span> Frame #<span class="number">234</span> RenderThread blocked <span class="keyword">by</span> Binder <span class="keyword">for</span> <span class="number">23</span>ms</span><br><span class="line">   [<span class="keyword">Deterministic</span>: invoke_skill(&quot;jank_frame_detail&quot;)]</span><br><span class="line"></span><br><span class="line"><span class="comment">--- AI autonomous exploration begins below ---</span></span><br><span class="line"></span><br><span class="line"><span class="number">4.</span> Agent proactively loads knowledge: lookup_knowledge(&quot;binder-ipc&quot;)</span><br><span class="line">   <span class="operator">-</span><span class="operator">&gt;</span> Gets Binder blocking common cause classification <span class="keyword">table</span></span><br><span class="line">   [AI decision <span class="operator">+</span> knowledge guidance]</span><br><span class="line"></span><br><span class="line"><span class="number">5.</span> Agent forms hypothesis: submit_hypothesis(&quot;system_server slow Binder response&quot;)</span><br><span class="line">   Expected evidence: server<span class="operator">-</span>side thread_state showing prolonged Sleeping<span class="operator">/</span>Runnable</span><br><span class="line">   [AI reasoning, hypothesis tool forces externalization]</span><br><span class="line"></span><br><span class="line"><span class="number">6.</span> Agent verifies: execute_sql(&quot;query Binder counterpart thread_state&quot;)</span><br><span class="line">   <span class="operator">-</span><span class="operator">&gt;</span> Discovers system_server CPU scheduling delay, <span class="keyword">not</span> slow Binder response</span><br><span class="line">   [AI autonomous tool <span class="keyword">call</span>]</span><br><span class="line"></span><br><span class="line"><span class="number">7.</span> [REFLECT] nudge triggers reflection</span><br><span class="line">   Agent: &quot;Hypothesis 1 doesn&#x27;t hold; server-side thread_state shows Runnable queuing,</span><br><span class="line">          actual cause is CPU scheduling delay&quot;</span><br><span class="line">   <span class="operator">-</span><span class="operator">&gt;</span> resolve_hypothesis(outcome: &quot;refined&quot;,</span><br><span class="line">       evidence: &quot;system_server CPU scheduling delay causing Binder thread queuing&quot;)</span><br><span class="line">   [AI reasoning <span class="operator">+</span> investigation path <span class="keyword">from</span> knowledge template]</span><br><span class="line"></span><br><span class="line"><span class="number">8.</span> Agent goes deeper: execute_sql(&quot;query CPU frequency + thermal zone&quot;)</span><br><span class="line">   <span class="operator">-</span><span class="operator">&gt;</span> Discovers thermal throttling, CPU big cores frequency<span class="operator">-</span>limited <span class="keyword">to</span> <span class="number">50</span><span class="operator">%</span></span><br><span class="line">   [AI autonomously selects next deep drill direction]</span><br><span class="line"></span><br><span class="line"><span class="number">9.</span> Comprehensive conclusion: RenderThread Binder blocking <span class="operator">&lt;</span><span class="operator">-</span> system_server CPU scheduling delay <span class="operator">&lt;</span><span class="operator">-</span> thermal throttling</span><br><span class="line">   [AI synthesis, forming WHY chain]</span><br><span class="line"></span><br><span class="line"><span class="comment">--- Verifier post-hoc check ---</span></span><br><span class="line"></span><br><span class="line"><span class="number">10.</span> Verifier heuristic checks:</span><br><span class="line">    <span class="operator">-</span> Text <span class="keyword">pattern</span> matching: does the conclusion reflect deep drill analysis (<span class="keyword">not</span> just <span class="keyword">referencing</span> overview data)</span><br><span class="line">    <span class="operator">-</span> Hypothesis closure: do <span class="keyword">all</span> submit_hypothesis calls have <span class="keyword">corresponding</span> resolve_hypothesis calls</span><br><span class="line">    <span class="operator">-</span> Scene completeness: does scrolling analysis include frame<span class="operator">/</span>jank related content</span><br><span class="line">    <span class="operator">-</span> Causal chain heuristic: <span class="keyword">are</span> there sufficient causal connectors <span class="keyword">and</span> mechanistic terminology</span><br><span class="line">    [<span class="keyword">Deterministic</span>: heuristic rule checks, <span class="keyword">not</span> precise verification]</span><br></pre></td></tr></table></figure><p>Note that Steps 4-9 are all AI autonomous exploration, but constrained by three mechanisms:</p><ul><li><strong>Hypothesis tools</strong> force reasoning externalization (Steps 5, 7)</li><li><strong>Knowledge injection</strong> provides domain investigation paths (Step 4)</li><li><strong>REFLECT nudge</strong> triggers reflection after the first few tool returns (Step 7)</li></ul><h3 id="Four-practical-recommendations-for-making-AI-autonomous-exploration-more-reliable"><a href="#Four-practical-recommendations-for-making-AI-autonomous-exploration-more-reliable" class="headerlink" title="Four practical recommendations for making AI autonomous exploration more reliable"></a>Four practical recommendations for making AI autonomous exploration more reliable</h3><p><strong>1. Give data, not conclusions</strong></p><p>Skills should return structured data (frame durations, thread state distributions, blocking function lists), not pre-drawn conclusions (“RenderThread blocking is caused by Binder”). Having AI reason its own conclusions from data is more reliable than having it build further analysis on conclusions provided by others.</p><p><strong>2. Give framework, not path</strong></p><p>Strategy files should define “what must be done” (Phase 1.9 must deep drill), not “how to do it” (first query A, then B, then C). An Agent autonomously selecting paths within a framework constraint is far more reliable than free exploration without any constraints, yet far more flexible than hardcoded paths.</p><p><strong>3. Give knowledge, not answers</strong></p><p>Knowledge templates should contain “possible cause classifications and investigation methods,” not “if you see X, it’s Y.” The former helps the Agent build a reasoning framework; the latter turns the Agent back into a Workflow.</p><p><strong>4. Verify behavior, not conclusions</strong></p><p>Verifiers should use heuristic rules to check “whether the analysis output reflects critical actions” (does the conclusion show traces of deep drill analysis, are all hypotheses resolved, does the causal chain have sufficient depth), rather than trying to judge “whether the conclusion is correct” (this should be done offline with LLM Judge evaluation, not at runtime). Note that these are text pattern matching level heuristic checks, not precise tool call log audits.</p><h3 id="One-sentence-summary-4"><a href="#One-sentence-summary-4" class="headerlink" title="One-sentence summary"></a>One-sentence summary</h3><p><strong>AI autonomous exploration reliability isn’t guaranteed by “hardcoded guidance,” but by three mechanisms: hypothesis management tools externalize reasoning, on-demand knowledge injection provides domain investigation frameworks, and ReAct nudge prevents blind tool calling. The key principles are “give data not conclusions, give framework not path, give knowledge not answers.”</strong></p><hr><h2 id="Q7-How-is-the-Prompt-assembled-for-each-turn"><a href="#Q7-How-is-the-Prompt-assembled-for-each-turn" class="headerlink" title="Q7: How is the Prompt assembled for each turn?"></a>Q7: How is the Prompt assembled for each turn?</h2><p><strong>Question context:</strong> LLM Agent output quality depends heavily on system prompt design. How does SmartPerfetto construct the prompt for each analysis? How does the prompt change across different scenarios and different turns? How is the token budget controlled?</p><h3 id="Overall-design-Four-tier-layered-assembly-cache-optimization"><a href="#Overall-design-Four-tier-layered-assembly-cache-optimization" class="headerlink" title="Overall design: Four-tier layered assembly + cache optimization"></a>Overall design: Four-tier layered assembly + cache optimization</h3><p>SmartPerfetto’s system prompt isn’t a static string but is <strong>dynamically assembled</strong> by the <code>buildSystemPrompt()</code> function (<code>claudeSystemPrompt.ts:260</code>) before each SDK query. The assembly follows a core principle:</p><blockquote><p><strong>Sort by “stability” – content that changes less frequently goes first, more dynamic content goes last.</strong></p></blockquote><p>The reason for this design is <strong>Anthropic API’s automatic caching mechanism</strong>: when the system prompt exceeds 1024 tokens, the API automatically caches the prompt prefix. By placing unchanging content at the very front, most of the prompt can hit the cache across multi-turn conversations, significantly reducing latency and cost:</p><figure class="highlight plaintext"><table><tr><td class="gutter"><pre><span class="line">1</span><br><span class="line">2</span><br><span class="line">3</span><br></pre></td><td class="code"><pre><span class="line">Same trace + same scene:     ~4000 tokens cached (~80% savings)</span><br><span class="line">Same trace + different scene: ~800 tokens cached  (~18% savings)</span><br><span class="line">Different trace:              ~400 tokens cached   (~8% savings)</span><br></pre></td></tr></table></figure><h3 id="Four-tier-assembly-structure"><a href="#Four-tier-assembly-structure" class="headerlink" title="Four-tier assembly structure"></a>Four-tier assembly structure</h3><figure class="highlight sql"><table><tr><td class="gutter"><pre><span class="line">1</span><br><span class="line">2</span><br><span class="line">3</span><br><span class="line">4</span><br><span class="line">5</span><br><span class="line">6</span><br><span class="line">7</span><br><span class="line">8</span><br><span class="line">9</span><br><span class="line">10</span><br><span class="line">11</span><br><span class="line">12</span><br><span class="line">13</span><br><span class="line">14</span><br><span class="line">15</span><br><span class="line">16</span><br><span class="line">17</span><br><span class="line">18</span><br><span class="line">19</span><br><span class="line">20</span><br><span class="line">21</span><br><span class="line">22</span><br><span class="line">23</span><br><span class="line">24</span><br><span class="line">25</span><br><span class="line">26</span><br><span class="line">27</span><br><span class="line">28</span><br><span class="line">29</span><br><span class="line">30</span><br><span class="line">31</span><br><span class="line">32</span><br><span class="line">33</span><br><span class="line">34</span><br><span class="line">35</span><br><span class="line">36</span><br><span class="line">37</span><br><span class="line">38</span><br><span class="line">39</span><br><span class="line">40</span><br><span class="line">41</span><br><span class="line">42</span><br><span class="line">43</span><br><span class="line">44</span><br><span class="line">45</span><br><span class="line">46</span><br><span class="line">47</span><br><span class="line">48</span><br><span class="line">49</span><br><span class="line">50</span><br><span class="line">51</span><br><span class="line">52</span><br><span class="line">53</span><br><span class="line">54</span><br><span class="line">55</span><br><span class="line">56</span><br><span class="line">57</span><br><span class="line">58</span><br><span class="line">59</span><br><span class="line">60</span><br><span class="line">61</span><br><span class="line">62</span><br><span class="line">63</span><br><span class="line">64</span><br><span class="line">65</span><br><span class="line">66</span><br></pre></td><td class="code"><pre><span class="line"><span class="operator">+</span><span class="comment">-------------------------------------------------------+</span></span><br><span class="line"><span class="operator">|</span>  Tier <span class="number">1</span>: <span class="keyword">STATIC</span> (unchanged <span class="keyword">within</span> process lifetime)    <span class="operator">|</span></span><br><span class="line"><span class="operator">|</span>  <span class="operator">+</span><span class="comment">---------------------------------------------------+ |</span></span><br><span class="line"><span class="operator">|</span>  <span class="operator">|</span> prompt<span class="operator">-</span>role.template.md        (<span class="operator">~</span><span class="number">200</span> tokens)       <span class="operator">|</span> <span class="operator">|</span></span><br><span class="line"><span class="operator">|</span>  <span class="operator">|</span> <span class="operator">-</span><span class="operator">&gt;</span> Role definition: Android performance expert     <span class="operator">|</span> <span class="operator">|</span></span><br><span class="line"><span class="operator">|</span>  <span class="operator">+</span><span class="comment">---------------------------------------------------+ |</span></span><br><span class="line"><span class="operator">|</span>  <span class="operator">|</span> prompt<span class="operator">-</span>output<span class="operator">-</span>format.template.md (<span class="operator">~</span><span class="number">850</span> tokens)     <span class="operator">|</span> <span class="operator">|</span></span><br><span class="line"><span class="operator">|</span>  <span class="operator">|</span> <span class="operator">-</span><span class="operator">&gt;</span> Output format: [CRITICAL]<span class="operator">/</span>[HIGH]<span class="operator">/</span>[MEDIUM]<span class="operator">/</span>[LOW] <span class="operator">|</span> <span class="operator">|</span></span><br><span class="line"><span class="operator">|</span>  <span class="operator">|</span> <span class="operator">-</span><span class="operator">&gt;</span> Root cause reasoning chain format, Mermaid rules<span class="operator">|</span> <span class="operator">|</span></span><br><span class="line"><span class="operator">|</span>  <span class="operator">|</span> <span class="operator">-</span><span class="operator">&gt;</span> Slice nesting rules, CPU frequency estimation   <span class="operator">|</span> <span class="operator">|</span></span><br><span class="line"><span class="operator">|</span>  <span class="operator">+</span><span class="comment">---------------------------------------------------+ |</span></span><br><span class="line"><span class="operator">+</span><span class="comment">-------------------------------------------------------+</span></span><br><span class="line"><span class="operator">|</span>  Tier <span class="number">2</span>: <span class="keyword">PER</span><span class="operator">-</span>TRACE (stable <span class="keyword">within</span> same trace)          <span class="operator">|</span></span><br><span class="line"><span class="operator">|</span>  <span class="operator">+</span><span class="comment">---------------------------------------------------+ |</span></span><br><span class="line"><span class="operator">|</span>  <span class="operator">|</span> Architecture info          (<span class="operator">~</span><span class="number">150</span> tokens)            <span class="operator">|</span> <span class="operator">|</span></span><br><span class="line"><span class="operator">|</span>  <span class="operator">|</span> <span class="operator">-</span><span class="operator">&gt;</span> &quot;Flutter TextureView, confidence 92%&quot;            <span class="operator">|</span> <span class="operator">|</span></span><br><span class="line"><span class="operator">|</span>  <span class="operator">|</span> <span class="operator">-</span><span class="operator">&gt;</span> <span class="operator">+</span> arch<span class="operator">-</span>flutter.template.md architecture guide    <span class="operator">|</span> <span class="operator">|</span></span><br><span class="line"><span class="operator">|</span>  <span class="operator">+</span><span class="comment">---------------------------------------------------+ |</span></span><br><span class="line"><span class="operator">|</span>  <span class="operator">|</span> Focus application          (<span class="operator">~</span><span class="number">100</span> tokens)            <span class="operator">|</span> <span class="operator">|</span></span><br><span class="line"><span class="operator">|</span>  <span class="operator">|</span> <span class="operator">-</span><span class="operator">&gt;</span> &quot;com.example.app (primary focus), 456 frames&quot;    <span class="operator">|</span> <span class="operator">|</span></span><br><span class="line"><span class="operator">|</span>  <span class="operator">+</span><span class="comment">---------------------------------------------------+ |</span></span><br><span class="line"><span class="operator">|</span>  <span class="operator">|</span> Data completeness          (<span class="operator">~</span><span class="number">200</span> tokens, droppable) <span class="operator">|</span> <span class="operator">|</span></span><br><span class="line"><span class="operator">|</span>  <span class="operator">|</span> <span class="operator">-</span><span class="operator">&gt;</span> <span class="keyword">Only</span> reports missing<span class="operator">/</span>insufficient dimensions     <span class="operator">|</span> <span class="operator">|</span></span><br><span class="line"><span class="operator">|</span>  <span class="operator">+</span><span class="comment">---------------------------------------------------+ |</span></span><br><span class="line"><span class="operator">|</span>  <span class="operator">|</span> <span class="keyword">SQL</span> knowledge base <span class="keyword">ref</span>     (<span class="operator">~</span><span class="number">300</span> tokens, droppable) <span class="operator">|</span> <span class="operator">|</span></span><br><span class="line"><span class="operator">|</span>  <span class="operator">|</span> <span class="operator">-</span><span class="operator">&gt;</span> Tables<span class="operator">/</span>views<span class="operator">/</span>functions matched <span class="keyword">from</span> stdlib index <span class="operator">|</span> <span class="operator">|</span></span><br><span class="line"><span class="operator">|</span>  <span class="operator">+</span><span class="comment">---------------------------------------------------+ |</span></span><br><span class="line"><span class="operator">+</span><span class="comment">-------------------------------------------------------+</span></span><br><span class="line"><span class="operator">|</span>  Tier <span class="number">3</span>: <span class="keyword">PER</span><span class="operator">-</span>QUERY (changes <span class="keyword">with</span> scene<span class="operator">/</span>query)          <span class="operator">|</span></span><br><span class="line"><span class="operator">|</span>  <span class="operator">+</span><span class="comment">---------------------------------------------------+ |</span></span><br><span class="line"><span class="operator">|</span>  <span class="operator">|</span> Methodology <span class="operator">+</span> scene strategy (<span class="operator">~</span><span class="number">1200</span> tokens)         <span class="operator">|</span> <span class="operator">|</span></span><br><span class="line"><span class="operator">|</span>  <span class="operator">|</span> <span class="operator">-</span><span class="operator">&gt;</span> prompt<span class="operator">-</span>methodology.template.md                   <span class="operator">|</span> <span class="operator">|</span></span><br><span class="line"><span class="operator">|</span>  <span class="operator">|</span> <span class="operator">-</span><span class="operator">&gt;</span> &#123;&#123;sceneStrategy&#125;&#125; <span class="operator">=</span> scrolling.strategy.md        <span class="operator">|</span> <span class="operator">|</span></span><br><span class="line"><span class="operator">|</span>  <span class="operator">|</span>   <span class="keyword">or</span> <span class="keyword">one</span> <span class="keyword">of</span> <span class="number">12</span> strategies (startup<span class="operator">/</span>anr<span class="operator">/</span>general...) <span class="operator">|</span> <span class="operator">|</span></span><br><span class="line"><span class="operator">|</span>  <span class="operator">+</span><span class="comment">---------------------------------------------------+ |</span></span><br><span class="line"><span class="operator">|</span>  <span class="operator">|</span> Sub<span class="operator">-</span>agent collaboration     (<span class="operator">~</span><span class="number">200</span> tokens, droppable)<span class="operator">|</span> <span class="operator">|</span></span><br><span class="line"><span class="operator">|</span>  <span class="operator">|</span> <span class="operator">-</span><span class="operator">&gt;</span> <span class="keyword">When</span> <span class="keyword">to</span> delegate vs direct <span class="keyword">call</span>                  <span class="operator">|</span> <span class="operator">|</span></span><br><span class="line"><span class="operator">|</span>  <span class="operator">|</span> <span class="operator">-</span><span class="operator">&gt;</span> Scrolling<span class="operator">-</span><span class="keyword">specific</span> parallel evidence collection  <span class="operator">|</span> <span class="operator">|</span></span><br><span class="line"><span class="operator">|</span>  <span class="operator">+</span><span class="comment">---------------------------------------------------+ |</span></span><br><span class="line"><span class="operator">+</span><span class="comment">-------------------------------------------------------+</span></span><br><span class="line"><span class="operator">|</span>  Tier <span class="number">4</span>: <span class="keyword">PER</span><span class="operator">-</span>INTERACTION (may change <span class="keyword">every</span> query)      <span class="operator">|</span></span><br><span class="line"><span class="operator">|</span>  <span class="operator">+</span><span class="comment">---------------------------------------------------+ |</span></span><br><span class="line"><span class="operator">|</span>  <span class="operator">|</span> <span class="keyword">User</span> selection context     (<span class="operator">~</span><span class="number">300</span> tokens, <span class="keyword">not</span> drop.) <span class="operator">|</span> <span class="operator">|</span></span><br><span class="line"><span class="operator">|</span>  <span class="operator">|</span> <span class="operator">-</span><span class="operator">&gt;</span> <span class="type">Time</span> <span class="keyword">range</span> selection (selection<span class="operator">-</span>area.template.md)<span class="operator">|</span> <span class="operator">|</span></span><br><span class="line"><span class="operator">|</span>  <span class="operator">|</span> <span class="operator">-</span><span class="operator">&gt;</span> <span class="keyword">Or</span> Slice selection (selection<span class="operator">-</span>slice.template.md) <span class="operator">|</span> <span class="operator">|</span></span><br><span class="line"><span class="operator">|</span>  <span class="operator">+</span><span class="comment">---------------------------------------------------+ |</span></span><br><span class="line"><span class="operator">|</span>  <span class="operator">|</span> Comparison mode context    (conditionally injected) <span class="operator">|</span> <span class="operator">|</span></span><br><span class="line"><span class="operator">|</span>  <span class="operator">|</span> <span class="operator">-</span><span class="operator">&gt;</span> Dual<span class="operator">-</span>trace comparison methodology <span class="operator">+</span> tool guide   <span class="operator">|</span> <span class="operator">|</span></span><br><span class="line"><span class="operator">|</span>  <span class="operator">+</span><span class="comment">---------------------------------------------------+ |</span></span><br><span class="line"><span class="operator">|</span>  <span class="operator">|</span> Conversation context       (<span class="operator">~</span><span class="number">500</span> tokens)            <span class="operator">|</span> <span class="operator">|</span></span><br><span class="line"><span class="operator">|</span>  <span class="operator">|</span> <span class="operator">-</span><span class="operator">&gt;</span> Analysis notes (<span class="operator">&lt;=</span><span class="number">10</span>, sorted <span class="keyword">by</span> priority)        <span class="operator">|</span> <span class="operator">|</span></span><br><span class="line"><span class="operator">|</span>  <span class="operator">|</span> <span class="operator">-</span><span class="operator">&gt;</span> Previous findings (<span class="operator">&lt;=</span><span class="number">10</span>)                         <span class="operator">|</span> <span class="operator">|</span></span><br><span class="line"><span class="operator">|</span>  <span class="operator">|</span> <span class="operator">-</span><span class="operator">&gt;</span> Known entities (<span class="keyword">for</span> drill<span class="operator">-</span>down)                  <span class="operator">|</span> <span class="operator">|</span></span><br><span class="line"><span class="operator">|</span>  <span class="operator">|</span> <span class="operator">-</span><span class="operator">&gt;</span> Conversation summary (<span class="keyword">cross</span><span class="operator">-</span>turn compressed,     <span class="operator">|</span> <span class="operator">|</span></span><br><span class="line"><span class="operator">|</span>  <span class="operator">|</span>    <span class="operator">&lt;=</span><span class="number">2000</span> tokens)                                   <span class="operator">|</span> <span class="operator">|</span></span><br><span class="line"><span class="operator">|</span>  <span class="operator">+</span><span class="comment">---------------------------------------------------+ |</span></span><br><span class="line"><span class="operator">|</span>  <span class="operator">|</span> <span class="keyword">SQL</span> pitfall records        (<span class="operator">&lt;=</span><span class="number">5</span>, droppable)         <span class="operator">|</span> <span class="operator">|</span></span><br><span class="line"><span class="operator">|</span>  <span class="operator">|</span> <span class="operator">-</span><span class="operator">&gt;</span> ERROR <span class="operator">-</span><span class="operator">&gt;</span> BAD <span class="keyword">SQL</span> <span class="operator">-</span><span class="operator">&gt;</span> FIX <span class="keyword">SQL</span>                      <span class="operator">|</span> <span class="operator">|</span></span><br><span class="line"><span class="operator">|</span>  <span class="operator">+</span><span class="comment">---------------------------------------------------+ |</span></span><br><span class="line"><span class="operator">|</span>  <span class="operator">|</span> Historical analysis patterns (<span class="keyword">cross</span><span class="operator">-</span>session, drop.) <span class="operator">|</span> <span class="operator">|</span></span><br><span class="line"><span class="operator">|</span>  <span class="operator">|</span> Historical pitfall records  (<span class="keyword">cross</span><span class="operator">-</span>session, drop.)  <span class="operator">|</span> <span class="operator">|</span></span><br><span class="line"><span class="operator">|</span>  <span class="operator">+</span><span class="comment">---------------------------------------------------+ |</span></span><br><span class="line"><span class="operator">|</span>  <span class="operator">|</span> Historical analysis plans  (<span class="operator">&lt;=</span><span class="number">3</span> turns, droppable)   <span class="operator">|</span> <span class="operator">|</span></span><br><span class="line"><span class="operator">|</span>  <span class="operator">|</span> <span class="operator">-</span><span class="operator">&gt;</span> Phase status: done<span class="operator">/</span>skipped<span class="operator">/</span>pending <span class="operator">+</span> summary     <span class="operator">|</span> <span class="operator">|</span></span><br><span class="line"><span class="operator">|</span>  <span class="operator">+</span><span class="comment">---------------------------------------------------+ |</span></span><br><span class="line"><span class="operator">+</span><span class="comment">-------------------------------------------------------+</span></span><br></pre></td></tr></table></figure><h3 id="Template-loading-and-variable-substitution"><a href="#Template-loading-and-variable-substitution" class="headerlink" title="Template loading and variable substitution"></a>Template loading and variable substitution</h3><p>All prompt content is defined in Markdown files (detailed in Q1); TypeScript only handles loading and variable substitution:</p><figure class="highlight typescript"><table><tr><td class="gutter"><pre><span class="line">1</span><br><span class="line">2</span><br><span class="line">3</span><br><span class="line">4</span><br><span class="line">5</span><br><span class="line">6</span><br><span class="line">7</span><br><span class="line">8</span><br><span class="line">9</span><br><span class="line">10</span><br><span class="line">11</span><br></pre></td><td class="code"><pre><span class="line"><span class="comment">// strategyLoader.ts -- template system</span></span><br><span class="line"></span><br><span class="line"><span class="comment">// 1. Load template (DEV mode skips cache, browser refresh takes effect)</span></span><br><span class="line"><span class="title function_">loadPromptTemplate</span>(<span class="string">&#x27;prompt-methodology&#x27;</span>)  <span class="comment">// -&gt; strategies/prompt-methodology.template.md</span></span><br><span class="line"></span><br><span class="line"><span class="comment">// 2. Load scene strategy (extract keywords from YAML frontmatter, body as strategy content)</span></span><br><span class="line"><span class="title function_">getStrategyContent</span>(<span class="string">&#x27;scrolling&#x27;</span>)  <span class="comment">// -&gt; Markdown body of strategies/scrolling.strategy.md</span></span><br><span class="line"></span><br><span class="line"><span class="comment">// 3. Variable substitution</span></span><br><span class="line"><span class="title function_">renderTemplate</span>(methodologyTemplate, &#123; sceneStrategy &#125;)</span><br><span class="line"><span class="comment">// Replaces &#123;&#123;sceneStrategy&#125;&#125; with scrolling.strategy.md content</span></span><br></pre></td></tr></table></figure><p><strong>Template file inventory:</strong></p><table><thead><tr><th>Category</th><th>File</th><th>Purpose</th></tr></thead><tbody><tr><td><strong>Static templates</strong></td><td><code>prompt-role.template.md</code></td><td>Role definition</td></tr><tr><td></td><td><code>prompt-output-format.template.md</code></td><td>Output format rules (91 lines)</td></tr><tr><td></td><td><code>prompt-quick.template.md</code></td><td>Quick mode streamlined prompt</td></tr><tr><td><strong>Methodology</strong></td><td><code>prompt-methodology.template.md</code></td><td>Analysis methodology (contains <code>&#123;&#123;sceneStrategy&#125;&#125;</code> placeholder)</td></tr><tr><td><strong>Architecture guides</strong></td><td><code>arch-standard.template.md</code></td><td>Standard Android rendering guidance</td></tr><tr><td></td><td><code>arch-flutter.template.md</code></td><td>Flutter engine guidance</td></tr><tr><td></td><td><code>arch-compose.template.md</code></td><td>Jetpack Compose guidance</td></tr><tr><td></td><td><code>arch-webview.template.md</code></td><td>WebView guidance</td></tr><tr><td><strong>Selection templates</strong></td><td><code>selection-area.template.md</code></td><td>Time range selection (<code>&#123;&#123;startNs&#125;&#125;</code>, <code>&#123;&#123;endNs&#125;&#125;</code>…)</td></tr><tr><td></td><td><code>selection-slice.template.md</code></td><td>Slice selection (<code>&#123;&#123;eventId&#125;&#125;</code>, <code>&#123;&#123;ts&#125;&#125;</code>…)</td></tr><tr><td><strong>Comparison mode</strong></td><td><code>comparison-methodology.template.md</code></td><td>Dual-trace comparison methodology</td></tr><tr><td><strong>Scene strategies</strong></td><td>12 <code>*.strategy.md</code> files</td><td>scrolling&#x2F;startup&#x2F;anr&#x2F;memory&#x2F;…</td></tr><tr><td><strong>Knowledge templates</strong></td><td>8 <code>knowledge-*.template.md</code> files</td><td>On-demand domain knowledge (not injected into prompt)</td></tr><tr><td><strong>Auxiliary templates</strong></td><td><code>prompt-complexity-classifier.template.md</code></td><td>Quick&#x2F;Full routing decision (not injected into prompt, but determines which path to take)</td></tr></tbody></table><h3 id="Token-budget-management"><a href="#Token-budget-management" class="headerlink" title="Token budget management"></a>Token budget management</h3><p><strong>Budget ceiling:</strong> 4500 tokens (<code>MAX_PROMPT_TOKENS</code>). During correction retries, if SDK auto-compact is detected (conversation history automatically compressed), the budget is reduced to 3000 tokens to leave room; otherwise the original prompt is reused.</p><p><strong>Token estimation method:</strong> Mixed Chinese-English estimation – Chinese characters at 1.5 tokens&#x2F;character, ASCII at 0.3 tokens&#x2F;character. This is a rough approximation but sufficiently accurate for budget management.</p><p><strong>Progressive dropping strategy when over budget:</strong></p><p>When the assembled prompt’s token count exceeds the budget, entire sections are dropped in order from lowest to highest priority:</p><figure class="highlight plaintext"><table><tr><td class="gutter"><pre><span class="line">1</span><br><span class="line">2</span><br><span class="line">3</span><br><span class="line">4</span><br><span class="line">5</span><br><span class="line">6</span><br><span class="line">7</span><br><span class="line">8</span><br></pre></td><td class="code"><pre><span class="line">Drop order (dropped first -&gt; dropped last):</span><br><span class="line">1. Perfetto SQL knowledge base reference -&gt; Agent can use lookup_sql_schema tool instead</span><br><span class="line">2. Trace data completeness              -&gt; Helpful but Agent can discover missing data at runtime</span><br><span class="line">3. Historical analysis patterns          -&gt; Cross-session pattern memory, non-critical</span><br><span class="line">4. Historical pitfall records            -&gt; Cross-session negative memory, droppable</span><br><span class="line">5. SQL pitfall records                   -&gt; Nice to have</span><br><span class="line">6. Sub-agent collaboration               -&gt; Only useful when sub-agents are enabled</span><br><span class="line">7. Historical analysis plans             -&gt; Supplementary context</span><br></pre></td></tr></table></figure><p><strong>Content that is never dropped:</strong></p><ul><li>Role definition, output format (Tier 1 static)</li><li>Architecture info, focus application (Tier 2 per-trace)</li><li>Methodology + scene strategy (Tier 3 core)</li><li>User selection context (user’s explicit intent)</li><li>Conversation context (previous findings and analysis notes)</li></ul><h3 id="Complete-context-construction-flow"><a href="#Complete-context-construction-flow" class="headerlink" title="Complete context construction flow"></a>Complete context construction flow</h3><p>In <code>ClaudeRuntime.analyze()</code>, prompt assembly is preceded by over twenty preparation phases to collect all context:</p><figure class="highlight plaintext"><table><tr><td class="gutter"><pre><span class="line">1</span><br><span class="line">2</span><br><span class="line">3</span><br><span class="line">4</span><br><span class="line">5</span><br><span class="line">6</span><br><span class="line">7</span><br><span class="line">8</span><br><span class="line">9</span><br><span class="line">10</span><br><span class="line">11</span><br><span class="line">12</span><br><span class="line">13</span><br><span class="line">14</span><br><span class="line">15</span><br><span class="line">16</span><br><span class="line">17</span><br><span class="line">18</span><br><span class="line">19</span><br><span class="line">20</span><br><span class="line">21</span><br><span class="line">22</span><br><span class="line">23</span><br></pre></td><td class="code"><pre><span class="line">Phase 0:   Selection context logging</span><br><span class="line">Phase 0.5: Focus app detection (3 methods: battery_stats / oom_adj / frame_timeline)</span><br><span class="line">Phase 1:   Skill executor initialization</span><br><span class="line">Phase 2:   Architecture detection (LRU cached, detected once per trace)</span><br><span class="line">Phase 2.5: Vendor detection (OEM customization, LRU cached)</span><br><span class="line">Phase 2.8: Comparison mode context (dual-trace mode)</span><br><span class="line">Phase 2.9: Data completeness probing (18 dimensions, ~50ms)</span><br><span class="line">Phase 3:   Session context + conversation history</span><br><span class="line">Phase 4:   Entity store (drill-down references)</span><br><span class="line">Phase 5:   Scene classification (keyword matching, &lt;1ms)</span><br><span class="line">Phase 5.5: Cross-session pattern memory matching</span><br><span class="line">Phase 6:   ArtifactStore + analysis notes</span><br><span class="line">Phase 6.5: Analysis plan (current + historical)</span><br><span class="line">Phase 6.6: Watchdog feedback references</span><br><span class="line">Phase 6.7: Hypothesis state</span><br><span class="line">Phase 6.8: Uncertainty flags</span><br><span class="line">Phase 7:   SQL error tracking</span><br><span class="line">Phase 8:   MCP Server creation (inject all the above state)</span><br><span class="line">Phase 9:   (removed)</span><br><span class="line">Phase 10:  SQL knowledge base context</span><br><span class="line">Phase 11:  Sub-agent definitions</span><br><span class="line">Phase 12:  SQL error-fix pairs</span><br><span class="line">Phase 13:  -&gt; buildSystemPrompt(context) -&gt; final prompt</span><br></pre></td></tr></table></figure><p>All Phase results feed into the <code>ClaudeAnalysisContext</code> object, passed to <code>buildSystemPrompt()</code> for final assembly.</p><h3 id="Quick-vs-Full-dual-mode"><a href="#Quick-vs-Full-dual-mode" class="headerlink" title="Quick vs Full dual mode"></a>Quick vs Full dual mode</h3><p>Not all queries need the full 4500-token prompt. When users ask factual questions (e.g., “what’s the frame rate”), SmartPerfetto uses a streamlined quick prompt:</p><figure class="highlight typescript"><table><tr><td class="gutter"><pre><span class="line">1</span><br><span class="line">2</span><br><span class="line">3</span><br><span class="line">4</span><br></pre></td><td class="code"><pre><span class="line"><span class="comment">// buildQuickSystemPrompt() -- ~1500 tokens</span></span><br><span class="line"><span class="comment">// Loads prompt-quick.template.md</span></span><br><span class="line"><span class="comment">// Only injects &#123;&#123;architectureContext&#125;&#125; and &#123;&#123;focusAppContext&#125;&#125;</span></span><br><span class="line"><span class="comment">// No methodology, no scene strategy, no conversation context</span></span><br></pre></td></tr></table></figure><table><thead><tr><th>Dimension</th><th>Quick Mode</th><th>Full Mode</th></tr></thead><tbody><tr><td>Target tokens</td><td>~1500</td><td>~4500</td></tr><tr><td>Scene strategy</td><td>None</td><td>One of 12</td></tr><tr><td>Methodology</td><td>None</td><td>prompt-methodology.template.md</td></tr><tr><td>Conversation context</td><td>None</td><td>findings + notes + entity + summary</td></tr><tr><td>Planning Gate</td><td>None</td><td>Yes</td></tr><tr><td>Verifier</td><td>None</td><td>Yes</td></tr><tr><td>Use case</td><td>“What’s the frame rate” “Is there an ANR”</td><td>“Analyze scrolling stuttering” “Analyze startup performance”</td></tr></tbody></table><h3 id="How-the-prompt-changes-across-multi-turn-conversations"><a href="#How-the-prompt-changes-across-multi-turn-conversations" class="headerlink" title="How the prompt changes across multi-turn conversations"></a>How the prompt changes across multi-turn conversations</h3><p>In multi-turn analysis (user follow-ups or drill-downs), prompt changes depend on <strong>whether the SDK session hits resume</strong>:</p><p><strong>Turn 1:</strong> No conversation context, no historical plans, no analysis notes</p><p><strong>Turn 2 onward – SDK session resume hit (within 4 hours):</strong></p><ul><li>SDK internally already holds complete conversation history; <code>previousFindings</code> and <code>conversationSummary</code> are <strong>not re-injected</strong></li><li>But still injected: analysis notes (&lt;&#x3D;10), entity context (drill-down references), historical plans (&lt;&#x3D;3 turns)</li><li>Tiers 1-3 remain unchanged, hitting ~80% cache</li></ul><p><strong>Turn 2 onward – SDK session expired or unavailable:</strong></p><ul><li>Previous turn’s findings are manually injected as “previous analysis findings” (&lt;&#x3D;10)</li><li>Conversation summary is manually injected (<code>sessionContext.generatePromptContext(2000)</code>, &lt;&#x3D;2000 tokens)</li><li>Analysis notes, entity context, and historical plans same as above</li></ul><p><strong>Correction retry turn:</strong> If SDK auto-compact is detected (conversation history automatically compressed), token budget drops from 4500 to 3000, and progressive dropping more aggressively removes non-critical sections. If auto-compact hasn’t occurred, the original system prompt is reused.</p><h3 id="A-concrete-example-Prompt-assembly-for-scrolling-analysis"><a href="#A-concrete-example-Prompt-assembly-for-scrolling-analysis" class="headerlink" title="A concrete example: Prompt assembly for scrolling analysis"></a>A concrete example: Prompt assembly for scrolling analysis</h3><p>User inputs <code>&quot;Analyze scrolling stuttering&quot;</code>, Flutter TextureView architecture, Turn 1:</p><figure class="highlight plaintext"><table><tr><td class="gutter"><pre><span class="line">1</span><br><span class="line">2</span><br><span class="line">3</span><br><span class="line">4</span><br><span class="line">5</span><br><span class="line">6</span><br><span class="line">7</span><br><span class="line">8</span><br><span class="line">9</span><br><span class="line">10</span><br></pre></td><td class="code"><pre><span class="line">[Tier 1] prompt-role.template.md                    -&gt; &quot;You are an Android performance analysis expert...&quot;</span><br><span class="line">[Tier 1] prompt-output-format.template.md            -&gt; Output format rules</span><br><span class="line">[Tier 2] &quot;Architecture: Flutter TextureView, confidence 92%&quot;  -&gt; + arch-flutter.template.md</span><br><span class="line">[Tier 2] &quot;Focus app: com.example.app (primary focus)&quot;  -&gt; frame count + detection method</span><br><span class="line">[Tier 2] &quot;Data completeness: gpu MISSING, suspected not captured&quot;  -&gt; only reports missing/insufficient</span><br><span class="line">[Tier 2] SQL knowledge base: android_frames, slice_self_dur  -&gt; stdlib match results</span><br><span class="line">[Tier 3] prompt-methodology + scrolling.strategy.md   -&gt; Phase 1-&gt;1.5-&gt;1.9-&gt;3 complete strategy</span><br><span class="line">[Tier 4] (no selection, no conversation context, no historical plans)</span><br><span class="line"></span><br><span class="line">Estimated: ~3200 tokens, within 4500 budget, no dropping needed</span><br></pre></td></tr></table></figure><p>User follows up with <code>&quot;Deep dive into frame 3&quot;</code>, Turn 2 (SDK session resume hit):</p><figure class="highlight plaintext"><table><tr><td class="gutter"><pre><span class="line">1</span><br><span class="line">2</span><br><span class="line">3</span><br><span class="line">4</span><br><span class="line">5</span><br><span class="line">6</span><br><span class="line">7</span><br><span class="line">8</span><br></pre></td><td class="code"><pre><span class="line">[Tier 1-3] Same as Turn 1 (hitting ~80% cache)</span><br><span class="line">[Tier 4] Conversation context (SDK holds conversation history, findings not re-injected):</span><br><span class="line">  - Analysis notes: &quot;Warning [Hypothesis] Primary jank cause is RenderThread Binder blocking&quot;</span><br><span class="line">  - Entity context: frame#3&#x27;s ID and time range</span><br><span class="line">  - Historical plan: &quot;Done Phase 1 overview, Done Phase 1.9 deep drill, Pending Phase 3 conclusion&quot;</span><br><span class="line">  (previousFindings and conversationSummary managed internally by SDK session, not duplicated in prompt)</span><br><span class="line"></span><br><span class="line">Estimated: ~3400 tokens, within budget</span><br></pre></td></tr></table></figure><h3 id="One-sentence-summary-5"><a href="#One-sentence-summary-5" class="headerlink" title="One-sentence summary"></a>One-sentence summary</h3><p><strong>The prompt is sorted by “stability” across four tiers (Static -&gt; Per-Trace -&gt; Per-Query -&gt; Dynamic), leveraging API prefix caching to achieve ~80% token savings across multi-turn conversations. The template system lets domain experts directly edit analysis strategies without touching TypeScript. When over budget, progressive dropping by priority occurs, but role definition, scene strategy, and user selection are always preserved – these three determine the analysis direction and scope.</strong></p><hr><h2 id="Q8-What-Skills-does-SmartPerfetto-have"><a href="#Q8-What-Skills-does-SmartPerfetto-have" class="headerlink" title="Q8: What Skills does SmartPerfetto have?"></a>Q8: What Skills does SmartPerfetto have?</h2><p><strong>Question context:</strong> SmartPerfetto’s analysis capabilities are carried by YAML Skills. A complete Skill inventory helps understand the system’s analysis coverage.</p><h3 id="Overview"><a href="#Overview" class="headerlink" title="Overview"></a>Overview</h3><table><thead><tr><th>Category</th><th>Count</th><th>Description</th></tr></thead><tbody><tr><td>Atomic</td><td>87</td><td>Single-step detection&#x2F;statistics, completed with one or a few SQL statements</td></tr><tr><td>Composite</td><td>29</td><td>Combines multiple atomic skills, supports iterator&#x2F;conditional</td></tr><tr><td>Deep</td><td>2</td><td>Deep profiling (callstack, CPU profiling)</td></tr><tr><td>Pipeline</td><td>28</td><td>Rendering pipeline detection + teaching (24+ architectures)</td></tr><tr><td>Module</td><td>18</td><td>Modular configuration: app&#x2F;framework&#x2F;hardware&#x2F;kernel</td></tr><tr><td><strong>Total</strong></td><td><strong>164</strong></td><td></td></tr></tbody></table><hr><h3 id="Atomic-Skills-87"><a href="#Atomic-Skills-87" class="headerlink" title="Atomic Skills (87)"></a>Atomic Skills (87)</h3><p>Single-step data extraction and detection – the building blocks for all higher-level Skills.</p><p><strong>Frame rendering and jank:</strong></p><table><thead><tr><th>Skill ID</th><th>One-line description</th></tr></thead><tbody><tr><td>consumer_jank_detection</td><td>Detect real frame drops from SF consumer perspective (per-layer buffer starvation)</td></tr><tr><td>frame_blocking_calls</td><td>Identify blocking calls during each jank frame (GC, Binder, locks, IO)</td></tr><tr><td>frame_production_gap</td><td>Detect frame production gaps: gaps between consecutive frames exceeding 1.5x VSync</td></tr><tr><td>frame_pipeline_variance</td><td>Detect frame duration jitter and high-variance intervals</td></tr><tr><td>render_pipeline_latency</td><td>Break down latency across all stages of the frame rendering pipeline</td></tr><tr><td>render_thread_slices</td><td>Analyze RenderThread time slice distribution</td></tr><tr><td>app_frame_production</td><td>Analyze application main thread frame production</td></tr><tr><td>sf_frame_consumption</td><td>Analyze SurfaceFlinger frame consumption</td></tr><tr><td>sf_composition_in_range</td><td>Analyze SurfaceFlinger composition latency</td></tr><tr><td>sf_layer_count_in_range</td><td>Count active SF layers within a time range</td></tr><tr><td>present_fence_timing</td><td>Analyze Present Fence timing, detecting actual display latency</td></tr><tr><td>game_fps_analysis</td><td>Game-specific frame rate analysis, supporting fixed frame rate modes</td></tr></tbody></table><p><strong>VSync and refresh rate:</strong></p><table><thead><tr><th>Skill ID</th><th>One-line description</th></tr></thead><tbody><tr><td>vsync_period_detection</td><td>Detect VSync period, return refresh rate and confidence</td></tr><tr><td>vsync_config</td><td>Parse actual VSync period and refresh rate settings from trace</td></tr><tr><td>vsync_alignment_in_range</td><td>Analyze frame-to-VSync signal alignment</td></tr><tr><td>vsync_phase_alignment</td><td>Analyze input event to VSync phase relationship, locating touch-to-display latency bottlenecks</td></tr><tr><td>vrr_detection</td><td>Detect whether the device uses variable refresh rate (VRR&#x2F;LTPO&#x2F;Adaptive Sync)</td></tr></tbody></table><p><strong>CPU and scheduling:</strong></p><table><thead><tr><th>Skill ID</th><th>One-line description</th></tr></thead><tbody><tr><td>cpu_topology_detection</td><td>Dynamically detect CPU big.LITTLE core topology from cpufreq</td></tr><tr><td>cpu_topology_view</td><td>Create reusable SQL VIEW <code>_cpu_topology</code></td></tr><tr><td>cpu_slice_analysis</td><td>Analyze CPU time slice distribution (with dynamic topology detection)</td></tr><tr><td>cpu_load_in_range</td><td>Analyze per-CPU core load within a specified time range</td></tr><tr><td>cpu_cluster_load_in_range</td><td>Calculate overall CPU load percentage for big and little core clusters</td></tr><tr><td>cpu_freq_timeline</td><td>Analyze per-CPU core frequency change timeline</td></tr><tr><td>cpu_throttling_in_range</td><td>Detect CPU thermal throttling situations</td></tr><tr><td>sched_latency_in_range</td><td>Analyze thread scheduling wait time distribution, detecting CPU contention</td></tr><tr><td>scheduling_analysis</td><td>Analyze thread scheduling latency (Runnability)</td></tr><tr><td>task_migration_in_range</td><td>Analyze thread migration frequency between big and little cores</td></tr><tr><td>thread_affinity_violation</td><td>Detect high-frequency core migration of main thread&#x2F;RenderThread</td></tr><tr><td>thermal_predictor</td><td>Predict thermal throttling risk based on CPU frequency trends</td></tr><tr><td>cache_miss_impact</td><td>Count cache-miss counters and evaluate fluctuation</td></tr></tbody></table><p><strong>GPU:</strong></p><table><thead><tr><th>Skill ID</th><th>One-line description</th></tr></thead><tbody><tr><td>gpu_render_in_range</td><td>Analyze GPU rendering duration and Fence wait</td></tr><tr><td>gpu_freq_in_range</td><td>Analyze GPU frequency changes</td></tr><tr><td>gpu_metrics</td><td>Analyze GPU frequency, utilization, and rendering performance</td></tr><tr><td>gpu_power_state_analysis</td><td>Analyze GPU frequency state transitions, identifying frequency reduction pressure and jitter</td></tr></tbody></table><p><strong>Main thread analysis:</strong></p><table><thead><tr><th>Skill ID</th><th>One-line description</th></tr></thead><tbody><tr><td>main_thread_states_in_range</td><td>Count main thread states, blocking functions, and percentages within a range</td></tr><tr><td>main_thread_slices_in_range</td><td>Count main thread slice duration distribution within a range</td></tr><tr><td>main_thread_sched_latency_in_range</td><td>Count main thread Runnable wait time distribution</td></tr><tr><td>main_thread_file_io_in_range</td><td>Count main thread file IO related slice durations within a range</td></tr></tbody></table><p><strong>Binder IPC:</strong></p><table><thead><tr><th>Skill ID</th><th>One-line description</th></tr></thead><tbody><tr><td>binder_in_range</td><td>Analyze Binder transactions within a specified time range</td></tr><tr><td>binder_blocking_in_range</td><td>Analyze counterpart process response delays in synchronous Binder calls</td></tr><tr><td>binder_root_cause</td><td>Perform server&#x2F;client-side blocking cause attribution for slow Binder transactions</td></tr><tr><td>binder_storm_detection</td><td>Detect Binder transaction storms: too many IPC calls in a short period</td></tr></tbody></table><p><strong>Locks and synchronization:</strong></p><table><thead><tr><th>Skill ID</th><th>One-line description</th></tr></thead><tbody><tr><td>lock_contention_in_range</td><td>Analyze lock contention within a specified time range</td></tr><tr><td>futex_wait_distribution</td><td>Count futex&#x2F;mutex lock wait distribution and duration</td></tr></tbody></table><p><strong>Startup-specific (19):</strong></p><table><thead><tr><th>Skill ID</th><th>One-line description</th></tr></thead><tbody><tr><td>startup_events_in_range</td><td>Query startup events and TTID&#x2F;TTFD metrics</td></tr><tr><td>startup_slow_reasons</td><td>Startup slow reasons (Google official classification + self-check) v3.0</td></tr><tr><td>startup_critical_tasks</td><td>Auto-identify all active threads during startup interval, sorted by CPU time</td></tr><tr><td>startup_thread_blocking_graph</td><td>Build thread block&#x2F;wakeup relationship graph using waker_utid</td></tr><tr><td>startup_jit_analysis</td><td>Analyze JIT compilation thread impact on startup speed</td></tr><tr><td>startup_cpu_placement_timeline</td><td>Analyze main thread core type changes by time bucket, detecting stuck-on-little-core during startup</td></tr><tr><td>startup_freq_rampup</td><td>Analyze CPU frequency ramp-up speed during cold start, detecting frequency scaling delays</td></tr><tr><td>startup_binder_pool_analysis</td><td>Analyze Binder thread pool utilization and saturation during startup</td></tr><tr><td>startup_hot_slice_states</td><td>Analyze thread state distribution of Top N hot slices during startup interval</td></tr><tr><td>startup_main_thread_states_in_range</td><td>Count main thread Running&#x2F;Runnable&#x2F;Blocked percentages during startup</td></tr><tr><td>startup_main_thread_slices_in_range</td><td>Count main thread slice hotspots during startup</td></tr><tr><td>startup_binder_in_range</td><td>Count Binder call distribution during startup</td></tr><tr><td>startup_main_thread_file_io_in_range</td><td>Count main thread file IO during startup</td></tr><tr><td>startup_sched_latency_in_range</td><td>Count main thread Runnable wait latency during startup</td></tr><tr><td>startup_main_thread_sync_binder_in_range</td><td>Count main thread synchronous Binder duration during startup</td></tr><tr><td>startup_main_thread_binder_blocking_in_range</td><td>Analyze main thread synchronous Binder blocking details during startup</td></tr><tr><td>startup_breakdown_in_range</td><td>Count attribution reason time percentages during startup</td></tr><tr><td>startup_gc_in_range</td><td>Count GC slices and main thread percentage during startup</td></tr><tr><td>startup_class_loading_in_range</td><td>Count class loading slice durations during startup</td></tr></tbody></table><p><strong>Memory and GC:</strong></p><table><thead><tr><th>Skill ID</th><th>One-line description</th></tr></thead><tbody><tr><td>gc_events_in_range</td><td>Query GC events for a given process and optional time range</td></tr><tr><td>memory_pressure_in_range</td><td>Analyze memory pressure metrics within a specified time range</td></tr><tr><td>page_fault_in_range</td><td>Analyze Page Fault and memory reclaim impact on performance</td></tr></tbody></table><p><strong>Input and touch:</strong></p><table><thead><tr><th>Skill ID</th><th>One-line description</th></tr></thead><tbody><tr><td>input_events_in_range</td><td>Extract raw input events within a range, analyzing dispatch latency</td></tr><tr><td>input_to_frame_latency</td><td>Measure latency from each MotionEvent to corresponding frame present</td></tr><tr><td>touch_to_display_latency</td><td>Measure end-to-end latency from touch to frame rendering</td></tr><tr><td>scroll_response_latency</td><td>Measure response latency from scroll gesture input to first frame rendering</td></tr></tbody></table><p><strong>System and device:</strong></p><table><thead><tr><th>Skill ID</th><th>One-line description</th></tr></thead><tbody><tr><td>system_load_in_range</td><td>Analyze overall system CPU utilization and process activity</td></tr><tr><td>device_state_snapshot</td><td>Capture device environment info during trace (screen, battery, temperature, etc.)</td></tr><tr><td>device_state_timeline</td><td>Track device state changes over time</td></tr><tr><td>wakelock_tracking</td><td>Track Wake Lock holding, detecting battery drain anomalies</td></tr></tbody></table><p><strong>Others:</strong></p><table><thead><tr><th>Skill ID</th><th>One-line description</th></tr></thead><tbody><tr><td>blocking_chain_analysis</td><td>Analyze main thread blocking chain: what blocked the main thread? What was the waker doing?</td></tr><tr><td>anr_main_thread_blocking</td><td>Deep analysis of main thread blocking cause during ANR</td></tr><tr><td>anr_context_in_range</td><td>Extract first ANR event data as time window anchor</td></tr><tr><td>app_lifecycle_in_range</td><td>Track Activity&#x2F;Fragment lifecycle events</td></tr><tr><td>compose_recomposition_hotspot</td><td>Detect Jetpack Compose recomposition hotspots</td></tr><tr><td>webview_v8_analysis</td><td>Analyze WebView V8 engine: GC, script compilation, execution time</td></tr><tr><td>rendering_pipeline_detection</td><td>Identify application rendering pipeline type (24 fine-grained detection types)</td></tr><tr><td>pipeline_key_slices_overlay</td><td>Query pipeline key Slice ts&#x2F;dur for timeline overlay</td></tr></tbody></table><hr><h3 id="Composite-Skills-29"><a href="#Composite-Skills-29" class="headerlink" title="Composite Skills (29)"></a>Composite Skills (29)</h3><p>Combine multiple atomic skills, supporting iterator (per-frame&#x2F;per-event deep drill) and conditional (data-driven branching).</p><table><thead><tr><th>Skill ID</th><th>One-line description</th></tr></thead><tbody><tr><td>scrolling_analysis</td><td>Scrolling analysis main entry: overview -&gt; frame list -&gt; root cause classification -&gt; per-frame diagnosis</td></tr><tr><td>flutter_scrolling_analysis</td><td>Flutter-specific frame analysis, using Flutter thread model</td></tr><tr><td>jank_frame_detail</td><td>Analyze a specific jank frame in detail: deep drill into jank cause and root cause classification</td></tr><tr><td>startup_analysis</td><td>Startup analysis main entry: Iterator mode, big&#x2F;little core analysis, four-quadrant</td></tr><tr><td>startup_detail</td><td>Analyze a single startup event: main thread duration, Binder, CPU big&#x2F;little core ratio</td></tr><tr><td>anr_analysis</td><td>ANR v3.0 analysis: system issue vs. app issue, categorized handling</td></tr><tr><td>anr_detail</td><td>Single ANR event detail: four-quadrant, Binder dependencies, deadlock detection</td></tr><tr><td>cpu_analysis</td><td>CPU analysis: time distribution, big&#x2F;little core analysis, scheduling chain</td></tr><tr><td>gpu_analysis</td><td>GPU analysis: frequency distribution, memory usage, frame rendering correlation</td></tr><tr><td>memory_analysis</td><td>Memory analysis: GC events, GC-to-frame correlation, thread states</td></tr><tr><td>gc_analysis</td><td>GC analysis: based on stdlib android_garbage_collection_events</td></tr><tr><td>binder_analysis</td><td>Binder deep analysis: transaction basics, thread states</td></tr><tr><td>binder_detail</td><td>Single Binder transaction detail: CPU big&#x2F;little core, four-quadrant, blocking cause</td></tr><tr><td>thermal_throttling</td><td>Temperature monitoring, thermal throttling detection, CPU frequency correlation</td></tr><tr><td>lock_contention_analysis</td><td>Lock contention multi-dimensional analysis: based on android.monitor_contention</td></tr><tr><td>surfaceflinger_analysis</td><td>SF frame composition performance: GPU&#x2F;HWC composition ratio, slow composition detection</td></tr><tr><td>click_response_analysis</td><td>Click response analysis: based on stdlib android_input_events</td></tr><tr><td>click_response_detail</td><td>Single slow input event detail: latency breakdown, four-quadrant, main thread blocking</td></tr><tr><td>scroll_session_analysis</td><td>Single complete scroll session: Touch phase vs Fling phase FPS</td></tr><tr><td>navigation_analysis</td><td>Activity&#x2F;Fragment navigation performance: lifecycle, transition animations</td></tr><tr><td>lmk_analysis</td><td>LMK analysis: cause distribution, timeline, frequency</td></tr><tr><td>dmabuf_analysis</td><td>DMA Buffer analysis: allocation, release, leak detection</td></tr><tr><td>block_io_analysis</td><td>Block IO analysis: device-level statistics, queue depth, long-duration IO</td></tr><tr><td>io_pressure</td><td>IO blocking data detection, IO Wait time, severity assessment</td></tr><tr><td>suspend_wakeup_analysis</td><td>Suspend&#x2F;wakeup analysis: time distribution, wakeup source ranking</td></tr><tr><td>network_analysis</td><td>Network analysis: traffic overview, per-app traffic, protocol distribution</td></tr><tr><td>irq_analysis</td><td>Hard interrupt and soft interrupt frequency, duration, nesting</td></tr><tr><td>scene_reconstruction</td><td>Reconstruct user operation scenarios through user input and screen state</td></tr><tr><td>state_timeline</td><td>Four-lane continuous state timeline: device&#x2F;user&#x2F;app&#x2F;system</td></tr></tbody></table><hr><h3 id="Deep-Skills-2"><a href="#Deep-Skills-2" class="headerlink" title="Deep Skills (2)"></a>Deep Skills (2)</h3><p>Deep profiling, typically requiring longer execution time.</p><table><thead><tr><th>Skill ID</th><th>One-line description</th></tr></thead><tbody><tr><td>cpu_profiling</td><td>CPU performance profiling: usage hotspots and scheduling efficiency deep analysis</td></tr><tr><td>callstack_analysis</td><td>Call stack hotspot analysis in Running state</td></tr></tbody></table><hr><h3 id="Pipeline-Skills-28"><a href="#Pipeline-Skills-28" class="headerlink" title="Pipeline Skills (28)"></a>Pipeline Skills (28)</h3><p>Rendering pipeline detection + teaching. Each pipeline skill corresponds to a rendering architecture, including pipeline description, key threads, performance metrics, and optimization recommendations.</p><table><thead><tr><th>Skill ID</th><th>Rendering architecture</th></tr></thead><tbody><tr><td>pipeline_android_view_standard_blast</td><td>Android 12+ standard HWUI + BLASTBufferQueue</td></tr><tr><td>pipeline_android_view_standard_legacy</td><td>Pre-Android 12 standard HWUI + Legacy BufferQueue</td></tr><tr><td>pipeline_android_view_software</td><td>CPU Skia software rendering, no RenderThread</td></tr><tr><td>pipeline_android_view_mixed</td><td>View + SurfaceView mixed rendering</td></tr><tr><td>pipeline_android_view_multi_window</td><td>Same-process multi-window (Dialog&#x2F;PopupWindow)</td></tr><tr><td>pipeline_android_pip_freeform</td><td>Picture-in-Picture and freeform window mode</td></tr><tr><td>pipeline_compose_standard</td><td>Jetpack Compose + HWUI RenderThread</td></tr><tr><td>pipeline_flutter_textureview</td><td>Flutter PlatformView fallback mode</td></tr><tr><td>pipeline_flutter_surfaceview_skia</td><td>Flutter + Skia engine (JIT Shader)</td></tr><tr><td>pipeline_flutter_surfaceview_impeller</td><td>Flutter + Impeller engine (pre-compiled Shader)</td></tr><tr><td>pipeline_webview_gl_functor</td><td>Traditional WebView, App RenderThread synchronous wait</td></tr><tr><td>pipeline_webview_surface_control</td><td>Modern WebView + Viz&#x2F;OOP-R independent composition</td></tr><tr><td>pipeline_webview_textureview_custom</td><td>X5&#x2F;UC and other custom WebView engines</td></tr><tr><td>pipeline_webview_surfaceview_wrapper</td><td>WebView fullscreen video wrapper mode</td></tr><tr><td>pipeline_chrome_browser_viz</td><td>Chrome Viz compositor, multi-process architecture</td></tr><tr><td>pipeline_opengl_es</td><td>Direct OpenGL ES &#x2F; EGL rendering</td></tr><tr><td>pipeline_vulkan_native</td><td>Native Vulkan rendering</td></tr><tr><td>pipeline_angle_gles_vulkan</td><td>ANGLE: OpenGL ES -&gt; Vulkan translation layer</td></tr><tr><td>pipeline_game_engine</td><td>Unity&#x2F;Unreal&#x2F;Godot and other game engines</td></tr><tr><td>pipeline_surfaceview_blast</td><td>Standalone SurfaceView + BLAST sync</td></tr><tr><td>pipeline_textureview_standard</td><td>SurfaceTexture texture sampling&#x2F;composition mode</td></tr><tr><td>pipeline_camera_pipeline</td><td>Camera2&#x2F;HAL3 multi-stream camera rendering</td></tr><tr><td>pipeline_video_overlay_hwc</td><td>HWC video layer hardware-accelerated overlay</td></tr><tr><td>pipeline_hardware_buffer_renderer</td><td>Android 14+ HBR API direct Buffer rendering</td></tr><tr><td>pipeline_surface_control_api</td><td>NDK SurfaceControl direct transaction submission</td></tr><tr><td>pipeline_variable_refresh_rate</td><td>VRR&#x2F;ARR + FrameTimeline dynamic refresh rate</td></tr><tr><td>pipeline_imagereader_pipeline</td><td>ImageReader API: ML inference, screen recording, custom camera</td></tr><tr><td>pipeline_software_compositing</td><td>SF CPU software composition fallback (when GPU unavailable)</td></tr></tbody></table><blockquote><p>Note: <code>_base.skill.yaml</code> is the base template file for Pipeline Skills, not registered as an available Skill, and not counted in the total.</p></blockquote><hr><h3 id="Module-Skills-18"><a href="#Module-Skills-18" class="headerlink" title="Module Skills (18)"></a>Module Skills (18)</h3><p>Modular analysis configuration, organized by layer. The Agent discovers them via <code>list_skills</code> and invokes on demand.</p><p><strong>Hardware layer (5):</strong></p><table><thead><tr><th>Skill ID</th><th>One-line description</th></tr></thead><tbody><tr><td>cpu_module</td><td>CPU frequency, thermal throttling, and power states</td></tr><tr><td>gpu_module</td><td>GPU rendering, frequency, and VRAM usage</td></tr><tr><td>memory_module</td><td>Memory bandwidth, LMK, dmabuf, PSI, page faults</td></tr><tr><td>thermal_module</td><td>Temperature sensors, thermal throttling detection, cooling policy</td></tr><tr><td>power_module</td><td>Wake Lock, CPU idle, power mode, suspend&#x2F;wakeup</td></tr></tbody></table><p><strong>Framework layer (6):</strong></p><table><thead><tr><th>Skill ID</th><th>One-line description</th></tr></thead><tbody><tr><td>surfaceflinger_module</td><td>Frame rendering timing, jank causes, GPU composition</td></tr><tr><td>choreographer_module</td><td>VSync signal, doFrame callbacks, frame production pipeline</td></tr><tr><td>ams_module</td><td>Application lifecycle, process management, startup timing</td></tr><tr><td>wms_module</td><td>Window animations, Activity transitions, multi-window</td></tr><tr><td>art_module</td><td>GC, JIT compilation, and memory allocation</td></tr><tr><td>input_module</td><td>Touch latency, input dispatch, and click response</td></tr></tbody></table><p><strong>Kernel layer (4):</strong></p><table><thead><tr><th>Skill ID</th><th>One-line description</th></tr></thead><tbody><tr><td>scheduler_module</td><td>Thread scheduling latency, CPU utilization, big&#x2F;little core assignment</td></tr><tr><td>binder_module</td><td>Cross-process calls, blocking transactions, call latency</td></tr><tr><td>lock_contention_module</td><td>Mutex&#x2F;Futex, Java monitor, deadlock detection</td></tr><tr><td>filesystem_module</td><td>Block IO, file operations, database, SharedPreferences</td></tr></tbody></table><p><strong>Application layer (3):</strong></p><table><thead><tr><th>Skill ID</th><th>One-line description</th></tr></thead><tbody><tr><td>launcher_module</td><td>Home screen performance, app launch, widget updates</td></tr><tr><td>systemui_module</td><td>Status bar, notification shade, quick settings, navigation bar</td></tr><tr><td>third_party_module</td><td>Third-party app performance, stuttering, and resource usage</td></tr></tbody></table><hr><h3 id="Relationships-between-Skills"><a href="#Relationships-between-Skills" class="headerlink" title="Relationships between Skills"></a>Relationships between Skills</h3><figure class="highlight plaintext"><table><tr><td class="gutter"><pre><span class="line">1</span><br><span class="line">2</span><br><span class="line">3</span><br><span class="line">4</span><br><span class="line">5</span><br><span class="line">6</span><br><span class="line">7</span><br><span class="line">8</span><br><span class="line">9</span><br><span class="line">10</span><br><span class="line">11</span><br><span class="line">12</span><br><span class="line">13</span><br><span class="line">14</span><br><span class="line">15</span><br><span class="line">16</span><br></pre></td><td class="code"><pre><span class="line">Module Skills (configuration layer)</span><br><span class="line">  +-&gt; Define analysis scope and focus areas</span><br><span class="line"></span><br><span class="line">Composite Skills (orchestration layer)</span><br><span class="line">  +-&gt; Reference multiple Atomic Skills</span><br><span class="line">  +-&gt; Iterator: per-frame/per-event traversal deep drill</span><br><span class="line">  +-&gt; Conditional: data-driven branching</span><br><span class="line"></span><br><span class="line">Atomic Skills (execution layer)</span><br><span class="line">  +-&gt; Directly execute SQL, return DataEnvelope</span><br><span class="line"></span><br><span class="line">Pipeline Skills (knowledge layer)</span><br><span class="line">  +-&gt; Rendering pipeline teaching + detection</span><br><span class="line"></span><br><span class="line">Deep Skills (profiling layer)</span><br><span class="line">  +-&gt; Callstack / CPU profiling deep analysis</span><br></pre></td></tr></table></figure><p><strong>Agent’s typical invocation path (scrolling analysis example):</strong></p><figure class="highlight cpp"><table><tr><td class="gutter"><pre><span class="line">1</span><br><span class="line">2</span><br><span class="line">3</span><br><span class="line">4</span><br><span class="line">5</span><br><span class="line">6</span><br></pre></td><td class="code"><pre><span class="line"><span class="built_in">invoke_skill</span>(<span class="string">&quot;scrolling_analysis&quot;</span>)          &lt;- Composite, internally calls multiple Atomic</span><br><span class="line">  -&gt; consumer_jank_detection                 &lt;- Atomic, detect frame drops</span><br><span class="line">  -&gt; per-frame iterator -&gt; jank_frame_detail &lt;- Composite, deep drill per frame</span><br><span class="line">    -&gt; main_thread_states_in_range           &lt;- Atomic</span><br><span class="line">    -&gt; binder_blocking_in_range              &lt;- Atomic</span><br><span class="line">    -&gt; frame_blocking_calls                  &lt;- Atomic</span><br></pre></td></tr></table></figure><hr><p><em>(Continuously updated; new questions will be added as received)</em></p>]]></content>
    
    
    <summary type="html">&lt;h1 id=&quot;SmartPerfetto-Architecture-Q-amp-A&quot;&gt;&lt;a href=&quot;#SmartPerfetto-Architecture-Q-amp-A&quot; class=&quot;headerlink&quot; title=&quot;SmartPerfetto Architecture Q&amp;amp;A&quot;&gt;&lt;/a&gt;SmartPerfetto Architecture Q&amp;amp;A&lt;/h1&gt;&lt;blockquote&gt;
&lt;p&gt;This article collects technical questions received after publishing &lt;a href=&quot;/2026/04/10/SmartPerfetto-Architecture-Deep-Dive/&quot;&gt;From Trace to Insight: Harness Engineering in SmartPerfetto AI Agent&lt;/a&gt; and discusses them in Q&amp;amp;A format.&lt;/p&gt;
&lt;/blockquote&gt;</summary>


    <category term="Android" scheme="https://androidperformance.com/en/categories/Android/"/>
    
    
    <category term="Android" scheme="https://androidperformance.com/en/tags/Android/"/>
    
    <category term="Perfetto" scheme="https://androidperformance.com/en/tags/Perfetto/"/>
    
    <category term="Performance" scheme="https://androidperformance.com/en/tags/Performance/"/>
    
    <category term="AI Agent" scheme="https://androidperformance.com/en/tags/AI-Agent/"/>
    
    <category term="SmartPerfetto" scheme="https://androidperformance.com/en/tags/SmartPerfetto/"/>
    
    <category term="MCP" scheme="https://androidperformance.com/en/tags/MCP/"/>
    
  </entry>
  
  <entry>
    <title>From Trace to Insight: Harness Engineering in SmartPerfetto AI Agent</title>
    <link href="https://androidperformance.com/en/2026/04/10/SmartPerfetto-Architecture-Deep-Dive/"/>
    <id>https://androidperformance.com/en/2026/04/10/SmartPerfetto-Architecture-Deep-Dive/</id>
    <published>2026-04-10T02:00:00.000Z</published>
    <updated>2026-05-10T23:29:51.062Z</updated>
    
    <content type="html"><![CDATA[<h1 id="From-Trace-to-Insight-Harness-Engineering-in-SmartPerfetto-AI-Agent"><a href="#From-Trace-to-Insight-Harness-Engineering-in-SmartPerfetto-AI-Agent" class="headerlink" title="From Trace to Insight: Harness Engineering in SmartPerfetto AI Agent"></a>From Trace to Insight: Harness Engineering in SmartPerfetto AI Agent</h1><p><img src="/en/images/smartperfetto-cover.png" alt="SmartPerfetto Cover"></p><blockquote><p>This article documents the key technical decisions made while building SmartPerfetto from scratch – why certain approaches were chosen over others, where pitfalls were encountered, and how the design was adjusted afterward.</p></blockquote><span id="more"></span><h2 id="Why-Build-This-Tool"><a href="#Why-Build-This-Tool" class="headerlink" title="Why Build This Tool"></a>Why Build This Tool</h2><p>I have spent years working on Android performance optimization. A significant portion of my daily work involves analyzing Perfetto traces – Perfetto is Google’s open-source system-level tracing tool that captures frame rendering, thread scheduling, CPU frequency, Binder IPC, and other data, making it essentially the standard tool for Android performance analysis. Its trace_processor engine loads traces into an embedded SQLite database, enabling SQL-based queries.</p><p>The trace analysis process is highly repetitive: locate the problem interval, inspect frame data, examine thread states, trace the blocking chain, and correlate system metrics. The steps are similar each time, but the details differ for every trace. This pattern of “fixed workflow, varying details” is well-suited for an AI Agent – automate the data collection and initial attribution within the fixed workflow, while humans make the final judgments and confirmations.</p><p>SmartPerfetto is the product of this experiment. It adds an AI analysis panel on top of the Perfetto UI, where users ask questions in natural language (e.g., “analyze scrolling performance”), and a Claude Agent uses MCP (Model Context Protocol, Anthropic’s tool-calling protocol) behind the scenes to execute SQL queries via trace_processor, autonomously completing multiple rounds of data collection and analysis.</p><p>The purpose of this article is to document the engineering decisions and lessons learned during the construction process. From the initial “just call the API directly” approach to the current system with up to 20 MCP tools (9 always-on + 11 conditionally injected) + 164 YAML Skills + a three-layer verification system, every design choice was driven by concrete counterexamples – approaches that were tried and failed before being replaced. These hard-won lessons can be directly applied by engineers building AI Agent applications or Android performance tools.</p><h2 id="Opening-Two-Analysis-Paths-for-the-Same-Trace"><a href="#Opening-Two-Analysis-Paths-for-the-Same-Trace" class="headerlink" title="Opening: Two Analysis Paths for the Same Trace"></a>Opening: Two Analysis Paths for the Same Trace</h2><p>A scrolling trace from a 120Hz device, where the user reports occasional stuttering during list scrolling. Opening it in Perfetto reveals 18 dropped frames during the inertial scrolling phase, with 3 Full-severity frames (~60ms, where the per-frame budget on a 120Hz device is 8.33ms).</p><blockquote><p><strong>Jank (Dropped Frames):</strong> Perfetto’s frame_timeline track records the rendering duration of each frame. Exceeding the VSync period (8.33ms at 120Hz) results in user-perceptible stuttering. The <code>jank_type</code> field distinguishes jank types: App-side timeouts, SurfaceFlinger composition delays, Buffer Stuffing (BufferQueue backpressure), etc.</p></blockquote><p><strong>Path A: Manual Analysis</strong></p><figure class="highlight plaintext"><table><tr><td class="gutter"><pre><span class="line">1</span><br><span class="line">2</span><br><span class="line">3</span><br><span class="line">4</span><br><span class="line">5</span><br><span class="line">6</span><br><span class="line">7</span><br><span class="line">8</span><br><span class="line">9</span><br><span class="line">10</span><br></pre></td><td class="code"><pre><span class="line">1. Open Perfetto UI, drag the timeline to locate the scrolling interval</span><br><span class="line">2. Expand the frame_timeline track, inspect each frame that exceeds the VSync period</span><br><span class="line">3. 18 dropped frames -- expand each one, examine thread_state slices to see what the main thread was doing</span><br><span class="line">4. Frame 1: Sleeping, manually check waker_utid -&gt; system_server (the core Android system process hosting AMS/WMS and other system services) Binder response was slow</span><br><span class="line">   Frame 2: Running, but stuck in Choreographer#doFrame -&gt; RecyclerView onBind is too heavy</span><br><span class="line">   Frame 3: Sleeping + Running alternating -&gt; dequeueBuffer waiting for SurfaceFlinger composition</span><br><span class="line">   ... (15 more frames to check one by one)</span><br><span class="line">5. Correlate with CPU frequency tracks to check for thermal throttling or governor frequency ramp-up delays</span><br><span class="line">6. Check for GC pauses, Lock contention, Binder timeouts</span><br><span class="line">7. Aggregate evidence and organize conclusions</span><br></pre></td></tr></table></figure><blockquote><p><strong>thread_state</strong> records a thread’s scheduling state (Running &#x2F; Runnable &#x2F; Sleeping &#x2F; Uninterruptible Sleep, etc.). Different states point to different investigation directions – Runnable typically indicates CPU scheduling issues, while Sleeping typically indicates waiting&#x2F;blocking issues. The <code>waker_utid</code> field records the source thread ID that woke up the thread, helping trace cross-process blocking chains.</p></blockquote><p>Steps 3-4 represent the bulk of the work – 18 dropped frames, each requiring expanding thread_state, tracing the blocking cause, and correlating CPU scheduling. The analysis process is serial, frame by frame: the drill-down path may differ for each frame (Binder? Lock? GC? IO?), and all must be examined before drawing conclusions.</p><p><strong>Path B: SmartPerfetto Agent</strong></p><p>The user inputs <code>&quot;analyze scrolling performance&quot;</code>, and the following shows the Agent’s actual operations (from session log <code>session_agent-1774679540422</code>):</p><figure class="highlight cpp"><table><tr><td class="gutter"><pre><span class="line">1</span><br><span class="line">2</span><br><span class="line">3</span><br><span class="line">4</span><br><span class="line">5</span><br><span class="line">6</span><br><span class="line">7</span><br><span class="line">8</span><br><span class="line">9</span><br><span class="line">10</span><br><span class="line">11</span><br><span class="line">12</span><br><span class="line">13</span><br><span class="line">14</span><br><span class="line">15</span><br><span class="line">16</span><br><span class="line">17</span><br><span class="line">18</span><br><span class="line">19</span><br><span class="line">20</span><br><span class="line">21</span><br><span class="line">22</span><br><span class="line">23</span><br><span class="line">24</span><br><span class="line">25</span><br></pre></td><td class="code"><pre><span class="line"><span class="built_in">classifyScene</span>(<span class="string">&quot;analyze scrolling performance&quot;</span>) -&gt; <span class="built_in">scrolling</span>  (&lt;<span class="number">1</span>ms, keyword matching)</span><br><span class="line"><span class="built_in">buildSystemPrompt</span>() -&gt; <span class="number">4500</span> <span class="built_in">tokens</span> (scrolling.strategy.md injected)</span><br><span class="line"></span><br><span class="line"><span class="built_in">submit_plan</span>(&#123;</span><br><span class="line">  phases: [<span class="string">&quot;p0: architecture + time range&quot;</span>, <span class="string">&quot;p1: scrolling overview + jank list&quot;</span>,</span><br><span class="line">           <span class="string">&quot;p1_9: root cause deep drill&quot;</span>, <span class="string">&quot;p3: comprehensive conclusion&quot;</span>],</span><br><span class="line">  successCriteria: <span class="string">&quot;WHY chain &gt;= 2 levels, actionable optimization suggestions&quot;</span></span><br><span class="line">&#125;)</span><br><span class="line"></span><br><span class="line"><span class="built_in">invoke_skill</span>(<span class="string">&quot;scrolling_analysis&quot;</span>, &#123;process_name: <span class="string">&quot;com.example...&quot;</span>&#125;)</span><br><span class="line">  -&gt; All <span class="number">18</span> dropped frames extracted, each with:</span><br><span class="line">    - Duration, jank_type, <span class="built_in">reason_code</span> (App/SF/GPU)</span><br><span class="line">    - <span class="function">Main thread state <span class="title">distribution</span> <span class="params">(Running/Sleeping/IO)</span></span></span><br><span class="line"><span class="function">    - Top-3 blocking functions</span></span><br><span class="line"><span class="function">  -&gt; ArtifactStore: art_1 (~<span class="number">440</span> tokens reference)</span></span><br><span class="line"><span class="function"></span></span><br><span class="line"><span class="function">fetch_artifact(<span class="string">&quot;art_1&quot;</span>, <span class="string">&quot;rows&quot;</span>, <span class="number">0</span>, <span class="number">18</span>)  -&gt; Retrieve structured data for all <span class="number">18</span> frames</span></span><br><span class="line"><span class="function">invoke_skill(<span class="string">&quot;frame_blocking_calls&quot;</span>, &#123;</span>frame_ids: [<span class="number">3</span>, <span class="number">7</span>, <span class="number">12</span>]&#125;)</span><br><span class="line">  -&gt; Blocking chains <span class="keyword">for</span> <span class="number">3</span> representative frames: dequeueBuffer / Binder / <span class="function">GC</span></span><br><span class="line"><span class="function"><span class="title">lookup_knowledge</span><span class="params">(<span class="string">&quot;rendering-pipeline&quot;</span>)</span>  -&gt; Load rendering pipeline reference material</span></span><br><span class="line"><span class="function"></span></span><br><span class="line"><span class="function">Output conclusion:</span></span><br><span class="line"><span class="function">  [HIGH] <span class="number">18</span> jank frames during inertial scrolling, <span class="number">3</span> Full-severity ~<span class="number">60</span>ms drops</span></span><br><span class="line"><span class="function">  [MEDIUM] <span class="number">14</span> Buffer Stuffing frames (App finished rendering on time, but BufferQueue was full causing presentation delay)</span></span><br><span class="line"><span class="function">  [MEDIUM] Vulkan Shader first-frame compilation + CPU cold frequency (<span class="number">18.66</span>ms, <span class="number">2.2</span>x over budget)</span></span><br></pre></td></tr></table></figure><p><strong>Metrics snapshot</strong> (from <code>logs/metrics/</code>): 16 tool calls, 0 failures, SQL average 652ms.</p><p>The following diagram shows the request lifecycle of a complete analysis – every step from user input to final conclusion:</p><p><img src="/en/images/smartperfetto-data-flow.png" alt="Request Lifecycle"></p><p>Both paths follow the same analysis steps – query frame data -&gt; locate jank -&gt; trace blocking chains -&gt; correlate system state -&gt; synthesize conclusions.</p><p>The difference is: manual analysis processes frames serially, with each frame requiring manual expansion and tracing; the Agent uses the <code>scrolling_analysis</code> Skill to batch-retrieve structured data for all 18 frames via a single SQL query, then selects representative frames for deep-drill blocking chain analysis.</p><p>The Agent’s analysis results are also rendered directly in the Perfetto UI:</p><ul><li><strong>Auto-Pin</strong>: Key frames and slices mentioned by the Agent are automatically marked on the timeline</li><li><strong>Click-to-Navigate</strong>: Timestamps and frame IDs in conclusions support click-to-navigate to the corresponding position in Perfetto</li><li><strong>Data Tables</strong>: Complete performance data for all 18 frames is rendered as sortable, filterable structured tables</li></ul><p><strong>Screenshot: SmartPerfetto frontend exists as a Perfetto plugin</strong></p><p><img src="/en/images/smartperfetto-ui-overview.png" alt="SmartPerfetto UI Overview"></p><p><strong>Screenshot: During scrolling analysis, each dropped frame is analyzed in detail – click the arrow on the left to expand</strong></p><p><img src="/en/images/smartperfetto-jank-detail.png" alt="Scrolling Analysis Jank Details"></p><p><strong>Screenshot: Scrolling analysis conclusion</strong></p><!-- 图片暂缺: 滑动分析结论截图 --><p><strong>Screenshot: Scrolling analysis conclusion, representative frame analysis</strong></p><p><img src="/en/images/smartperfetto-jank1.png" alt="Representative Frame Analysis 1"></p><p><strong>Screenshot: Scrolling analysis conclusion, representative frame analysis</strong></p><p><img src="/en/images/smartperfetto-jank2.png" alt="Representative Frame Analysis 2"></p><p><strong>Screenshot: Each analysis round has its own analysis report, with content consistent with (and more detailed than) the frontend display</strong></p><p><img src="/en/images/image-20260330001618627.png" alt="Analysis Report"></p><!-- 图片暂缺: 分析结论截图 --><p>Analysis conclusions, data tables, and the Perfetto timeline are all on the same interface. After the Agent completes batch data collection and initial attribution, engineers confirm key findings directly in the Perfetto UI.</p><blockquote><p>It should be noted that the current Agent still requires human judgment in complex edge cases (misdiagnosis issues are discussed in detail later). This article documents the engineering decision-making process behind building this Agent.</p></blockquote><hr><h2 id="Part-1-Why-Can’t-an-LLM-Directly-Analyze-a-Trace"><a href="#Part-1-Why-Can’t-an-LLM-Directly-Analyze-a-Trace" class="headerlink" title="Part 1: Why Can’t an LLM Directly Analyze a Trace?"></a>Part 1: Why Can’t an LLM Directly Analyze a Trace?</h2><p>Before discussing the architecture, a fundamental question must be answered first: why can’t we simply send trace data to an LLM and let it analyze? The answer to this question determines the starting point of SmartPerfetto’s entire architecture.</p><h3 id="Data-Scale-Traces-Don’t-Fit-in-Context"><a href="#Data-Scale-Traces-Don’t-Fit-in-Context" class="headerlink" title="Data Scale: Traces Don’t Fit in Context"></a>Data Scale: Traces Don’t Fit in Context</h3><p>The data scale of a real Perfetto trace looks like this:</p><table><thead><tr><th>Dimension</th><th>Typical Value</th></tr></thead><tbody><tr><td>Trace file size</td><td>50MB - 500MB</td></tr><tr><td>Event count</td><td>Millions to tens of millions</td></tr><tr><td>Serialized as text</td><td>Several GB</td></tr><tr><td>Claude’s maximum context</td><td>~200K tokens (approximately 150KB of text)</td></tr></tbody></table><p>The gap is several orders of magnitude. Even a relatively small 50MB trace, with its slices (function call records), counters (CPU frequency sample points), thread_state (thread scheduling states) and other data, far exceeds the LLM’s context capacity when serialized.</p><p>This means the LLM cannot possibly “see” the trace data directly. It must query on demand through tools – first use SQL to find the needed data subset (e.g., the state distribution of a specific thread within a certain time range), then analyze the query results. This constraint fundamentally dictates that SmartPerfetto must be a <strong>tool-driven</strong> Agent architecture, rather than a simple approach of feeding data into the prompt.</p><h3 id="Precise-Computation-LLMs-Are-Poor-at-Numerical-Processing"><a href="#Precise-Computation-LLMs-Are-Poor-at-Numerical-Processing" class="headerlink" title="Precise Computation: LLMs Are Poor at Numerical Processing"></a>Precise Computation: LLMs Are Poor at Numerical Processing</h3><p>The daily work of performance analysis revolves around precise numerical values: P50&#x2F;P90&#x2F;P99 percentiles of frame durations, VSync period detection (requiring median calculation of VSYNC-sf intervals and snapping to standard refresh rates), CPU utilization percentages, and time proportions of various thread states.</p><p>LLMs frequently make errors with these numerical computations. A real example: during early testing, Claude judged a 16.7ms frame duration as “normal, not exceeding VSync period” – it was using the 60Hz (16.67ms) frame budget. But this trace was captured from a 120Hz device, where the per-frame budget should be 8.33ms, making 16.7ms actually twice over budget. Such errors may seem small, but in performance analysis they lead to completely opposite conclusions.</p><p>Numerical computation must be handled by tools – SQL’s <code>AVG()</code>, <code>PERCENTILE()</code> and the predefined statistical logic in YAML Skills ensure consistent and precise results every time.</p><h3 id="Domain-Knowledge-LLMs-Know-It-but-Can’t-Apply-It"><a href="#Domain-Knowledge-LLMs-Know-It-but-Can’t-Apply-It" class="headerlink" title="Domain Knowledge: LLMs Know It but Can’t Apply It"></a>Domain Knowledge: LLMs Know It but Can’t Apply It</h3><p>The complexity of Android’s rendering pipeline exceeds many developers’ expectations. The three most common rendering paths are: the standard HWUI pipeline (HWUI is Android’s default hardware-accelerated rendering engine, where View drawing instructions are generated on the main thread, submitted to the GPU by RenderThread, and finally composited to the screen by SurfaceFlinger), Flutter’s dual-thread model (1.ui -&gt; 1.raster, bypassing RenderThread), and WebView’s Chromium pipeline (CrRendererMain thread handles rendering). Beyond these, there are also Jetpack Compose, game engines, camera pipelines, and more. SmartPerfetto’s architecture detection system currently identifies 24+ rendering pipelines, and jank analysis for different pipelines requires examining different threads and metrics – which is why architecture detection is the first step of analysis.</p><p>The root cause of stuttering may span threads (main thread blocked -&gt; cause is in RenderThread), span processes (App waiting -&gt; system_server’s WindowManagerService responds slowly), or even span hardware layers (CPU scheduled to a little core -&gt; insufficient compute power -&gt; frame timeout).</p><p>The LLM’s training data includes these concepts – it “knows” what RenderThread is, what Binder is, what SurfaceFlinger is. But when facing a specific trace, it lacks the ability to <strong>apply this knowledge in a phased, scene-specific manner</strong>. For example, when analyzing scrolling jank, one needs to first check frame-level data (which frames dropped, what type of jank), then choose different deep-drill paths based on the predominant root cause type (App-side blocking goes to blocking_chain_analysis, compositor-side delays go to SurfaceFlinger analysis). This kind of step-by-step, conditional-branching analysis workflow requires strategy injection for guidance.</p><h3 id="Reliability-Error-Rates-Are-High-in-Practice"><a href="#Reliability-Error-Rates-Are-High-in-Practice" class="headerlink" title="Reliability: Error Rates Are High in Practice"></a>Reliability: Error Rates Are High in Practice</h3><p>Even with the data access problem solved, having an LLM directly produce performance analysis conclusions still faces reliability issues. In SmartPerfetto’s actual operation, I observed several typical output problems:</p><ul><li><strong>Hallucinations</strong>: Generating data or metrics that don’t exist in the trace</li><li><strong>Omissions</strong>: Missing critical checks (e.g., not checking the impact of JIT compilation and class loading when analyzing startup performance)</li><li><strong>Shallow attribution</strong>: Stopping at “main thread busy” without further tracing whether it’s busy with futex (lock contention), binder_wait (cross-process waiting), or GC pause</li><li><strong>Inconsistent conclusions</strong>: Analyzing the same trace twice and getting different severity assessments</li></ul><p>Part 2 later in the article discusses this issue in detail – a quality audit 18 days after agentv3 went live showed that approximately 30% of Agent conclusions contained varying degrees of misjudgment.</p><h3 id="SmartPerfetto’s-Division-of-Labor"><a href="#SmartPerfetto’s-Division-of-Labor" class="headerlink" title="SmartPerfetto’s Division of Labor"></a>SmartPerfetto’s Division of Labor</h3><p>Based on these four problems, SmartPerfetto’s architecture divides responsibilities as follows:</p><figure class="highlight plaintext"><table><tr><td class="gutter"><pre><span class="line">1</span><br><span class="line">2</span><br><span class="line">3</span><br><span class="line">4</span><br><span class="line">5</span><br><span class="line">6</span><br><span class="line">7</span><br><span class="line">8</span><br><span class="line">9</span><br><span class="line">10</span><br><span class="line">11</span><br></pre></td><td class="code"><pre><span class="line">LLM (Claude) is responsible for:     Tool system is responsible for:</span><br><span class="line">|- Understanding user intent          |- Precise SQL queries (trace_processor)</span><br><span class="line">|- Formulating analysis plans         |- Numerical computation &amp; statistics (built into Skills)</span><br><span class="line">|- Reasoning about causality          |- Rendering architecture detection (24+ pipelines)</span><br><span class="line">|- Cross-domain correlation analysis  |- Layered data extraction (L1-L4)</span><br><span class="line">|- Generating structured conclusions  |- Perfetto stdlib queries</span><br><span class="line">|- Natural language interaction       |- Data summarization &amp; compression (Artifact Store)</span><br><span class="line"></span><br><span class="line">Connectivity layer: MCP Protocol -- up to 20 tools (9 always-on + 11 conditional)</span><br><span class="line">Strategy layer: 12 scene-specific strategies (.strategy.md)</span><br><span class="line">Quality layer: 3-layer verification + SQL error-correction learning</span><br></pre></td></tr></table></figure><p>The LLM handles reasoning and expression; the tools handle querying and computation. Connecting the two is MCP (Model Context Protocol, Anthropic’s tool-calling protocol) – Claude calls trace_processor to execute SQL, invokes YAML Skills for structured analysis, and queries Perfetto stdlib modules through standard MCP interfaces. Analysis results are streamed to the Perfetto UI frontend in real-time via SSE (Server-Sent Events).</p><p>The engineering infrastructure supporting this division of labor includes: scene routing (injecting different analysis strategies based on the user’s question), data compression (controlling the volume of data returned to the LLM), and quality verification (intercepting the LLM’s domain misjudgments). The following sections discuss each of these in detail.</p><p>The diagram below shows the complete system architecture, illustrating the 4 stages from user request to analysis conclusion:</p><p><img src="/en/images/smartperfetto-architecture-overview.png" alt="System Architecture Overview"></p><hr><h2 id="Part-2-From-Workflow-to-Agent"><a href="#Part-2-From-Workflow-to-Agent" class="headerlink" title="Part 2: From Workflow to Agent"></a>Part 2: From Workflow to Agent</h2><h3 id="The-Difference-Between-Workflow-and-Agent"><a href="#The-Difference-Between-Workflow-and-Agent" class="headerlink" title="The Difference Between Workflow and Agent"></a>The Difference Between Workflow and Agent</h3><p>In their December 2024 publication <a href="https://www.anthropic.com/research/building-effective-agents"><em>Building Effective Agents</em></a> (authors Erik Schluntz, Barry Zhang), Anthropic classified AI systems into two categories:</p><ul><li><strong>Workflow</strong>: LLM and tools are orchestrated through predefined code paths. What each step does and where the next step goes are all defined by the developer in advance.</li><li><strong>Agent</strong>: The LLM dynamically drives its own process and tool usage, autonomously deciding how to complete the task.</li></ul><p>The practical significance of this distinction lies in the trade-off between flexibility and controllability. Workflows provide predictability, suitable for tasks with fixed steps; Agents provide flexibility, suitable for open-ended problems that require adjusting direction based on intermediate data. Andrew Ng’s description is apt: rather than making a binary judgment about whether a system is an Agent, think of it as varying degrees of Agent-ness. SmartPerfetto’s agentv2 and agentv3 correspond to opposite ends of this spectrum.</p><h3 id="Why-Performance-Analysis-Needs-an-Agent-Not-a-Pipeline"><a href="#Why-Performance-Analysis-Needs-an-Agent-Not-a-Pipeline" class="headerlink" title="Why Performance Analysis Needs an Agent, Not a Pipeline"></a>Why Performance Analysis Needs an Agent, Not a Pipeline</h3><p>Performance analysis is not a fixed “input-in, output-out” process – it’s an exploratory reasoning process. Take a real scrolling analysis as an example:</p><figure class="highlight plaintext"><table><tr><td class="gutter"><pre><span class="line">1</span><br><span class="line">2</span><br><span class="line">3</span><br><span class="line">4</span><br><span class="line">5</span><br><span class="line">6</span><br><span class="line">7</span><br></pre></td><td class="code"><pre><span class="line">1. Start with the overview -&gt; find 47 jank frames, P90 = 23.5ms</span><br><span class="line">2. Decide direction based on overview -&gt; 40% stuck in APP phase, prioritize APP side</span><br><span class="line">3. Deep-drill representative frames -&gt; Frame #234&#x27;s RenderThread blocked by Binder for 23ms</span><br><span class="line">4. Form hypothesis -&gt; &quot;Possibly system_server&#x27;s Binder response is slow&quot;</span><br><span class="line">5. Verify hypothesis -&gt; Check Binder counterpart&#x27;s thread_state, find system_server CPU scheduling delay</span><br><span class="line">6. If hypothesis doesn&#x27;t hold -&gt; fall back, change direction (e.g., check GPU or GC instead)</span><br><span class="line">7. Synthesize all findings into a conclusion</span><br></pre></td></tr></table></figure><p>Each step’s decision depends on the previous step’s results – all steps cannot be determined before the analysis begins. A pipeline cannot handle requirements like “this trace’s problem might be in GPU or GC, and the drill-down direction needs to be dynamically chosen based on intermediate data.”</p><p>SmartPerfetto’s design is a hybrid of determinism and flexibility: known scenes (scrolling, startup, ANR, etc.) use Strategy files to constrain mandatory checks, ensuring nothing is missed; but the specific queries and drill-down directions within each phase are autonomously decided by Claude. Unmatched scenes are entirely handed over to Claude for autonomous exploration.</p><h3 id="agentv2-A-Typical-Workflow"><a href="#agentv2-A-Typical-Workflow" class="headerlink" title="agentv2: A Typical Workflow"></a>agentv2: A Typical Workflow</h3><p>agentv2 used DeepSeek as the backend, employing a Governance Pipeline architecture – orchestrated through planner &#x2F; executor &#x2F; synthesizer three-phase pipeline, essentially a predefined multi-step workflow (historical commit <code>6d80aefb</code>: “Replace the 13-step agentv2 governance pipeline with Claude-as-orchestrator”).</p><p>This architecture worked well for scrolling analysis of standard Android applications, but encountered problems with non-standard scenarios. For example, Flutter application traces don’t have standard frame_timeline data, and the pipeline would get empty results but continue executing subsequent steps, ultimately outputting conclusions based on empty data.</p><h3 id="agentv3-Migration-to-Agent-Architecture"><a href="#agentv3-Migration-to-Agent-Architecture" class="headerlink" title="agentv3: Migration to Agent Architecture"></a>agentv3: Migration to Agent Architecture</h3><p>On March 2, 2026 (commit <code>6d80aefb</code>), I switched to the Claude Agent SDK. After receiving tool definitions and strategies, Claude autonomously decides which tools to call, in what order, and what data to query.</p><p>An AI Agent typically possesses the following characteristics, with agentv3’s implementation mapped as follows:</p><table><thead><tr><th>Characteristic</th><th>Implementation in SmartPerfetto</th><th>Code Location</th></tr></thead><tbody><tr><td>Autonomy</td><td>Agent autonomously decides which tools to call and in what order</td><td><code>claudeRuntime.ts</code></td></tr><tr><td>Reasoning</td><td>REASONING_NUDGE appended after each tool call to trigger explicit reflection</td><td><code>claudeMcpServer.ts:84</code></td></tr><tr><td>Tool Use</td><td>Up to 20 MCP tool calls to trace_processor</td><td>9 always-on + 11 conditional</td></tr><tr><td>Planning</td><td>submit_plan + requirePlan() gating</td><td>Disabled in lightweight mode</td></tr><tr><td>Reflection</td><td>3-layer Verifier + Correction Prompt (max 2 rounds)</td><td><code>claudeVerifier.ts</code></td></tr><tr><td>Error Recovery</td><td>SQL error-correction learning + cross-session misdiagnosis pattern learning</td><td>Cross-file</td></tr><tr><td>Memory</td><td>Short-term: Analysis Notes &#x2F; Artifact Store; Long-term: Pattern Memory &#x2F; SQL Fix Pairs</td><td>7 layers of memory</td></tr></tbody></table><figure class="highlight plaintext"><table><tr><td class="gutter"><pre><span class="line">1</span><br><span class="line">2</span><br></pre></td><td class="code"><pre><span class="line">agentv2 (Workflow): Fixed pipeline -&gt; each step predefined -&gt; unexpected data = wrong conclusion</span><br><span class="line">agentv3 (Agent):    Dynamic plan -&gt; autonomous tool calls -&gt; unexpected data = adjust plan</span><br></pre></td></tr></table></figure><h3 id="9-Rounds-of-Review-After-Migration"><a href="#9-Rounds-of-Review-After-Migration" class="headerlink" title="9 Rounds of Review After Migration"></a>9 Rounds of Review After Migration</h3><p>From March 2 to March 20, 9 rounds of architecture review were conducted. The most impactful rounds:</p><table><thead><tr><th>Round</th><th>Date</th><th>Key Findings</th></tr></thead><tbody><tr><td>Round 1</td><td>3&#x2F;2</td><td>12 fixes after initial SDK integration – SQL knowledge base not wired into System Prompt, CPU core count hardcoded to 4 in jank_frame_detail</td></tr><tr><td>Round 3</td><td>3&#x2F;12</td><td>Architecture wiring audit – 12 instances of “implemented but not connected,” e.g., verification pipeline skipped when 0 findings</td></tr><tr><td>Round 7</td><td>3&#x2F;15</td><td>Perfetto Stdlib integration – preloaded modules 4-&gt;22, Schema Index 708-&gt;761</td></tr><tr><td>Round 9</td><td>3&#x2F;20</td><td>Production quality audit after 18 days of real traces – 3 P0 + 4 P1 + 5 P2, which catalyzed the three-layer verification system</td></tr></tbody></table><h3 id="Cold-Start-4-Layer-Cascading-Bug"><a href="#Cold-Start-4-Layer-Cascading-Bug" class="headerlink" title="Cold Start 4-Layer Cascading Bug"></a>Cold Start 4-Layer Cascading Bug</h3><p>On March 19, 2026 (commit <code>d5a1d7b3</code>), cold starts were found to be incorrectly classified as warm starts. Tracing revealed this was a cascading issue across 4 layers:</p><figure class="highlight plaintext"><table><tr><td class="gutter"><pre><span class="line">1</span><br><span class="line">2</span><br><span class="line">3</span><br><span class="line">4</span><br></pre></td><td class="code"><pre><span class="line">Layer A (Perfetto Stdlib): bindApplication&#x27;s ts is ~98ms earlier than launchingActivity -&gt; excluded by filter</span><br><span class="line">Layer B (Skill logic):      startup_events_in_range&#x27;s time filter incompatible with Layer A</span><br><span class="line">Layer C (10 downstream Skills):  Redundant startup_type filter conditions -&gt; returned 0 rows after reclassification</span><br><span class="line">Layer D (Quality gate):         startup_analysis&#x27;s filter rules and reclassification logic out of sync</span><br></pre></td></tr></table></figure><p>Fix scope: rewrote 10 downstream Skills, added 4 new startup analysis Skills. This issue demonstrates that in a Skill dependency chain, a semantic error in a single upstream field amplifies through each layer.</p><h3 id="Ghost-MCP-Query-–-Async-Lifecycle-Mismatch"><a href="#Ghost-MCP-Query-–-Async-Lifecycle-Mismatch" class="headerlink" title="Ghost MCP Query – Async Lifecycle Mismatch"></a>Ghost MCP Query – Async Lifecycle Mismatch</h3><p>Another cross-layer bug caught on April 7, 2026 (commit <code>a0ad63ba</code>): after an analysis timed out, the session had already been cleaned up and the SSE stream closed, but trace_processor’s stderr continued to emit errors like <code>no such table: cpu_frequency_counters</code> &#x2F; <code>no such column: ts</code> 90 seconds later – orphan logs with no owner attributable to any session. The two error-correction pairs from Error 4 mentioned earlier were traced back from this pile of stderr output.</p><p>The root cause was in the SDK Query’s async lifecycle:</p><figure class="highlight sql"><table><tr><td class="gutter"><pre><span class="line">1</span><br><span class="line">2</span><br><span class="line">3</span><br><span class="line">4</span><br><span class="line">5</span><br><span class="line">6</span><br></pre></td><td class="code"><pre><span class="line">Layer A (Claude Agent SDK):    SDK<span class="string">&#x27;s internal AsyncIterator still producing messages</span></span><br><span class="line"><span class="string">Layer B (claudeRuntime.ts):    Timeout triggered, break out of for-await loop</span></span><br><span class="line"><span class="string">Layer C (MCP tool queue):       SDK subprocess received no close signal,</span></span><br><span class="line"><span class="string">                                continued dispatching remaining invoke_skill / execute_sql from the queue</span></span><br><span class="line"><span class="string">Layer D (trace_processor):     Executed these &quot;ghost queries,&quot; errors returned as normal --</span></span><br><span class="line"><span class="string">                                but the session was already cleaned up, nobody listening</span></span><br></pre></td></tr></table></figure><p><code>AsyncGenerator.return()</code> and <code>break</code> only take effect on the consumer side and <strong>do not notify the producer-side external resources</strong> (SDK subprocess + MCP tool execution queue). The fix was to change the return type of <code>sdkQueryWithRetry</code> from a single AsyncIterable to a <code>&#123; stream, close &#125;</code> tuple, with <code>close()</code> explicitly called on all three paths – timeout &#x2F; exception &#x2F; finally – allowing the SDK to actively abort the subprocess:</p><figure class="highlight typescript"><table><tr><td class="gutter"><pre><span class="line">1</span><br><span class="line">2</span><br><span class="line">3</span><br><span class="line">4</span><br><span class="line">5</span><br><span class="line">6</span><br><span class="line">7</span><br><span class="line">8</span><br><span class="line">9</span><br></pre></td><td class="code"><pre><span class="line"><span class="comment">// claudeRuntime.ts</span></span><br><span class="line"><span class="keyword">const</span> &#123; stream, close &#125; = <span class="title function_">sdkQueryWithRetry</span>(&#123; ... &#125;);</span><br><span class="line"><span class="keyword">const</span> timer = <span class="built_in">setTimeout</span>(<span class="function">() =&gt;</span> &#123; <span class="title function_">close</span>(); <span class="comment">/* abort SDK subprocess */</span> &#125;, <span class="variable constant_">AGENT_TIMEOUT</span>);</span><br><span class="line"><span class="keyword">try</span> &#123;</span><br><span class="line">  <span class="keyword">for</span> <span class="keyword">await</span> (<span class="keyword">const</span> message <span class="keyword">of</span> stream) &#123; ... &#125;</span><br><span class="line">&#125; <span class="keyword">finally</span> &#123;</span><br><span class="line">  <span class="built_in">clearTimeout</span>(timer);</span><br><span class="line">  <span class="title function_">close</span>();   <span class="comment">// Safety net: close even on normal exit</span></span><br><span class="line">&#125;</span><br></pre></td></tr></table></figure><p>This bug was particularly insidious because the surface symptom (orphan SQL error logs) and the true root cause (async resource lifecycle mismatch) were far apart – the error messages looked like “Agent wrote bad SQL,” but the reality was “the Agent had long since stopped; it was the SDK subprocess that hadn’t.” In Agent applications, “breaking out of a loop” is often not as clean as one might imagine; any long-lived async resource needs an explicit close channel rather than relying on <code>for-await</code>‘s automatic cleanup.</p><hr><h2 id="Part-3-Three-Key-Engineering-Decisions"><a href="#Part-3-Three-Key-Engineering-Decisions" class="headerlink" title="Part 3: Three Key Engineering Decisions"></a>Part 3: Three Key Engineering Decisions</h2><h3 id="Decision-1-Scene-Classification-–-From-Full-Injection-to-On-Demand-Loading"><a href="#Decision-1-Scene-Classification-–-From-Full-Injection-to-On-Demand-Loading" class="headerlink" title="Decision 1: Scene Classification – From Full Injection to On-Demand Loading"></a>Decision 1: Scene Classification – From Full Injection to On-Demand Loading</h3><p>Initially, I stuffed the analysis strategies for all 12 scenes (scrolling &#x2F; startup &#x2F; ANR &#x2F; interaction &#x2F; pipeline &#x2F; game &#x2F; memory, etc.) into the System Prompt, totaling 15000+ tokens. The logic was: Claude should know all scene analysis methods so it can handle whatever the user asks.</p><p>After running in practice, Claude was found to confuse terminology across scenes – when analyzing scrolling, it referenced startup-phase metrics, mixing up VSync intervals (inter-frame timing) with bindApplication (process initialization). The root cause was that different scenes have heavily overlapping terminology: “frame” in the scrolling context means a rendering frame, while in the startup context it means the first frame display. When all 12 strategy sets are present simultaneously, the LLM cannot distinguish the context.</p><p>The solution was to implement scene classification, injecting only one strategy set at a time:</p><figure class="highlight typescript"><table><tr><td class="gutter"><pre><span class="line">1</span><br><span class="line">2</span><br><span class="line">3</span><br><span class="line">4</span><br><span class="line">5</span><br><span class="line">6</span><br><span class="line">7</span><br><span class="line">8</span><br><span class="line">9</span><br><span class="line">10</span><br><span class="line">11</span><br><span class="line">12</span><br><span class="line">13</span><br></pre></td><td class="code"><pre><span class="line"><span class="comment">// sceneClassifier.ts -- 12 scenes, &lt;1ms execution</span></span><br><span class="line"><span class="keyword">export</span> <span class="keyword">function</span> <span class="title function_">classifyScene</span>(<span class="params">query: <span class="built_in">string</span></span>): <span class="title class_">SceneType</span> &#123;</span><br><span class="line">  <span class="keyword">const</span> scenes = <span class="title function_">getRegisteredScenes</span>(); <span class="comment">// Loaded from .strategy.md frontmatter</span></span><br><span class="line">  <span class="keyword">const</span> sorted = scenes</span><br><span class="line">    .<span class="title function_">filter</span>(<span class="function"><span class="params">s</span> =&gt;</span> s.<span class="property">scene</span> !== <span class="string">&#x27;general&#x27;</span>)</span><br><span class="line">    .<span class="title function_">sort</span>(<span class="function">(<span class="params">a, b</span>) =&gt;</span> a.<span class="property">priority</span> - b.<span class="property">priority</span>); <span class="comment">// ANR(1) -&gt; startup(2) -&gt; scrolling(3)</span></span><br><span class="line"></span><br><span class="line">  <span class="keyword">for</span> (<span class="keyword">const</span> scene <span class="keyword">of</span> sorted) &#123;</span><br><span class="line">    <span class="keyword">if</span> (scene.<span class="property">compound_patterns</span>.<span class="title function_">some</span>(<span class="function"><span class="params">p</span> =&gt;</span> p.<span class="title function_">test</span>(query))) <span class="keyword">return</span> scene.<span class="property">scene</span>;</span><br><span class="line">    <span class="keyword">if</span> (scene.<span class="property">keywords</span>.<span class="title function_">some</span>(<span class="function"><span class="params">k</span> =&gt;</span> lower.<span class="title function_">includes</span>(k))) <span class="keyword">return</span> scene.<span class="property">scene</span>;</span><br><span class="line">  &#125;</span><br><span class="line">  <span class="keyword">return</span> <span class="string">&#x27;general&#x27;</span>;</span><br><span class="line">&#125;</span><br></pre></td></tr></table></figure><p>Keywords and priorities are declared in each <code>.strategy.md</code>‘s YAML frontmatter, not hardcoded in the source:</p><figure class="highlight yaml"><table><tr><td class="gutter"><pre><span class="line">1</span><br><span class="line">2</span><br><span class="line">3</span><br><span class="line">4</span><br><span class="line">5</span><br><span class="line">6</span><br><span class="line">7</span><br><span class="line">8</span><br></pre></td><td class="code"><pre><span class="line"><span class="comment"># scrolling.strategy.md</span></span><br><span class="line"><span class="meta">---</span></span><br><span class="line"><span class="attr">scene:</span> <span class="string">scrolling</span></span><br><span class="line"><span class="attr">priority:</span> <span class="number">3</span></span><br><span class="line"><span class="attr">keywords:</span> [<span class="string">滑动</span>, <span class="string">掉帧</span>, <span class="string">jank</span>, <span class="string">scroll</span>, <span class="string">fps</span>, <span class="string">帧率</span>, <span class="string">卡顿</span>]</span><br><span class="line"><span class="attr">compound_patterns:</span></span><br><span class="line">  <span class="bullet">-</span> <span class="string">&quot;(?:分析|看看|检查).*(?:滑动|滚动|列表)&quot;</span></span><br><span class="line"><span class="meta">---</span></span><br></pre></td></tr></table></figure><p>Adding a new scene only requires creating a new <code>.strategy.md</code> file. DEV mode supports hot reloading – changes take effect upon browser refresh.</p><p>After the adjustment, the System Prompt dropped from ~15000 tokens to ~4500 tokens, and the strategy confusion issue did not recur. Adding new scenes went from modifying code to simply creating a new <code>.md</code> file.</p><p>When multi-turn conversations accumulate substantial context (analysis notes, historical plans, pattern memory, etc.), the System Prompt may again exceed the 4500-token budget. At that point, lower-value paragraphs are progressively dropped by priority: SQL knowledge base references (Claude can query on demand via the <code>lookup_sql_schema</code> tool) -&gt; historical analysis experience -&gt; historical lessons learned -&gt; SQL error-correction pairs -&gt; sub-agent collaboration guidelines -&gt; historical analysis plans. Core paragraphs (role, methodology, scene strategy, output format) are never dropped.</p><h3 id="Decision-2-Artifact-Store-–-Controlling-Data-Volume-Returned-to-the-LLM"><a href="#Decision-2-Artifact-Store-–-Controlling-Data-Volume-Returned-to-the-LLM" class="headerlink" title="Decision 2: Artifact Store – Controlling Data Volume Returned to the LLM"></a>Decision 2: Artifact Store – Controlling Data Volume Returned to the LLM</h3><p>Decision 1 solved the System Prompt bloat problem. But even with only one strategy set injected, each Skill call during Agent execution still produces large amounts of data (200+ rows of frame data), and putting all of it into context creates new problems.</p><p>Early versions returned complete Skill execution results (e.g., 200 rows of frame data, 487 rows of blocking analysis) to Claude. Each Skill result was approximately 3000 tokens, and with 5-8 Skill calls per analysis, Skill data alone consumed 15000-24000 tokens.</p><p>Token cost was one concern, but a more surprising discovery was: <strong>the more data Claude received, the worse its output quality became.</strong> When faced with 200 rows of frame data, it tended toward line-by-line description (“Frame 1 took 12.3ms, Frame 2 took 15.7ms…”) rather than pattern-level summarization. I suspect the reason is that when the context is flooded with large amounts of numbers, the LLM’s attention becomes scattered.</p><p>The solution was to store Skill results in the ArtifactStore, returning only compact references (~440 tokens) to Claude – row count, column names, and summary information. When details are needed, Claude retrieves them on demand via <code>fetch_artifact</code> with pagination. Complete data is sent to the frontend for rendering through an independent SSE (Server-Sent Events) channel, bypassing the LLM entirely.</p><figure class="highlight plaintext"><table><tr><td class="gutter"><pre><span class="line">1</span><br><span class="line">2</span><br><span class="line">3</span><br><span class="line">4</span><br><span class="line">5</span><br><span class="line">6</span><br><span class="line">7</span><br><span class="line">8</span><br></pre></td><td class="code"><pre><span class="line">invoke_skill(&quot;scrolling_analysis&quot;) execution result:</span><br><span class="line">  |-- Frontend: Full DataEnvelope (200 rows) -&gt; SSE -&gt; UI table rendering</span><br><span class="line">  |         (DataEnvelope: self-describing data contract, containing column names, types, interaction actions.</span><br><span class="line">  |          The frontend automatically renders tables/charts based on the schema,</span><br><span class="line">  |          no need to write code for each Skill)</span><br><span class="line">  |-- Claude: Compact reference (~440 tokens)</span><br><span class="line">              &quot;scrolling_analysis complete. Summary: 347 frames, jank rate 10.6%</span><br><span class="line">               art_1 (details: fetch_artifact(&#x27;art_1&#x27;, &#x27;rows&#x27;, 0, 20))&quot;</span><br></pre></td></tr></table></figure><p><strong>Three granularity levels for fetch_artifact:</strong></p><table><thead><tr><th>Level</th><th>Returns</th><th>Approx. Tokens</th></tr></thead><tbody><tr><td><code>summary</code></td><td>Row count + column names + first row sample</td><td>~50</td></tr><tr><td><code>rows</code></td><td>Paginated data (offset&#x2F;limit)</td><td>~200-500</td></tr><tr><td><code>full</code></td><td>Complete raw data</td><td>~3000</td></tr></tbody></table><p>After the adjustment, each Skill’s token cost dropped from ~3000 to ~440, and 8 Skills went from ~24000 to ~3520 tokens. Claude’s output shifted from line-by-line description to pattern-level summarization, while the frontend still received complete data for table rendering.</p><!-- TODO: 贴真实截图 --><!-- 截图 5: Artifact Store 效果对比 — 左: Claude 收到的紧凑引用文本, 右: 前端渲染的完整数据表格 --><h3 id="Decision-3-Three-Layer-Verification-–-Lessons-from-Real-Misjudgments"><a href="#Decision-3-Three-Layer-Verification-–-Lessons-from-Real-Misjudgments" class="headerlink" title="Decision 3: Three-Layer Verification – Lessons from Real Misjudgments"></a>Decision 3: Three-Layer Verification – Lessons from Real Misjudgments</h3><p>18 days after agentv3 went live, I conducted a systematic quality audit (March 20, 2026, commit <code>da63eaf9</code>). The statistics were surprising: approximately 30% of Agent conclusions contained varying degrees of misjudgment.</p><p>The following are actual misjudgment cases encountered:</p><figure class="highlight plaintext"><table><tr><td class="gutter"><pre><span class="line">1</span><br><span class="line">2</span><br><span class="line">3</span><br><span class="line">4</span><br><span class="line">5</span><br><span class="line">6</span><br><span class="line">7</span><br><span class="line">8</span><br><span class="line">9</span><br><span class="line">10</span><br><span class="line">11</span><br><span class="line">12</span><br><span class="line">13</span><br><span class="line">14</span><br><span class="line">15</span><br><span class="line">16</span><br><span class="line">17</span><br><span class="line">18</span><br><span class="line">19</span><br></pre></td><td class="code"><pre><span class="line">[Case 1] Agent marked VSync alignment offset as CRITICAL</span><br><span class="line">Reality: Modern high-refresh-rate devices (90Hz/120Hz/144Hz) inherently have</span><br><span class="line">non-perfectly-fixed VSync intervals, with normal micro-offsets (on the order of +/-0.5ms).</span><br><span class="line">The Agent treated this normal offset as an anomaly.</span><br><span class="line"></span><br><span class="line">[Case 2] Agent counted Buffer Stuffing frames in the jank statistics</span><br><span class="line">Reality: Buffer Stuffing indicates the App finished rendering on time, but the</span><br><span class="line">BufferQueue was full, causing producer-side backpressure. This is not an App logic</span><br><span class="line">problem and should not be directly counted as App-side jank.</span><br><span class="line">SmartPerfetto handles this through dual-signal detection: excluded by default, but</span><br><span class="line">still counted as perceived jank if the actual presentation interval &gt; 1.5x VSync.</span><br><span class="line"></span><br><span class="line">[Case 3] Agent marked a single-frame duration anomaly as CRITICAL</span><br><span class="line">Reality: An isolated single-frame anomaly does not constitute a pattern and needs</span><br><span class="line">confirmation of whether it recurs.</span><br><span class="line"></span><br><span class="line">[Case 4] Agent marked main thread Sleeping at 35% (469ms) as MEDIUM</span><br><span class="line">Reality: In the context of total startup duration, 469ms of main thread sleeping is</span><br><span class="line">already a high proportion and should be marked as HIGH.</span><br></pre></td></tr></table></figure><p>These misjudgments share a common characteristic: they are not logic errors, but <strong>gaps in domain expertise</strong>. VSync micro-offsets on high-refresh-rate devices being normal, Buffer Stuffing delays occurring at the pipeline queue level rather than in App logic, single-frame anomalies not constituting a pattern – these judgments depend on deep understanding of Android’s graphics stack, which Claude’s training data covers insufficiently.</p><p>Recognizing this, I established a three-layer progressive verification system:</p><figure class="highlight plaintext"><table><tr><td class="gutter"><pre><span class="line">1</span><br><span class="line">2</span><br><span class="line">3</span><br><span class="line">4</span><br><span class="line">5</span><br><span class="line">6</span><br><span class="line">7</span><br><span class="line">8</span><br><span class="line">9</span><br><span class="line">10</span><br><span class="line">11</span><br></pre></td><td class="code"><pre><span class="line">Layer 1: Heuristic checks (no LLM calls)</span><br><span class="line">  -- Regex matching of known misdiagnosis patterns (VSync offset marked CRITICAL,</span><br><span class="line">     Buffer Stuffing counted as jank, single frame marked CRITICAL)</span><br><span class="line"></span><br><span class="line">Layer 2: Plan compliance checks (no LLM calls)</span><br><span class="line">  -- Cross-reference against submit_plan steps, checking whether the conclusion</span><br><span class="line">     covers all planned phases</span><br><span class="line"></span><br><span class="line">Layer 3: Independent model review (using Haiku)</span><br><span class="line">  -- Use a different model to check whether each finding has data evidence support</span><br><span class="line">     and whether the causal chain is complete</span><br></pre></td></tr></table></figure><p>When verification finds severe issues, a Correction Prompt is generated for Claude to revise its conclusion (up to 2 rounds).</p><p><strong>Cross-session learning:</strong> Confirmed misdiagnosis patterns are persisted to <code>logs/learned_misdiagnosis_patterns.json</code> and automatically injected into the System Prompt for subsequent analyses. For example, the system learned:</p><figure class="highlight json"><table><tr><td class="gutter"><pre><span class="line">1</span><br><span class="line">2</span><br><span class="line">3</span><br><span class="line">4</span><br><span class="line">5</span><br><span class="line">6</span><br></pre></td><td class="code"><pre><span class="line"><span class="punctuation">&#123;</span></span><br><span class="line">  <span class="attr">&quot;keywords&quot;</span><span class="punctuation">:</span> <span class="punctuation">[</span><span class="string">&quot;R008&quot;</span><span class="punctuation">,</span> <span class="string">&quot;TTID&quot;</span><span class="punctuation">,</span> <span class="string">&quot;exceeded&quot;</span><span class="punctuation">,</span> <span class="string">&quot;LOW&quot;</span><span class="punctuation">]</span><span class="punctuation">,</span></span><br><span class="line">  <span class="attr">&quot;message&quot;</span><span class="punctuation">:</span> <span class="string">&quot;TTID exceedance marked as LOW, but TTID(1912ms) exceeded dur_ms(1338ms) by 43%,</span></span><br><span class="line"><span class="string">              should be marked as MEDIUM or higher&quot;</span><span class="punctuation">,</span></span><br><span class="line">  <span class="attr">&quot;occurrences&quot;</span><span class="punctuation">:</span> <span class="number">1</span></span><br><span class="line"><span class="punctuation">&#125;</span></span><br></pre></td></tr></table></figure><blockquote><p>Note: Learned misdiagnosis patterns do not take effect immediately. The code requires <code>occurrences &gt;= 2</code> before entering the active pattern set – the first recording is just a marker, and the same pattern is only injected into subsequent analyses’ System Prompt when it appears a second time, preventing isolated events from causing over-correction.</p></blockquote><hr><h2 id="Part-4-Why-Not-Use-a-Standard-Skill-System"><a href="#Part-4-Why-Not-Use-a-Standard-Skill-System" class="headerlink" title="Part 4: Why Not Use a Standard Skill System?"></a>Part 4: Why Not Use a Standard Skill System?</h2><h3 id="The-Design-Choice-from-SOP-to-YAML-Skills"><a href="#The-Design-Choice-from-SOP-to-YAML-Skills" class="headerlink" title="The Design Choice from SOP to YAML Skills"></a>The Design Choice from SOP to YAML Skills</h3><p>Performance analysis teams typically have their own SOPs (Standard Operating Procedures): how to investigate scrolling jank, how to analyze slow startups, how to diagnose ANR. SOPs are usually documents or checklists – experienced engineers follow them, new team members learn from them.</p><p>Anthropic’s Claude Code has a Skills system, essentially parameterized Prompt templates – inject context and submit to the Agent for execution. A natural idea is to write performance analysis SOPs as such Prompt templates and have Claude execute them according to the SOP.</p><p>I initially went down this path. The Prompt given to Claude was: “Query the frame_timeline table, find jank frames, analyze the main thread’s state distribution during jank frames.”</p><p>Claude understood the intent without issue, but the SQL it generated was different each time. Sometimes the JOIN path was correct (<code>slice -&gt; thread_track -&gt; thread</code>), other times it wrote <code>slice.utid</code> directly – a column that doesn’t exist. The result format was also inconsistent, sometimes 3 columns, sometimes 5, making frontend rendering impossible.</p><p>The reason is simple: SOPs are written for humans. An engineer seeing “query frame_timeline” knows exactly what SQL to write. The LLM’s understanding of Perfetto’s SQL schema is incomplete (these schemas have limited coverage in training data), and each translation from SOP text to SQL introduces variance.</p><p>SmartPerfetto’s YAML Skills took a different approach – not Prompt templates, but declarative SQL execution units:</p><figure class="highlight yaml"><table><tr><td class="gutter"><pre><span class="line">1</span><br><span class="line">2</span><br><span class="line">3</span><br><span class="line">4</span><br><span class="line">5</span><br><span class="line">6</span><br><span class="line">7</span><br><span class="line">8</span><br><span class="line">9</span><br><span class="line">10</span><br><span class="line">11</span><br><span class="line">12</span><br><span class="line">13</span><br><span class="line">14</span><br><span class="line">15</span><br><span class="line">16</span><br><span class="line">17</span><br><span class="line">18</span><br></pre></td><td class="code"><pre><span class="line"><span class="comment"># YAML Skill: SQL predefined, result format fixed</span></span><br><span class="line"><span class="attr">steps:</span></span><br><span class="line">  <span class="bullet">-</span> <span class="attr">id:</span> <span class="string">thread_state_distribution</span></span><br><span class="line">    <span class="attr">type:</span> <span class="string">atomic</span></span><br><span class="line">    <span class="attr">sql:</span> <span class="string">|</span></span><br><span class="line"><span class="string">      SELECT state, SUM(dur) as total_dur,</span></span><br><span class="line"><span class="string">             ROUND(SUM(dur) * 100.0 / SUM(SUM(dur)) OVER(), 2) as pct</span></span><br><span class="line"><span class="string">      FROM thread_state ts</span></span><br><span class="line"><span class="string">      JOIN thread_track tt ON ts.track_id = tt.id</span></span><br><span class="line"><span class="string">      WHERE tt.utid = $&#123;main_thread_utid&#125;</span></span><br><span class="line"><span class="string">        AND ts.ts BETWEEN $&#123;frame_start&#125; AND $&#123;frame_end&#125;</span></span><br><span class="line"><span class="string">      GROUP BY state ORDER BY total_dur DESC</span></span><br><span class="line"><span class="string"></span>    <span class="attr">display:</span></span><br><span class="line">      <span class="attr">level:</span> <span class="string">detail</span></span><br><span class="line">      <span class="attr">columns:</span></span><br><span class="line">        <span class="bullet">-</span> &#123; <span class="attr">name:</span> <span class="string">state</span>, <span class="attr">type:</span> <span class="string">string</span> &#125;</span><br><span class="line">        <span class="bullet">-</span> &#123; <span class="attr">name:</span> <span class="string">total_dur</span>, <span class="attr">type:</span> <span class="string">duration</span> &#125;</span><br><span class="line">        <span class="bullet">-</span> &#123; <span class="attr">name:</span> <span class="string">pct</span>, <span class="attr">type:</span> <span class="string">percentage</span> &#125;</span><br></pre></td></tr></table></figure><p>The core difference between the two approaches is “who writes the SQL.” Prompt templates have the LLM dynamically generate SQL each time, producing unpredictable result formats that can’t be regression-tested; YAML Skills predefine SQL and output schema, execute after parameter substitution, with fixed result formats that enable stable regression testing and frontend rendering.</p><table><thead><tr><th>Dimension</th><th>Prompt Template (SOP-style)</th><th>YAML Skill (Declarative Execution)</th></tr></thead><tbody><tr><td>SQL source</td><td>LLM generates dynamically each time</td><td>Predefined in YAML, parameter substitution</td></tr><tr><td>Result format</td><td>May differ each time</td><td>Fixed column names and types</td></tr><tr><td>Regression testable</td><td>Not supported</td><td>All 6 trace regression tests pass</td></tr><tr><td>Frontend rendering</td><td>Requires parsing free text</td><td>Schema-driven tables&#x2F;charts</td></tr><tr><td>Composable</td><td>Not supported</td><td>Composite skills call atomic skills</td></tr><tr><td>Vendor adaptation</td><td>Requires different Prompts</td><td><code>.override.yaml</code> overrides SQL</td></tr></tbody></table><p>The final division of labor: Claude is responsible for understanding intent, selecting Skills, and reasoning about attribution; YAML Skills are responsible for precise SQL queries and structured output. Claude invokes Skills via <code>invoke_skill</code>, Skills return structured data, and Claude makes judgments based on the data.</p><h3 id="Why-Not-Expose-Each-Skill-as-an-Independent-MCP-Tool"><a href="#Why-Not-Expose-Each-Skill-as-an-Independent-MCP-Tool" class="headerlink" title="Why Not Expose Each Skill as an Independent MCP Tool?"></a>Why Not Expose Each Skill as an Independent MCP Tool?</h3><p>A natural question: why not directly register all 87 atomic analysis capabilities as 87 MCP Tools and let Claude call them directly?</p><p>Trying this in practice reveals a problem: the MCP tool list grows linearly with the number of tools. 87 tools means every API call must include descriptions (name, parameter schema, usage instructions) for all 87 tools in the request, and this fixed overhead consumes significant tokens. More importantly, when Claude faces 87 tools, its selection accuracy degrades – with too many tools, it doesn’t know which one to use.</p><p>SmartPerfetto’s design gives Claude only 2 Skill-related MCP Tools:</p><ul><li><code>invoke_skill(skillId, params)</code> – Execute a specified Skill</li><li><code>list_skills(category?)</code> – Query available Skills by scene category</li></ul><p>Capabilities are discovered on demand via <code>list_skills(category=&quot;scrolling&quot;)</code>, then invoked with <code>invoke_skill</code>. <strong>2 MCP Tools encapsulate 160+ analysis capabilities, and the tool list’s token overhead is fixed.</strong></p><p>Another benefit is that the YAML format lowers the contribution barrier. If a performance analysis expert has experience with a particular analysis scenario, they can directly write a YAML Skill defining SQL queries and output formats, without needing to know TypeScript or modify backend code. Changes take effect in development mode upon browser refresh (hot reloading), with iteration cycles measured in seconds.</p><h3 id="Skill-System-Structure"><a href="#Skill-System-Structure" class="headerlink" title="Skill System Structure"></a>Skill System Structure</h3><p>The Skill count grew from a dozen in the early project to 164 now. The growth was not driven by “as many as possible,” but by continuously encountering new scenarios that needed coverage in analysis practice – initially there was only frame analysis for standard HWUI, then Flutter applications required specialized Skills, then vendor differences required overrides, then startup analysis needed independent detection logic for JIT, class loading, and Binder pool respectively.</p><p>The current Skill distribution by type:</p><table><thead><tr><th>Type</th><th>Count</th><th>Location</th><th>Description</th></tr></thead><tbody><tr><td><strong>Atomic</strong></td><td>87</td><td><code>skills/atomic/</code></td><td>Single detection capabilities (VSync period, CPU topology, GPU frequency, GC events, etc.)</td></tr><tr><td><strong>Composite</strong></td><td>29</td><td><code>skills/composite/</code></td><td>Multi-step combined analyses (e.g., scrolling_analysis orchestrates multiple atomic Skills)</td></tr><tr><td><strong>Pipeline</strong></td><td>28</td><td><code>skills/pipelines/</code></td><td>Rendering pipeline detection + teaching (24+ Android rendering architecture identification)</td></tr><tr><td><strong>Module</strong></td><td>18</td><td><code>skills/modules/</code></td><td>Module-categorized analyses (app &#x2F; framework &#x2F; hardware &#x2F; kernel)</td></tr><tr><td><strong>Deep</strong></td><td>2</td><td><code>skills/deep/</code></td><td>Deep analysis (CPU profiling, callstack analysis)</td></tr></tbody></table><p>Additionally, <code>skills/vendors/</code> contains <code>.override.yaml</code> for 8 vendors (Pixel &#x2F; Samsung &#x2F; Xiaomi &#x2F; Honor &#x2F; OPPO &#x2F; Vivo &#x2F; Qualcomm &#x2F; MTK), overriding vendor-specific SQL in generic Skills.</p><h3 id="Layered-Results"><a href="#Layered-Results" class="headerlink" title="Layered Results"></a>Layered Results</h3><p>Early Skill output was flat – a Skill returned one large table, with 200 rows of frame data mixed together. Users would see all the data at once upon opening, with no sense of hierarchy. In practice, engineers’ reading habits follow a pattern: first look at the summary (what’s the jank rate, what’s P90), then decide whether to expand the details, then deep-drill into specific frames.</p><p>Now Skill output is organized by layer, with progressive frontend rendering:</p><figure class="highlight plaintext"><table><tr><td class="gutter"><pre><span class="line">1</span><br><span class="line">2</span><br><span class="line">3</span><br><span class="line">4</span><br><span class="line">5</span><br><span class="line">6</span><br><span class="line">7</span><br><span class="line">8</span><br><span class="line">9</span><br><span class="line">10</span><br><span class="line">11</span><br></pre></td><td class="code"><pre><span class="line">summary  -- &quot;47 jank frames, P90=23.5ms, SEVERE accounts for 12%&quot;</span><br><span class="line">  |            Aggregate metrics, quick overview</span><br><span class="line">  v</span><br><span class="line">key      -- Key data (most important metrics and findings)</span><br><span class="line">  |            Highlighted display</span><br><span class="line">  v</span><br><span class="line">detail   -- Complete data list (frame_id, duration, jank_type)</span><br><span class="line">  |            Expandable data table</span><br><span class="line">  v</span><br><span class="line">hidden   -- Supporting data (intermediate calculation results, collapsed by default)</span><br><span class="line">               Expand on demand</span><br></pre></td></tr></table></figure><p>Each Skill step declares its display layer via <code>display.level</code> (the most frequently used in practice are <code>detail</code> – 240 occurrences, <code>key</code> – 170 occurrences, <code>summary</code> – 81 occurrences). The frontend automatically renders tables and charts based on column types (<code>timestamp</code>, <code>duration</code>, <code>percentage</code>, <code>bytes</code>, etc.) and interaction actions (<code>navigate_timeline</code> to jump to the trace position, <code>navigate_range</code> to select a time range, <code>copy</code> to copy data) from the <code>DataEnvelope</code> – adding a new Skill requires no additional frontend code. This is key to how 164 Skills coexist while frontend code volume remains manageable.</p><h3 id="Step-Types"><a href="#Step-Types" class="headerlink" title="Step Types"></a>Step Types</h3><p>Initially, all Skills had only one step type: execute a single SQL query. Later, scenarios requiring composition of multiple Skills arose (e.g., scrolling_analysis needs to first query frame data, then perform blocking analysis on each jank frame), as well as scenarios requiring iteration over data rows (per-frame diagnosis), leading to gradual expansion of step types:</p><table><thead><tr><th>Step Type</th><th>Description</th><th>Usage Frequency</th></tr></thead><tbody><tr><td><code>atomic</code></td><td>Single SQL query, the most basic step type</td><td>Most common</td></tr><tr><td><code>skill</code></td><td>References another Skill’s result, for reusing existing capabilities in composite analysis</td><td>56 occurrences</td></tr><tr><td><code>iterator</code></td><td>Iterates over data rows, executing sub-queries for each row</td><td>Used in 5 composite Skills</td></tr><tr><td><code>diagnostic</code></td><td>Diagnostic step, generating structured diagnostic conclusions</td><td>38 occurrences</td></tr><tr><td><code>parallel</code></td><td>Execute multiple steps in parallel (code supports it, not yet used in Skills)</td><td>0</td></tr><tr><td><code>conditional</code></td><td>Branch selection based on conditions (code supports it, not yet used in Skills)</td><td>0</td></tr></tbody></table><p><code>iterator</code> is the core of per-frame analysis – for example, for the 8 most severe out of 18 jank frames, execute blocking_chain_analysis on each one individually, analyzing the blocking cause for each frame independently. <code>parallel</code> and <code>conditional</code> are defined in the type system but not yet used by any Skill – this is because current analysis scenarios are already covered by <code>skill</code> references + <code>iterator</code> traversal. When more complex scenarios are introduced (such as multi-path parallel data collection), these will come into play.</p><h3 id="Domain-Skill-Examples"><a href="#Domain-Skill-Examples" class="headerlink" title="Domain Skill Examples"></a>Domain Skill Examples</h3><p>The following examples illustrate why so many specialized Skills are needed – each Skill addresses a specific problem that a generic approach can’t handle.</p><h4 id="Consumer-Jank-Detection-–-Framework-Labels-x3D-User-Perception"><a href="#Consumer-Jank-Detection-–-Framework-Labels-x3D-User-Perception" class="headerlink" title="Consumer Jank Detection – Framework Labels !&#x3D; User Perception"></a>Consumer Jank Detection – Framework Labels !&#x3D; User Perception</h4><p>The framework’s <code>jank_type</code> label does not equal user-perceived frame drops. Hidden Jank exists – the framework marks <code>jank_type=&#39;None&#39;</code> but the user perceives stuttering. The reason is a discrepancy between the framework’s judgment criteria and the user’s actual perception.</p><p>SmartPerfetto uses an independent <code>consumer_jank_detection</code> Skill for jank determination: it estimates the actual VSync period via the median of VSYNC-sf intervals, then uses 1.5x the VSync period as the threshold, judging whether jank occurred based on the present_ts difference between adjacent frames (the timestamp when a frame is actually displayed on screen). It does not rely on framework labels.</p><h4 id="Blocking-Chain-Analysis-–-Cross-Thread-Cross-Process-Root-Cause-Tracing"><a href="#Blocking-Chain-Analysis-–-Cross-Thread-Cross-Process-Root-Cause-Tracing" class="headerlink" title="Blocking Chain Analysis – Cross-Thread, Cross-Process Root Cause Tracing"></a>Blocking Chain Analysis – Cross-Thread, Cross-Process Root Cause Tracing</h4><p>The root cause of a single dropped frame may involve a multi-layer causal chain:</p><figure class="highlight plaintext"><table><tr><td class="gutter"><pre><span class="line">1</span><br><span class="line">2</span><br><span class="line">3</span><br><span class="line">4</span><br><span class="line">5</span><br></pre></td><td class="code"><pre><span class="line">Frame 42 took 62ms (budget 8.33ms)</span><br><span class="line">  |-&gt; Main thread blocked for 35ms</span><br><span class="line">      |-&gt; Blocked on futex_wait (lock contention)</span><br><span class="line">          |-&gt; Lock holder is a Binder thread</span><br><span class="line">              |-&gt; Binder thread waiting for system_server response</span><br></pre></td></tr></table></figure><p>The <code>blocking_chain_analysis</code> Skill provides key evidence for this chain via 3 SQL steps: main thread state distribution (Running &#x2F; Sleeping &#x2F; IO proportions) -&gt; waker tracing (finding who woke the main thread via waker_utid) -&gt; blocking function aggregation (cumulative time for futex &#x2F; binder_wait &#x2F; io_schedule). This kind of cross-layer analysis is very difficult to implement stably by having Claude write SQL on its own with generic prompts.</p><h4 id="Flutter-Architecture-Branching-–-Different-Rendering-Modes-Require-Different-Analysis-Logic"><a href="#Flutter-Architecture-Branching-–-Different-Rendering-Modes-Require-Different-Analysis-Logic" class="headerlink" title="Flutter Architecture Branching – Different Rendering Modes Require Different Analysis Logic"></a>Flutter Architecture Branching – Different Rendering Modes Require Different Analysis Logic</h4><p>Flutter’s two rendering modes involve different threads, requiring examination of different targets during analysis:</p><table><thead><tr><th>Mode</th><th>Jank Analysis Target Threads</th><th align="center">Goes Through Host RenderThread</th></tr></thead><tbody><tr><td><strong>TextureView</strong> (dual pipeline)</td><td>1.ui + 1.raster + RenderThread</td><td align="center">Yes</td></tr><tr><td><strong>SurfaceView</strong> (single pipeline)</td><td>1.ui + 1.raster</td><td align="center">No</td></tr></tbody></table><p>If standard HWUI analysis logic is used to analyze a Flutter SurfaceView application, 1.raster thread’s duration would be incorrectly attributed to RenderThread. SmartPerfetto automatically identifies Flutter applications through architecture detection (24+ rendering pipelines) and switches to the dedicated <code>flutter_scrolling_analysis</code> Skill.</p><p>But “automatically identifying Flutter” itself also hit a snag (commit <code>355df8ee</code>, 4&#x2F;6). The early pipeline detector scored each architecture independently, with the highest score winning – as a result, Flutter TextureView traces were frequently misclassified as STANDARD. The reason was that Flutter TextureView’s host side still goes through the HWUI pipeline (<code>Choreographer#doFrame</code> &#x2F; <code>DrawFrame</code> &#x2F; <code>RenderThread</code>), and these signals were absorbed by both the STANDARD and TEXTUREVIEW classifiers. STANDARD had broader signal coverage (traces almost always contain Choreographer frames), so its total score often exceeded the specialized TEXTUREVIEW, misclassifying Flutter apps as STANDARD. The same problem occurred with WeChat Skyline (absorbed by WEBVIEW) and game engines (absorbed by STANDARD&#x2F;MIXED).</p><p>The fix was not to adjust weights, but to add <code>exclude_if</code> to specialized pipelines: once TEXTUREVIEW detects Flutter <code>1.ui</code> &#x2F; <code>1.raster</code> signals, it directly blocks the STANDARD classification; STANDARD_LEGACY&#x2F;MIXED&#x2F;SURFACEVIEW_BLAST block each other upon detecting Game Engine signals; OPENGL_ES blocks upon detecting WebView&#x2F;Game signals. <strong>24+ pipelines cannot score independently – they need a “specialized -&gt; generic” priority chain.</strong> This is a classic example of “once you have many pipelines, you must implement mutual exclusion” – and it’s why, after the Skill count grew to 160+, simply “routing to the correct Skill” itself became an independent engineering problem.</p><h4 id="Vendor-Overrides-–-Same-Metric-Has-Different-Field-Names-on-Different-Platforms"><a href="#Vendor-Overrides-–-Same-Metric-Has-Different-Field-Names-on-Different-Platforms" class="headerlink" title="Vendor Overrides – Same Metric Has Different Field Names on Different Platforms"></a>Vendor Overrides – Same Metric Has Different Field Names on Different Platforms</h4><p>In traces from Qualcomm, MediaTek, and Google Tensor, the same metric has different field names (e.g., GPU frequency is called <code>gpufreq</code> on Qualcomm but might be <code>gpu_freq_khz</code> on MediaTek). <code>.override.yaml</code> lets the same Skill automatically adapt its SQL across different platforms, without needing to write independent Skills for each vendor.</p><hr><h2 id="Part-5-SQL-Engineering"><a href="#Part-5-SQL-Engineering" class="headerlink" title="Part 5: SQL Engineering"></a>Part 5: SQL Engineering</h2><p>The Skill system discussed above ultimately comes down to SQL queries – each Skill step executes predefined SQL. SQL is SmartPerfetto’s core – all performance data retrieval ultimately goes through SQL queries to trace_processor. This section expands on several engineering aspects at the SQL level: query pattern design, official stdlib reuse, Schema indexing, result compression, and error-correction learning.</p><h3 id="SQL-Query-Patterns-Time-Interval-JOINs-and-Recursive-Bucketing"><a href="#SQL-Query-Patterns-Time-Interval-JOINs-and-Recursive-Bucketing" class="headerlink" title="SQL Query Patterns: Time Interval JOINs and Recursive Bucketing"></a>SQL Query Patterns: Time Interval JOINs and Recursive Bucketing</h3><p>Perfetto trace data is essentially a stream of events with timestamps and durations. The most common operation in performance analysis is <strong>determining whether two events overlap in time</strong> – for example, whether the main thread was blocked by a Binder call during a frame’s rendering.</p><p>The core SQL pattern heavily used in YAML Skills is the <strong>time interval JOIN</strong> – determining whether two events overlap in time. The following SQL’s business meaning is: for each jank frame, find the blocking calls (such as GC, Binder, locks) that occurred simultaneously during the frame’s rendering, and calculate how many milliseconds they overlapped:</p><figure class="highlight sql"><table><tr><td class="gutter"><pre><span class="line">1</span><br><span class="line">2</span><br><span class="line">3</span><br><span class="line">4</span><br><span class="line">5</span><br><span class="line">6</span><br><span class="line">7</span><br><span class="line">8</span><br><span class="line">9</span><br><span class="line">10</span><br><span class="line">11</span><br></pre></td><td class="code"><pre><span class="line"><span class="comment">-- Business meaning: Time overlap analysis between jank frames and blocking calls</span></span><br><span class="line"><span class="keyword">SELECT</span></span><br><span class="line">  jf.frame_id,</span><br><span class="line">  b.name <span class="keyword">as</span> blocking_call,</span><br><span class="line">  <span class="comment">-- Calculate precise overlap duration (nanosecond precision)</span></span><br><span class="line">  ROUND((<span class="built_in">MIN</span>(b.ts <span class="operator">+</span> b.dur, jf.ts <span class="operator">+</span> jf.dur) <span class="operator">-</span> <span class="built_in">MAX</span>(b.ts, jf.ts)) <span class="operator">/</span> <span class="number">1e6</span>, <span class="number">2</span>) <span class="keyword">as</span> overlap_ms</span><br><span class="line"><span class="keyword">FROM</span> jank_frames jf</span><br><span class="line"><span class="keyword">JOIN</span> blocking_calls b</span><br><span class="line">  <span class="keyword">ON</span> b.ts <span class="operator">&lt;</span> jf.ts <span class="operator">+</span> jf.dur       <span class="comment">-- Blocking call starts before frame ends</span></span><br><span class="line">  <span class="keyword">AND</span> b.ts <span class="operator">+</span> b.dur <span class="operator">&gt;</span> jf.ts       <span class="comment">-- Blocking call ends after frame starts</span></span><br><span class="line"><span class="keyword">HAVING</span> overlap_ms <span class="operator">&gt;</span> <span class="number">0.5</span>           <span class="comment">-- Filter out micro-overlaps under 0.5ms</span></span><br></pre></td></tr></table></figure><blockquote><p>The <code>MIN(end1, end2) - MAX(start1, start2)</code> here is the standard formula for calculating overlap length between two intervals. In Perfetto traces, timestamps are nanosecond-precise, and this interval JOIN achieves 0.001ms granularity.</p></blockquote><p>Another common pattern is <strong>recursive CTE for time bucketing</strong>. For example, analyzing the distribution of big-core vs. little-core CPU usage during the startup process:</p><figure class="highlight sql"><table><tr><td class="gutter"><pre><span class="line">1</span><br><span class="line">2</span><br><span class="line">3</span><br><span class="line">4</span><br><span class="line">5</span><br><span class="line">6</span><br><span class="line">7</span><br><span class="line">8</span><br><span class="line">9</span><br><span class="line">10</span><br><span class="line">11</span><br><span class="line">12</span><br><span class="line">13</span><br><span class="line">14</span><br><span class="line">15</span><br><span class="line">16</span><br><span class="line">17</span><br></pre></td><td class="code"><pre><span class="line"><span class="comment">-- Recursively generate time buckets (max 30, preventing runaway recursion)</span></span><br><span class="line"><span class="keyword">WITH</span> <span class="keyword">RECURSIVE</span> buckets <span class="keyword">AS</span> (</span><br><span class="line">  <span class="keyword">SELECT</span> <span class="number">0</span> <span class="keyword">as</span> idx, $&#123;start_ts&#125; <span class="keyword">as</span> bucket_start,</span><br><span class="line">         <span class="built_in">MIN</span>($&#123;start_ts&#125; <span class="operator">+</span> bucket_ns, $&#123;end_ts&#125;) <span class="keyword">as</span> bucket_end</span><br><span class="line">  <span class="keyword">UNION</span> <span class="keyword">ALL</span></span><br><span class="line">  <span class="keyword">SELECT</span> idx <span class="operator">+</span> <span class="number">1</span>, bucket_end, <span class="built_in">MIN</span>(bucket_end <span class="operator">+</span> bucket_ns, $&#123;end_ts&#125;)</span><br><span class="line">  <span class="keyword">FROM</span> buckets <span class="keyword">WHERE</span> bucket_end <span class="operator">&lt;</span> $&#123;end_ts&#125; <span class="keyword">AND</span> idx <span class="operator">&lt;</span> <span class="number">29</span></span><br><span class="line">)</span><br><span class="line"><span class="comment">-- Within each time bucket, aggregate scheduling time for big cores vs. little cores</span></span><br><span class="line"><span class="keyword">SELECT</span></span><br><span class="line">  ROUND(<span class="built_in">SUM</span>(<span class="keyword">CASE</span> <span class="keyword">WHEN</span> core_type <span class="keyword">IN</span> (<span class="string">&#x27;prime&#x27;</span>,<span class="string">&#x27;big&#x27;</span>,<span class="string">&#x27;medium&#x27;</span>)</span><br><span class="line">    <span class="keyword">THEN</span> overlap_dur <span class="keyword">ELSE</span> <span class="number">0</span> <span class="keyword">END</span>) <span class="operator">/</span> <span class="number">1e6</span>, <span class="number">2</span>) <span class="keyword">as</span> big_core_ms,</span><br><span class="line">  ROUND(<span class="built_in">SUM</span>(<span class="keyword">CASE</span> <span class="keyword">WHEN</span> core_type <span class="operator">=</span> <span class="string">&#x27;little&#x27;</span></span><br><span class="line">    <span class="keyword">THEN</span> overlap_dur <span class="keyword">ELSE</span> <span class="number">0</span> <span class="keyword">END</span>) <span class="operator">/</span> <span class="number">1e6</span>, <span class="number">2</span>) <span class="keyword">as</span> little_core_ms</span><br><span class="line"><span class="keyword">FROM</span> buckets b</span><br><span class="line"><span class="keyword">LEFT</span> <span class="keyword">JOIN</span> main_thread_sched ms <span class="keyword">ON</span> ms.ts <span class="operator">&lt;</span> b.bucket_end <span class="keyword">AND</span> ms.ts <span class="operator">+</span> ms.dur <span class="operator">&gt;</span> b.bucket_start</span><br><span class="line"><span class="keyword">GROUP</span> <span class="keyword">BY</span> b.idx</span><br></pre></td></tr></table></figure><blockquote><p><code>_cpu_topology</code> is a view provided by the Perfetto stdlib that classifies CPU cores as prime &#x2F; big &#x2F; medium &#x2F; little. The recursive CTE limits to a maximum of 30 buckets to prevent runaway recursion on extremely long traces.</p></blockquote><p>These SQL patterns are encapsulated in YAML Skills, accepting parameters via <code>$&#123;param|default&#125;</code> syntax. Claude doesn’t need to write these complex time interval JOINs itself – it calls <code>invoke_skill</code> with the time range and process name, and the Skill handles executing the predefined SQL and returning structured results.</p><h3 id="Perfetto-Stdlib-Reuse"><a href="#Perfetto-Stdlib-Reuse" class="headerlink" title="Perfetto Stdlib Reuse"></a>Perfetto Stdlib Reuse</h3><p>Perfetto officially maintains a SQL standard library (stdlib) that provides numerous predefined views and functions. For example, the <code>android_frames</code> view encapsulates multi-table join logic for frame rendering data, and the <code>_android_critical_blocking_calls</code> internal table aggregates critical blocking calls. Using these official abstractions directly is far more stable than hand-writing SQL from base tables.</p><p>SmartPerfetto’s stdlib integration went through several iterations – one rollback even completely reversed the “direction of optimization”:</p><ul><li><p><strong>Initial phase:</strong> Only 4 stdlib modules were preloaded (android.frames.timeline, android.binder, android.startup.startups, android.input), with most Skills’ SQL querying base tables directly. The advantage was fast startup; the downside was Skills everywhere hand-writing multi-table JOINs.</p></li><li><p><strong>Round 7 (3&#x2F;15):</strong> Expanded the preload set to 22 modules, including <code>linux.cpu.utilization</code>, <code>android.garbage_collection</code>, <code>android.oom_adjuster</code>, <code>slices.with_context</code>, covering CPU&#x2F;GC&#x2F;OOM&#x2F;slice and other commonly used dimensions. The logic at the time was: batch <code>INCLUDE</code> all commonly used stdlib modules at trace load time, zero overhead for subsequent Skill queries.</p></li><li><p><strong>Rollback to lazy loading (4&#x2F;1, commit <code>0afeb60f</code>):</strong> The eager preload of 22 modules failed in production – on 200MB+ large traces, concurrent <code>INCLUDE</code> of 22 modules at startup simultaneously occupied trace_processor_shell’s RPC connection, triggering <code>socket hang up</code>. <strong>The root cause is that trace_processor_shell is a single-threaded SQLite engine, least suited for concurrent INCLUDE – a “batch schema mutation” workload.</strong> The final fix was to pull back eager preload, keeping only 3 Tier-0 modules, and switching to lazy + serial loading on first query + max 3 retries:</p><figure class="highlight typescript"><table><tr><td class="gutter"><pre><span class="line">1</span><br><span class="line">2</span><br><span class="line">3</span><br><span class="line">4</span><br><span class="line">5</span><br><span class="line">6</span><br><span class="line">7</span><br></pre></td><td class="code"><pre><span class="line"><span class="comment">// workingTraceProcessor.ts</span></span><br><span class="line"><span class="comment">// Tier 0: absolute minimum stdlib modules needed for any analysis to start.</span></span><br><span class="line"><span class="keyword">const</span> <span class="variable constant_">CRITICAL_STDLIB_MODULES</span> = [</span><br><span class="line">  <span class="string">&#x27;android.frames.timeline&#x27;</span>,    <span class="comment">// 19 skills reference -- frame/jank foundation</span></span><br><span class="line">  <span class="string">&#x27;android.startup.startups&#x27;</span>,   <span class="comment">// 16 skills reference -- startup foundation</span></span><br><span class="line">  <span class="string">&#x27;android.binder&#x27;</span>,             <span class="comment">// 22 skills reference -- IPC/blocking foundation</span></span><br><span class="line">];</span><br></pre></td></tr></table></figure><p>These 3 were selected by “skill reference count” as the highest-frequency dependencies. Other stdlib modules are now declared on-demand via Skill YAML’s <code>prerequisites</code> section or explicit <code>INCLUDE PERFETTO MODULE</code> in SQL when first used.</p></li><li><p><strong>On-demand discovery:</strong> <code>perfettoStdlibScanner.ts</code> scans the Perfetto source directory to automatically discover all available modules, exposed through the <code>list_stdlib_modules</code> MCP tool for Claude to <code>INCLUDE</code> non-preloaded modules on demand.</p></li></ul><figure class="highlight typescript"><table><tr><td class="gutter"><pre><span class="line">1</span><br><span class="line">2</span><br><span class="line">3</span><br><span class="line">4</span><br><span class="line">5</span><br></pre></td><td class="code"><pre><span class="line"><span class="comment">// perfettoStdlibScanner.ts -- scans perfetto/src/trace_processor/perfetto_sql/stdlib/</span></span><br><span class="line"><span class="keyword">function</span> <span class="title function_">scanDirectory</span>(<span class="params">dir: <span class="built_in">string</span>, prefix: <span class="built_in">string</span></span>): <span class="built_in">string</span>[] &#123;</span><br><span class="line">  <span class="comment">// Recursively scan .sql files, convert to module path format (e.g., &quot;android.frames&quot;)</span></span><br><span class="line">  <span class="comment">// Exclude prelude directory (these are auto-loaded and don&#x27;t need manual INCLUDE)</span></span><br><span class="line">&#125;</span><br></pre></td></tr></table></figure><p>The lesson from this rollback is the same type as the earlier “more data makes Claude’s output worse” – <strong>“preparing all potentially needed resources at system startup” is the intuitively optimal but practically worst strategy.</strong> Whether it’s context for the LLM or stdlib for trace_processor, start lazy + load on demand, and only consider prewarming when a real performance bottleneck appears – this is almost always the more stable choice.</p><p>A separate lesson: using the stdlib’s <code>android_garbage_collection_events</code> view is far more stable than manually JOINing <code>slice</code> + <code>thread</code> + <code>process</code> tables to query GC events – because GC event slice names vary across Android versions (<code>concurrent mark sweep</code> vs <code>young concurrent copying</code> vs <code>HeapTaskDaemon</code>), and the stdlib has already handled these compatibility issues. But stdlib views have their own pitfalls (column name prefixes, modules not auto-loaded), which are expanded upon in the SQL error-correction section below.</p><h3 id="SQL-Schema-Index-Letting-Claude-Know-What-Tables-Are-Available"><a href="#SQL-Schema-Index-Letting-Claude-Know-What-Tables-Are-Available" class="headerlink" title="SQL Schema Index: Letting Claude Know What Tables Are Available"></a>SQL Schema Index: Letting Claude Know What Tables Are Available</h3><p>Perfetto trace_processor contains hundreds of tables and views, plus stdlib modules – Claude cannot possibly remember them all. The <code>lookup_sql_schema</code> MCP tool provides a search interface for Claude to look up relevant tables, views, and function definitions by keyword.</p><p>Under the hood is an index file automatically generated from the Perfetto source code (<code>perfettoSqlIndex.light.json</code>), containing <strong>761 templates</strong>, each recording the name, category, type (table&#x2F;view&#x2F;function), column definitions, and parameters.</p><p>Queries use tokenized matching + score-based ranking:</p><ul><li>Name&#x2F;category&#x2F;description containing the full search term -&gt; high score</li><li>Multi-word queries match by token separately -&gt; &gt;&#x3D; 50% token match required to count as relevant</li><li>Underscore-separated table name segments support prefix matching (“frame_time” matches “frame_timeline_slice”)</li><li>Returns top 30 results</li></ul><p>Combined with <code>sqlKnowledgeBase.ts</code>‘s intent mapping, bilingual queries are also supported: user input of “jank” maps to search terms like <code>[&#39;jank&#39;, &#39;frame&#39;, &#39;dropped&#39;]</code>, and input of “startup” maps to <code>[&#39;android_startups&#39;, &#39;launch&#39;, &#39;time_to_display&#39;]</code>. When multiple intents match simultaneously, scores are additive – for example, querying “startup frame jank” triggers both the startup and jank intents simultaneously, giving the highest scores to templates matching their intersection.</p><h3 id="SQL-Result-Compression"><a href="#SQL-Result-Compression" class="headerlink" title="SQL Result Compression"></a>SQL Result Compression</h3><p>When Claude queries directly via <code>execute_sql</code>, it can pass a <code>summary=true</code> parameter to trigger result compression. The compression logic is implemented in <code>sqlSummarizer.ts</code>:</p><p><strong>Numeric columns:</strong> Compute min, max, avg, and percentiles (P50 &#x2F; P90 &#x2F; P95 &#x2F; P99), letting Claude understand the data distribution without seeing raw rows.</p><p><strong>String columns:</strong> Count the top 5 values and their occurrence frequencies, providing the data’s category distribution.</p><p><strong>Sample row selection:</strong> Select 10 representative sample rows from the complete result. The selection strategy is: if the data contains performance-related columns like <code>dur</code>, <code>latency</code>, <code>jank</code>, <code>count</code>, sort descending by that column and take the top 10 (the most severe data is usually most analytically valuable); if there’s no clear performance metric column, use evenly-spaced sampling.</p><figure class="highlight sql"><table><tr><td class="gutter"><pre><span class="line">1</span><br><span class="line">2</span><br><span class="line">3</span><br><span class="line">4</span><br><span class="line">5</span><br><span class="line">6</span><br><span class="line">7</span><br><span class="line">8</span><br><span class="line">9</span><br><span class="line">10</span><br><span class="line">11</span><br><span class="line">12</span><br><span class="line">13</span><br><span class="line">14</span><br><span class="line">15</span><br><span class="line">16</span><br><span class="line">17</span><br></pre></td><td class="code"><pre><span class="line"><span class="comment">-- 200 raw result rows (~3000 tokens) compressed to:</span></span><br><span class="line">&#123;</span><br><span class="line">  &quot;totalRows&quot;: <span class="number">200</span>,</span><br><span class="line">  &quot;columnStats&quot;: [</span><br><span class="line">    &#123; &quot;column&quot;: &quot;dur_ms&quot;, &quot;type&quot;: &quot;numeric&quot;,</span><br><span class="line">      &quot;min&quot;: <span class="number">2.1</span>, &quot;max&quot;: <span class="number">67.3</span>, &quot;avg&quot;: <span class="number">12.8</span>,</span><br><span class="line">      &quot;p50&quot;: <span class="number">9.2</span>, &quot;p90&quot;: <span class="number">23.5</span>, &quot;p95&quot;: <span class="number">35.1</span>, &quot;p99&quot;: <span class="number">62.0</span> &#125;,</span><br><span class="line">    &#123; &quot;column&quot;: &quot;jank_type&quot;, &quot;type&quot;: &quot;string&quot;,</span><br><span class="line">      &quot;topValues&quot;: [</span><br><span class="line">        &#123; &quot;value&quot;: &quot;App Deadline Missed&quot;, &quot;count&quot;: <span class="number">87</span> &#125;,</span><br><span class="line">        &#123; &quot;value&quot;: &quot;Buffer Stuffing&quot;, &quot;count&quot;: <span class="number">45</span> &#125;,</span><br><span class="line">        &#123; &quot;value&quot;: &quot;None&quot;, &quot;count&quot;: <span class="number">68</span> &#125;</span><br><span class="line">      ] &#125;</span><br><span class="line">  ],</span><br><span class="line">  &quot;sampleRows&quot;: [ <span class="comment">/* 10 rows of most severe frame data */</span> ]</span><br><span class="line">&#125;</span><br><span class="line"><span class="operator">/</span><span class="operator">/</span> <span class="operator">~</span><span class="number">500</span> tokens, <span class="operator">~</span><span class="number">85</span><span class="operator">%</span> compression ratio</span><br></pre></td></tr></table></figure><p>This works in conjunction with the Artifact Store mentioned earlier – the Artifact Store compresses Skill results (data returned by invoke_skill), while the SQL Summarizer compresses results when Claude executes SQL directly. Together, two layers of compression cover both paths through which the Agent obtains data.</p><h3 id="SQL-Error-Correction-Learning"><a href="#SQL-Error-Correction-Learning" class="headerlink" title="SQL Error-Correction Learning"></a>SQL Error-Correction Learning</h3><p>Claude is not fully familiar with Perfetto’s SQL schema and writes incorrect queries. The following are typical errors actually recorded (from <code>logs/sql_learning/error_fix_pairs.json</code>):</p><p><strong>Error 1: JOINed on a non-existent column</strong></p><p>Perfetto’s <code>slice</code> table has no direct <code>utid</code> column. To associate slice with thread, the intermediate table <code>thread_track</code> is needed: <code>slice.track_id -&gt; thread_track.id -&gt; thread_track.utid -&gt; thread.utid</code>.</p><figure class="highlight sql"><table><tr><td class="gutter"><pre><span class="line">1</span><br><span class="line">2</span><br><span class="line">3</span><br><span class="line">4</span><br><span class="line">5</span><br><span class="line">6</span><br><span class="line">7</span><br><span class="line">8</span><br></pre></td><td class="code"><pre><span class="line"><span class="comment">-- Error: no such column: s.utid</span></span><br><span class="line"><span class="keyword">SELECT</span> s.ts, s.name <span class="keyword">FROM</span> slice s</span><br><span class="line"><span class="keyword">JOIN</span> thread t <span class="keyword">ON</span> s.utid <span class="operator">=</span> t.utid</span><br><span class="line"></span><br><span class="line"><span class="comment">-- Fix: go through the thread_track intermediate table</span></span><br><span class="line"><span class="keyword">SELECT</span> s.ts, s.name <span class="keyword">FROM</span> slice s</span><br><span class="line"><span class="keyword">JOIN</span> thread_track tt <span class="keyword">ON</span> s.track_id <span class="operator">=</span> tt.id</span><br><span class="line"><span class="keyword">JOIN</span> thread t <span class="keyword">ON</span> tt.utid <span class="operator">=</span> t.utid</span><br></pre></td></tr></table></figure><p><strong>Error 2: Ambiguous column names</strong></p><figure class="highlight sql"><table><tr><td class="gutter"><pre><span class="line">1</span><br><span class="line">2</span><br><span class="line">3</span><br><span class="line">4</span><br><span class="line">5</span><br></pre></td><td class="code"><pre><span class="line"><span class="comment">-- Error: ambiguous column name: name (both slice and process have a name column)</span></span><br><span class="line"><span class="keyword">SELECT</span> name, ts <span class="keyword">FROM</span> slice s <span class="keyword">JOIN</span> process p <span class="keyword">ON</span> ...</span><br><span class="line"></span><br><span class="line"><span class="comment">-- Fix: add table name prefix</span></span><br><span class="line"><span class="keyword">SELECT</span> s.name, s.ts <span class="keyword">FROM</span> slice s <span class="keyword">JOIN</span> process p <span class="keyword">ON</span> ...</span><br></pre></td></tr></table></figure><p><strong>Error 3: Incorrect understanding of the counter table’s data model</strong></p><p>Perfetto’s <code>counter</code> table stores sample points (timestamp + value), not interval data, and has no <code>dur</code> column.</p><figure class="highlight sql"><table><tr><td class="gutter"><pre><span class="line">1</span><br><span class="line">2</span><br><span class="line">3</span><br><span class="line">4</span><br><span class="line">5</span><br></pre></td><td class="code"><pre><span class="line"><span class="comment">-- Error: no such column: c.dur</span></span><br><span class="line"><span class="keyword">SELECT</span> <span class="built_in">SUM</span>(c.value <span class="operator">*</span> c.dur) <span class="keyword">FROM</span> counter c</span><br><span class="line"></span><br><span class="line"><span class="comment">-- Fix: use simple average or LEAD window function</span></span><br><span class="line"><span class="keyword">SELECT</span> <span class="built_in">AVG</span>(c.value) <span class="keyword">FROM</span> counter c <span class="keyword">WHERE</span> ...</span><br></pre></td></tr></table></figure><p><strong>Error 4: stdlib table name &#x2F; column name pitfalls</strong></p><p>Both of these were added in commit <code>05922e67</code> – the discovery source was “orphan stderr with no owner”: the analysis had long since ended, but trace_processor was still spewing error logs. Tracing back revealed that the Agent was repeatedly hitting the same pitfalls in dynamic SQL.</p><figure class="highlight sql"><table><tr><td class="gutter"><pre><span class="line">1</span><br><span class="line">2</span><br><span class="line">3</span><br><span class="line">4</span><br><span class="line">5</span><br><span class="line">6</span><br><span class="line">7</span><br><span class="line">8</span><br><span class="line">9</span><br><span class="line">10</span><br><span class="line">11</span><br><span class="line">12</span><br><span class="line">13</span><br><span class="line">14</span><br><span class="line">15</span><br></pre></td><td class="code"><pre><span class="line"><span class="comment">-- Error 4a: no such table: cpu_frequency_counters</span></span><br><span class="line"><span class="comment">-- This is a stdlib table, not in the 3 lazy-preloaded Tier-0 modules</span></span><br><span class="line"><span class="keyword">SELECT</span> ts, cpu, freq <span class="keyword">FROM</span> cpu_frequency_counters <span class="keyword">WHERE</span> ...</span><br><span class="line"></span><br><span class="line"><span class="comment">-- Fix: INCLUDE the module first, then query</span></span><br><span class="line">INCLUDE PERFETTO <span class="keyword">MODULE</span> linux.cpu.frequency;</span><br><span class="line"><span class="keyword">SELECT</span> ts, cpu, freq <span class="keyword">FROM</span> cpu_frequency_counters <span class="keyword">WHERE</span> ...</span><br><span class="line"></span><br><span class="line"><span class="comment">-- Error 4b: no such column: ts</span></span><br><span class="line"><span class="comment">-- android_garbage_collection_events uses gc_-prefixed column names, not the conventional ts/dur</span></span><br><span class="line"><span class="keyword">SELECT</span> ts<span class="operator">/</span><span class="number">1e6</span>, dur<span class="operator">/</span><span class="number">1e6</span> <span class="keyword">FROM</span> android_garbage_collection_events</span><br><span class="line"></span><br><span class="line"><span class="comment">-- Fix: use gc_ts / gc_dur / gc_running_dur / gc_runnable_dur</span></span><br><span class="line"><span class="keyword">SELECT</span> gc_ts<span class="operator">/</span><span class="number">1e6</span>, gc_dur<span class="operator">/</span><span class="number">1e6</span>, gc_running_dur<span class="operator">/</span><span class="number">1e6</span></span><br><span class="line"><span class="keyword">FROM</span> android_garbage_collection_events</span><br></pre></td></tr></table></figure><p>Stdlib view authors often use domain-prefixed column names to avoid <code>ambiguous column</code> issues during multi-table JOINs, but Claude defaults to assuming conventional names like <code>ts/dur</code>. This “stdlib’s own naming conventions vs. general SQL conventions” conflict can’t be fully solved automatically through schema introspection – the <code>lookup_sql_schema</code> tool can tell Claude the table exists and what columns it has, but it can’t predict “this time Claude will definitely assume <code>ts</code>.” The only fallback is accumulating error-correction pairs.</p><p>The detection and learning mechanism for these errors works as follows: when SQL execution fails, the error message and SQL are temporarily stored; when a subsequent SQL execution succeeds, the system uses Jaccard similarity matching (excluding SQL structural keywords like SELECT&#x2F;FROM&#x2F;WHERE, and Perfetto common tokens like utid&#x2F;dur&#x2F;slice) to determine whether it’s a corrected version of the same query. The matching threshold is &gt;30%, with a 60-second time window. A successful match generates an error-&gt;fix pair that is persisted to disk.</p><p>When a new analysis begins, the 10 most recent error-correction pairs are loaded into the System Prompt, so Claude can see these known pitfalls before writing SQL. Error-correction pairs have a 30-day TTL and are automatically cleaned up upon expiration – Perfetto’s SQL schema changes with version updates.</p><hr><h2 id="Part-6-The-Evolution-of-the-Development-Process-Itself"><a href="#Part-6-The-Evolution-of-the-Development-Process-Itself" class="headerlink" title="Part 6: The Evolution of the Development Process Itself"></a>Part 6: The Evolution of the Development Process Itself</h2><p>This final section steps slightly outside the product itself to discuss the development process. SmartPerfetto was built with AI-assisted development – from the first line of code to now, Claude Code has been the primary programming tool. Looking back over these three months, the way I use AI-assisted development has itself gone through several iterations, with logic similar to SmartPerfetto’s evolution from agentv2 to agentv3.</p><h3 id="Stages-of-AI-Assisted-Development"><a href="#Stages-of-AI-Assisted-Development" class="headerlink" title="Stages of AI-Assisted Development"></a>Stages of AI-Assisted Development</h3><p>First, a brief explanation of the tools and concepts involved:</p><ul><li><strong>Claude Code</strong>: Anthropic’s CLI tool that enables terminal conversations with Claude, where Claude can directly read&#x2F;write files and execute commands. Throughout development, I ran with <code>--dangerously-skip-permissions</code> (dangerous mode) and bypass permissions enabled, allowing Claude to autonomously execute file edits, command runs, Git operations, etc. without per-action confirmation. This dramatically improved iteration speed – Claude can continuously execute complete “modify code -&gt; run tests -&gt; check results -&gt; fix -&gt; re-run” cycles without being interrupted by permission dialogs, at the cost of requiring the developer to have sufficient trust in Claude’s operations and perform after-the-fact review.</li><li><strong>Claude Agent SDK</strong>: Anthropic’s Agent development framework, on which SmartPerfetto’s agentv3 backend is built. The SDK encapsulates multi-turn conversation management, MCP tool-calling loops, automatic context compression (auto-compact), and other capabilities. Developers define the tool set and System Prompt, and the SDK drives Claude to autonomously complete multi-round analysis.</li><li><strong>Plan Mode</strong>: Claude Code’s planning mode, where the AI first outputs a structured implementation plan (which files to modify, what to change, order and dependencies), the human reviews and confirms, then the AI executes the code changes.</li><li><strong>SuperPower</strong>: The third-party plugin ecosystem for Claude Code, which injects additional capabilities into Claude Code through MCP Servers. In SmartPerfetto development, I used the Chrome DevTools Protocol plugin (directly controlling the browser for screenshots, debugging frontend) and Playwright plugin (automated UI testing and screenshots), among others. These plugins extended Claude Code’s capabilities from code editing to browser interaction and visual verification.</li><li><strong>Codex + Codex MCP</strong>: Codex is OpenAI’s code reasoning model. After being integrated into Claude Code via the Codex MCP Server, Claude can directly call Codex for independent review during conversations – send the implementation plan to Codex, which accesses the codebase in read-only mode and provides feedback from three angles: architectural soundness, edge cases, and missed risks. The entire process stays within the Claude Code workflow.</li><li><strong>Agent Team</strong>: Claude Code supports launching multiple sub-Agents working in parallel, each with independent tool sets and role definitions.</li><li><strong>Skills &#x2F; Hooks</strong>: Claude Code’s extension mechanisms. Skills are reusable task templates (e.g., <code>/commit</code>, <code>/simplify</code>), and Hooks are scripts that automatically execute on specific events (e.g., before&#x2F;after tool calls).</li></ul><h3 id="My-Actual-Evolution"><a href="#My-Actual-Evolution" class="headerlink" title="My Actual Evolution"></a>My Actual Evolution</h3><p><strong>Stage 1: Direct Conversation</strong></p><p>The earliest development approach was describing requirements directly in Claude Code and letting the AI modify code. Similar to pair programming where one person talks and the other writes. At this stage, every change needed line-by-line human review because the AI’s understanding of project context was limited, frequently making local modifications that didn’t align with the overall architecture.</p><p><strong>Stage 2: Plan Mode (SuperPower)</strong></p><p>After adopting Plan Mode, the workflow became: I describe the requirement -&gt; AI outputs a structured implementation plan (which files to modify, what to change in each, modification order and dependencies) -&gt; I review the plan -&gt; AI executes after confirmation. This shifted the review focus from “examining code line by line” to “reviewing the architecture plan,” noticeably improving efficiency.</p><p><strong>Stage 3: Plan Mode (SuperPower) + Peer Review (Codex)</strong></p><p>Relying on a single AI to generate plans is prone to blind spots. I began sending the plan to Codex for independent review after the Plan Mode plan was finalized. Codex accesses the codebase in read-only mode and provides feedback from three angles: architectural soundness, edge cases, and missed risks. This effectively introduces a code review step into the AI development workflow.</p><p>Most of the 9 rounds of architecture review mentioned earlier in the article went through this process. Taking the Perfetto Stdlib integration as an example (Round 7, March 15), Codex reviewed 3 rounds, raising a cumulative 36 feedback points, including issues I had missed in the plan such as the stdlib module preloading strategy and the Schema Index cache invalidation mechanism.</p><p><strong>Stage 4: Harness-ified Engineering Pipeline</strong></p><p>By the later stages, the development workflow had become:</p><figure class="highlight plaintext"><table><tr><td class="gutter"><pre><span class="line">1</span><br><span class="line">2</span><br><span class="line">3</span><br><span class="line">4</span><br><span class="line">5</span><br><span class="line">6</span><br><span class="line">7</span><br><span class="line">8</span><br><span class="line">9</span><br><span class="line">10</span><br><span class="line">11</span><br><span class="line">12</span><br><span class="line">13</span><br><span class="line">14</span><br><span class="line">15</span><br><span class="line">16</span><br><span class="line">17</span><br><span class="line">18</span><br><span class="line">19</span><br><span class="line">20</span><br><span class="line">21</span><br><span class="line">22</span><br><span class="line">23</span><br><span class="line">24</span><br><span class="line">25</span><br></pre></td><td class="code"><pre><span class="line">1. I determine requirements and architectural direction</span><br><span class="line">2. Claude Code outputs an implementation plan in Plan Mode</span><br><span class="line">3. Codex reviews the plan in read-only mode, provides feedback</span><br><span class="line">4. I evaluate Codex&#x27;s feedback (not blindly followed -- ~20% of suggestions are rejected with stated reasons)</span><br><span class="line">5. Claude Code executes code changes per the revised plan</span><br><span class="line">6. Automated full test suite runs:</span><br><span class="line">   - npx tsc --noEmit (type checking)</span><br><span class="line">   - npm run test:scene-trace-regression (6 trace regression, verifying Skill data output)</span><br><span class="line">   - npm run validate:skills + validate:strategies (Skill/strategy contract validation)</span><br><span class="line">   - For startup/scrolling/Flutter-related changes, E2E Agent analysis with real traces:</span><br><span class="line">     Uses the verifyAgentSseScrolling.ts script to load real trace files,</span><br><span class="line">     initiates a complete Agent analysis session, checks the SSE event stream,</span><br><span class="line">     tool call sequence, and whether the final conclusion covers mandatory</span><br><span class="line">     checks defined in the strategy.</span><br><span class="line">     For example, scrolling scenarios check whether the Agent executed Phase 1.9</span><br><span class="line">     root cause deep drill, and Flutter scenarios check whether the Agent correctly</span><br><span class="line">     identified the TextureView/SurfaceView architecture and invoked</span><br><span class="line">     flutter_scrolling_analysis rather than the standard scrolling_analysis.</span><br><span class="line">     This step verifies not whether a Skill can run, but whether the Agent&#x27;s</span><br><span class="line">     reasoning path and conclusion quality meet expectations when facing real data.</span><br><span class="line">     &lt;!-- TODO: 贴真实截图 --&gt;</span><br><span class="line">     &lt;!-- 截图 6: E2E 测试输出 — verifyAgentSseScrolling.ts 的终端输出，展示 SSE 事件统计和通过/失败状态 --&gt;</span><br><span class="line">7. Tests fail -&gt; analyze failure cause (read session log + metrics) -&gt; fix -&gt; re-test</span><br><span class="line">8. Tests pass -&gt; /simplify (code cleanup)</span><br><span class="line">9. Final Codex review confirmation</span><br></pre></td></tr></table></figure><p>In this workflow, human involvement is concentrated at Step 1 (requirements and architectural decisions) and Step 4 (evaluating review feedback). Code details, test execution, and formatting cleanup are handled by the engineering pipeline.</p><h3 id="Correspondence-with-SmartPerfetto’s-Architecture"><a href="#Correspondence-with-SmartPerfetto’s-Architecture" class="headerlink" title="Correspondence with SmartPerfetto’s Architecture"></a>Correspondence with SmartPerfetto’s Architecture</h3><p>Looking back, my AI-assisted development workflow and SmartPerfetto’s Agent analysis workflow are structurally similar:</p><table><thead><tr><th>Dimension</th><th>SmartPerfetto Agent Analysis</th><th>My AI-Assisted Development</th></tr></thead><tbody><tr><td>Intent Understanding</td><td>Scene Classifier identifies the scene</td><td>I determine the requirement direction</td></tr><tr><td>Strategy Injection</td><td>.strategy.md injects analysis methodology</td><td>Plan Mode outputs implementation plan</td></tr><tr><td>Execution</td><td>MCP tool calls for SQL&#x2F;Skills</td><td>Claude Code executes code changes</td></tr><tr><td>Quality Verification</td><td>3-layer Verifier (heuristic + Plan + Haiku)</td><td>Regression tests + Codex review</td></tr><tr><td>Correction Loop</td><td>Correction Prompt has Claude revise</td><td>Test failure -&gt; analyze -&gt; fix -&gt; re-run</td></tr><tr><td>Cross-session Learning</td><td>Pattern Memory + SQL error-correction</td><td>CLAUDE.md rule accumulation + memory system</td></tr></tbody></table><p>Both systems evolved in the same direction: <strong>human involvement shifted from the execution layer up to the decision layer.</strong> SmartPerfetto went from a fixed pipeline (humans define every step) to autonomous reasoning (humans define goals and constraints); my development approach went from line-by-line review to reviewing architecture plans.</p><p>This is not coincidental – the core of Harness Engineering is building sufficient engineering infrastructure (tests, verification, review) so that humans can trust the AI’s execution results and focus their attention on higher-level decisions.</p><p>The diagram below summarizes SmartPerfetto’s complete Harness Engineering landscape – from input routing to cross-session learning:</p><p><img src="/en/images/smartperfetto-eleven-layers.png" alt="Harness Engineering Landscape"></p><h2 id="Conclusion"><a href="#Conclusion" class="headerlink" title="Conclusion"></a>Conclusion</h2><p>Looking back over three months of iteration, from agentv2’s 13-step fixed pipeline to agentv3’s autonomous reasoning, from ~30% misjudgment rate to three-layer verification, from a 15000-token System Prompt to 4500-token on-demand loading – every change was driven by a concrete failure experience.</p><p>After completing this project, I have two takeaways about AI Agent application development.</p><p>The first is: the bulk of the work is not in the LLM API calls themselves, but in the engineering infrastructure surrounding the LLM:</p><ul><li>How should the System Prompt be organized so the LLM doesn’t confuse context? -&gt; Scene classification + on-demand loading + token budget</li><li>How do you control the LLM’s execution order so it thinks before acting? -&gt; Planning Gate + hypothesis submission</li><li>How much data should be returned to the LLM? -&gt; Artifact Store: give summaries, not full data</li><li>How do you detect and intercept the LLM’s domain misjudgments? -&gt; Three-layer verification + correction loop</li><li>How do you ensure data query precision? -&gt; YAML Skills (declarative SQL) + SQL error-correction learning</li><li>How do you adapt to different rendering architectures and chip platforms? -&gt; Architecture detection + vendor overrides</li></ul><p>The second takeaway is: <strong>the Agent’s “environment” matters far more than prompt wording.</strong> In agentv3’s early days, I spent considerable time adjusting System Prompt wording and formatting. I later discovered that what truly affects Agent output quality is not how the prompt is written, but what tools it’s given, what data is returned, and what constraints are imposed. Three concrete examples:</p><ul><li>After adding <code>submit_plan</code> gating, Claude stopped making directionless SQL queries (previously it would make purposeless queries like <code>SELECT * FROM slice</code> -&gt; <code>SELECT * FROM thread</code>), and analysis paths became organized</li><li>After adding ArtifactStore, the data Claude received dropped from 200 rows to summary references, and reasoning focus noticeably improved</li><li>After adding the <code>lookup_knowledge</code> tool, root cause analysis depth progressed from “main thread blocked” to “Binder counterpart system_server had delayed response due to CPU being scheduled to a little core”</li></ul><p>None of these improvements were achieved through adjusting prompt text – they were achieved by changing the Agent’s tool set and data environment. If I had one piece of advice for engineers building AI Agent applications, it would be: invest your effort in tool design and data control, not prompt engineering.</p><h3 id="Future-Directions"><a href="#Future-Directions" class="headerlink" title="Future Directions"></a>Future Directions</h3><p>The current SmartPerfetto is an interactive analysis tool that is far from ready for release, so it remains <strong>closed-source</strong> for now, developed solely by me. Future engineering directions include:</p><ul><li><strong>Deep vendor integration</strong> – The current 8 vendors’ <code>.override.yaml</code> only covers core Skills. More vendor-specific metrics (Qualcomm Snapdragon Profiler data, MediaTek MAGT signals, Samsung GameOptimizing service) need to be integrated one by one.</li><li><strong>CI integration + batch processing</strong> – Moving from interactive analysis to automatically analyzing performance regressions for each build in CI pipelines. Including unattended mode, result comparison against baselines, and automatic regression tagging.</li><li><strong>E2E verification framework</strong> – The current 6-trace regression test verifies the correctness of Skill data output, but does not verify the quality of Agent conclusions. An E2E verification system is needed: given a trace + known root cause -&gt; check whether the Agent correctly identified it.</li><li><strong>Codebase integration</strong> – Mapping slices&#x2F;functions in the trace back to source code locations, combined with git blame to locate the change that introduced the issue.</li></ul><p><strong>This tool will be open-sourced at the appropriate time (since major companies are all building their own internally, open-sourcing it would allow everyone to share ideas and develop together). Those interested in progress updates are welcome to add me on WeChat to join the group chat or direct message.</strong></p><hr>]]></content>
    
    
    <summary type="html">&lt;h1 id=&quot;From-Trace-to-Insight-Harness-Engineering-in-SmartPerfetto-AI-Agent&quot;&gt;&lt;a href=&quot;#From-Trace-to-Insight-Harness-Engineering-in-SmartPerfetto-AI-Agent&quot; class=&quot;headerlink&quot; title=&quot;From Trace to Insight: Harness Engineering in SmartPerfetto AI Agent&quot;&gt;&lt;/a&gt;From Trace to Insight: Harness Engineering in SmartPerfetto AI Agent&lt;/h1&gt;&lt;p&gt;&lt;img src=&quot;/en/images/smartperfetto-cover.png&quot; alt=&quot;SmartPerfetto Cover&quot;&gt;&lt;/p&gt;
&lt;blockquote&gt;
&lt;p&gt;This article documents the key technical decisions made while building SmartPerfetto from scratch – why certain approaches were chosen over others, where pitfalls were encountered, and how the design was adjusted afterward.&lt;/p&gt;
&lt;/blockquote&gt;</summary>


    <category term="Android" scheme="https://androidperformance.com/en/categories/Android/"/>
    
    
    <category term="Android" scheme="https://androidperformance.com/en/tags/Android/"/>
    
    <category term="Perfetto" scheme="https://androidperformance.com/en/tags/Perfetto/"/>
    
    <category term="Performance" scheme="https://androidperformance.com/en/tags/Performance/"/>
    
    <category term="AI Agent" scheme="https://androidperformance.com/en/tags/AI-Agent/"/>
    
    <category term="SmartPerfetto" scheme="https://androidperformance.com/en/tags/SmartPerfetto/"/>
    
    <category term="MCP" scheme="https://androidperformance.com/en/tags/MCP/"/>
    
  </entry>
  
  <entry>
    <title>OpenClaw FAQ: Token Costs, Use Cases, Local Models, Privacy, and Day-to-Day Experience</title>
    <link href="https://androidperformance.com/en/2026/03/10/OpenClaw-FAQ/"/>
    <id>https://androidperformance.com/en/2026/03/10/OpenClaw-FAQ/</id>
    <published>2026-03-10T00:00:00.000Z</published>
    <updated>2026-05-10T23:29:51.062Z</updated>
    
    <content type="html"><![CDATA[<p>After publishing the OpenClaw hands-on review yesterday, the most common questions from comments and group chats fell into five buckets: token costs, what it can actually do, local models, privacy and security, and day-to-day experience. Today I am picking the five most frequently asked questions and answering each one in detail.</p><p><img src="/en/images/OpenClaw-FAQ/cover.png" alt="OpenClaw FAQ"></p><span id="more"></span><h2 id="1-How-Much-Do-Tokens-Actually-Cost-Is-It-Expensive"><a href="#1-How-Much-Do-Tokens-Actually-Cost-Is-It-Expensive" class="headerlink" title="1. How Much Do Tokens Actually Cost? Is It Expensive?"></a>1. How Much Do Tokens Actually Cost? Is It Expensive?</h2><p>Short answer: not as expensive as you think, but not free either. I have run two different setups—one based on a premium cloud provider, and one on a cost-effective domestic (Chinese) model plan. The difference in experience is noticeable.</p><p><img src="/en/images/OpenClaw-FAQ/q1-token-cost.png" alt="Token Cost Breakdown"></p><h3 id="Phase-1-OpenAI-Pro-Plan-200-x2F-month"><a href="#Phase-1-OpenAI-Pro-Plan-200-x2F-month" class="headerlink" title="Phase 1: OpenAI Pro Plan ($200&#x2F;month)"></a>Phase 1: OpenAI Pro Plan ($200&#x2F;month)</h3><p>I started with OpenAI Pro. Generous quota, zero hassle. That said, this plan was not exclusively for OpenClaw—I also used it for day-to-day coding, so the actual split was roughly 50&#x2F;50. Over the course of several weeks, I never hit the 5-hour rate limit or the weekly cap. For someone who is a heavy user but not running jobs 24&#x2F;7, the $200 plan had plenty of headroom.</p><h3 id="Phase-2-Zhipu-GLM5-Coding-Plan-Annual-¥1608"><a href="#Phase-2-Zhipu-GLM5-Coding-Plan-Annual-¥1608" class="headerlink" title="Phase 2: Zhipu GLM5 Coding Plan (Annual: ¥1608)"></a>Phase 2: Zhipu GLM5 Coding Plan (Annual: ¥1608)</h3><p>When my Pro plan expired, I switched to the Zhipu GLM5 Coding Plan—a domestic model approach. I bought in during an introductory promotion at ¥980&#x2F;year, but <strong>in February 2026 Zhipu revised their pricing, dropped the introductory discount, and raised prices by roughly 30%</strong>.</p><h4 id="Latest-Plan-Pricing-March-2026"><a href="#Latest-Plan-Pricing-March-2026" class="headerlink" title="Latest Plan Pricing (March 2026)"></a>Latest Plan Pricing (March 2026)</h4><table><thead><tr><th>Plan</th><th>Quarterly</th><th>Annual (Quarterly x4)</th><th>Monthly Avg</th><th>Use Case</th></tr></thead><tbody><tr><td>GLM Coding Lite</td><td>¥132</td><td>¥528</td><td>¥44</td><td>Light users</td></tr><tr><td>GLM Coding Pro</td><td>¥402</td><td>¥1608</td><td>¥134</td><td>Heavy users (recommended)</td></tr><tr><td>GLM Coding Max</td><td>¥1266</td><td>¥5064</td><td>¥422</td><td>Teams &#x2F; Enterprise</td></tr></tbody></table><p>I am on the equivalent of Pro tier—¥980&#x2F;year before the price hike, now ¥1608&#x2F;year. In practice, it handles all my high-frequency scenarios—scheduled tasks, monitoring, daily&#x2F;weekly reports, knowledge base maintenance—without ever running into quota issues.</p><h4 id="GLM-5-API-Pay-As-You-Go-If-You-Skip-the-Plan"><a href="#GLM-5-API-Pay-As-You-Go-If-You-Skip-the-Plan" class="headerlink" title="GLM-5 API Pay-As-You-Go (If You Skip the Plan)"></a>GLM-5 API Pay-As-You-Go (If You Skip the Plan)</h4><p>If you prefer not to commit to a plan, pay-as-you-go pricing is available:</p><table><thead><tr><th>Model</th><th>Input Price</th><th>Output Price</th></tr></thead><tbody><tr><td>GLM-5 (0-32K)</td><td>¥4 &#x2F; million tokens</td><td>¥18 &#x2F; million tokens</td></tr><tr><td>GLM-5 (32K+)</td><td>¥6 &#x2F; million tokens</td><td>¥22 &#x2F; million tokens</td></tr><tr><td>GLM-5-Code (0-32K)</td><td>¥6 &#x2F; million tokens</td><td>¥28 &#x2F; million tokens</td></tr></tbody></table><p>Let me do the math: I burned through 240 million tokens in 7 days. At pay-as-you-go rates, that week alone would have cost roughly ¥2400—while the annual plan is only ¥1608. <strong>A full year of the plan costs less than a single week of pay-as-you-go.</strong> My advice is straightforward: <strong>heavy users should go with an annual plan; light users can start with pay-as-you-go to test the waters</strong>.</p><h4 id="Domestic-Coding-Plan-Comparison-March-2026"><a href="#Domestic-Coding-Plan-Comparison-March-2026" class="headerlink" title="Domestic Coding Plan Comparison (March 2026)"></a>Domestic Coding Plan Comparison (March 2026)</h4><p>These three providers offer the best OpenClaw support among domestic models:</p><table><thead><tr><th>Plan</th><th>Zhipu GLM</th><th>MiniMax</th><th>Kimi</th></tr></thead><tbody><tr><td><strong>Entry</strong></td><td>Lite ¥44&#x2F;mo (¥528&#x2F;yr)</td><td>Starter ¥70&#x2F;mo (¥700&#x2F;yr)</td><td>Moderato ¥133&#x2F;mo</td></tr><tr><td><strong>Mid</strong></td><td>Pro ¥134&#x2F;mo (¥1608&#x2F;yr)</td><td>Plus ¥140&#x2F;mo (¥1400&#x2F;yr)</td><td>Allegretto ¥99&#x2F;mo</td></tr><tr><td><strong>High</strong></td><td>Max ¥422&#x2F;mo (¥5064&#x2F;yr)</td><td>Max ¥350&#x2F;mo (¥3500&#x2F;yr)</td><td>Vivace ¥199&#x2F;mo</td></tr><tr><td><strong>Primary Model</strong></td><td>GLM-5</td><td>MiniMax M2.5</td><td>Kimi K2.5</td></tr><tr><td><strong>Strengths</strong></td><td>Best domestic model, native OpenClaw support</td><td>Great value, stable API</td><td>Strong long-context, switched to token billing in 2026</td></tr><tr><td><strong>OpenClaw Support</strong></td><td>Native</td><td>Native</td><td>Requires configuration</td></tr></tbody></table><p>I went with GLM Coding Pro (¥1608&#x2F;year) because Zhipu has the most mature OpenClaw integration, a stable API, and strong Chinese-language capabilities. The best-value pick is MiniMax Plus (¥1400&#x2F;year)—¥200 cheaper than GLM Pro with comparable performance.</p><blockquote><p>Note: Prices above are from March 2026 queries. Providers adjust pricing from time to time, so check official sites before purchasing.</p></blockquote><h3 id="Real-Numbers-240-Million-Tokens-in-7-Days"><a href="#Real-Numbers-240-Million-Tokens-in-7-Days" class="headerlink" title="Real Numbers: 240 Million Tokens in 7 Days"></a>Real Numbers: 240 Million Tokens in 7 Days</h3><p>I pulled my stats from the Zhipu dashboard: <strong>roughly 240 million tokens consumed by GLM5 over the past 7 days</strong>. The number sounds scary, but keep some context in mind: this 240 million figure only counts cloud-based GLM5 usage—tokens processed by local models are not included. With the Coding Plan at ¥1608&#x2F;year, that averages to about 34 million tokens per day. At pay-as-you-go rates (roughly ¥0.01 per thousand tokens), this single week would cost ¥2400—while the plan covers the entire year for ¥1608. The value speaks for itself. The real cost structure works like this: <strong>the cloud handles high-quality tasks, local models handle high-frequency grunt work, and the combined cost is far lower than you might expect.</strong> If you want to spend nothing at all, you can start with local models only, but the ceiling on capability and response quality will be noticeably lower. Spending the equivalent of a cup of coffee per month on a cloud model makes a significant difference, especially for long-form writing and complex reasoning.</p><p><img src="/en/images/OpenClaw-FAQ/token-usage.png" alt="Token Usage Stats"></p><h3 id="Mindset-Don’t-Be-Too-Transactional"><a href="#Mindset-Don’t-Be-Too-Transactional" class="headerlink" title="Mindset: Don’t Be Too Transactional"></a>Mindset: Don’t Be Too Transactional</h3><p>While we are on the topic of costs, let me share a bit about mindset. After running OpenClaw for this long—my kid calls it “Shrimp Bro” (虾哥)—my biggest takeaway is: <strong>don’t start out obsessing over monetization and ROI</strong>. The AI era is just getting started, and upfront investment is necessary. The time and money you put in now may not yield immediate returns, but they gradually build into something invaluable: an intuitive understanding of what AI can and cannot do, a feel for how agent collaboration works, and an instinct for which problems are solvable with AI. These things are hard to quantify in the short term, but their long-term value is enormous.</p><p>My approach has always been: think of running OpenClaw as buying yourself a great toy. The joy is worth the price. Watching it run tasks on its own, draft articles, and organize the knowledge base—that alone is deeply satisfying. If it pays for itself down the road, great. But whether it can pay for itself <em>right now</em> should never be the deciding factor for getting started. <strong>Just start building. That matters more than anything else.</strong></p><h2 id="2-What-Can-OpenClaw-Actually-Do-Give-Me-Real-Examples"><a href="#2-What-Can-OpenClaw-Actually-Do-Give-Me-Real-Examples" class="headerlink" title="2. What Can OpenClaw Actually Do? Give Me Real Examples"></a>2. What Can OpenClaw Actually Do? Give Me Real Examples</h2><p>The previous hands-on review went into detail, but I know many people do not read start to finish. Here are the scenarios I find most valuable and most illustrative.</p><p><img src="/en/images/OpenClaw-FAQ/q2-features.png" alt="What OpenClaw Can Do"></p><h3 id="What-I-Am-Currently-Running"><a href="#What-I-Am-Currently-Running" class="headerlink" title="What I Am Currently Running"></a>What I Am Currently Running</h3><table><thead><tr><th>Scenario</th><th>Description</th><th>Value</th></tr></thead><tbody><tr><td><strong>Daily Paper Digest</strong></td><td>Auto-fetches Android&#x2F;AI papers, translates, generates reading notes, saves to Obsidian</td><td>Stay on top of research, zero manual effort</td></tr><tr><td><strong>GitHub Repo Monitoring</strong></td><td>Watches Issues&#x2F;PRs for changes, proactively notifies on important updates</td><td>I monitor Perfetto—no more daily manual checking</td></tr><tr><td><strong>Knowledge Base Building</strong></td><td>Auto-archives content from WeChat Official Accounts, X, blogs; structures it</td><td>1,760 Markdown files and growing</td></tr><tr><td><strong>Content Review</strong></td><td>Daily push of content worth re-reading</td><td>Solves the “bookmarked and never read again” problem</td></tr><tr><td><strong>Android News Digest</strong></td><td>Auto-summarizes domain news, extracts key topics</td><td>No need to scroll through feeds</td></tr></tbody></table><p>The core value is this: OpenClaw’s most valuable contribution is not “answering a question for you.” It is turning the things you know are important but cannot sustain through willpower alone into background tasks that run automatically by default.</p><hr><h3 id="Advanced-Case-1-Batch-Import-into-NotebookLM-for-Deep-Analysis"><a href="#Advanced-Case-1-Batch-Import-into-NotebookLM-for-Deep-Analysis" class="headerlink" title="Advanced Case 1: Batch Import into NotebookLM for Deep Analysis"></a>Advanced Case 1: Batch Import into NotebookLM for Deep Analysis</h3><p><strong>NotebookLM</strong> is Google’s AI research assistant. It turns your materials—PDFs, web pages, documents—into a conversational knowledge base. Its standout feature is auto-generated <strong>podcast-style audio summaries</strong>: two AI hosts discuss your materials in a casual conversation format, perfect for listening during a commute. But NotebookLM has an obvious pain point: <strong>manually adding sources is tedious</strong>. You have to upload files one by one and paste links one at a time. With a large collection, it gets unbearable. OpenClaw can automate that entire workflow.</p><h4 id="In-Practice"><a href="#In-Practice" class="headerlink" title="In Practice"></a>In Practice</h4><figure class="highlight plaintext"><table><tr><td class="gutter"><pre><span class="line">1</span><br><span class="line">2</span><br><span class="line">3</span><br><span class="line">4</span><br><span class="line">5</span><br></pre></td><td class="code"><pre><span class="line">Me: Research Android 15 performance optimization features.</span><br><span class="line">    1. Search for relevant materials (official docs, blogs, papers)</span><br><span class="line">    2. Curate 10-15 high-quality sources</span><br><span class="line">    3. Batch import into NotebookLM</span><br><span class="line">    4. Generate a podcast summary</span><br></pre></td></tr></table></figure><p>OpenClaw automatically gathers official documentation, technical blogs, and papers on Android 15 performance optimization, filters out low-quality content and marketing fluff to keep only genuinely valuable sources, then bulk-imports everything into NotebookLM via API or browser automation, and finally triggers podcast generation.</p><h4 id="Why-This-Combination-Works-So-Well"><a href="#Why-This-Combination-Works-So-Well" class="headerlink" title="Why This Combination Works So Well"></a>Why This Combination Works So Well</h4><table><thead><tr><th>NotebookLM Alone</th><th>OpenClaw + NotebookLM</th></tr></thead><tbody><tr><td>Manually find sources, manually upload</td><td>Auto-collect, batch import</td></tr><tr><td>Scattered sources, inconsistent quality</td><td>Curated, high-quality sources</td></tr><tr><td>One-off project, then done</td><td>Periodic updates, continuous tracking</td></tr></tbody></table><p>Essentially, you outsource the time-consuming grunt work of information gathering and filtering to OpenClaw, letting NotebookLM focus on what it does best: deep analysis and structured output.</p><hr><h3 id="Advanced-Case-2-Drop-a-Link-Auto-Fetch-All-Related-Content-and-Save-to-Disk"><a href="#Advanced-Case-2-Drop-a-Link-Auto-Fetch-All-Related-Content-and-Save-to-Disk" class="headerlink" title="Advanced Case 2: Drop a Link, Auto-Fetch All Related Content and Save to Disk"></a>Advanced Case 2: Drop a Link, Auto-Fetch All Related Content and Save to Disk</h3><p>This is one of my most-used scenarios—it triggers almost daily. While scrolling X or reading a WeChat Official Account, I come across a great article that references several papers, a few GitHub repos, some related links, and a couple of book recommendations. The old workflow is all too familiar: bookmark it, tell yourself you will read it later, forget, never look at it again. With OpenClaw, the process is different:</p><figure class="highlight plaintext"><table><tr><td class="gutter"><pre><span class="line">1</span><br><span class="line">2</span><br><span class="line">3</span><br><span class="line">4</span><br><span class="line">5</span><br><span class="line">6</span><br><span class="line">7</span><br></pre></td><td class="code"><pre><span class="line">Me: https://example.com/awesome-article</span><br><span class="line">    Grab everything mentioned in this article:</span><br><span class="line">    - Papers -&gt; download PDFs</span><br><span class="line">    - GitHub repos -&gt; star + clone locally</span><br><span class="line">    - Related links -&gt; extract body text</span><br><span class="line">    - Books -&gt; add to reading list</span><br><span class="line">    Then compile an index Markdown and save it to Obsidian</span><br></pre></td></tr></table></figure><p>OpenClaw reads the original article, identifies all links and references, then handles them by category: arXiv&#x2F;paper links get PDFs downloaded to the <code>Papers/</code> directory, GitHub links are evaluated for value and important ones get starred and cloned locally, regular web pages have their body text extracted and converted to Markdown, and book references have titles added to the reading list. Finally, it generates an index Markdown containing the original article summary, all related content links with descriptions, and save locations, then automatically saves it to the <code>Personal-Knowledge/source/</code> directory. <strong>One link, one instruction, and everything is filed away automatically.</strong> When you want to revisit later, just search by keyword in Obsidian—all related materials are already organized by type.</p><h3 id="For-Android-Developers"><a href="#For-Android-Developers" class="headerlink" title="For Android Developers"></a>For Android Developers</h3><p>These are directions I have not built yet but am actively planning. See if any resonate with your work:</p><table><thead><tr><th>Pain Point</th><th>What OpenClaw Can Do</th><th>Audience</th></tr></thead><tbody><tr><td><strong>High barrier to trace analysis</strong></td><td>Upload Perfetto&#x2F;Systrace traces, AI-assisted interpretation, generate plain-language reports</td><td>App perf optimization, system UX perf</td></tr><tr><td><strong>Version compatibility checklists</strong></td><td>Auto-fetch Android Release Notes, generate adaptation checklists, cross-reference code to flag check points</td><td>App developers (annual necessity)</td></tr><tr><td><strong>Issue backlog overload</strong></td><td>Auto-classify (bug&#x2F;feature&#x2F;question), priority scoring, key info extraction</td><td>Open source maintainers, team collaboration</td></tr><tr><td><strong>Time-consuming code review</strong></td><td>Detect common patterns (null pointers, resource leaks, main-thread IO), generate review checklists</td><td>All teams</td></tr><tr><td><strong>Forgotten tech debt</strong></td><td>Periodically scan TODO&#x2F;FIXME comments, sort by priority, send reminders to “pay down the debt”</td><td>All projects</td></tr><tr><td><strong>Benchmarks nobody reads</strong></td><td>Run benchmarks on schedule, auto-compare against history, alert on anomalies (e.g., startup +500ms)</td><td>Performance teams</td></tr><tr><td><strong>Internal docs are unfindable</strong></td><td>Answer questions like “have we seen this before?” or “where is the design doc?” based on the knowledge base</td><td>All teams</td></tr><tr><td><strong>Upstream change tracking</strong></td><td>Monitor AOSP&#x2F;vendor code changes, flag items that need merging</td><td>System developers</td></tr></tbody></table><p>None of these work out of the box—they require custom development for your specific scenarios. But OpenClaw’s architecture naturally supports extending in all of these directions. <strong>The key is to get the foundation running first, then iterate based on real needs.</strong></p><h3 id="One-Line-Summary"><a href="#One-Line-Summary" class="headerlink" title="One-Line Summary"></a>One-Line Summary</h3><p>Papers read daily, repos monitored daily, knowledge organized daily, reports written daily. What OpenClaw truly achieves is turning “things that require long-term consistency”—something that goes against human nature—into “tasks the system quietly handles in the background.”</p><h2 id="3-What-Can-Local-Models-Do"><a href="#3-What-Can-Local-Models-Do" class="headerlink" title="3. What Can Local Models Do?"></a>3. What Can Local Models Do?</h2><p>Local models are not meant to replace cloud models. Their role is to handle the grunt work: the dirty, repetitive, high-frequency tasks. One line to describe the division of labor: the cloud “thinks deep,” local models “run hard.”</p><p><img src="/en/images/OpenClaw-FAQ/q3-local-models.png" alt="Cloud + Local Division of Labor"></p><h3 id="How-Much-Do-Local-Models-Handle"><a href="#How-Much-Do-Local-Models-Handle" class="headerlink" title="How Much Do Local Models Handle?"></a>How Much Do Local Models Handle?</h3><p>My actual runtime data:</p><table><thead><tr><th>Task Type</th><th>Model</th><th>Share</th></tr></thead><tbody><tr><td>Monitoring, inspection, batch processing</td><td>Local Qwen3.5-27B</td><td>30%</td></tr><tr><td>Status checks, lightweight classification</td><td>Local Qwen3.5-4B</td><td>20%</td></tr><tr><td>Ultra-light tasks</td><td>Local Qwen3.5-2B</td><td>10%</td></tr><tr><td>Cloud failure fallback</td><td>Local Qwen3.5-9B</td><td>5%</td></tr><tr><td>Long-form writing, polish, reviews</td><td>Cloud GLM5</td><td>15%</td></tr><tr><td>Daily&#x2F;weekly reports, auditing</td><td>Cloud GLM5</td><td>10%</td></tr><tr><td>Paper digest, ClawFeed</td><td>Cloud GLM5</td><td>10%</td></tr></tbody></table><p><strong>By task count, local models handle 60-70%. By token volume, local models handle 80%+.</strong></p><h3 id="My-Setup"><a href="#My-Setup" class="headerlink" title="My Setup"></a>My Setup</h3><p>The hardware is a Mac Studio (M-series Apple Silicon) running multiple local models: Qwen3.5-2B&#x2F;4B&#x2F;9B using MLX 8-bit quantization for lightweight tasks and cloud-failure fallback; Qwen3.5-27B deployed via Ollama as the primary local workhorse for high-frequency structured tasks. Side note: on Apple Silicon, inference with the MLX framework is noticeably faster than Ollama, especially for smaller models.</p><h3 id="Division-of-Labor-Principles"><a href="#Division-of-Labor-Principles" class="headerlink" title="Division of Labor Principles"></a>Division of Labor Principles</h3><table><thead><tr><th>Local Models Excel At</th><th>Cloud Models Excel At</th></tr></thead><tbody><tr><td>High-frequency structured tasks (RSS, queue processing)</td><td>Long-form writing and polishing</td></tr><tr><td>Monitoring and inspection</td><td>Complex reasoning and judgment</td></tr><tr><td>Data preprocessing (never leaves the machine)</td><td>High-quality translation and interpretation</td></tr><tr><td>Cloud failure fallback</td><td>Paper digest, deep analysis</td></tr></tbody></table><p>As for cost, the hardware was already purchased, and the additional electricity is minimal—so the <strong>marginal cost of local models is effectively zero</strong>.</p><h3 id="Token-Burn-Rate"><a href="#Token-Burn-Rate" class="headerlink" title="Token Burn Rate"></a>Token Burn Rate</h3><p>Even with local models shouldering much of the load, <strong>cloud tokens still burn fast</strong>. My setup is: primary model GPT-5.4 + workhorse GLM5 + local labor force Qwen3.5 series (27B&#x2F;9B&#x2F;4B&#x2F;2B). So my advice is to <strong>go straight for an all-you-can-eat Coding Plan</strong>. If budget allows, GPT Pro is great; for value, MiniMax or Kimi are solid choices. With pay-as-you-go at this consumption rate, the bill will hurt.</p><h3 id="Backup-Channel"><a href="#Backup-Channel" class="headerlink" title="Backup Channel"></a>Backup Channel</h3><p>In the early days, OpenClaw (“Shrimp Bro”) occasionally ran into stability issues. When that happened, I would use Claude Code (Remote Control) to connect remotely and troubleshoot manually. This does not happen often, but having a backup channel gives real peace of mind.</p><h3 id="The-Analogy"><a href="#The-Analogy" class="headerlink" title="The Analogy"></a>The Analogy</h3><p>Think of local models as “hardworking blue-collar workers” and cloud models as “brilliant senior consultants.” What OpenClaw does is fully automate the collaboration logic between them.</p><h2 id="4-How-Do-You-Protect-Privacy-and-Security"><a href="#4-How-Do-You-Protect-Privacy-and-Security" class="headerlink" title="4. How Do You Protect Privacy and Security?"></a>4. How Do You Protect Privacy and Security?</h2><p>This question comes up constantly, and rightfully so—it is something everyone needs to think through carefully before getting started.</p><p><img src="/en/images/OpenClaw-FAQ/q4-security.png" alt="Privacy and Security"></p><h3 id="Core-Principle"><a href="#Core-Principle" class="headerlink" title="Core Principle"></a>Core Principle</h3><p><strong>Sensitive data never leaves the machine.</strong> That is the line I drew for myself. The approach is straightforward:</p><ol><li><strong>Sensitive files stay off the cloud</strong>: Company code, internal documents, anything privacy-related—all processed exclusively by local models</li><li><strong>Local-first</strong>: If a task can be handled locally, it never touches a cloud API</li><li><strong>Principle of least privilege</strong>: OpenClaw can only access directories and tools I have explicitly authorized; everything else is off-limits</li></ol><h3 id="Technical-Safeguards"><a href="#Technical-Safeguards" class="headerlink" title="Technical Safeguards"></a>Technical Safeguards</h3><p>On the <strong>command execution whitelist</strong> front, the <code>safeBins</code> configuration strictly limits what commands it can run—only basic read-only commands like <code>ls</code>, <code>cat</code>, <code>grep</code>, <code>find</code>, and <code>git</code> are allowed. Dangerous operations like <code>rm -rf</code> are blocked outright by <code>deniedFlags</code>. This means that even if someone attempts a prompt injection to trick it into running malicious commands, the command layer simply will not execute them.</p><p>For <strong>source verification</strong>, <code>commands.ownerAllowFrom</code> and <code>channels.allowFrom</code> implement a source whitelist. Only my own account can issue system-level commands. Even if someone @mentions it in a group chat, it will not respond to any sensitive operations.</p><p>There is also <strong>configuration file hash verification</strong>: the system automatically generates a SHA256 hash of <code>openclaw.json</code> daily and compares it against a baseline. If the configuration file has been tampered with, an alert fires immediately. On top of that, <strong>routine scanning</strong> runs daily across all files in the workspace directory, checking for private keys, passwords, seed phrases, and other sensitive information. If anything is found, it alerts immediately—never silent.</p><h3 id="Runtime-Isolation"><a href="#Runtime-Isolation" class="headerlink" title="Runtime Isolation"></a>Runtime Isolation</h3><ul><li>OpenClaw runs on a dedicated Mac Studio, separate from my daily development machine</li><li>Sensitive accounts (company email, internal systems) are not connected to OpenClaw</li><li>External publishing channels like WeChat Official Accounts only have “save draft” permissions, not “publish directly”</li></ul><h3 id="Trust-Boundary"><a href="#Trust-Boundary" class="headerlink" title="Trust Boundary"></a>Trust Boundary</h3><p>My current strategy is: <strong>OpenClaw never sees anything more sensitive than what I would voluntarily send to a cloud AI.</strong> Think about it—when you use ChatGPT or Claude day-to-day, you upload files and send screenshots too, and the exposure surface there is actually larger and less controllable. OpenClaw is relatively contained: its permission scope, behavior logs, and complete operation history all live on my local machine, available for audit at any time.</p><h3 id="The-Nature-of-Security"><a href="#The-Nature-of-Security" class="headerlink" title="The Nature of Security"></a>The Nature of Security</h3><p>Security is never an AI Agent’s default behavior. It is something you must actively design and configure before deployment. Build the cage before you raise the shrimp—never the other way around.</p><h2 id="5-Day-to-Day-Experience-Control-from-Your-Phone-Data-Never-Lost"><a href="#5-Day-to-Day-Experience-Control-from-Your-Phone-Data-Never-Lost" class="headerlink" title="5. Day-to-Day Experience: Control from Your Phone, Data Never Lost"></a>5. Day-to-Day Experience: Control from Your Phone, Data Never Lost</h2><p>This one is not asked as often, but I personally think it is the key to OpenClaw feeling truly seamless. It deserves its own section.</p><p><img src="/en/images/OpenClaw-FAQ/q5-experience.png" alt="User Experience"></p><h3 id="Telegram-One-Main-Bot-Multiple-Group-Chats"><a href="#Telegram-One-Main-Bot-Multiple-Group-Chats" class="headerlink" title="Telegram: One Main Bot + Multiple Group Chats"></a>Telegram: One Main Bot + Multiple Group Chats</h3><p>Here is how I use it: the main bot handles everyday conversation, commands, and questions via private chat. Different daily tasks get forwarded to different groups—the Android group gets tech briefings, paper digests, and GitHub updates; the Daily group gets daily reports, weekly reports, and system notifications; other groups are split by topic as needed. Why separate groups? Three reasons:</p><ol><li><strong>No information mixing</strong>: Technical content and operational logs are managed separately. Want a specific category? Just open that group.</li><li><strong>Controllable notifications</strong>: Important groups get notifications turned on, unimportant ones get muted. No notification overload.</li><li><strong>Easy collaboration</strong>: Some groups can include colleagues, sharing the same information sources.</li></ol><h3 id="Data-Persisted-to-Obsidian"><a href="#Data-Persisted-to-Obsidian" class="headerlink" title="Data Persisted to Obsidian"></a>Data Persisted to Obsidian</h3><p>In this architecture, Telegram is just the “front-end display layer.” Everything that truly matters eventually gets persisted to Obsidian. This design means three things:</p><ul><li><strong>Nothing gets lost</strong>: Telegram messages scroll away over time, but Markdown files in Obsidian stay forever</li><li><strong>Searchable</strong>: Obsidian’s full-text search is far more capable than searching through Telegram chat history</li><li><strong>Reorganizable</strong>: You can restructure content, add tags, and build bidirectional links at any time</li></ul><p>My current Obsidian structure:</p><ul><li><code>OpenClaw-Scheduled-Tasks/</code>: All scheduled task outputs</li><li><code>Papers/</code>: Paper digest triple (summary, notes, PDF)</li><li><code>Personal-Knowledge/source/</code>: Knowledge base (1,760 files)</li><li><code>X-Articles/</code>: Archived high-value X content</li></ul><h3 id="Mobile-Access-Anytime"><a href="#Mobile-Access-Anytime" class="headerlink" title="Mobile Access Anytime"></a>Mobile Access Anytime</h3><p>This matters more than I initially expected. When I am out, I pull out my phone, open Telegram, and send commands to Shrimp Bro (虾哥)—no different from sitting at my desk. Want to read today’s daily report? Open Obsidian on mobile—the files are already synced via iCloud. Need to adjust a task urgently? No need to fire up a computer; it is all doable from the phone. My daily routine now starts with checking Telegram in the morning to see what tasks ran overnight and whether anything went wrong. If there is an issue, I handle it right from my phone. When I am out, a quick glance at the running status keeps me informed.</p><p><img src="/en/images/OpenClaw-FAQ/status-card.png" alt="OpenClaw Status Card"></p><h3 id="Architecture-Summary"><a href="#Architecture-Summary" class="headerlink" title="Architecture Summary"></a>Architecture Summary</h3><p><strong>Telegram is the front end, Obsidian is the back end.</strong> Telegram solves the “reachable anytime, anywhere” problem. Obsidian solves the “data never gets lost” problem. Together, they form a genuinely usable 24&#x2F;7 assistant experience.</p><h2 id="Related-Posts"><a href="#Related-Posts" class="headerlink" title="Related Posts"></a>Related Posts</h2><ol><li><a href="https://www.androidperformance.com/2026/03/08/OpenClaw-Local-Practice/">After Running OpenClaw Locally for Three Weeks, I Realized It Is Not a Chatbot</a></li></ol><p><a id="about"></a></p><h1 id="About-Me-amp-amp-Blog"><a href="#About-Me-amp-amp-Blog" class="headerlink" title="About Me &amp;&amp; Blog"></a>About Me &amp;&amp; Blog</h1><p>Below is my personal intro and related links. I look forward to exchanging ideas with fellow professionals. “When three walk together, one can always be my teacher!”</p><ol><li><a href="https://www.androidperformance.com/en/about/">Blogger Intro</a></li><li><a href="https://www.androidperformance.com/en/2019/12/01/BlogMap/">Blog Content Navigation</a>: A guide for my blog content.</li><li><a href="https://www.androidperformance.com/en/2018/05/07/Android-performance-optimization-skills-and-tools/">Curated Excellent Blog Articles - Android Performance Optimization Must-Knows</a></li><li><a href="https://www.androidperformance.com/en/2023/12/30/the-performance/">Android Performance Optimization Knowledge Planet</a></li></ol><blockquote><p><strong>One walks faster alone, but a group walks further together.</strong></p></blockquote><p><img src="/en/images/WechatIMG581.webp" alt="Scan WeChat QR Code"></p>]]></content>
    
    
    <summary type="html">&lt;p&gt;After publishing the OpenClaw hands-on review yesterday, the most common questions from comments and group chats fell into five buckets: token costs, what it can actually do, local models, privacy and security, and day-to-day experience. Today I am picking the five most frequently asked questions and answering each one in detail.&lt;/p&gt;
&lt;p&gt;&lt;img src=&quot;/en/images/OpenClaw-FAQ/cover.png&quot; alt=&quot;OpenClaw FAQ&quot;&gt;&lt;/p&gt;</summary>


    <category term="AI" scheme="https://androidperformance.com/en/categories/AI/"/>
    
    
    <category term="AI" scheme="https://androidperformance.com/en/tags/AI/"/>
    
    <category term="OpenClaw" scheme="https://androidperformance.com/en/tags/OpenClaw/"/>
    
    <category term="Productivity Tools" scheme="https://androidperformance.com/en/tags/Productivity-Tools/"/>
    
    <category term="Local Models" scheme="https://androidperformance.com/en/tags/Local-Models/"/>
    
  </entry>
  
  <entry>
    <title>After Running OpenClaw Locally for Three Weeks, I Realized It&#39;s Not a Chatbot</title>
    <link href="https://androidperformance.com/en/2026/03/08/OpenClaw-Local-Practice/"/>
    <id>https://androidperformance.com/en/2026/03/08/OpenClaw-Local-Practice/</id>
    <published>2026-03-08T10:00:00.000Z</published>
    <updated>2026-06-02T15:40:34.523Z</updated>
    
    <content type="html"><![CDATA[<p>I’ve been using OpenClaw heavily on my local machine for a while now. At first, I treated it like any other AI tool. But after wiring it into Telegram, Obsidian, scheduled tasks, local models, and my content workflow, I realized I had it completely wrong. <strong>Its real power isn’t answering questions – it’s doing sustained work on your behalf.</strong> It can receive messages, call tools, run scheduled tasks, dispatch to different models, build long-term memory, write results back to Obsidian, and delegate complex tasks to other agents. If you’re only using it as a chatbot, you’re tapping maybe 20% of what it can do.</p><span id="more"></span><p>For someone like me – juggling Android system performance work, content creation, community management, knowledge base upkeep, project tracking, and coding – the value of OpenClaw boils down to one thing: <strong>For the first time, AI isn’t just answering me. It’s actually pushing my work forward on its own.</strong></p><p><img src="/en/images/OpenClaw-Local-Practice/01-scene-openclaw-control-center.png" alt="OpenClaw Workflow Overview"></p><h2 id="1-When-Did-I-Actually-Start-Using-OpenClaw"><a href="#1-When-Did-I-Actually-Start-Using-OpenClaw" class="headerlink" title="1. When Did I Actually Start Using OpenClaw?"></a>1. When Did I Actually Start Using OpenClaw?</h2><p>Based on the initialization traces in my local environment, I started running OpenClaw on my own machine on the <strong>evening of February 16, 2026</strong>. This wasn’t a “let me install it and poke around” situation. I went all in, connecting it to my daily workflow: messaging, scheduled tasks, Obsidian knowledge base, daily and weekly reports, GitHub monitoring, paper reading, content curation, writing, and retrospectives. So I no longer think of it as “a tool.” I think of it as a local AI orchestration layer, a scheduled execution system, a long-term memory system, an automated content and knowledge organizer, and a central hub that can collaborate with Claude Code.</p><h2 id="2-What-Does-OpenClaw-Actually-Do-for-an-Android-System-Engineer"><a href="#2-What-Does-OpenClaw-Actually-Do-for-an-Android-System-Engineer" class="headerlink" title="2. What Does OpenClaw Actually Do for an Android System Engineer?"></a>2. What Does OpenClaw Actually Do for an Android System Engineer?</h2><p>If your day job is Android engineering, system optimization, performance analysis, or stability work, the most valuable thing about OpenClaw isn’t “answering a question for you.” It’s handling the work that is <strong>continuous, repetitive, cross-tool, cross-time, and cross-context</strong>. I currently use it for four categories of tasks.</p><h3 id="Category-1-Information-Flow-Automation"><a href="#Category-1-Information-Flow-Automation" class="headerlink" title="Category 1: Information Flow Automation"></a>Category 1: Information Flow Automation</h3><p>Daily tech briefings, daily news digests, RSS scraping, high-value content filtering, GitHub issue&#x2F;PR monitoring, daily paper reading – none of these are things I couldn’t do before. The problem was that <strong>they’re too fragmented, and I’d inevitably drop them</strong>. OpenClaw turns these from “powered by willpower” into “powered by system defaults.”</p><h3 id="Category-2-Continuous-Knowledge-Base-Maintenance"><a href="#Category-2-Continuous-Knowledge-Base-Maintenance" class="headerlink" title="Category 2: Continuous Knowledge Base Maintenance"></a>Category 2: Continuous Knowledge Base Maintenance</h3><p>I consume a lot of content: technical articles, WeChat public accounts, long-form posts on X, RSS feeds, project materials, my own thoughts. The biggest problem used to be: I’d save things but never organize them, organize them but never find them again, find them but struggle to reuse them. After connecting OpenClaw, it continuously does incremental organization, structural repair, high-value archiving, content review, and memory maintenance. This matters especially for engineers, because growth doesn’t come from “having read a lot” – it comes from <strong>being able to pull that knowledge out and use it later</strong>.</p><h3 id="Category-3-Daily-Reports-Retrospectives-and-Weekly-Reviews"><a href="#Category-3-Daily-Reports-Retrospectives-and-Weekly-Reviews" class="headerlink" title="Category 3: Daily Reports, Retrospectives, and Weekly Reviews"></a>Category 3: Daily Reports, Retrospectives, and Weekly Reviews</h3><p>This is the part most people overlook, but it’s also the one with the most compounding returns. I now have OpenClaw running daily morning reminders, end-of-day reports, evening retrospectives, weekly distillations, project reviews, three-tier memory maintenance, and meditation&#x2F;evolution logs. The thing that hooked me most about OpenClaw is this: <strong>It takes all those things I know are important but can never sustain as habits, and turns them into things the system does for me automatically.</strong></p><h3 id="Category-4-Engineering-Collaboration"><a href="#Category-4-Engineering-Collaboration" class="headerlink" title="Category 4: Engineering Collaboration"></a>Category 4: Engineering Collaboration</h3><p>It can also participate in engineering work – tracking GitHub repo changes, patrolling issues and PRs, organizing code context, and calling other coding agents to do work. But let me state the conclusion upfront: <strong>OpenClaw isn’t meant to replace Claude Code. It’s meant to orchestrate Claude Code.</strong> Claude Code is more like a top-tier programmer sitting in your terminal. OpenClaw is more like an AI operations system.</p><h2 id="3-Why-Do-I-Always-Keep-Claude-Code-Nearby"><a href="#3-Why-Do-I-Always-Keep-Claude-Code-Nearby" class="headerlink" title="3. Why Do I Always Keep Claude Code Nearby?"></a>3. Why Do I Always Keep Claude Code Nearby?</h2><p>Because OpenClaw in its early days genuinely breaks. Let me be blunt: upgrades cause errors, model configurations go wrong, scheduled tasks behave unexpectedly, certain tool chains stop working, certain file paths fail to write, and old sessions don’t always sync with new configurations. If you only have OpenClaw itself, many of these problems are extremely frustrating. But if you have Claude Code on the side, things get much simpler.</p><p>My division of labor is clear: <strong>OpenClaw</strong> handles orchestration, memory, scheduling, archiving, messaging, and workflows. <strong>Claude Code</strong> handles bug fixes, log inspection, error diagnosis, complex code changes, and post-upgrade firefighting. In short, Claude Code is a top-tier programmer; OpenClaw is an AI operations system.</p><p><img src="/en/images/OpenClaw-Local-Practice/04-comparison-openclaw-vs-claudecode.png" alt="Claude Code and OpenClaw Collaboration"></p><h2 id="4-What’s-My-Local-Setup"><a href="#4-What’s-My-Local-Setup" class="headerlink" title="4. What’s My Local Setup?"></a>4. What’s My Local Setup?</h2><p>My current machine is a Mac Studio M1 Ultra with 64GB of RAM and a 48-core GPU. This configuration is very comfortable for local agent workflows because it lets me run OpenClaw as a persistent service alongside Ollama local models, Obsidian, browser automation, and various scripts and knowledge base tasks. I don’t use a single-model approach – I run a <strong>cloud + local hybrid</strong>.</p><h3 id="The-Model-Strategy-Is-Simple"><a href="#The-Model-Strategy-Is-Simple" class="headerlink" title="The Model Strategy Is Simple"></a>The Model Strategy Is Simple</h3><p>High-quality tasks go to the cloud (long-form writing, weekly reports, complex summaries, critical decisions). High-frequency grunt work runs locally (structured tasks, patrols, batch processing, daily workers). My local model tiers look like this: 2B for status checks, 4B for lightweight patrols, 9B as the high-frequency workhorse, and 27B&#x2F;35B for heavier local tasks. On my machine, <strong>9B is the best value daily workhorse</strong>.</p><h2 id="5-The-Most-Important-Part-of-OpenClaw-Isn’t-the-Models-–-It’s-the-Core-Files"><a href="#5-The-Most-Important-Part-of-OpenClaw-Isn’t-the-Models-–-It’s-the-Core-Files" class="headerlink" title="5. The Most Important Part of OpenClaw Isn’t the Models – It’s the Core Files"></a>5. The Most Important Part of OpenClaw Isn’t the Models – It’s the Core Files</h2><p>When people first encounter OpenClaw, they focus on models, tools, and the command line. But I’ve come to believe that its real power lies in its file-based rules. The files I care most about are:</p><ul><li><code>SOUL.md</code>: Defines its personality, style, and working posture</li><li><code>USER.md</code>: Defines who it’s helping and what the goals are</li><li><code>AGENTS.md</code>: Defines startup procedures, memory rules, safety boundaries, and group chat behavior</li><li><code>MEMORY.md + memory/YYYY-MM-DD.md</code>: One stores long-term memory, the other stores what happened each day</li><li><code>TOOLS.md</code>: Records environment-specific information unique to this machine</li></ul><p>So my current understanding of OpenClaw is this: <strong>It doesn’t run on one giant system prompt. It runs on a system of file-based personality + file-based memory + file-based rules.</strong></p><p><img src="/en/images/OpenClaw-Local-Practice/02-framework-core-files.png" alt="OpenClaw Core File Framework"></p><h2 id="6-Why-Does-the-Skill-System-Matter"><a href="#6-Why-Does-the-Skill-System-Matter" class="headerlink" title="6. Why Does the Skill System Matter?"></a>6. Why Does the Skill System Matter?</h2><p>Many people think of Skills as “plugins,” but I think a more accurate framing is <strong>capability packages</strong>. A Skill usually isn’t just an extra button. It bundles together what scenarios it fits, how it calls tools, whether it depends on scripts, what the boundaries and caveats are, and when it should or shouldn’t be used. Capabilities like Obsidian integration, coding-agent, RSS, and skill auditing – once properly installed, OpenClaw stops just chatting and starts actually working. But my advice is also clear: <strong>Don’t install Skills just to show off.</strong> Start with core capabilities, run them for a couple of days to confirm they’re stable, then expand. For Skills involving elevated permissions or external connections, audit first, then decide whether to enable them.</p><h2 id="7-Telegram-Single-Agent-with-Multiple-Group-Chats-Works-but-Split-by-Role-Later"><a href="#7-Telegram-Single-Agent-with-Multiple-Group-Chats-Works-but-Split-by-Role-Later" class="headerlink" title="7. Telegram: Single Agent with Multiple Group Chats Works, but Split by Role Later"></a>7. Telegram: Single Agent with Multiple Group Chats Works, but Split by Role Later</h2><p>If you’re only using OpenClaw in private chat, you haven’t fully experienced its architectural value. One of its genuinely interesting features is that the same system can connect to Telegram, and it doesn’t have to map to just one way of working.</p><h3 id="Option-A-Single-Agent-Multiple-Group-Chats"><a href="#Option-A-Single-Agent-Multiple-Group-Chats" class="headerlink" title="Option A: Single Agent, Multiple Group Chats"></a>Option A: Single Agent, Multiple Group Chats</h3><p>The upside is simplicity: fast setup, low initial cost, easiest way to validate early on. But the downsides are obvious: context bleeds across chats, different groups’ tones and tasks get mixed together, and writing, daily reports, and technical Q&amp;A contaminate each other.</p><h3 id="Option-B-Split-Into-Multiple-Agents-by-Role"><a href="#Option-B-Split-Into-Multiple-Agents-by-Role" class="headerlink" title="Option B: Split Into Multiple Agents by Role"></a>Option B: Split Into Multiple Agents by Role</h3><p>This is the approach I’ve come to prefer. For example, <code>main</code> handles the primary private chat, <code>daily</code> handles scheduled tasks, daily reports, patrols, and knowledge base work, <code>writer</code> handles writing and content refinement, and specialized agents handle specific groups, business lines, or projects. The benefits are cleaner context isolation, clearer role boundaries, no cross-contamination between groups, and easier scaling later. My recommendation: <strong>Start with a single agent and multiple group chats early on, but split by role as things mature.</strong></p><p><img src="/en/images/OpenClaw-Local-Practice/03-flowchart-workflow-loop.png" alt="Telegram Multi-Agent Architecture"></p><h2 id="8-Security-Is-Not-an-Appendix-–-It’s-a-Prerequisite"><a href="#8-Security-Is-Not-an-Appendix-–-It’s-a-Prerequisite" class="headerlink" title="8. Security Is Not an Appendix – It’s a Prerequisite"></a>8. Security Is Not an Appendix – It’s a Prerequisite</h2><p>I strongly recommend being upfront about this from the start. Once OpenClaw begins accessing the local file system, browser, command execution, external messaging, and a mix of local and cloud models, it’s no longer a “harmless chat box.” It becomes a system with real agency. At that point, security boundaries must be established first.</p><p>The principles I’ve come to follow are:</p><ul><li><strong>Layer your long-term memory</strong>: Something like <code>MEMORY.md</code>, which contains more personal and stable information, should ideally only be used in the main session – don’t let it be read freely in group chat contexts</li><li><strong>Be cautious with outbound actions</strong>: Emails, public posts, social media publishing – these should require confirmation by default. Don’t let it automatically publish half-finished work</li><li><strong>Don’t overstep in group chats</strong>: In a group, it’s a participant, not your spokesperson, and certainly not you</li><li><strong>Don’t install Skills carelessly</strong>: Especially those involving network access, script execution, or local path reading – audit first, decide later</li><li><strong>Don’t blindly give small local models broad permissions</strong>: Especially when accessing web pages, executing commands, or reading&#x2F;writing paths, be clear about workspace and tool boundaries</li></ul><p>If you plan to connect even more external capabilities, browser automation, or overseas models down the road, you’ll typically also need a stable network access setup. But the more capabilities you add, the more important it is to design the boundaries first.</p><h2 id="9-The-Really-Critical-Question-What-Has-It-Actually-Produced"><a href="#9-The-Really-Critical-Question-What-Has-It-Actually-Produced" class="headerlink" title="9. The Really Critical Question: What Has It Actually Produced?"></a>9. The Really Critical Question: What Has It Actually Produced?</h2><p>If this post only described what OpenClaw “can do,” readers might still see it as a conceptual system. What’s actually convincing is <strong>what this system has already deposited into Obsidian</strong>. As of the time I’m writing this, my Obsidian vault contains these tangible outputs:</p><p><img src="/en/images/OpenClaw-Local-Practice/05-infographic-obsidian-artifacts-wall.png" alt="Obsidian Artifact Wall"></p><ul><li>Under <code>OpenClaw定时任务/</code> there are <strong>214 Markdown files</strong>, proving that daily reports, weekly reviews, archiving, and patrols aren’t just talk – they’re sustained output</li><li>Under <code>Personal-Knowlodge/source/</code> there are <strong>1,760 Markdown files</strong> – the knowledge base isn’t an empty directory, it’s genuinely growing</li><li>Under <code>X 文章/</code> there are <strong>115 Markdown files</strong> – high-value external content has been consolidated into a long-term resource library</li><li>Under <code>论文/</code> there are <strong>4 standardized paper directories</strong>, each organized as “original PDF + translation + deep reading”</li><li>Under <code>小说工坊/夜航之上（分章）/</code> there are <strong>58 chapter-related files</strong> – it has entered a long-term creative workflow, not just technical tasks</li><li><code>Ebook/</code> already contains actual EPUB deliverables – not just notes, but distributable formats</li></ul><p>To give a few concrete examples: <code>OpenClaw定时任务/每日论文精读（Android+AI）/2026-03-08-每日论文精读（Android+AI）.md</code>, <code>Personal-Knowlodge/source/2026-03-08_wechat_Android_JNI原理分析.md</code>, <code>论文/AI-2026-03-08-Agentic-Reasoning-Framework/01-paper.pdf + 02-翻译.md + 03-精读.md</code>, <code>小说工坊/夜航之上（分章）/第018章-光标闪烁.md</code>. This is what I value most about OpenClaw right now: <strong>It doesn’t just finish a task and move on. It continuously turns work into assets.</strong></p><h2 id="10-What-Pitfalls-Did-I-Hit"><a href="#10-What-Pitfalls-Did-I-Hit" class="headerlink" title="10. What Pitfalls Did I Hit?"></a>10. What Pitfalls Did I Hit?</h2><p>This section is critical, because it determines whether you’ll give up halfway.</p><h3 id="Pitfall-1-It’s-Genuinely-Unstable-Early-On"><a href="#Pitfall-1-It’s-Genuinely-Unstable-Early-On" class="headerlink" title="Pitfall 1: It’s Genuinely Unstable Early On"></a>Pitfall 1: It’s Genuinely Unstable Early On</h3><p>You need to accept a reality: OpenClaw is powerful, but it is not “zero maintenance.” My pitfalls have included upgrade errors, misconfigured model allowlists, model switches that don’t take effect in old sessions, scheduled tasks that run but fail to write to disk, external path permission issues, and browser policy problems.</p><h3 id="Pitfall-2-Don’t-Mix-Node-Environments"><a href="#Pitfall-2-Don’t-Mix-Node-Environments" class="headerlink" title="Pitfall 2: Don’t Mix Node Environments"></a>Pitfall 2: Don’t Mix Node Environments</h3><p>I eventually unified my runtime environment under <strong>Homebrew Node</strong> and stopped mixing in nvm. This was absolutely necessary – otherwise upgrades, restarts, and paths all become a mess.</p><h3 id="Pitfall-3-Don’t-Get-Sloppy-with-Obsidian-External-Paths"><a href="#Pitfall-3-Don’t-Get-Sloppy-with-Obsidian-External-Paths" class="headerlink" title="Pitfall 3: Don’t Get Sloppy with Obsidian External Paths"></a>Pitfall 3: Don’t Get Sloppy with Obsidian External Paths</h3><p>This one bit me hard. I eventually converged on very explicit rules:</p><ul><li>Always use absolute paths</li><li>The most reliable approach is <code>exec + python/pathlib</code> for writing to disk</li><li>Don’t naively use <code>write/edit</code> directly</li><li>For same-day content, append rather than overwrite</li></ul><h3 id="Pitfall-4-More-Automation-Isn’t-Always-Better"><a href="#Pitfall-4-More-Automation-Isn’t-Always-Better" class="headerlink" title="Pitfall 4: More Automation Isn’t Always Better"></a>Pitfall 4: More Automation Isn’t Always Better</h3><p>It’s easy to get carried away early on, wanting to automate everything. But eventually you’ll find that too many tasks lead to duplication, conflicts, noise, rising token costs, and outputs nobody actually reads. A better strategy isn’t “automate everything” but rather to focus on the few main threads with the highest compounding returns.</p><h2 id="11-Who-Is-OpenClaw-Best-Suited-For"><a href="#11-Who-Is-OpenClaw-Best-Suited-For" class="headerlink" title="11. Who Is OpenClaw Best Suited For?"></a>11. Who Is OpenClaw Best Suited For?</h2><p>I think there are three types of people it fits best. <strong>The first are people with continuous input and output needs</strong> – engineers, indie developers, technical bloggers, community managers, research-oriented creators. <strong>The second are people who enjoy tinkering with workflows</strong> – if you have a natural interest in automation, systematization, and structure, OpenClaw will feel more natural the more you use it. <strong>The third are people who want to actually integrate AI into their workflow</strong> – if you don’t just want to ask a few questions but genuinely want continuous monitoring, automated organization, proactive reminders, scheduled output, long-term memory, and cross-platform content coordination, OpenClaw will serve you well.</p><h2 id="12-Who-Might-Not-Be-a-Good-Fit"><a href="#12-Who-Might-Not-Be-a-Good-Fit" class="headerlink" title="12. Who Might Not Be a Good Fit?"></a>12. Who Might Not Be a Good Fit?</h2><p>I should be honest here too. People who just want a ChatGPT replacement, people who don’t want to maintain environments or read logs, and people without a sustained workflow – these three groups won’t necessarily fail at it, but they probably won’t experience its real value.</p><h2 id="13-Hardware-Recommendations"><a href="#13-Hardware-Recommendations" class="headerlink" title="13. Hardware Recommendations"></a>13. Hardware Recommendations</h2><p>If you ask me what machine to get, I’d break it into three tiers:</p><ul><li><strong>Entry tier</strong>: 16GB RAM, primarily running cloud models, with only light local assistance</li><li><strong>Practical tier</strong>: 32GB RAM, can run some local models, handles light to medium workloads</li><li><strong>Comfortable tier</strong>: 64GB and above, Mac Studio or high-end workstation class, cloud + local hybrid running persistently</li></ul><p>If you truly want to run OpenClaw as a “long-term persistent, cloud + local hybrid, multi-task parallel” system, <strong>the 64GB tier is where the experience becomes noticeably more stable</strong>.</p><h2 id="14-My-Final-Take-on-OpenClaw"><a href="#14-My-Final-Take-on-OpenClaw" class="headerlink" title="14. My Final Take on OpenClaw"></a>14. My Final Take on OpenClaw</h2><p>If I had to sum it up in one sentence: <strong>The most compelling thing about OpenClaw isn’t that it answers questions better – it’s that it starts doing sustained work on your behalf.</strong> For an Android system engineer, its greatest value isn’t replacing you as a coder. It’s helping you connect the dots between input, organization, archiving, follow-up, output, retrospectives, and memory – all those things that used to be scattered everywhere. It’s not a zero-barrier tool. It will crash, throw errors, and trip you up. But once you get it running smoothly, you’ll feel a clear shift: <strong>Before, you were pushing the workflow forward. Now, the system is pushing you forward.</strong> That’s why I think it’s worth the effort.</p><h2 id="Closing-Thoughts"><a href="#Closing-Thoughts" class="headerlink" title="Closing Thoughts"></a>Closing Thoughts</h2><p>If you’re an engineer, a creator, or someone trying to integrate AI into a real workflow rather than just using it as a chat window, OpenClaw is worth a serious attempt. It’s not for everyone, but once you get it running smoothly, the payoff isn’t just “more efficient conversations” – it’s <strong>compounding returns at the workflow level</strong>.</p><h2 id="Related-Posts"><a href="#Related-Posts" class="headerlink" title="Related Posts"></a>Related Posts</h2><ol><li><a href="https://www.androidperformance.com/2026/03/10/OpenClaw-FAQ/">OpenClaw FAQ: Token Usage, Capabilities, Local Models, Privacy, and User Experience</a></li></ol><p><a id="about"></a></p><h1 id="About-Me-amp-amp-Blog"><a href="#About-Me-amp-amp-Blog" class="headerlink" title="About Me &amp;&amp; Blog"></a>About Me &amp;&amp; Blog</h1><p>Below is my personal intro and related links. I look forward to exchanging ideas with fellow professionals. “When three walk together, one can always be my teacher!”</p><ol><li><a href="https://www.androidperformance.com/en/about/">Blogger Intro</a></li><li><a href="https://www.androidperformance.com/en/2019/12/01/BlogMap/">Blog Content Navigation</a>: A guide for my blog content.</li><li><a href="https://www.androidperformance.com/en/2018/05/07/Android-performance-optimization-skills-and-tools/">Curated Excellent Blog Articles - Android Performance Optimization Must-Knows</a></li><li><a href="https://www.androidperformance.com/en/2023/12/30/the-performance/">Android Performance Optimization Knowledge Planet</a></li></ol><blockquote><p><strong>One walks faster alone, but a group walks further together.</strong></p></blockquote><p><img src="/en/images/WechatIMG581.webp" alt="Scan WeChat QR Code"></p>]]></content>
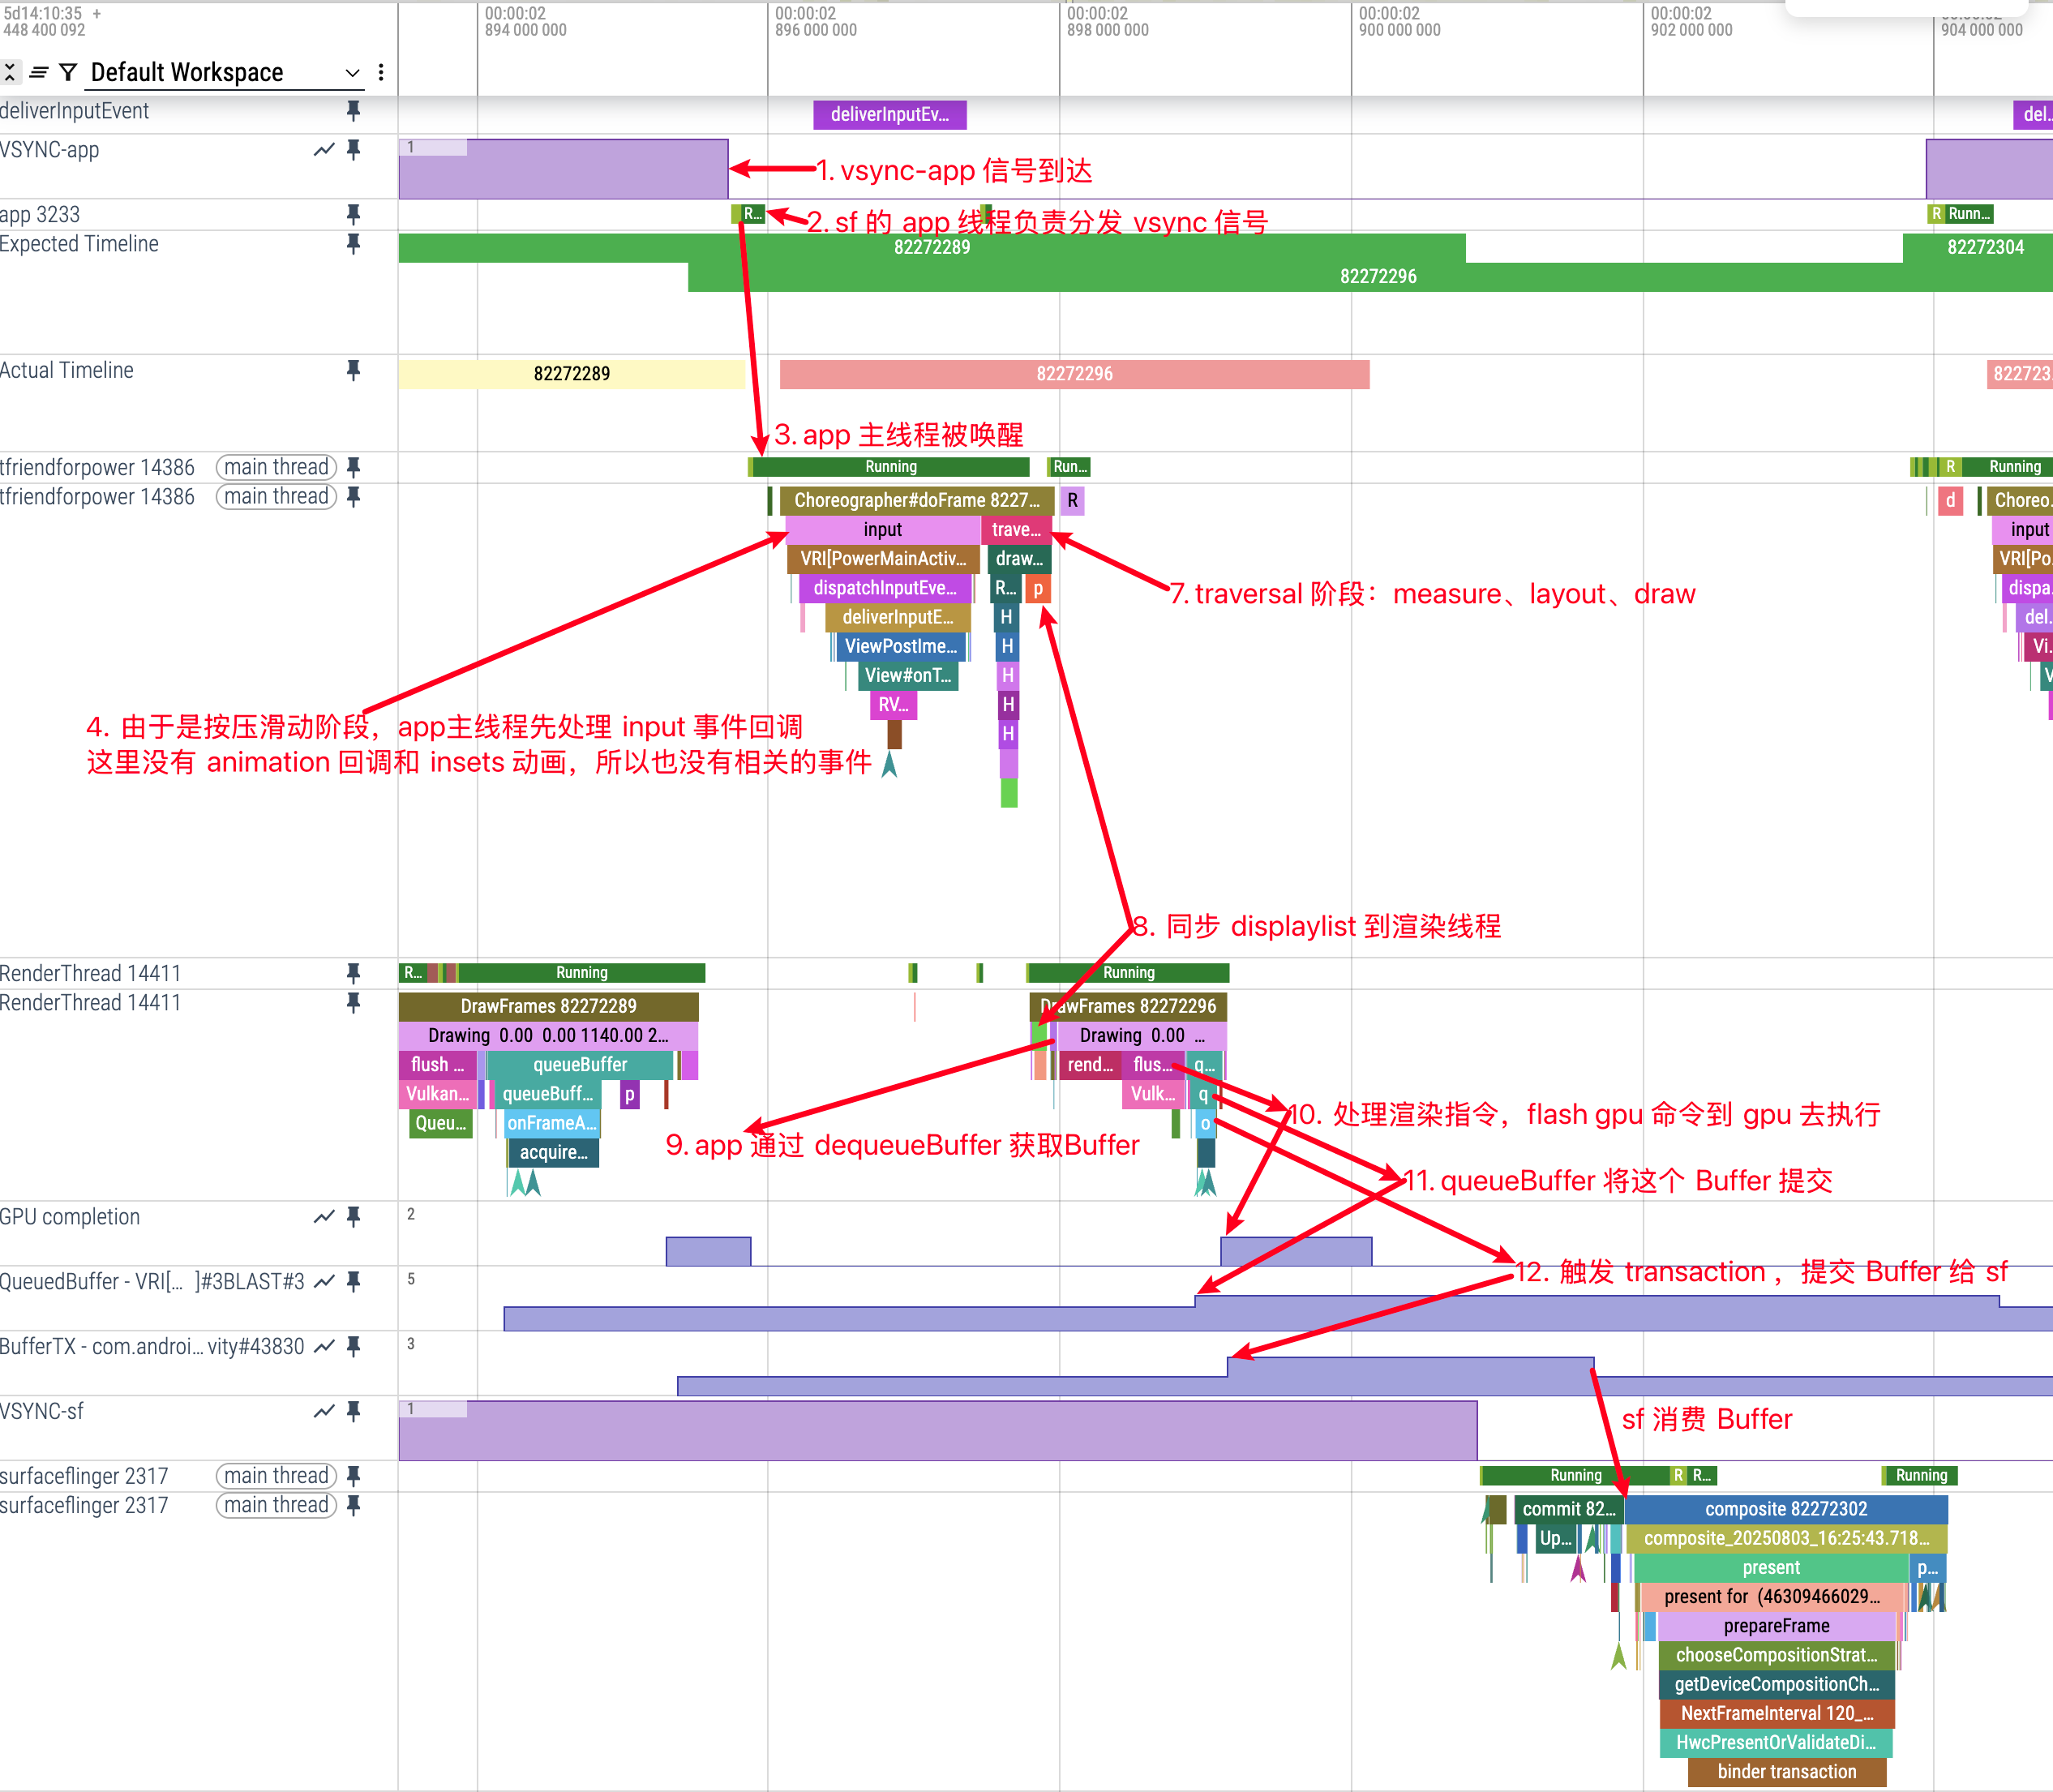
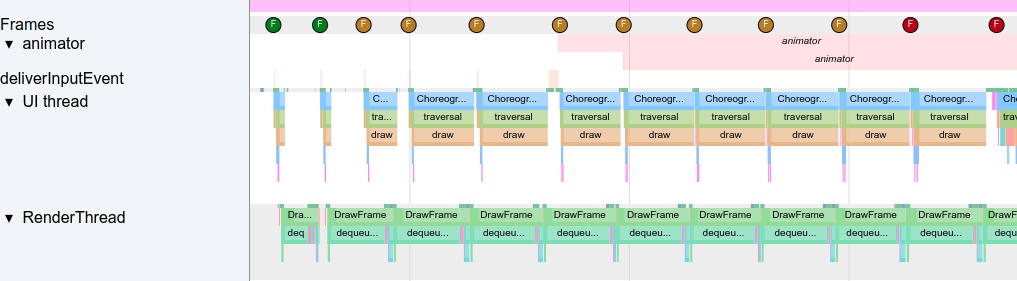
    
    
    <summary type="html">&lt;p&gt;I’ve been using OpenClaw heavily on my local machine for a while now. At first, I treated it like any other AI tool. But after wiring it into Telegram, Obsidian, scheduled tasks, local models, and my content workflow, I realized I had it completely wrong. &lt;strong&gt;Its real power isn’t answering questions – it’s doing sustained work on your behalf.&lt;/strong&gt; It can receive messages, call tools, run scheduled tasks, dispatch to different models, build long-term memory, write results back to Obsidian, and delegate complex tasks to other agents. If you’re only using it as a chatbot, you’re tapping maybe 20% of what it can do.&lt;/p&gt;</summary>


    <category term="AI" scheme="https://androidperformance.com/en/categories/AI/"/>
    
    
    <category term="AI" scheme="https://androidperformance.com/en/tags/AI/"/>
    
    <category term="OpenClaw" scheme="https://androidperformance.com/en/tags/OpenClaw/"/>
    
    <category term="AI Agent" scheme="https://androidperformance.com/en/tags/AI-Agent/"/>
    
  </entry>
  
  <entry>
    <title>Android Perfetto Series 10: Binder Scheduling and Lock Contention</title>
    <link href="https://androidperformance.com/en/2025/11/16/Android-Perfetto-10-Binder/"/>
    <id>https://androidperformance.com/en/2025/11/16/Android-Perfetto-10-Binder/</id>
    <published>2025-11-16T07:33:30.000Z</published>
    <updated>2026-05-10T23:29:51.058Z</updated>
    
    <content type="html"><![CDATA[<p>The tenth article in the Perfetto series focuses on <strong>Binder</strong>, Android’s core Inter-Process Communication (IPC) mechanism. Binder carries most interactions between system services and apps, and is often where latency and jank originate. This article uses signals from <code>linux.ftrace</code> (binder tracepoints + sched), <code>thread_state</code>, and ART Java monitor contention (via atrace <code>dalvik</code>) to provide a practical workflow for diagnosing transaction latency, thread-pool pressure, and lock contention.</p><span id="more"></span><h2 id="Table-of-Contents"><a href="#Table-of-Contents" class="headerlink" title="Table of Contents"></a>Table of Contents</h2><ul><li><a href="#series">Perfetto Series Catalog</a></li><li><a href="#basics">Binder Basics</a></li><li><a href="#setup">Perfetto Setup and Data Sources</a><ul><li><a href="#other-tools">Other Binder Analysis Tools</a></li></ul></li><li><a href="#workflow">Binder Analysis Workflow</a><ul><li><a href="#workflow-latency">Step 1: Identify Transaction Latency</a></li><li><a href="#workflow-threadpool">Step 2: Evaluate Thread Pool and Oneway Queue</a></li><li><a href="#workflow-lock">Step 3: Investigate Lock Contention</a></li></ul></li><li><a href="#case">Case Studies</a><ul><li><a href="#case-wm">Case 1: Window Management Delay</a></li><li><a href="#case-threadpool">Case 2: Binder Thread Pool Saturation</a></li></ul></li><li><a href="#platform-features">Platform Features and Best Practices</a></li><li><a href="#summary">Summary</a></li><li><a href="#refs">References</a></li><li><a href="#attachments">Attachments</a></li><li><a href="#about">About the Author &amp; Blog</a></li></ul><p><a id="series"></a></p><h2 id="Perfetto-Series-Catalog"><a href="#Perfetto-Series-Catalog" class="headerlink" title="Perfetto Series Catalog"></a>Perfetto Series Catalog</h2><ol><li><a href="https://www.androidperformance.com/en/2024/03/27/Android-Perfetto-101/">Android Perfetto Series Catalog</a></li><li><a href="https://www.androidperformance.com/en/2024/05/21/Android-Perfetto-01-What-is-perfetto/">Android Perfetto Series 1: Introduction to Perfetto</a></li><li><a href="https://www.androidperformance.com/en/2024/05/21/Android-Perfetto-02-how-to-get-perfetto/">Android Perfetto Series 2: Capturing Perfetto Traces</a></li><li><a href="https://www.androidperformance.com/en/2024/05/21/Android-Perfetto-03-how-to-analysis-perfetto/">Android Perfetto Series 3: Familiarizing with the Perfetto View</a></li><li><a href="https://www.androidperformance.com/en/2025/02/08/Android-Perfetto-04-Open-Big-Trace-With-Command-Line/">Android Perfetto Series 4: Opening Large Traces via Command Line</a></li><li><a href="https://www.androidperformance.com/en/2025/03/26/Android-Perfetto-05-Chorergrapher/">Android Perfetto Series 5: Choreographer-based Rendering Flow</a></li><li><a href="https://www.androidperformance.com/en/2025/04/26/Android-Perfetto-06-Why-120Hz/">Android Perfetto Series 6: Why 120Hz? Advantages and Challenges</a></li><li><a href="https://www.androidperformance.com/en/2025/08/02/Android-Perfetto-07-MainThread-And-RenderThread/">Android Perfetto Series 7: MainThread and RenderThread Deep Dive</a></li><li><a href="https://www.androidperformance.com/en/2025/08/05/Android-Perfetto-08-Vsync/">Android Perfetto Series 8: Understanding Vsync and Performance Analysis</a></li><li><a href="https://www.androidperformance.com/en/2025/11/12/Android-Perfetto-09-CPU/">Android Perfetto Series 9: Interpreting CPU Information</a></li><li><a href="https://www.androidperformance.com/2025/11/16/Android-Perfetto-10-Binder/">Android Perfetto Series 10: Binder Scheduling and Lock Contention (this article)</a></li><li><a href="https://www.bilibili.com/video/BV1oi82efE4D/?vd_source=0c6d2191e785de0a36dc21a9da7e664e">Video (Bilibili) - Android Perfetto Basics and Case Studies</a></li><li><a href="https://www.bilibili.com/video/BV17A6bBLECu/">Video (Bilibili) - Android Perfetto: Trace Graph Types - AOSP, WebView, Flutter + OEM System Optimization</a></li></ol><p><a id="basics"></a></p><h2 id="Binder-Basics"><a href="#Binder-Basics" class="headerlink" title="Binder Basics"></a>Binder Basics</h2><p>For readers encountering Binder for the first time, understanding its role and participants is crucial. You can roughly understand Binder as “cross-process function calls”: you write code in one process that looks like calling a local interface, while Binder handles the actual call and data transfer. Overall, it is Android’s primary Inter-Process Communication (IPC) mechanism, consisting of four core components:</p><ol><li><strong>Client</strong>: Application threads initiate calls through <code>IBinder.transact()</code>, writing <code>Parcel</code>-serialized data to the kernel.</li><li><strong>Service (Server)</strong>: Usually runs in SystemServer or other processes, reading <code>Parcel</code> and executing business logic through <code>Binder.onTransact()</code>.</li><li><strong>Binder Driver</strong>: The kernel module <code>/dev/binder</code> responsible for thread pool scheduling, buffer management, priority inheritance, etc., serving as the “messenger” connecting both parties.</li><li><strong>Thread Pool</strong>: The server typically maintains a set of Binder threads. Note that <strong>the thread pool is not created full from the start</strong>, but is created on demand. The Java layer defaults to approximately 15 Binder worker threads (excluding the main thread), and the Native layer can also configure the maximum thread count via <code>ProcessState</code> (default value is usually also 15). When all Binder threads are busy, new requests will queue in the driver layer waiting for idle threads.</li></ol><p><strong>Why is Binder needed?</strong></p><p>Android adopts a multi-process architecture to isolate applications, improve security, and stability. Each APK runs in an independent user space. When it needs to access system capabilities (camera, location, notifications, etc.), it must cross-process call the Framework or SystemServer.</p><p>Limitations of traditional IPC solutions:</p><table><thead><tr><th>IPC Method</th><th>Problem</th></tr></thead><tbody><tr><td>Socket</td><td>High overhead, lacks identity verification</td></tr><tr><td>Pipe</td><td>Only supports parent-child processes, one-way communication</td></tr><tr><td>Shared Memory</td><td>Needs additional synchronization mechanisms, lacks access control</td></tr></tbody></table><p>Binder solves these problems at the kernel layer, providing three key capabilities: first, <strong>identity and permission</strong> (based on UID&#x2F;PID verification to ensure the caller is legitimate); second, <strong>synchronous and asynchronous calls</strong> (in synchronous mode, the Client waits for the Server to return, which is the most common mode, while in asynchronous mode, the Client returns immediately after sending, suitable for scenarios like notifications and status reporting); third, <strong>priority inheritance</strong> (when a high-priority Client calls a low-priority Server, the Server temporarily elevates its priority to avoid priority inversion problems).</p><p>Therefore, when an app process calls <code>IActivityManager#attachApplication()</code> during startup, Binder is the channel that safely and reliably delivers that request to <code>system_server</code>.</p><h3 id="Case-from-App-Developer’s-Perspective"><a href="#Case-from-App-Developer’s-Perspective" class="headerlink" title="Case from App Developer’s Perspective"></a>Case from App Developer’s Perspective</h3><p>Suppose the trace contains <code>AIDL::java::IActivityManager::attachApplication::server</code>. This corresponds to a <strong>synchronous</strong> Binder call to <code>IActivityManager#attachApplication(...)</code>, handled by <code>ActivityManagerService</code> in <code>system_server</code>. The path is: on the <strong>Proxy side</strong>, app code gets <code>IActivityManager</code> via <code>ActivityManager.getService()</code>; the proxy <strong>serializes</strong> arguments into a <code>Parcel</code> and calls <code>transact()</code>; the Binder driver queues the transaction and wakes an idle <code>system_server</code> Binder thread (for example <code>Binder:1460_5</code>); on the <strong>Stub side</strong>, <code>ActivityManagerService</code> processes <code>attachApplication</code>; finally, the reply is marshaled back and the app thread resumes from <code>waitForResponse()</code>.</p><p>In Perfetto, this appears as one transaction on <strong>Android Binder &#x2F; Transactions</strong> (if AIDL info is decoded, the slice name is often <code>AIDL::java::IActivityManager::attachApplication::client/server</code>, or SQL shows <code>aidl_name=IActivityManager</code>, <code>method_name=attachApplication</code>); the app thread stays in <code>S</code> (Sleeping) with <code>blocked_function</code> often at <code>binder_thread_read</code> &#x2F; <code>epoll_wait</code> &#x2F; <code>ioctl(BINDER_WRITE_READ)</code>; a <code>system_server</code> Binder thread runs; and <strong>Flow arrows</strong> connect client and server work.</p><p><img src="/en/images/image-20260207113358540.webp" alt="image-20260207113358540"></p><p><a id="setup"></a></p><h2 id="Perfetto-Setup-and-Data-Sources"><a href="#Perfetto-Setup-and-Data-Sources" class="headerlink" title="Perfetto Setup and Data Sources"></a>Perfetto Setup and Data Sources</h2><p>To diagnose Binder in Perfetto, you need to prepare the data sources and Trace configuration in advance.</p><h3 id="Data-Sources-and-Track-Overview"><a href="#Data-Sources-and-Track-Overview" class="headerlink" title="Data Sources and Track Overview"></a>Data Sources and Track Overview</h3><p>Binder analysis needs to connect transaction events with scheduling, blocking, and lock signals. In practice, recording is mainly based on <code>linux.ftrace</code> (binder tracepoints + sched + optional atrace categories), plus lightweight process&#x2F;thread metadata.</p><p><strong><code>linux.ftrace</code> (kernel + atrace)</strong> is the baseline and works across Android versions. It captures kernel events like <code>binder_transaction</code> (transaction start), <code>binder_transaction_received</code> (server receives transaction), and <code>binder_transaction_alloc_buf</code> (buffer allocation, useful for TransactionTooLarge diagnostics). Combined with <code>sched_switch</code> &#x2F; <code>sched_waking</code>, it reconstructs the full chain: client call → server wakeup → server handling → reply.<br>You can also enable atrace categories inside <code>linux.ftrace</code>: <code>binder_driver</code> &#x2F; <code>am</code> &#x2F; <code>wm</code> for framework context, and <code>dalvik</code> for ART monitor contention (<code>synchronized</code> lock waits), which powers <strong>Thread &#x2F; Lock contention</strong> tracks in UI.</p><p><strong><code>linux.process_stats</code> (metadata)</strong> maps PID&#x2F;TID to process&#x2F;thread names for easier filtering in UI&#x2F;SQL, with negligible overhead.</p><blockquote><p><strong>Note</strong>: Perfetto UI tracks such as <strong>Android Binder &#x2F; Transactions</strong>, <strong>Android Binder &#x2F; Oneway Calls</strong>, and SQL stdlib modules like <code>android.binder</code> &#x2F; <code>android.monitor_contention</code> are parser-side derived views over raw trace events; they are not separate recording data sources.</p></blockquote><h3 id="Recommended-Trace-Config"><a href="#Recommended-Trace-Config" class="headerlink" title="Recommended Trace Config"></a>Recommended Trace Config</h3><p>The following configuration balances compatibility with new features and is recommended as a standard Binder analysis template. Save the configuration as <code>binder_config.pbtx</code> for use:</p><figure class="highlight protobuf"><table><tr><td class="gutter"><pre><span class="line">1</span><br><span class="line">2</span><br><span class="line">3</span><br><span class="line">4</span><br><span class="line">5</span><br><span class="line">6</span><br><span class="line">7</span><br><span class="line">8</span><br><span class="line">9</span><br><span class="line">10</span><br><span class="line">11</span><br><span class="line">12</span><br><span class="line">13</span><br><span class="line">14</span><br><span class="line">15</span><br><span class="line">16</span><br><span class="line">17</span><br><span class="line">18</span><br><span class="line">19</span><br><span class="line">20</span><br><span class="line">21</span><br><span class="line">22</span><br><span class="line">23</span><br><span class="line">24</span><br><span class="line">25</span><br><span class="line">26</span><br><span class="line">27</span><br><span class="line">28</span><br><span class="line">29</span><br><span class="line">30</span><br><span class="line">31</span><br><span class="line">32</span><br><span class="line">33</span><br><span class="line">34</span><br><span class="line">35</span><br><span class="line">36</span><br><span class="line">37</span><br><span class="line">38</span><br><span class="line">39</span><br><span class="line">40</span><br><span class="line">41</span><br><span class="line">42</span><br><span class="line">43</span><br><span class="line">44</span><br><span class="line">45</span><br><span class="line">46</span><br><span class="line">47</span><br><span class="line">48</span><br><span class="line">49</span><br><span class="line">50</span><br><span class="line">51</span><br><span class="line">52</span><br><span class="line">53</span><br><span class="line">54</span><br><span class="line">55</span><br><span class="line">56</span><br><span class="line">57</span><br><span class="line">58</span><br><span class="line">59</span><br><span class="line">60</span><br><span class="line">61</span><br><span class="line">62</span><br><span class="line">63</span><br><span class="line">64</span><br><span class="line">65</span><br><span class="line">66</span><br><span class="line">67</span><br></pre></td><td class="code"><pre><span class="line"># ============================================================</span><br><span class="line"># Perfetto configuration dedicated to Binder analysis</span><br><span class="line"># Applicable scope: Android <span class="number">10</span>+ (Android <span class="number">12</span>+ is generally easier operationally)</span><br><span class="line"># ============================================================</span><br><span class="line"></span><br><span class="line"># --- Buffer and duration settings ---</span><br><span class="line">buffers &#123;</span><br><span class="line">  size_kb: <span class="number">65536</span>          # <span class="number">64</span>MB buffer, suitable for medium complexity scenarios</span><br><span class="line">  fill_policy: RING_BUFFER</span><br><span class="line">&#125;</span><br><span class="line">duration_ms: <span class="number">15000</span>        # <span class="number">15</span> second capture duration, adjustable as needed</span><br><span class="line"></span><br><span class="line"># --- Data source <span class="number">1</span>: linux.ftrace (kernel + atrace) ---</span><br><span class="line"># Baseline source: Binder tracepoints + sched events + <span class="keyword">optional</span> atrace categories</span><br><span class="line">data_sources &#123;</span><br><span class="line">  config &#123;</span><br><span class="line">    name: <span class="string">&quot;linux.ftrace&quot;</span></span><br><span class="line">    ftrace_config &#123;</span><br><span class="line">      # Binder core events</span><br><span class="line">      ftrace_events: <span class="string">&quot;binder/binder_transaction&quot;</span>           # Transaction start</span><br><span class="line">      ftrace_events: <span class="string">&quot;binder/binder_transaction_received&quot;</span>  # Server received transaction</span><br><span class="line">      ftrace_events: <span class="string">&quot;binder/binder_transaction_alloc_buf&quot;</span> # Buffer allocation (diagnose TransactionTooLarge)</span><br><span class="line">      ftrace_events: <span class="string">&quot;binder/binder_set_priority&quot;</span>          # Priority inheritance</span><br><span class="line">      ftrace_events: <span class="string">&quot;binder/binder_lock&quot;</span>                  # Kernel lock (usually can be omitted)</span><br><span class="line">      ftrace_events: <span class="string">&quot;binder/binder_locked&quot;</span></span><br><span class="line">      ftrace_events: <span class="string">&quot;binder/binder_unlock&quot;</span></span><br><span class="line"></span><br><span class="line">      # Scheduling events (connect Client/Server threads)</span><br><span class="line">      ftrace_events: <span class="string">&quot;sched/sched_switch&quot;</span></span><br><span class="line">      ftrace_events: <span class="string">&quot;sched/sched_waking&quot;</span></span><br><span class="line">      ftrace_events: <span class="string">&quot;sched/sched_wakeup&quot;</span></span><br><span class="line">      ftrace_events: <span class="string">&quot;sched/sched_blocked_reason&quot;</span>          # Blocking reason</span><br><span class="line"></span><br><span class="line">      # Optional: Application layer trace points (need atrace)</span><br><span class="line">      atrace_categories: <span class="string">&quot;binder_driver&quot;</span>   # Binder driver layer</span><br><span class="line">      atrace_categories: <span class="string">&quot;sched&quot;</span>           # Scheduling</span><br><span class="line">      atrace_categories: <span class="string">&quot;am&quot;</span>              # ActivityManager</span><br><span class="line">      atrace_categories: <span class="string">&quot;wm&quot;</span>              # WindowManager</span><br><span class="line">      atrace_categories: <span class="string">&quot;dalvik&quot;</span>          # Java Monitor Contention</span><br><span class="line">      # atrace_categories: <span class="string">&quot;view&quot;</span>          # Enable if analyzing UI</span><br><span class="line"></span><br><span class="line">      # To capture app-side atrace slices (e.g. doFrame / custom trace), you can set:</span><br><span class="line">      # atrace_apps: <span class="string">&quot;your.app.package&quot;</span></span><br><span class="line">      # Or capture all apps (larger trace):</span><br><span class="line">      # atrace_apps: <span class="string">&quot;*&quot;</span></span><br><span class="line"></span><br><span class="line">      # Symbolize kernel call stack</span><br><span class="line">      symbolize_ksyms: <span class="literal">true</span></span><br><span class="line"></span><br><span class="line">      # Optimize scheduling event storage, reduce Trace size</span><br><span class="line">      compact_sched &#123;</span><br><span class="line">        enabled: <span class="literal">true</span></span><br><span class="line">      &#125;</span><br><span class="line">    &#125;</span><br><span class="line">  &#125;</span><br><span class="line">&#125;</span><br><span class="line"></span><br><span class="line"># --- Data source <span class="number">2</span>: linux.process_stats (process information) ---</span><br><span class="line"># Provide basic information like process name, PID</span><br><span class="line">data_sources &#123;</span><br><span class="line">  config &#123;</span><br><span class="line">    name: <span class="string">&quot;linux.process_stats&quot;</span></span><br><span class="line">    process_stats_config &#123;</span><br><span class="line">      scan_all_processes_on_start: <span class="literal">true</span></span><br><span class="line">    &#125;</span><br><span class="line">  &#125;</span><br><span class="line">&#125;</span><br></pre></td></tr></table></figure><h4 id="Configuration-Item-Description"><a href="#Configuration-Item-Description" class="headerlink" title="Configuration Item Description"></a>Configuration Item Description</h4><table><thead><tr><th>Data Source</th><th>Purpose</th><th>Android Version Requirement</th><th>Overhead</th></tr></thead><tbody><tr><td><code>linux.ftrace</code> (binder&#x2F;*)</td><td>Kernel-layer Binder events</td><td>All versions</td><td>Low</td></tr><tr><td><code>linux.ftrace</code> (sched&#x2F;*)</td><td>Scheduling events, connecting thread wakeups</td><td>All versions</td><td>Medium</td></tr><tr><td><code>linux.ftrace</code> (atrace: dalvik&#x2F;…)</td><td>Framework slices + Java Monitor Contention</td><td>All versions (fields evolve by release)</td><td>Low-Medium</td></tr><tr><td><code>linux.process_stats</code></td><td>Process name and PID mapping</td><td>All versions</td><td>Very low</td></tr></tbody></table><blockquote><p><strong>Tip</strong>: This workflow only depends on <code>linux.ftrace</code> (binder tracepoints + sched + dalvik), so the approach is largely consistent on Android 12&#x2F;13&#x2F;14+. UI field names can vary by version; use SQL stdlib for normalization when needed.</p></blockquote><h3 id="Quick-Start-3-Steps-to-Capture-and-View-Binder-Trace"><a href="#Quick-Start-3-Steps-to-Capture-and-View-Binder-Trace" class="headerlink" title="Quick Start: 3 Steps to Capture and View Binder Trace"></a>Quick Start: 3 Steps to Capture and View Binder Trace</h3><ol><li><p><strong>Capture Trace</strong>:</p><figure class="highlight bash"><table><tr><td class="gutter"><pre><span class="line">1</span><br><span class="line">2</span><br><span class="line">3</span><br><span class="line">4</span><br><span class="line">5</span><br><span class="line">6</span><br><span class="line">7</span><br><span class="line">8</span><br><span class="line">9</span><br><span class="line">10</span><br><span class="line">11</span><br></pre></td><td class="code"><pre><span class="line"><span class="comment"># Push configuration</span></span><br><span class="line">adb push binder_config.pbtx /data/local/tmp/</span><br><span class="line"></span><br><span class="line"><span class="comment"># Start capture</span></span><br><span class="line">adb shell perfetto --txt -c /data/local/tmp/binder_config.pbtx \</span><br><span class="line">    -o /data/misc/perfetto-traces/trace.pftrace</span><br><span class="line"></span><br><span class="line"><span class="comment"># ... operate phone to reproduce lag ...</span></span><br><span class="line"></span><br><span class="line"><span class="comment"># Pull file out</span></span><br><span class="line">adb pull /data/misc/perfetto-traces/trace.pftrace .</span><br></pre></td></tr></table></figure></li><li><p><strong>Open Trace</strong>: Visit <a href="https://ui.perfetto.dev/">ui.perfetto.dev</a>, drag in the trace file.</p></li><li><p><strong>Add Key Tracks</strong>:</p><ul><li>Left side click <strong>Tracks</strong> → <strong>Add new track</strong></li><li>Search “Binder”, add <strong>Android Binder &#x2F; Transactions</strong> and <strong>Android Binder &#x2F; Oneway Calls</strong></li><li>Search “Lock”, add <strong>Thread &#x2F; Lock contention</strong> (if data available)</li></ul></li></ol><p><a id="other-tools"></a></p><h3 id="Other-Binder-Analysis-Tools"><a href="#Other-Binder-Analysis-Tools" class="headerlink" title="Other Binder Analysis Tools"></a>Other Binder Analysis Tools</h3><p>Besides Perfetto, two tools are often useful: <code>am trace-ipc</code> (built in) and <code>binder-trace</code> (open source, stronger content inspection but higher setup cost).</p><h4 id="am-trace-ipc-Java-Layer-Binder-Call-Tracking"><a href="#am-trace-ipc-Java-Layer-Binder-Call-Tracking" class="headerlink" title="am trace-ipc: Java Layer Binder Call Tracking"></a>am trace-ipc: Java Layer Binder Call Tracking</h4><p><code>am trace-ipc</code> tracks Java-layer Binder call stacks. It enables Binder stack tracking in target processes (<code>BinderProxy.transact()</code> path) and exports aggregated stacks on stop. It is <strong>zero-config</strong> and does not require root.</p><p>Basic usage is very simple, just three steps: “start → operate → stop and export”:</p><figure class="highlight bash"><table><tr><td class="gutter"><pre><span class="line">1</span><br><span class="line">2</span><br><span class="line">3</span><br><span class="line">4</span><br><span class="line">5</span><br><span class="line">6</span><br><span class="line">7</span><br><span class="line">8</span><br><span class="line">9</span><br><span class="line">10</span><br></pre></td><td class="code"><pre><span class="line"><span class="comment"># 1. Start tracking (records Binder calls for eligible processes, usually debuggable ones)</span></span><br><span class="line">adb shell am trace-ipc start</span><br><span class="line"></span><br><span class="line"><span class="comment"># 2. Execute the operation you want to analyze on the phone (like starting an app, triggering lag scenarios, etc.)</span></span><br><span class="line"></span><br><span class="line"><span class="comment"># 3. Stop tracking and export results to file</span></span><br><span class="line">adb shell am trace-ipc stop --dump-file /data/local/tmp/ipc-trace.txt</span><br><span class="line"></span><br><span class="line"><span class="comment"># 4. Pull the result file to computer to view</span></span><br><span class="line">adb pull /data/local/tmp/ipc-trace.txt</span><br></pre></td></tr></table></figure><p>The output is plain text, for example:</p><figure class="highlight plaintext"><table><tr><td class="gutter"><pre><span class="line">1</span><br><span class="line">2</span><br><span class="line">3</span><br><span class="line">4</span><br><span class="line">5</span><br><span class="line">6</span><br><span class="line">7</span><br></pre></td><td class="code"><pre><span class="line">Traces for process: com.example.app</span><br><span class="line">Count: 15</span><br><span class="line">java.lang.Throwable</span><br><span class="line">    at android.os.BinderProxy.transact(BinderProxy.java:xxx)</span><br><span class="line">    at android.app.IActivityManager$Stub$Proxy.startActivity(...)</span><br><span class="line">    at android.app.Instrumentation.execStartActivity(...)</span><br><span class="line">    ...</span><br></pre></td></tr></table></figure><p>It groups stacks by process and counts occurrences, which quickly answers: “which services were called, and how often”.</p><p><strong>Using with Perfetto</strong>: Perfetto provides timing, scheduling, and flow context; <code>trace-ipc</code> tells you exactly which Java call sites initiated Binder traffic.</p><p>Best for: validating frequent IPC as ANR&#x2F;jank cause, and pinpointing Java-origin call sites.</p><h4 id="binder-trace-Real-time-Binder-Message-Parsing"><a href="#binder-trace-Real-time-Binder-Message-Parsing" class="headerlink" title="binder-trace: Real-time Binder Message Parsing"></a>binder-trace: Real-time Binder Message Parsing</h4><p><a href="https://github.com/foundryzero/binder-trace">binder-trace</a> can intercept and parse Binder messages in real time, often described as “Wireshark for Binder”.</p><p>It relies on Frida dynamic instrumentation, so you typically need root (or emulator), frida-server on device, and Python 3.9+ locally. Example:</p><figure class="highlight bash"><table><tr><td class="gutter"><pre><span class="line">1</span><br><span class="line">2</span><br></pre></td><td class="code"><pre><span class="line"><span class="comment"># Track Binder communication for a specific app (-d specifies device, -n specifies process name, -a specifies Android version)</span></span><br><span class="line">binder-trace -d emulator-5554 -n com.example.app -a 11</span><br></pre></td></tr></table></figure><p>It supports filtering by interface&#x2F;method&#x2F;transaction type and is best for security and reverse-engineering workflows where payload semantics matter. For routine performance triage, Perfetto + <code>am trace-ipc</code> is usually enough.</p><p><a id="workflow"></a></p><h2 id="Binder-Analysis-Workflow"><a href="#Binder-Analysis-Workflow" class="headerlink" title="Binder Analysis Workflow"></a>Binder Analysis Workflow</h2><p>After getting the Trace, don’t just fish in the ocean. It’s recommended to proceed in the order of “find target → look at latency → check threads → find locks”.</p><p><a id="workflow-latency"></a></p><h3 id="Step-1-Identify-Transaction-Latency"><a href="#Step-1-Identify-Transaction-Latency" class="headerlink" title="Step 1: Identify Transaction Latency"></a>Step 1: Identify Transaction Latency</h3><p>The first step is finding the transaction you care about. In Perfetto, common entry points are: find your app as <code>Client</code> on the <code>Transactions</code> track; search with <code>/</code> by interface&#x2F;method (for example <code>IActivityManager</code> &#x2F; <code>attachApplication</code>) or full slice name (for example <code>AIDL::java::IActivityManager::attachApplication::server</code>); or start from long <code>S</code> segments on UI-thread <code>thread_state</code> when diagnosing jank.</p><p>After selecting a Transaction slice, the Details panel shows client&#x2F;server threads, timestamps, and durations. UI fields vary by version, so use SQL <code>android_binder_txns</code> as the stable baseline:</p><ul><li><code>client_dur</code>: end-to-end client duration (for sync calls, roughly “time waiting for Binder return”)</li><li><code>server_dur</code>: server wall-clock duration from handling start to reply</li><li><code>dispatch_dur = server_ts - client_ts</code>: delay before server actually starts handling (often queueing&#x2F;scheduling pressure)</li></ul><p>Run this in Perfetto SQL to list slow synchronous transactions:</p><figure class="highlight sql"><table><tr><td class="gutter"><pre><span class="line">1</span><br><span class="line">2</span><br><span class="line">3</span><br><span class="line">4</span><br><span class="line">5</span><br><span class="line">6</span><br><span class="line">7</span><br><span class="line">8</span><br><span class="line">9</span><br><span class="line">10</span><br><span class="line">11</span><br><span class="line">12</span><br><span class="line">13</span><br><span class="line">14</span><br><span class="line">15</span><br><span class="line">16</span><br></pre></td><td class="code"><pre><span class="line">INCLUDE PERFETTO <span class="keyword">MODULE</span> android.binder;</span><br><span class="line"></span><br><span class="line"><span class="keyword">SELECT</span></span><br><span class="line">  aidl_name,</span><br><span class="line">  method_name,</span><br><span class="line">  client_process,</span><br><span class="line">  client_thread,</span><br><span class="line">  client_dur <span class="operator">/</span> <span class="number">1e6</span> <span class="keyword">AS</span> client_ms,</span><br><span class="line">  server_process,</span><br><span class="line">  server_thread,</span><br><span class="line">  server_dur <span class="operator">/</span> <span class="number">1e6</span> <span class="keyword">AS</span> server_ms,</span><br><span class="line">  (server_ts <span class="operator">-</span> client_ts) <span class="operator">/</span> <span class="number">1e6</span> <span class="keyword">AS</span> dispatch_ms</span><br><span class="line"><span class="keyword">FROM</span> android_binder_txns</span><br><span class="line"><span class="keyword">WHERE</span> is_sync</span><br><span class="line"><span class="keyword">ORDER</span> <span class="keyword">BY</span> client_dur <span class="keyword">DESC</span></span><br><span class="line">LIMIT <span class="number">20</span>;</span><br></pre></td></tr></table></figure><p><img src="/en/images/image-20260207110047680.webp" alt="image-20260207110047680"></p><p>These relationships determine next steps: if <code>client_dur</code> is long but <code>server_dur</code> is short, the bottleneck is likely dispatch&#x2F;queueing; if <code>server_dur</code> itself is long, inspect what the server Binder thread is doing (business logic, lock wait, or I&#x2F;O).</p><p><a id="workflow-threadpool"></a></p><h3 id="Step-2-Evaluate-Thread-Pool-and-Oneway-Queue"><a href="#Step-2-Evaluate-Thread-Pool-and-Oneway-Queue" class="headerlink" title="Step 2: Evaluate Thread Pool and Oneway Queue"></a>Step 2: Evaluate Thread Pool and Oneway Queue</h3><p>If Step 1 analysis finds that latency is mainly not in server-side processing, but in “queuing”, then you need to further check the status of the Binder thread pool. Before deep analysis, first answer a frequently asked question: <strong>“approximately how many Binder threads does each process have? What’s the scale of system_server’s Binder thread pool? Under what circumstances will it be ‘exhausted’?”</strong></p><h4 id="SystemServer’s-Binder-Thread-Pool-Scale"><a href="#SystemServer’s-Binder-Thread-Pool-Scale" class="headerlink" title="SystemServer’s Binder Thread Pool Scale"></a>SystemServer’s Binder Thread Pool Scale</h4><p>In upstream AOSP (Android 14&#x2F;15), the Binder thread pool design philosophy is: <strong>grow on demand, configurable, no single fixed number</strong>.</p><ul><li><strong>Thread pool grows on demand</strong>: Each server process maintains a thread pool in the Binder driver, where the actual number of threads increases or decreases according to load on demand, with the upper limit jointly determined by the <code>max_threads</code> field in the kernel and user-space configurations like <code>ProcessState#setThreadPoolMaxThreadCount()</code>.</li><li><strong>Typical upper limit depends on process role</strong>: app processes are usually around <strong>15</strong> Binder workers (libbinder default), while <code>system_server</code> raises the cap explicitly at boot; current AOSP sets it to <strong>31</strong>.<br>Some vendor ROMs or custom kernels will adjust the upper limit up or down based on their own load models (for example, adjusting to dozens of threads), so when you see specific numbers through <code>ps -T system_server</code>, <code>top -H</code>, or counting <code>Binder:</code> threads in Perfetto on different devices, there may be differences.</li><li><strong>Take actual observation as standard, not memorizing a number</strong>: In Perfetto, a more recommended approach is to directly expand a process and see how many <code>Binder:xxx_y</code> thread tracks there are, and their activity level during the Trace capture, to evaluate the thread pool’s “scale” and “busyness”.</li></ul><h4 id="Binder-Thread-Count-Buffer-and-“Binder-Exhaustion”"><a href="#Binder-Thread-Count-Buffer-and-“Binder-Exhaustion”" class="headerlink" title="Binder Thread Count, Buffer, and “Binder Exhaustion”"></a>Binder Thread Count, Buffer, and “Binder Exhaustion”</h4><p>In performance analysis, when people mention “Binder count”, they often confuse three different types of resource limits:</p><p><strong>Binder thread-pool exhaustion</strong> means all Binder workers in a process are busy (<code>Running</code> &#x2F; <code>D</code> &#x2F; <code>S</code>), with no idle thread available for new transactions. You’ll often see client threads stuck in <code>S</code> at <code>ioctl(BINDER_WRITE_READ)</code> &#x2F; <code>epoll_wait</code>, and many transactions with large <code>dispatch_dur</code> (<code>server_ts - client_ts</code>) in SQL. In <code>system_server</code>, this can quickly amplify into <strong>global jank or ANR</strong>.</p><p><strong>Binder transaction buffer exhaustion</strong> involves a shared buffer of limited size (typical value about <strong>1MB magnitude</strong>) that each process has in the Binder driver, used to carry <code>Parcel</code> data being transmitted. Typical scenarios include one transaction transmitting an object that’s too large (like a large Bitmap, extra long string, large array, etc.), and a large number of concurrent transactions not yet consumed, causing too many unreleased <code>Parcel</code>s to pile up in the buffer. Possible results include kernel logs showing <code>binder_transaction_alloc_buf</code> failures, Java layer throwing <code>TransactionTooLargeException</code>, and subsequent transactions queuing for a long time or even failing in the driver layer (looks like “Binder is used up”). The solution to such problems is <strong>not</strong> to “open more threads”, but to control the data amount per transmission (split packets, paging, streaming protocols), and prioritize using <code>SharedMemory</code> &#x2F; files &#x2F; <code>ParcelFileDescriptor</code> and other mechanisms for large block data.</p><p><strong>Binder reference table &#x2F; object count</strong>: The Binder driver maintains reference tables and node objects for each process, and these also have upper limits, but in most actual scenarios, they rarely hit this first. Common risk is holding a large number of Binder references for a long time without releasing, more manifesting as <strong>memory&#x2F;stability issues</strong>, not UI lag.</p><p>When analyzing in Perfetto, you can carry a judgment framework:<br><strong>“Is the current slowness because the thread pool is full, or because transactions are too large&#x2F;buffer is used up?”</strong><br>The former mainly looks at <strong>Binder thread count and <code>thread_state</code></strong>, plus <code>dispatch_dur</code>; the latter focuses on <strong>transaction size, concurrency, and <code>TransactionTooLargeException</code> &#x2F; <code>binder_transaction_alloc_buf</code> signs</strong>.</p><hr><p>Now return to the analysis scenario:</p><p>Thread-pool pressure directly limits service-side concurrency. For sync transactions, if server Binder threads stay busy (<code>Running</code> &#x2F; <code>D</code>) for long periods, new requests queue and clients block at <code>ioctl(BINDER_WRITE_READ)</code> &#x2F; <code>epoll_wait</code>; on UI, this is often visible as long <code>S</code> segments.</p><p>In Perfetto, prioritize two signals: <strong>whether Binder threads are persistently saturated</strong>, and whether <strong><code>dispatch_dur</code> is consistently larger than <code>server_dur</code></strong> (same criterion as Step 1).</p><p><strong>Identifying Oneway calls in Perfetto</strong>: sync calls block client threads (<code>thread_state</code> shows <code>S</code>) and typically show transaction → reply flow; oneway calls return immediately, have one-way flow only, and can be filtered with <code>android_binder_txns.is_sync = 0</code> in SQL.</p><p>When analyzing Oneway-related issues, focus on two things: first, the server-side queue depth (if Oneway requests on the same <code>IBinder</code> object pile up, the actual execution timing of subsequent requests will be continuously delayed); second, whether there’s a batch sending pattern (a large number of Oneway calls in a short time will form “spikes”, appearing as densely arranged short Slices on server-side Binder threads in Perfetto).</p><!-- TODO: Insert screenshot - Oneway call in Perfetto (one-way arrow, no reply) --><p>It’s worth mentioning that SystemServer’s Binder threads not only need to handle requests from various Apps, but also handle system internal calls (like AMS calling WMS, WMS calling SurfaceFlinger, etc.). If a “misbehaving” App frantically sends Oneway requests in a short time, it might fill up a certain system service’s Oneway queue, further affecting other Apps’ asynchronous callback latency, causing a global lag feeling.</p><p><a id="workflow-lock"></a></p><h3 id="Step-3-Investigate-Lock-Contention"><a href="#Step-3-Investigate-Lock-Contention" class="headerlink" title="Step 3: Investigate Lock Contention"></a>Step 3: Investigate Lock Contention</h3><p>If you jump to the server-side Binder thread and find it stays in <code>S</code> (Sleeping) or <code>D</code> (Disk Sleep &#x2F; Uninterruptible Sleep) state for a long time while processing your request, it usually means it’s waiting for some resource – either waiting for a lock or waiting for IO. Lock contention is a very common source of performance bottlenecks in SystemServer, because SystemServer runs a large number of services that share a lot of global state, and this state is often protected by <code>synchronized</code> locks.</p><p><strong>Java locks (Monitor Contention)</strong> is the most common situation. There are quite a few global locks in SystemServer, like WindowManagerService’s <code>mGlobalLock</code>, some internal locks of ActivityManagerService, etc. When multiple threads simultaneously need to access resources protected by these locks, contention occurs. In Perfetto, if you see a Binder thread state as <code>S</code>, and the <code>blocked_function</code> field contains symbols related to <code>futex</code> (like <code>futex_wait</code>), you can basically be sure it’s waiting for a Java lock. To further confirm which lock it’s waiting for and who’s holding it, you can check the <code>Lock contention</code> track. Perfetto will visualize the lock contention relationship: marking the Owner (thread holding the lock, like the <code>android.display</code> thread) and Waiter (thread waiting for the lock, like the <code>Binder:123_1</code> processing your request) with connection lines. Clicking the Contention Slice, you can also see the lock object’s class name (like <code>com.android.server.wm.WindowManagerGlobalLock</code>) in the Details panel, which is very helpful for understanding the root cause of the problem.</p><!-- TODO: Insert screenshot - Lock contention track, showing Owner and Waiter connection lines --><p><strong>Native locks (Mutex &#x2F; RwLock)</strong> situations are relatively rarer, but can be encountered in some scenarios. Manifestations are similar: thread state is <code>D</code> or <code>S</code>, but the call stack shows symbols from the Native layer like <code>__mutex_lock</code>, <code>pthread_mutex_lock</code>, <code>rwsem</code>, not Java’s <code>futex_wait</code>. Analyzing such problems usually needs to combine <code>sched_blocked_reason</code> events to see what the thread is specifically waiting for, belonging to relatively advanced content, so we won’t expand on it here.</p><h4 id="SQL-for-Java-Monitor-Contention-in-system-server-Optional"><a href="#SQL-for-Java-Monitor-Contention-in-system-server-Optional" class="headerlink" title="SQL for Java Monitor Contention in system_server (Optional)"></a>SQL for Java Monitor Contention in <code>system_server</code> (Optional)</h4><p>Perfetto stdlib provides parsed <code>android_monitor_contention</code>; use it directly instead of manually parsing slice names:</p><figure class="highlight sql"><table><tr><td class="gutter"><pre><span class="line">1</span><br><span class="line">2</span><br><span class="line">3</span><br><span class="line">4</span><br><span class="line">5</span><br><span class="line">6</span><br><span class="line">7</span><br><span class="line">8</span><br><span class="line">9</span><br><span class="line">10</span><br><span class="line">11</span><br><span class="line">12</span><br><span class="line">13</span><br><span class="line">14</span><br><span class="line">15</span><br><span class="line">16</span><br></pre></td><td class="code"><pre><span class="line">INCLUDE PERFETTO <span class="keyword">MODULE</span> android.monitor_contention;</span><br><span class="line"></span><br><span class="line"><span class="keyword">SELECT</span></span><br><span class="line">  process_name,</span><br><span class="line">  blocked_thread_name <span class="keyword">AS</span> waiter_thread,</span><br><span class="line">  blocking_thread_name <span class="keyword">AS</span> owner_thread,</span><br><span class="line">  (dur <span class="operator">/</span> <span class="number">1e6</span>) <span class="keyword">AS</span> dur_ms,</span><br><span class="line">  (waiter_count <span class="operator">+</span> <span class="number">1</span>) <span class="keyword">AS</span> waiter_threads,</span><br><span class="line">  short_blocked_method,</span><br><span class="line">  short_blocking_method,</span><br><span class="line">  blocked_src,</span><br><span class="line">  blocking_src</span><br><span class="line"><span class="keyword">FROM</span> android_monitor_contention</span><br><span class="line"><span class="keyword">WHERE</span> process_name <span class="operator">=</span> <span class="string">&#x27;system_server&#x27;</span></span><br><span class="line"><span class="keyword">ORDER</span> <span class="keyword">BY</span> dur <span class="keyword">DESC</span></span><br><span class="line">LIMIT <span class="number">50</span>;</span><br></pre></td></tr></table></figure><blockquote><p><strong>Tip</strong>: if this returns nothing, make sure <code>atrace_categories</code> includes <code>dalvik</code> and contention actually occurred during capture.</p></blockquote><p><img src="/en/images/image-20260207105941270.webp" alt="image-20260207105941270"></p><p><a id="case"></a><br><a id="case-wm"></a></p><h2 id="Case-Study-Window-Management-Delay"><a href="#Case-Study-Window-Management-Delay" class="headerlink" title="Case Study: Window Management Delay"></a>Case Study: Window Management Delay</h2><p>A real case to demonstrate the workflow: <strong>startup animation stutter</strong>.</p><p><strong>1. Discover Anomaly</strong></p><p>On the app <code>UI Thread</code>, one <code>doFrame</code> takes 30ms (vs. 16.6ms budget at 60Hz). The corresponding <code>thread_state</code> shows the main thread in <code>S</code> for 18ms, meaning it is mostly waiting.</p><!-- TODO: Insert screenshot - UI Thread's doFrame duration anomaly, thread_state shows S state --><p><strong>2. Track Binder Call</strong></p><p>The 18ms <code>S</code> segment shows a call to <code>IActivityTaskManager.startActivity</code>. Flow points to <code>system_server</code> thread <code>Binder:1605_2</code>, which handles the request.</p><!-- TODO: Insert screenshot - Flow arrow from App main thread pointing to system_server's Binder thread --><p><strong>3. Server-side Analysis</strong></p><p>On <code>Binder:1605_2</code>, execution lasts about 15ms and <code>Lock contention</code> shows a clear wait segment.</p><p><strong>4. Pin Down the Culprit</strong></p><p>Details show the thread waits on <code>com.android.server.wm.WindowManagerGlobalLock</code>, owned by <code>android.anim</code>, for about 12ms.</p><!-- TODO: Insert screenshot - Lock contention's Details panel, showing lock object and holder --><p><strong>Conclusion</strong>: <code>startActivity</code> is blocked by <code>WindowManagerGlobalLock</code> on the server side, which expands into a user-visible jank frame.</p><p><strong>Optimization direction</strong>: hard to fully fix from app side, but you can reduce startup IPC and avoid complex window operations during animation-heavy windows.</p><hr><p><a id="case-threadpool"></a></p><h2 id="Case-Study-Binder-Thread-Pool-Saturation"><a href="#Case-Study-Binder-Thread-Pool-Saturation" class="headerlink" title="Case Study: Binder Thread Pool Saturation"></a>Case Study: Binder Thread Pool Saturation</h2><p>Another case: <strong>multiple apps start simultaneously and the whole system feels sluggish</strong>.</p><p><strong>1. Discover Anomaly</strong></p><p>Multiple app main threads stay in <code>S</code> during the same interval and are all waiting for Binder returns, matching user-reported global responsiveness drops.</p><p><strong>2. Check SystemServer’s Thread Pool Status</strong></p><p>In <code>system_server</code>, almost all <code>Binder:</code> threads remain busy with little idle gap, indicating thread-pool saturation.</p><!-- TODO: Insert screenshot - system_server's Binder threads all in busy state --><p><strong>3. Analyze Queuing</strong></p><p>Reuse the Step-1 criterion: if many transactions show <code>dispatch_dur</code> much larger than <code>server_dur</code>, latency is mainly queueing, not per-call server work.</p><p><strong>4. Locate Root Cause</strong></p><p>Transaction breakdown shows one background app issuing hundreds of <code>IPackageManager</code> queries in a short burst. Each call is short (~5ms), but the volume is enough to saturate the pool.</p><p><strong>Conclusion</strong>: bursty batch Binder calls can crowd out <code>system_server</code> capacity and amplify into system-wide lag.</p><p><strong>Optimization direction</strong>: avoid looped IPC; prefer batch APIs (for example <code>getPackagesForUid</code>) plus throttling&#x2F;batching. System-side options include service rate-limits and hotspot optimization.</p><p><a id="platform-features"></a></p><h2 id="Platform-Features-and-Best-Practices"><a href="#Platform-Features-and-Best-Practices" class="headerlink" title="Platform Features and Best Practices"></a>Platform Features and Best Practices</h2><p>As Android evolves, Binder keeps improving in performance and stability. These features help explain Perfetto behavior and guide practical tuning.</p><p><strong>Binder Freeze (Android 12+)</strong>: a frozen cached process gets almost no CPU. Synchronous (non-<code>oneway</code>) Binder calls to it are rejected and may lead to target-process kill; asynchronous (<code>oneway</code>) transactions are typically buffered until thaw.</p><p><strong>Frozen-callee callback policy (common on Android 14+)</strong>: use <code>RemoteCallbackList</code> frozen-callee policies (<code>DROP</code>, <code>ENQUEUE_MOST_RECENT</code>, <code>ENQUEUE_ALL</code>) to control callback buildup while the target process is frozen.</p><p><strong>Binder Heavy Hitter Watcher</strong>: identifies Binder hotspots with unusually high short-window call share. Enablement, thresholds, and outputs depend on build&#x2F;version&#x2F;device configuration.</p><p><strong>Some suggestions for developers</strong>:</p><p>About <strong>Oneway</strong>: use it only when no return value or completion timing is required (for example logging, fire-and-forget signals). Replacing sync calls with oneway just to “unblock UI” often shifts backlog to server queues and introduces ordering issues.</p><p>About <strong>large payloads</strong>: avoid sending large objects (especially Bitmaps) over Binder. Per-process Binder buffer is ~1MB and can trigger <code>TransactionTooLargeException</code>; use <code>SharedMemory</code>, files, or <code>ParcelFileDescriptor</code> instead.</p><p>About <strong>main-thread Binder calls</strong>: avoid calling services with unpredictable latency on UI thread; if unavoidable, offload to background threads and post results back.</p><p><a id="summary"></a></p><h2 id="Summary"><a href="#Summary" class="headerlink" title="Summary"></a>Summary</h2><p>Perfetto is one of the most effective tools for Binder diagnostics. The practical method is: capture binder&#x2F;sched&#x2F;dalvik signals with <code>linux.ftrace</code>, follow Flow links from client to server, and use <code>client_dur</code> &#x2F; <code>server_dur</code> &#x2F; <code>dispatch_dur</code> + thread states + lock contention to separate “queueing slow”, “server processing slow”, and “lock wait”.</p><p>For unexplained jank&#x2F;ANR, use the sequence: “is UI waiting on Binder?” → “is server queued, slow, or lock-blocked?”. Combined with CPU&#x2F;scheduling&#x2F;rendering signals, this usually leads to root cause quickly.</p><p><a id="refs"></a></p><h2 id="References"><a href="#References" class="headerlink" title="References"></a>References</h2><ol><li><a href="https://paul.pub/android-binder-driver/">Understanding Android Binder Mechanism 1&#x2F;3: Driver Part</a></li><li><a href="https://perfetto.dev/docs/analysis/stdlib-docs#android-binder">PerfettoSQL stdlib - android.binder</a></li><li><a href="https://perfetto.dev/docs/data-sources/cpu-scheduling">Perfetto Documentation - Ftrace</a></li><li><a href="https://cs.android.com/android/platform/superproject/+/main:frameworks/native/libs/binder/">Android Source - Binder</a></li><li><a href="https://developer.android.com/reference/android/os/Parcel">Android Developers - Parcel and Bundle</a></li><li><a href="https://github.com/foundryzero/binder-trace">binder-trace - Wireshark for Binder</a></li><li><a href="https://www.cnblogs.com/wanghongzhu/p/15069884.html">am trace-ipc Source Analysis</a></li></ol><p><a id="attachments"></a></p><h2 id="Attachments"><a href="#Attachments" class="headerlink" title="Attachments"></a>Attachments</h2><ul><li><a href="https://github.com/Gracker/SystraceForBlog/tree/master/Perfetto/Android_Perfetto_Binder">Download Perfetto Trace (SystemServer Binder Case)</a><br>(Trace data contains sensitive information, please keep it confidential after downloading.)</li></ul><p><a id="about"></a></p><h2 id="About-the-Author-amp-Blog"><a href="#About-the-Author-amp-Blog" class="headerlink" title="About the Author &amp; Blog"></a>About the Author &amp; Blog</h2><ol><li><a href="https://www.androidperformance.com/about/">Blogger Introduction</a></li><li><a href="https://androidperformance.com/2019/12/01/BlogMap/">Blog Content Navigation</a></li><li><a href="https://www.androidperformance.com/2023/12/30/the-performance/">Android Performance Optimization Knowledge Planet</a></li></ol><blockquote><p><strong>“If you want to go fast, go alone. If you want to go far, go together.”</strong></p></blockquote><p><img src="/en/images/WechatIMG581.webp" alt="Wechat QR"></p>]]></content>
    
    
    <summary type="html">&lt;p&gt;The tenth article in the Perfetto series focuses on &lt;strong&gt;Binder&lt;/strong&gt;, Android’s core Inter-Process Communication (IPC) mechanism. Binder carries most interactions between system services and apps, and is often where latency and jank originate. This article uses signals from &lt;code&gt;linux.ftrace&lt;/code&gt; (binder tracepoints + sched), &lt;code&gt;thread_state&lt;/code&gt;, and ART Java monitor contention (via atrace &lt;code&gt;dalvik&lt;/code&gt;) to provide a practical workflow for diagnosing transaction latency, thread-pool pressure, and lock contention.&lt;/p&gt;</summary>


    <category term="Android" scheme="https://androidperformance.com/en/categories/Android/"/>
    
    
    <category term="Android" scheme="https://androidperformance.com/en/tags/Android/"/>
    
    <category term="Perfetto" scheme="https://androidperformance.com/en/tags/Perfetto/"/>
    
    <category term="Performance" scheme="https://androidperformance.com/en/tags/Performance/"/>
    
    <category term="Binder" scheme="https://androidperformance.com/en/tags/Binder/"/>
    
    <category term="Locking" scheme="https://androidperformance.com/en/tags/Locking/"/>
    
    <category term="Scheduling" scheme="https://androidperformance.com/en/tags/Scheduling/"/>
    
  </entry>
  
  <entry>
    <title>Android Perfetto Series 9: CPU Information Interpretation</title>
    <link href="https://androidperformance.com/en/2025/11/12/Android-Perfetto-09-CPU/"/>
    <id>https://androidperformance.com/en/2025/11/12/Android-Perfetto-09-CPU/</id>
    <published>2025-11-12T02:00:00.000Z</published>
    <updated>2026-05-10T23:29:51.058Z</updated>
    
    <content type="html"><![CDATA[<p>This is the ninth article in the Perfetto series, focusing on CPU information analysis in Perfetto. Perfetto provides far superior data visualization and analysis capabilities compared to Systrace. Understanding CPU-related information is the foundation for locating performance bottlenecks and analyzing power consumption issues.</p><p>The goal of this series is to examine the overall operation of the Android system from a brand new graphical perspective through the Perfetto tool, while also providing a new way to learn the Framework. Perhaps you’ve read many source code analysis articles but always feel confused by the complex call chains or can’t remember specific execution flows. Through Perfetto, by visualizing these processes, you may gain a deeper and more intuitive understanding of the system.</p><span id="more"></span><h2 id="Table-of-Contents"><a href="#Table-of-Contents" class="headerlink" title="Table of Contents"></a>Table of Contents</h2><ul><li><a href="#series">Perfetto Series Articles</a></li><li><a href="#overview">CPU Information Overview in Perfetto</a></li><li><a href="#traceconfig">Trace Config Required for Capturing CPU Information</a></li><li><a href="#biglittle">CPU Core Architecture: big.LITTLE</a></li><li><a href="#scheduling">CPU Scheduling</a></li><li><a href="#frequency">CPU Frequency Deep Dive</a></li><li><a href="#eas">Linux Kernel Scheduling Strategy: Core Selection and Migration</a></li><li><a href="#practices-sql">Practice and SQL</a></li><li><a href="#summary">Summary</a></li></ul><p><a id="series"></a></p><h2 id="Perfetto-Series-Articles"><a href="#Perfetto-Series-Articles" class="headerlink" title="Perfetto Series Articles"></a>Perfetto Series Articles</h2><ol><li><a href="https://www.androidperformance.com/en/2024/03/27/Android-Perfetto-101/#/Perfetto-Series-Catalog">Android Perfetto Series Catalog</a></li><li><a href="https://www.androidperformance.com/en/2024/05/21/Android-Perfetto-01-What-is-perfetto/">Android Perfetto Series 1: Introduction to Perfetto</a></li><li><a href="https://www.androidperformance.com/en/2024/05/21/Android-Perfetto-02-how-to-get-perfetto/">Android Perfetto Series 2: Capturing Perfetto Traces</a></li><li><a href="https://www.androidperformance.com/en/2024/05/21/Android-Perfetto-03-how-to-analysis-perfetto/">Android Perfetto Series 3: Familiarizing with Perfetto View</a></li><li><a href="https://www.androidperformance.com/en/2025/02/08/Android-Perfetto-04-Open-Big-Trace-With-Command-Line/">Android Perfetto Series 4: Opening Large Traces via Command Line</a></li><li><a href="https://www.androidperformance.com/en/2025/03/26/Android-Perfetto-05-Chorergrapher/">Android Perfetto Series 5: Android App Rendering Flow Based on Choreographer</a></li><li><a href="https://www.androidperformance.com/en/2025/04/26/Android-Perfetto-06-Why-120Hz/">Android Perfetto Series 6: Why 120Hz? Advantages and Challenges of High Refresh Rates</a></li><li><a href="https://androidperformance.com/en/2025/08/02/Android-Perfetto-07-MainThread-And-RenderThread/">Android Perfetto Series 7: MainThread and RenderThread Deep Dive</a></li><li><a href="https://androidperformance.com/en/2025/08/05/Android-Perfetto-08-Vsync/">Android Perfetto Series 8: Understanding Vsync Mechanism and Performance Analysis</a></li><li><a href="https://www.androidperformance.com/en/2025/11/12/Android-Perfetto-09-CPU/">Android Perfetto Series 9: CPU Information Interpretation</a></li><li><a href="https://www.androidperformance.com/2025/11/16/Android-Perfetto-10-Binder/">Android Perfetto Series 10: Binder Scheduling and Lock Contention</a></li><li><a href="https://www.bilibili.com/video/BV1oi82efE4D/?vd_source=0c6d2191e785de0a36dc21a9da7e664e">Video (Bilibili) - Android Perfetto Basics and Case Sharing</a></li><li><a href="https://www.bilibili.com/video/BV17A6bBLECu/">Video (Bilibili) - Android Perfetto: Trace Graph Types - AOSP, WebView, Flutter + OEM System Optimization</a></li></ol><p><a id="overview"></a></p><h2 id="CPU-Information-Overview-in-Perfetto"><a href="#CPU-Information-Overview-in-Perfetto" class="headerlink" title="CPU Information Overview in Perfetto"></a>CPU Information Overview in Perfetto</h2><p>In the Perfetto UI, CPU-related information is usually grouped at the top and is the starting point for performance analysis. It mainly includes the following three core tracks:</p><ul><li><strong>CPU Scheduling</strong>: Shows which thread is executing on each CPU core at each time point.</li><li><strong>CPU Frequency</strong>: Shows the frequency changes of each CPU core or core cluster.</li><li><strong>CPU Idle</strong>: Shows the low-power states (C-States) entered by each CPU core.</li></ul><p><img src="/en/images/Android-Perfetto-09-CPU/image-20251112214415666.webp" alt="image-20251112214415666"></p><p>By analyzing CPU-related information, you can answer the following key performance questions or perform competitive analysis:</p><ul><li>Why isn’t the application main thread executing? Is it being preempted by other threads?</li><li>What’s the reason for a task executing slowly? Was it scheduled to a low-performance core?</li><li>In specific scenarios, is the CPU frequency limited?</li><li>When the application is in the background, does the CPU effectively enter deep sleep state?</li></ul><p><a id="traceconfig"></a></p><h2 id="Trace-Config-Required-for-Capturing-CPU-Information"><a href="#Trace-Config-Required-for-Capturing-CPU-Information" class="headerlink" title="Trace Config Required for Capturing CPU Information"></a>Trace Config Required for Capturing CPU Information</h2><p>To collect all CPU data needed for analysis in this article, you need a correct <code>TraceConfig</code>. Incorrect configuration will cause certain tracks (such as CPU frequency) or certain kernel events (such as wakeup events) to be missing. Below is the Perfetto official documentation’s recommended configuration for general CPU analysis. You can add it to your Perfetto Config and use it when capturing traces.</p><figure class="highlight protobuf"><table><tr><td class="gutter"><pre><span class="line">1</span><br><span class="line">2</span><br><span class="line">3</span><br><span class="line">4</span><br><span class="line">5</span><br><span class="line">6</span><br><span class="line">7</span><br><span class="line">8</span><br><span class="line">9</span><br><span class="line">10</span><br><span class="line">11</span><br><span class="line">12</span><br><span class="line">13</span><br><span class="line">14</span><br><span class="line">15</span><br><span class="line">16</span><br><span class="line">17</span><br><span class="line">18</span><br><span class="line">19</span><br><span class="line">20</span><br><span class="line">21</span><br><span class="line">22</span><br><span class="line">23</span><br><span class="line">24</span><br><span class="line">25</span><br><span class="line">26</span><br><span class="line">27</span><br><span class="line">28</span><br><span class="line">29</span><br><span class="line">30</span><br><span class="line">31</span><br><span class="line">32</span><br><span class="line">33</span><br><span class="line">34</span><br><span class="line">35</span><br><span class="line">36</span><br><span class="line">37</span><br><span class="line">38</span><br><span class="line">39</span><br><span class="line">40</span><br><span class="line">41</span><br><span class="line">42</span><br><span class="line">43</span><br></pre></td><td class="code"><pre><span class="line">data_sources &#123;</span><br><span class="line">  config &#123;</span><br><span class="line">    name: <span class="string">&quot;linux.ftrace&quot;</span></span><br><span class="line">    ftrace_config &#123;</span><br><span class="line">      ftrace_events: <span class="string">&quot;sched/sched_process_exit&quot;</span></span><br><span class="line">      ftrace_events: <span class="string">&quot;sched/sched_process_free&quot;</span></span><br><span class="line">      ftrace_events: <span class="string">&quot;task/task_newtask&quot;</span></span><br><span class="line">      ftrace_events: <span class="string">&quot;task/task_rename&quot;</span></span><br><span class="line">      ftrace_events: <span class="string">&quot;sched/sched_switch&quot;</span></span><br><span class="line">      ftrace_events: <span class="string">&quot;power/suspend_resume&quot;</span></span><br><span class="line">      ftrace_events: <span class="string">&quot;sched/sched_blocked_reason&quot;</span></span><br><span class="line">      ftrace_events: <span class="string">&quot;sched/sched_wakeup&quot;</span></span><br><span class="line">      ftrace_events: <span class="string">&quot;sched/sched_wakeup_new&quot;</span></span><br><span class="line">      ftrace_events: <span class="string">&quot;sched/sched_waking&quot;</span></span><br><span class="line">      ftrace_events: <span class="string">&quot;sched/sched_process_exit&quot;</span></span><br><span class="line">      ftrace_events: <span class="string">&quot;sched/sched_process_free&quot;</span></span><br><span class="line">      ftrace_events: <span class="string">&quot;task/task_newtask&quot;</span></span><br><span class="line">      ftrace_events: <span class="string">&quot;task/task_rename&quot;</span></span><br><span class="line">      ftrace_events: <span class="string">&quot;power/cpu_frequency&quot;</span></span><br><span class="line">      ftrace_events: <span class="string">&quot;power/cpu_idle&quot;</span></span><br><span class="line">      ftrace_events: <span class="string">&quot;power/suspend_resume&quot;</span></span><br><span class="line">      symbolize_ksyms: <span class="literal">true</span></span><br><span class="line">      disable_generic_events: <span class="literal">true</span></span><br><span class="line">    &#125;</span><br><span class="line">  &#125;</span><br><span class="line">&#125;</span><br><span class="line">data_sources &#123;</span><br><span class="line">  config &#123;</span><br><span class="line">    name: <span class="string">&quot;linux.process_stats&quot;</span></span><br><span class="line">    process_stats_config &#123;</span><br><span class="line">      scan_all_processes_on_start: <span class="literal">true</span></span><br><span class="line">    &#125;</span><br><span class="line">  &#125;</span><br><span class="line">&#125;</span><br><span class="line">data_sources &#123;</span><br><span class="line">  config &#123;</span><br><span class="line">    name: <span class="string">&quot;linux.sys_stats&quot;</span></span><br><span class="line">    sys_stats_config &#123;</span><br><span class="line">      cpufreq_period_ms: <span class="number">250</span></span><br><span class="line">    &#125;</span><br><span class="line">  &#125;</span><br><span class="line">&#125;</span><br><span class="line"></span><br></pre></td></tr></table></figure><p>This configuration enables key ftrace events including <code>sched</code> (scheduling), <code>power</code> (frequency and idle), and <code>task</code> (task lifecycle), which are the foundation for deep CPU analysis.</p><p><a id="biglittle"></a></p><h2 id="CPU-Core-Architecture-big-LITTLE"><a href="#CPU-Core-Architecture-big-LITTLE" class="headerlink" title="CPU Core Architecture: big.LITTLE"></a>CPU Core Architecture: big.LITTLE</h2><p>Before diving into analysis, you must understand the CPU core architecture of modern mobile SoCs. Currently, mainstream mobile processors generally adopt the <code>big.LITTLE</code> heterogeneous multi-core architecture, or its variants, such as <code>big.Medium.LITTLE</code> (big-medium-small cores).</p><ul><li><strong>LITTLE cores</strong>: Designed for low power consumption, with lower frequencies, used for background tasks and lightweight computing to ensure battery life.</li><li><strong>Big cores</strong>: Designed for high performance, with higher frequencies and greater power consumption, used for user interaction, gaming, app launches, and other heavy load scenarios.</li><li><strong>Prime Core</strong>: Some flagship chips have an extremely high-frequency prime core for the most demanding single-core performance challenges.</li></ul><p>In Perfetto’s CPU tracks, cores are usually numbered starting from 0. For example, in a typical octa-core processor, <code>CPU 0-3</code> might be LITTLE cores, <code>CPU 4-6</code> big cores, and <code>CPU 7</code> the prime core. <strong>Identifying core types is crucial for performance analysis</strong>: if a compute-intensive task runs on a LITTLE core for an extended period, its execution time will far exceed expectations. During analysis, you need to match the thread’s running core with its task attributes to judge whether the scheduler’s behavior meets expectations.</p><p>Below is a typical 4+4 CPU:</p><p><img src="/en/images/Android-Perfetto-09-CPU/image-20251112214626810.webp" alt="image-20251112214626810"></p><p>Below is a typical 4+3+1 CPU (MTK Dimensity 9500, 9400, and Qualcomm Snapdragon high-end series):</p><p><img src="/en/images/Android-Perfetto-09-CPU/image-20251112215105550.webp" alt="image-20251112215105550"></p><p>Below is a 5+2 CPU (Qualcomm 8Elite 1 lite version; the standard 8Elite 1 has cores 0-5 as LITTLE cores and 6-7 as big cores, so I won’t include that image here):</p><p><img src="/en/images/Android-Perfetto-09-CPU/image-20251112214833158.webp" alt="image-20251112214833158"></p><p>Generally, you can find out the big-medium-small core architecture by checking the CPU spec, or by cat-ing the corresponding CPU nodes. I won’t elaborate further here.</p><p><a id="scheduling"></a></p><h2 id="CPU-Scheduling"><a href="#CPU-Scheduling" class="headerlink" title="CPU Scheduling"></a>CPU Scheduling</h2><p>The <code>CPU Scheduling</code> track is the most commonly used and most important part. It visualizes the decision-making process of the Linux kernel scheduler. Its data source is the <code>sched/sched_switch</code> event in kernel ftrace.</p><p><img src="/en/images/Android-Perfetto-09-CPU/image-20251112215332310.webp" alt="CPU Scheduling Area"></p><p>Each CPU core corresponds to an independent track row. Different colored blocks on the track represent specific threads running on that CPU core during that time slice.</p><ul><li>UI details: Clicking a CPU slice, the details panel will show the <code>cpu</code>, <code>end_state</code>, <code>priority</code>, associated <code>process/thread</code>, etc. for that scheduling; expanding the process downward also shows each thread’s independent track, facilitating tracking of a single thread’s state evolution (refer to <a href="https://perfetto.dev/docs/data-sources/cpu-scheduling">official documentation</a>).</li></ul><p><img src="/en/images/Android-Perfetto-09-CPU/image-20251112215540626.webp" alt="image-20251112215540626"></p><h3 id="Thread-State-Deep-Dive"><a href="#Thread-State-Deep-Dive" class="headerlink" title="Thread State Deep Dive"></a>Thread State Deep Dive</h3><p>Understanding Linux thread states is a prerequisite for performance optimization. In Perfetto, selecting a thread, the <code>Current State</code> panel below will show its current state. This state information comes from Perfetto’s parsed <code>thread_state</code>&#x2F;<code>thread_state_slice</code> tables.</p><h4 id="Running-Green"><a href="#Running-Green" class="headerlink" title="Running (Green)"></a>Running (Green)</h4><p><strong>State Definition</strong>: Green represents the thread is executing code on the CPU. This is the only state truly consuming CPU resources for computation.</p><p><img src="/en/images/Android-Perfetto-09-CPU/image-20251112215705017.webp" alt="image-20251112215705017"></p><p><strong>Analysis Points</strong>:</p><ul><li><strong>Execution Duration</strong>: Excessively long <code>Running</code> states, especially on critical threads, usually mean intensive computational tasks, such as complex algorithms or loops. This increases task duration and may block other threads’ execution.</li><li><strong>Running Core</strong>: Analyze in combination with the CPU’s core architecture (e.g., big.LITTLE). Whether a compute-intensive task is scheduled to the expected performance core (big core) is an important basis for evaluating whether the scheduling strategy is reasonable.</li><li><strong>Running Frequency</strong>: The thread’s actual execution speed is also affected by CPU frequency. Even if the thread runs on a big core, if frequency is reduced due to thermal throttling or other reasons, its performance will decline. Therefore, comprehensive analysis is needed in combination with the <code>CPU Frequency</code> track.</li></ul><h4 id="R-Runnable"><a href="#R-Runnable" class="headerlink" title="R (Runnable)"></a>R (Runnable)</h4><p><strong>State Definition</strong>: The thread has all conditions for running and is waiting for the scheduler to assign a CPU core. In Perfetto’s thread private track, the <code>Runnable</code> state is usually displayed as light green or white bars.</p><p><img src="/en/images/Android-Perfetto-09-CPU/image-20251112220248837.webp" alt="image-20251112220248837"></p><p><strong>Analysis Points</strong>:</p><ul><li><strong><code>Runnable</code> and Jank</strong>: For threads sensitive to response time like UI threads, long periods in <code>Runnable</code> state are a direct cause of jank. It means the thread cannot get CPU time in time to handle tasks (such as UI drawing), leading to frame drops.</li></ul><p><strong>Three Types of <code>Runnable</code></strong>:<br>Careful observation reveals that the “predecessor” of threads entering <code>Runnable</code> state varies. Based on the kernel’s scheduling timing, we can divide it into three situations:</p><ol><li><p><strong>Wake-up from Sleep</strong>: This is the most common type. The thread is awakened from <code>S</code> or <code>D</code> state because the resource it was waiting for (such as lock, I&#x2F;O, Binder reply) is ready, enters <code>Runnable</code> state, waiting to be selected by the scheduler for execution.</p></li><li><p><strong>User Preemption</strong>: Refers to the thread’s running time slice expiring, or a higher priority task appearing, causing the scheduler to decide to swap out the current thread <strong>when returning from kernel mode to user mode</strong> (such as after system call, interrupt return). At this time, the swapped-out thread changes from <code>Running</code> to <code>Runnable</code>. In the underlying <code>sched_switch</code> trace, its <code>prev_state</code> is marked as <code>R</code>.</p></li><li><p><strong>Kernel Preemption</strong>: Refers to a higher priority task or interrupt “forcibly” interrupting the current thread <strong>while it’s executing kernel mode code</strong>, making it yield the CPU. This situation usually means a more urgent scheduling. At this time, the swapped-out thread changes from <code>Running</code> to <code>Runnable (Preempted)</code>. In the underlying trace, its <code>prev_state</code> is marked as <code>R+</code>, which Perfetto parses and displays accordingly.</p></li></ol><p>Understanding the differences between these three types helps more precisely judge the causes of scheduling delays. For example, a large number of <code>Runnable (Preempted)</code> may suggest the system has frequent, high-priority wakeup sources, causing critical threads to be frequently interrupted in kernel mode, or the CPU is already fully loaded (a more common situation). At this time, lower priority Tasks are easily preempted by higher priority Tasks and forced to yield the CPU. If your critical Task is always being preempted, you need to adjust priorities.</p><p><img src="/en/images/Android-Perfetto-09-CPU/image-20251112220534899.webp" alt="image-20251112220534899"></p><h4 id="S-Sleep-x2F-Interruptible-Sleep"><a href="#S-Sleep-x2F-Interruptible-Sleep" class="headerlink" title="S (Sleep &#x2F; Interruptible Sleep)"></a>S (Sleep &#x2F; Interruptible Sleep)</h4><p><strong>State Definition</strong>: The thread enters sleep while waiting for an event and can be interrupted by signals. This is the most common sleep state and is usually benign because it doesn’t consume CPU resources while waiting.</p><p><img src="/en/images/Android-Perfetto-09-CPU/image-20251112221122170.webp" alt="image-20251112221122170"></p><p><strong>Analysis Points</strong>:</p><ul><li><strong>Waiting Resources</strong>: If critical threads (such as UI thread) sleep for too long, it will also cause performance issues. Common waiting reasons include:<ul><li><strong>Lock Contention</strong>: Waiting to acquire a <code>mutex</code> (Java lock or native futex).</li><li><strong>Binder Communication</strong>: Waiting for another process to return results through Binder call.</li><li><strong>I&#x2F;O Operations</strong>: Waiting for network socket data (<code>epoll_wait</code>).</li><li><strong>Explicit Sleep</strong>: Code called <code>Thread.sleep()</code> or <code>Object.wait()</code>.</li></ul></li><li><strong>Dependency Analysis</strong>: In Perfetto, selecting a Task that is Running in the CPU area will show UI indicating which Task on which CPU woke it up. This helps quickly locate inter-thread dependencies. Combined with function call stacks, you can further locate the specific code causing sleep.<br><img src="/en/images/Android-Perfetto-09-CPU/image-20251112221703122.webp" alt="image-20251112221703122"></li></ul><h4 id="D-Uninterruptible-Sleep"><a href="#D-Uninterruptible-Sleep" class="headerlink" title="D (Uninterruptible Sleep)"></a>D (Uninterruptible Sleep)</h4><p><strong>State Definition</strong>: The thread is waiting for hardware I&#x2F;O operations to complete and cannot be interrupted by any signal during this period. This state is designed to protect data consistency during process-device interactions. In Perfetto, this state is usually displayed as orange or red and is a signal requiring key attention.</p><p><img src="/en/images/Android-Perfetto-09-CPU/image-20251112220738143.webp" alt="image-20251112220738143"></p><p><strong>Analysis Points</strong>:</p><ul><li><strong>Serious Performance Bottleneck</strong>: Long periods in <code>D</code> state mean the thread is completely blocked and cannot respond to any events. If it occurs on the UI thread, it easily leads to ANR.</li><li><strong>Common Causes</strong>:<ol><li><strong>Disk I&#x2F;O</strong>: Frequent or single large file read&#x2F;write operations.</li><li><strong>Memory Pressure</strong>: Insufficient system physical memory, leading to frequent page swap in&#x2F;out, which is essentially high-frequency disk I&#x2F;O.</li><li><strong>Kernel Driver Issues</strong>: Implementation defects in some kernel drivers may also cause threads to fall into <code>D</code> state.</li></ol></li><li><strong>Investigation Direction</strong>: In the <code>Current State</code> panel, if <code>D</code> state is accompanied by <code>(iowait)</code> marking, it clearly indicates waiting for I&#x2F;O. You need to check the application’s I&#x2F;O patterns, evaluate their reasonableness, such as whether time-consuming I&#x2F;O operations are placed on the main thread, or whether there’s room for optimization (such as reducing I&#x2F;O frequency and data volume).</li></ul><h3 id="Wakeup-Relationship-Analysis"><a href="#Wakeup-Relationship-Analysis" class="headerlink" title="Wakeup Relationship Analysis"></a>Wakeup Relationship Analysis</h3><p>Inter-thread dependencies are a difficult point in performance analysis. For a thread sleeping for a long time, the key is finding out “who it’s waiting for”. Perfetto provides powerful wakeup relationship visualization functionality.</p><ul><li><strong>UI Operation</strong>: In Perfetto’s CPU area, left-click to select a thread Task in <code>Running</code> state. Perfetto will automatically draw a dependency arrow from “waker” to “wakee” and highlight the thread slice where the wakeup source is located.<br><img src="/en/images/Android-Perfetto-09-CPU/image-20251112221703122.webp" alt="image-20251112221703122"></li><li><strong>Underlying Principle</strong>: This functionality depends on the kernel’s <code>sched_wakeup</code> ftrace event. When thread T1 releases a resource (such as unlocking, completing Binder call), and thread T2 is waiting for that resource, the kernel marks T2 as <code>Runnable</code> state and records this T1 -&gt; T2 wakeup event. Perfetto parses these events to build the dependency chain between threads.</li></ul><p>Through wakeup analysis, you can clearly track complex call chains, for example: UI thread waits for a Binder call -&gt; Binder thread executes task -&gt; Binder thread waits for another lock -&gt; Lock-holding thread releases lock and wakes Binder thread -&gt; Binder thread completes task and wakes UI thread. Bottleneck points in the entire process will be clear at a glance.</p><h4 id="Scheduling-Wakeup-and-Latency-Analysis"><a href="#Scheduling-Wakeup-and-Latency-Analysis" class="headerlink" title="Scheduling Wakeup and Latency Analysis"></a>Scheduling Wakeup and Latency Analysis</h4><p>When thread A suspends on <code>wait()</code>, it enters <code>S</code> (Sleeping) and is removed from the CPU run queue. After thread B calls <code>notify()</code>, the kernel converts thread A to <code>R</code> (Runnable). At this time thread A is “eligible” to be put back into some CPU’s run queue, but this doesn’t mean “immediate” running.</p><p><img src="/en/images/Android-Perfetto-09-CPU/image-20251112222240991.webp" alt="image-20251112222240991"></p><p>Common waiting reasons include:</p><ul><li>All CPUs are busy: Thread A needs to wait for a queue slot to open up (or currently running threads have higher priority).</li><li>There’s an idle CPU, but migration takes time: The load balancer needs a certain time window to migrate the thread to another CPU.</li></ul><p>Unless using real-time priority, most Linux scheduler configurations are not strictly “work-conserving”. The scheduler sometimes “waits” for the current CPU thread to naturally idle to avoid extra overhead and power consumption from cross-CPU migration. This forms observable “queuing delay” in <code>R</code> state. Combined with <code>sched_waking</code>&#x2F;<code>sched_wakeup_new</code>, you can more precisely characterize the time period from “being awakened” to “actually queued&#x2F;running” (refer to official documentation: differences and applicable scenarios of <code>sched_waking / sched_wakeup</code>).</p><ul><li>In the target thread’s <code>thread_state</code> track, filter <code>state=R</code> slices as direct evidence of “scheduling delay”.</li><li>Synchronously compare other heavy-load threads and IRQ&#x2F;SoftIRQ traces on the same CPU to verify whether there’s time overlap of preemption or high-priority suppression.</li><li>If frequently queuing in <code>R</code> state and ending with <code>end_state=R+</code>, view as serious involuntary preemption, need to evaluate priority, placement, and load balancing strategies.</li></ul><h4 id="Differences-Between-sched-waking-and-sched-wakeup-and-Non-strict-Work-conserving"><a href="#Differences-Between-sched-waking-and-sched-wakeup-and-Non-strict-Work-conserving" class="headerlink" title="Differences Between sched_waking and sched_wakeup and Non-strict Work-conserving"></a>Differences Between sched_waking and sched_wakeup and Non-strict Work-conserving</h4><ul><li><code>sched_waking</code> is issued when a thread is marked as runnable (R), <code>sched_wakeup</code> is related to cross-CPU wakeup and may be recorded on source or destination CPU; for most latency analysis, only <code>sched_waking</code> is sufficient (see official explanation).</li><li>Most Linux scheduling configurations under general priority are not strictly “work-conserving”. The scheduler sometimes “waits for current CPU to idle” to avoid extra overhead and power consumption from cross-core migration. This causes waiting time in R state (queuing delay) which is not abnormal but a result of trade-offs (see <a href="https://perfetto.dev/docs/data-sources/cpu-scheduling">Perfetto CPU Scheduling</a>).</li></ul><h3 id="User-Mode-and-Kernel-Mode-sys-Slices-Locate-Empty-Flame-Graphs"><a href="#User-Mode-and-Kernel-Mode-sys-Slices-Locate-Empty-Flame-Graphs" class="headerlink" title="User Mode and Kernel Mode: sys_* Slices Locate Empty Flame Graphs"></a>User Mode and Kernel Mode: sys_* Slices Locate Empty Flame Graphs</h3><ul><li>Not all green <code>Running</code> slices are application code busy. If a thread falls into a single long system call like <code>sys_read</code>, <code>sys_futex</code>, user mode sampling flame graphs may be almost empty.</li><li>If a UI thread’s某段 <code>sched_slice</code> is very long, but CPU flame graph hotspots are few or almost none:<ol><li>Open that thread’s <code>slice</code> view, check if there are long <code>sys_*</code> slices;</li><li>If exists: Bottleneck is mostly in I&#x2F;O or synchronization primitives, prioritize checking I&#x2F;O paths, lock granularity, and access patterns;</li><li>If not exists: Return to flame graph, continue profiling user mode hotspot functions.</li></ol></li><li>Suggestions: Merge I&#x2F;O, switch to async, optimize lock contention, reduce system call frequency and single data volume.</li></ul><h3 id="CPU-Time-and-Wall-Time"><a href="#CPU-Time-and-Wall-Time" class="headerlink" title="CPU Time and Wall Time"></a>CPU Time and Wall Time</h3><p><img src="/en/images/Android-Perfetto-09-CPU/image-20251112223105996.webp" alt="image-20251112223105996"></p><ul><li><code>Wall</code> is the real-world time from slice start to end, <code>CPU</code> is the time actually running on CPU.</li><li>Relationship: <code>Wall = CPU + Runnable + Sleep</code>.<ol><li>Select target slice (e.g., <code>Choreographer#doFrame</code>), compare <code>Wall</code> with <code>CPU</code>;</li><li>If <code>Wall ≈ CPU</code>, it’s computation-heavy, use flame graph to locate hotspots;</li><li>If <code>Wall &gt;&gt; CPU</code>, it’s scheduling or dependency waiting, check <code>thread_state</code>‘s <code>R/S/D</code> distribution and wakeup chain.</li></ol></li></ul><p><a id="frequency"></a></p><h2 id="CPU-Frequency-Deep-Dive"><a href="#CPU-Frequency-Deep-Dive" class="headerlink" title="CPU Frequency Deep Dive"></a>CPU Frequency Deep Dive</h2><p>CPU frequency directly affects code execution speed and is also positively correlated with power consumption. The <code>CPU Frequency</code> track shows each core’s operating frequency (<code>scaling_cur_freq</code>) at specific times. But more importantly, understanding the limiting factors behind it:</p><h3 id="Core-Factors-Affecting-CPU-Frequency"><a href="#Core-Factors-Affecting-CPU-Frequency" class="headerlink" title="Core Factors Affecting CPU Frequency"></a>Core Factors Affecting CPU Frequency</h3><ol><li><p><strong>Task Utilization</strong>: This is the main driving factor. Modern Android systems mostly use <code>schedutil</code> as the <code>cpufreq</code> frequency scaling policy. It directly associates with the Scheduler, deciding frequency based on thread “busyness” (<code>utilization</code>). A high-load thread (high <code>util</code>) will prompt <code>schedutil</code> to request higher frequency, and vice versa.</p></li><li><p><strong>Scenario Policy (Power HAL)</strong>: Android Framework passes the current system state, i.e., “scenario”, to the lower layer through Power HAL. For example, during app launch, gaming, or screen touch, Power HAL requests higher performance from the kernel, usually by raising the CPU’s <strong>floor frequency (<code>scaling_min_freq</code>)</strong> and&#x2F;or <strong>ceiling frequency (<code>scaling_max_freq</code>)</strong>, ensuring the CPU can respond quickly.</p></li><li><p><strong>Thermal Throttling</strong>: This has the highest priority limitation. When device temperature (from battery, CPU, NPU, and other sensors) exceeds preset thresholds, the thermal control system forcibly lowers the CPU’s <strong>ceiling frequency</strong> to reduce heat and protect hardware. At this time, even with high-load tasks, CPU frequency cannot increase, a common external cause of game frame drops and app jank.</p></li><li><p><strong>Power Limitation and Power Saving Mode</strong>: In low battery or power saving mode enabled, the system similarly limits maximum performance output by lowering ceiling frequency to extend battery life.</p></li></ol><p>Therefore, when finding a heavy task running with CPU frequency not increasing, you should not only look at current frequency but also pay attention to whether <code>scaling_max_freq</code> is limited. This usually means the root cause of the performance bottleneck is not in the application code itself but in the system’s thermal or power consumption policy.</p><p><img src="/en/images/Android-Perfetto-09-CPU/image-20251112223237018.webp" alt="image-20251112223237018"></p><p>The above image is a marker diagram of the CPU frequency area. Hovering the mouse over it shows the current frequency. CPU frequency changes very quickly. In the image, CPU has colored and non-colored parts. Colored parts indicate the current CPU has Tasks running, non-colored parts indicate the current CPU is empty with no Tasks.</p><h3 id="Frequency-Data-Collection-and-Platform-Differences"><a href="#Frequency-Data-Collection-and-Platform-Differences" class="headerlink" title="Frequency Data Collection and Platform Differences"></a>Frequency Data Collection and Platform Differences</h3><ul><li>Two acquisition methods:<ul><li>Event-driven: Enable <code>power/cpu_frequency</code>, record events when kernel cpufreq driver changes frequency. Not all platforms support it, reliable on most ARM SoCs, often no data on many modern Intel platforms.</li><li>Polling sampling: Enable <code>linux.sys_stats</code> and set <code>cpufreq_period_ms &gt; 0</code>, periodically read <code>/sys/devices/system/cpu/cpu*/cpufreq/cpuinfo_cur_freq</code>, works on both ARM&#x2F;Intel. Recommended to combine with event-driven to fill “initial frequency snapshot”.</li></ul></li><li>Android devices often scale frequency by “cluster”, common phenomenon is multiple CPUs within the same cluster synchronously changing frequency.</li><li>Known issues:<ul><li>Events only generate when frequency changes, short Traces or stable scenarios may have left-side “blanks”. At this time, rely on polling to fill.</li><li>Some UI versions don’t render cpufreq track when Idle state not captured, but data can still be obtained through queries.</li><li>Reference: <code>CPU frequency and idle states</code> official explanation.</li></ul></li></ul><h3 id="big-LITTLE-Same-Frequency-Doesn’t-Equal-Same-Performance-or-Power-Consumption"><a href="#big-LITTLE-Same-Frequency-Doesn’t-Equal-Same-Performance-or-Power-Consumption" class="headerlink" title="big.LITTLE: Same Frequency Doesn’t Equal Same Performance or Power Consumption"></a>big.LITTLE: Same Frequency Doesn’t Equal Same Performance or Power Consumption</h3><ul><li>On heterogeneous CPUs, both at 2.0GHz, LITTLE cores and big cores’ actual computing power and energy consumption are not equivalent. Frequency must be understood in combination with core type.</li><li>Core capacity and IPC: Big cores usually have wider out-of-order execution, more execution ports, larger cache, and more aggressive prefetch&#x2F;branch prediction, higher instructions per cycle (IPC); at the same frequency, big cores need less time and energy to complete the same work.</li><li>Cluster-level DVFS: Mobile SoCs mostly scale frequency by “cluster”. LITTLE core cluster’s high frequency doesn’t equal big core cluster’s medium frequency performance output; different clusters have different voltage-frequency-energy curves, same frequency point cannot be horizontally compared for “performance per watt”.</li><li>Memory&#x2F;cache&#x2F;interconnect bottleneck: If hotspot is constrained by memory bandwidth, LLC hit rate, or system interconnect (NoC), simply raising LITTLE core frequency has limited benefit; big cores’ larger cache&#x2F;stronger prefetch can significantly reduce same task’s memory access waiting, reflecting “same frequency different effect”.</li><li>Energy efficiency curve is non-linear: LITTLE cores approaching maximum frequency often enter energy efficiency steep decline zone (voltage elevation causes marginal energy consumption surge), while big cores at medium frequency points may achieve “higher unit energy efficiency”. Same frequency comparison ignores “voltage-frequency-energy” three-dimensional trade-off.</li></ul><h4 id="P-States-and-governor"><a href="#P-States-and-governor" class="headerlink" title="P-States and governor"></a>P-States and governor</h4><ul><li>CPU frequency is not a continuous value but discrete performance states P-States. Common governor is <code>schedutil</code>, selecting appropriate P-State based on task utilization and other signals, coordinating voltage adjustment.</li><li>Frequency changes in UI are essentially governor switching between different P-States. High frequency doesn’t necessarily mean faster or more power-efficient, needs to be understood in combination with core cluster type and current upper&#x2F;lower limit constraints.</li><li>Verification steps:<ol><li>In <code>CPU Frequency</code>, observe whether frequency upper&#x2F;lower limits are raised&#x2F;lowered (such as scenario policy&#x2F;thermal throttling limiting <code>scaling_max_freq</code>).</li><li>In <code>CPU Scheduling</code>, check which type of core critical threads run on (combined with device’s core number division).</li><li>If “high frequency + LITTLE core + still slow”, prioritize considering core selection&#x2F;memory access bottleneck, not simply “frequency insufficient”.</li></ol></li><li>Recommend combining Power HAL scenarios, thermal management, and task profile (CPU intensive or memory access intensive) for comprehensive optimization, avoid simply using frequency as tuning target. Reference official documentation: <a href="https://perfetto.dev/docs/data-sources/cpu-scheduling">Perfetto CPU Scheduling</a>.</li></ul><p><a id="eas"></a></p><h2 id="Linux-Kernel-Scheduling-Strategy-Core-Selection-and-Migration"><a href="#Linux-Kernel-Scheduling-Strategy-Core-Selection-and-Migration" class="headerlink" title="Linux Kernel Scheduling Strategy: Core Selection and Migration"></a>Linux Kernel Scheduling Strategy: Core Selection and Migration</h2><p>After understanding thread states and frequency, we also need to deeply understand two core behaviors of the Linux kernel scheduler (mainly EAS - Energy Aware Scheduling in Android): how to select a CPU core for tasks, and why to migrate tasks from one core to another.</p><h3 id="Core-Selection-Logic-Task-Placement"><a href="#Core-Selection-Logic-Task-Placement" class="headerlink" title="Core Selection Logic (Task Placement)"></a>Core Selection Logic (Task Placement)</h3><p>When a thread is awakened from <code>Sleep</code> state, or a new thread is created, the EAS scheduler needs to select the most suitable CPU core for it. Its core goal is to minimize system power consumption while meeting task performance requirements. The decision-making process is roughly as follows:</p><ol><li><strong>Evaluate Task Load (Task Utilization)</strong>: The scheduler evaluates the thread’s <code>util</code>, i.e., how much computing resources it needs. This is a dynamically adjusted value reflecting the thread’s historical busyness.</li><li><strong>Find “Sufficient” Core</strong>: The scheduler traverses all available CPU cores, comparing task’s <code>util</code> with each core’s <code>capacity</code> (capacity&#x2F;maximum computing ability). Big cores’ <code>capacity</code> is far higher than LITTLE cores. The scheduler looks for cores where <code>capacity &gt; util</code>, i.e., cores that can “accommodate” this task.</li><li><strong>Find “Most Energy-Efficient” Core</strong>: Among all cores meeting <code>capacity</code> requirements, the scheduler uses the “Energy Model” preset in the kernel for calculation. This model knows each core’s power consumption at each frequency. The scheduler selects a CPU core that makes the entire system (including the task itself and other running tasks) have the lowest total power consumption as the final choice.</li></ol><p><strong>In short</strong>: EAS’s goal is not to find the fastest core for a task, but to find a core that’s “just enough” and “most power-efficient”.</p><h3 id="Core-Migration-Logic-Task-Migration"><a href="#Core-Migration-Logic-Task-Migration" class="headerlink" title="Core Migration Logic (Task Migration)"></a>Core Migration Logic (Task Migration)</h3><p>Moving tasks from one CPU core to another is a key means for the scheduler to perform dynamic tuning. It mainly occurs in the following situations:</p><ol><li><p><strong>Load Balancing</strong>: This is the most common migration reason. The scheduler periodically checks whether the system is in a “load imbalance” state. For example, <code>CPU-1</code> (LITTLE core) is packed with high-load tasks causing its utilization to saturate, while <code>CPU-7</code> (big core) is very idle. At this time, the scheduler judges the system is imbalanced and will “pull” a high-load task from <code>CPU-1</code> to <code>CPU-7</code> to run, to restore balance and improve performance.</p></li><li><p><strong>Wake-up Migration</strong>: When a thread wakes up, the scheduler re-evaluates its best core. If this thread’s <code>util</code> changed during sleep (for example, a background download thread suddenly receives a large file download task, <code>util</code> spikes), or the core it was running on is now very busy, the scheduler may directly select a more suitable new core for it at wake-up, rather than letting it queue in the original place.</p></li></ol><p>Understanding core selection and migration logic helps us judge whether the scheduler’s behavior is “abnormal”. For example, an obvious foreground UI thread being unreasonably restricted to LITTLE cores for a long time, or “bouncing back and forth” too frequently between big and LITTLE cores, may suggest problems with system scheduling strategy or task priority settings.</p><p>Of course, currently Android manufacturers have made a lot of customizations to the scheduler. Critical Tasks usually occupy more CPU and are more likely to get on big cores. There are also many core binding strategies and core signing strategies, causing phenomena seen by each manufacturer to be different. This is also each manufacturer’s core competitiveness (such as Oppo’s Hummingbird Engine).</p><p><a id="practices-sql"></a></p><h2 id="Practice-and-SQL"><a href="#Practice-and-SQL" class="headerlink" title="Practice and SQL"></a>Practice and SQL</h2><h3 id="Using-SQL-for-Quantitative-Analysis"><a href="#Using-SQL-for-Quantitative-Analysis" class="headerlink" title="Using SQL for Quantitative Analysis"></a>Using SQL for Quantitative Analysis</h3><p>Perfetto’s built-in SQL query engine is one of its powerful features, allowing developers to perform precise aggregation, filtering, and analysis on Trace data. Below are some commonly used CPU analysis queries.</p><h3 id="1-Calculate-Total-CPU-Time-for-Each-Process"><a href="#1-Calculate-Total-CPU-Time-for-Each-Process" class="headerlink" title="1. Calculate Total CPU Time for Each Process"></a>1. Calculate Total CPU Time for Each Process</h3><p>This query counts each process’s total running time on all CPUs, sorted in descending order, used to quickly locate processes consuming the most CPU resources.</p><figure class="highlight sql"><table><tr><td class="gutter"><pre><span class="line">1</span><br><span class="line">2</span><br><span class="line">3</span><br><span class="line">4</span><br><span class="line">5</span><br><span class="line">6</span><br><span class="line">7</span><br><span class="line">8</span><br></pre></td><td class="code"><pre><span class="line"><span class="keyword">SELECT</span></span><br><span class="line">  process.name,</span><br><span class="line">  <span class="built_in">sum</span>(dur) <span class="operator">/</span> <span class="number">1e9</span> <span class="keyword">AS</span> total_cpu_time_s</span><br><span class="line"><span class="keyword">FROM</span> sched</span><br><span class="line"><span class="keyword">JOIN</span> thread <span class="keyword">ON</span> sched.utid <span class="operator">=</span> thread.utid</span><br><span class="line"><span class="keyword">JOIN</span> process <span class="keyword">ON</span> thread.upid <span class="operator">=</span> process.upid</span><br><span class="line"><span class="keyword">GROUP</span> <span class="keyword">BY</span> process.name</span><br><span class="line"><span class="keyword">ORDER</span> <span class="keyword">BY</span> total_cpu_time_s <span class="keyword">DESC</span>;</span><br></pre></td></tr></table></figure><h3 id="2-Analyze-Single-Thread’s-Time-State-Distribution"><a href="#2-Analyze-Single-Thread’s-Time-State-Distribution" class="headerlink" title="2. Analyze Single Thread’s Time State Distribution"></a>2. Analyze Single Thread’s Time State Distribution</h3><p>This query based on the <code>thread_state</code> table can be used to analyze a specific thread’s (example <code>surfaceflinger</code>) time distribution in various states, thus judging its main bottleneck.</p><figure class="highlight sql"><table><tr><td class="gutter"><pre><span class="line">1</span><br><span class="line">2</span><br><span class="line">3</span><br><span class="line">4</span><br><span class="line">5</span><br><span class="line">6</span><br><span class="line">7</span><br><span class="line">8</span><br><span class="line">9</span><br><span class="line">10</span><br><span class="line">11</span><br><span class="line">12</span><br><span class="line">13</span><br></pre></td><td class="code"><pre><span class="line"><span class="keyword">SELECT</span></span><br><span class="line">  <span class="keyword">CASE</span> state</span><br><span class="line">    <span class="keyword">WHEN</span> <span class="string">&#x27;Running&#x27;</span> <span class="keyword">THEN</span> <span class="string">&#x27;Running&#x27;</span></span><br><span class="line">    <span class="keyword">WHEN</span> <span class="string">&#x27;R&#x27;</span> <span class="keyword">THEN</span> <span class="string">&#x27;Runnable&#x27;</span></span><br><span class="line">    <span class="keyword">WHEN</span> <span class="string">&#x27;S&#x27;</span> <span class="keyword">THEN</span> <span class="string">&#x27;Interruptible Sleep&#x27;</span></span><br><span class="line">    <span class="keyword">WHEN</span> <span class="string">&#x27;D&#x27;</span> <span class="keyword">THEN</span> <span class="string">&#x27;Uninterruptible Sleep&#x27;</span></span><br><span class="line">    <span class="keyword">ELSE</span> state</span><br><span class="line">  <span class="keyword">END</span> <span class="keyword">AS</span> human_state,</span><br><span class="line">  <span class="built_in">sum</span>(dur) <span class="operator">/</span> <span class="number">1e6</span> <span class="keyword">AS</span> total_time_ms</span><br><span class="line"><span class="keyword">FROM</span> thread_state</span><br><span class="line"><span class="keyword">WHERE</span> utid <span class="operator">=</span> (<span class="keyword">SELECT</span> utid <span class="keyword">FROM</span> thread <span class="keyword">WHERE</span> name <span class="operator">=</span> <span class="string">&#x27;surfaceflinger&#x27;</span> LIMIT <span class="number">1</span>)</span><br><span class="line"><span class="keyword">GROUP</span> <span class="keyword">BY</span> human_state</span><br><span class="line"><span class="keyword">ORDER</span> <span class="keyword">BY</span> total_time_ms <span class="keyword">DESC</span>;</span><br></pre></td></tr></table></figure><h3 id="3-Find-Threads-with-Highest-CPU-Consumption-in-Specific-Time-Period"><a href="#3-Find-Threads-with-Highest-CPU-Consumption-in-Specific-Time-Period" class="headerlink" title="3. Find Threads with Highest CPU Consumption in Specific Time Period"></a>3. Find Threads with Highest CPU Consumption in Specific Time Period</h3><p>This query is used to analyze threads consuming the longest CPU time in specific scenarios (such as 2-5s time period during app launch).</p><figure class="highlight sql"><table><tr><td class="gutter"><pre><span class="line">1</span><br><span class="line">2</span><br><span class="line">3</span><br><span class="line">4</span><br><span class="line">5</span><br><span class="line">6</span><br><span class="line">7</span><br><span class="line">8</span><br><span class="line">9</span><br></pre></td><td class="code"><pre><span class="line"><span class="keyword">SELECT</span></span><br><span class="line">  thread.name,</span><br><span class="line">  <span class="built_in">sum</span>(dur) <span class="operator">/</span> <span class="number">1e9</span> <span class="keyword">AS</span> cpu_time_s</span><br><span class="line"><span class="keyword">FROM</span> sched</span><br><span class="line"><span class="keyword">JOIN</span> thread <span class="keyword">ON</span> sched.utid <span class="operator">=</span> thread.utid</span><br><span class="line"><span class="comment">-- Timestamp unit is nanoseconds, you can add WHERE ts &gt; 2e9 AND ts &lt; 5e9 to get a certain time period</span></span><br><span class="line"><span class="keyword">GROUP</span> <span class="keyword">BY</span> thread.name</span><br><span class="line"><span class="keyword">ORDER</span> <span class="keyword">BY</span> cpu_time_s <span class="keyword">DESC</span></span><br><span class="line">LIMIT <span class="number">20</span>;</span><br></pre></td></tr></table></figure><h3 id="4-View-Thread’s-Running-Time-Distribution-on-Each-CPU-Core"><a href="#4-View-Thread’s-Running-Time-Distribution-on-Each-CPU-Core" class="headerlink" title="4. View Thread’s Running Time Distribution on Each CPU Core"></a>4. View Thread’s Running Time Distribution on Each CPU Core</h3><p>This query helps understand a thread’s CPU affinity and whether it runs on expected big&#x2F;LITTLE cores.</p><figure class="highlight sql"><table><tr><td class="gutter"><pre><span class="line">1</span><br><span class="line">2</span><br><span class="line">3</span><br><span class="line">4</span><br><span class="line">5</span><br><span class="line">6</span><br><span class="line">7</span><br></pre></td><td class="code"><pre><span class="line"><span class="keyword">SELECT</span></span><br><span class="line">  cpu,</span><br><span class="line">  <span class="built_in">sum</span>(dur) <span class="operator">/</span> <span class="number">1e6</span> <span class="keyword">AS</span> time_on_cpu_ms</span><br><span class="line"><span class="keyword">FROM</span> sched</span><br><span class="line"><span class="keyword">WHERE</span> utid <span class="operator">=</span> (<span class="keyword">SELECT</span> utid <span class="keyword">FROM</span> thread <span class="keyword">WHERE</span> name <span class="operator">=</span> <span class="string">&#x27;system_server&#x27;</span> LIMIT <span class="number">1</span>)</span><br><span class="line"><span class="keyword">GROUP</span> <span class="keyword">BY</span> cpu</span><br><span class="line"><span class="keyword">ORDER</span> <span class="keyword">BY</span> cpu;</span><br></pre></td></tr></table></figure><h3 id="5-Calculate-CPU-Utilization-for-Each-Process"><a href="#5-Calculate-CPU-Utilization-for-Each-Process" class="headerlink" title="5. Calculate CPU Utilization for Each Process"></a>5. Calculate CPU Utilization for Each Process</h3><p>This query calculates each process’s CPU utilization within the entire Trace time range.</p><figure class="highlight sql"><table><tr><td class="gutter"><pre><span class="line">1</span><br><span class="line">2</span><br><span class="line">3</span><br><span class="line">4</span><br><span class="line">5</span><br><span class="line">6</span><br><span class="line">7</span><br><span class="line">8</span><br></pre></td><td class="code"><pre><span class="line"><span class="keyword">SELECT</span></span><br><span class="line">  process.name <span class="keyword">AS</span> process_name,</span><br><span class="line">  <span class="number">100</span> <span class="operator">*</span> <span class="built_in">sum</span>(dur) <span class="operator">/</span> <span class="built_in">CAST</span>(TRACE_END() <span class="operator">-</span> TRACE_START() <span class="keyword">AS</span> <span class="type">REAL</span>) <span class="keyword">AS</span> cpu_utilization_percent</span><br><span class="line"><span class="keyword">FROM</span> sched</span><br><span class="line"><span class="keyword">JOIN</span> thread <span class="keyword">ON</span> thread.utid <span class="operator">=</span> sched.utid</span><br><span class="line"><span class="keyword">JOIN</span> process <span class="keyword">ON</span> process.upid <span class="operator">=</span> thread.upid</span><br><span class="line"><span class="keyword">GROUP</span> <span class="keyword">BY</span> process.name</span><br><span class="line"><span class="keyword">ORDER</span> <span class="keyword">BY</span> cpu_utilization_percent <span class="keyword">DESC</span>;</span><br></pre></td></tr></table></figure><p><a id="summary"></a></p><h2 id="Summary"><a href="#Summary" class="headerlink" title="Summary"></a>Summary</h2><p>Proficient analysis of CPU information in Perfetto is a key skill for Android performance optimization. By deeply understanding <strong>core architecture</strong>, <strong>thread states</strong>, <strong>wakeup relationships</strong>, <strong>frequency limitations</strong>, and <strong>C-State</strong>, combined with powerful <strong>SQL queries</strong> for quantitative analysis, developers can precisely locate and solve various performance and power consumption issues.</p><h1 id="About-Me-amp-amp-Blog"><a href="#About-Me-amp-amp-Blog" class="headerlink" title="About Me &amp;&amp; Blog"></a>About Me &amp;&amp; Blog</h1><p>Below is a personal introduction and related links. I look forward to communicating with you all. When three people walk together, one of them can be my teacher!</p><ol><li><a href="https://www.androidperformance.com/about/">Blogger Personal Introduction</a>: Contains personal WeChat and WeChat group links.</li><li><a href="https://www.androidperformance.com/2019/12/01/BlogMap/">Blog Content Navigation</a>: A navigation of personal blog content.</li><li><a href="https://androidperformance.com/2018/05/07/Android-performance-optimization-skills-and-tools/">Excellent Blog Articles Collected and Organized by Individuals - Must-Know for Android Performance Optimization</a>: Welcome everyone to recommend yourself and recommend (WeChat private chat is fine)</li><li><a href="https://www.androidperformance.com/2023/12/30/the-performance/">Android Performance Optimization Knowledge Planet</a>: Welcome to join, thanks for support~</li></ol><blockquote><p><strong>One person can go faster, a group of people can go further</strong></p></blockquote><p><img src="/en/images/WechatIMG581.webp" alt="WeChat QR Code"></p>]]></content>
    
    
    <summary type="html">&lt;p&gt;This is the ninth article in the Perfetto series, focusing on CPU information analysis in Perfetto. Perfetto provides far superior data visualization and analysis capabilities compared to Systrace. Understanding CPU-related information is the foundation for locating performance bottlenecks and analyzing power consumption issues.&lt;/p&gt;
&lt;p&gt;The goal of this series is to examine the overall operation of the Android system from a brand new graphical perspective through the Perfetto tool, while also providing a new way to learn the Framework. Perhaps you’ve read many source code analysis articles but always feel confused by the complex call chains or can’t remember specific execution flows. Through Perfetto, by visualizing these processes, you may gain a deeper and more intuitive understanding of the system.&lt;/p&gt;</summary>


    <category term="Android Performance Optimization" scheme="https://androidperformance.com/en/categories/Android-Performance-Optimization/"/>
    
    
    <category term="Android" scheme="https://androidperformance.com/en/tags/Android/"/>
    
    <category term="Perfetto" scheme="https://androidperformance.com/en/tags/Perfetto/"/>
    
    <category term="Systrace" scheme="https://androidperformance.com/en/tags/Systrace/"/>
    
    <category term="Performance Optimization" scheme="https://androidperformance.com/en/tags/Performance-Optimization/"/>
    
    <category term="Thread Optimization" scheme="https://androidperformance.com/en/tags/Thread-Optimization/"/>
    
    <category term="Jank Optimization" scheme="https://androidperformance.com/en/tags/Jank-Optimization/"/>
    
    <category term="Battery Optimization" scheme="https://androidperformance.com/en/tags/Battery-Optimization/"/>
    
    <category term="ANR Analysis" scheme="https://androidperformance.com/en/tags/ANR-Analysis/"/>
    
    <category term="Page Response" scheme="https://androidperformance.com/en/tags/Page-Response/"/>
    
  </entry>
  
  <entry>
    <title>Android Perfetto Series 8: Understanding Vsync Mechanism and Performance Analysis</title>
    <link href="https://androidperformance.com/en/2025/08/05/Android-Perfetto-08-Vsync/"/>
    <id>https://androidperformance.com/en/2025/08/05/Android-Perfetto-08-Vsync/</id>
    <published>2025-08-05T02:15:30.000Z</published>
    <updated>2026-05-10T23:29:51.058Z</updated>
    
    <content type="html"><![CDATA[<p>This is the eighth article in the Perfetto series, providing an in-depth introduction to the Vsync mechanism in Android and its representation in Perfetto. The article will analyze how the Android system performs frame rendering and composition based on Vsync signals from Perfetto’s perspective, covering core concepts such as Vsync, Vsync-app, Vsync-sf, and VsyncWorkDuration.</p><p>With the popularization of high refresh rate screens, understanding the Vsync mechanism has become increasingly important. This article uses 120Hz refresh rate as the main narrative thread to help developers understand the working principles of Vsync in modern Android devices, and how to observe and analyze Vsync-related performance issues in Perfetto.</p><blockquote><p><strong>Note: This article is based on the public evolution from Android 13 to Android 16. Code snippets are aligned to AOSP main signatures, with <code>...</code> used in a few places to omit non-critical branches. Always verify against your target branch.</strong></p></blockquote><span id="more"></span><h2 id="Table-of-Contents"><a href="#Table-of-Contents" class="headerlink" title="Table of Contents"></a>Table of Contents</h2><ul><li><a href="#series">Series Catalog</a></li><li><a href="#what-is-vsync">What is Vsync</a></li><li><a href="#principle">Basic Working Principles of Vsync in Android</a></li><li><a href="#perfetto-observe">Observing Vsync in Perfetto</a></li><li><a href="#app-frames">How Android App Frames Work Based on Vsync</a></li><li><a href="#refs">References</a></li><li><a href="#about">About Me &amp;&amp; Blog</a></li></ul><p><a id="series"></a></p><h1 id="Series-Catalog"><a href="#Series-Catalog" class="headerlink" title="Series Catalog"></a>Series Catalog</h1><ol><li><a href="https://www.androidperformance.com/en/2024/03/27/Android-Perfetto-101/#/Perfetto-Series-Catalog">Android Perfetto Series Catalog</a></li><li><a href="https://www.androidperformance.com/en/2024/05/21/Android-Perfetto-01-What-is-perfetto/">Android Perfetto Series 1: Introduction to Perfetto</a></li><li><a href="https://www.androidperformance.com/en/2024/05/21/Android-Perfetto-02-how-to-get-perfetto/">Android Perfetto Series 2: Capturing Perfetto Traces</a></li><li><a href="https://www.androidperformance.com/en/2024/05/21/Android-Perfetto-03-how-to-analysis-perfetto/">Android Perfetto Series 3: Familiarizing with Perfetto View</a></li><li><a href="https://www.androidperformance.com/en/2025/02/08/Android-Perfetto-04-Open-Big-Trace-With-Command-Line/">Android Perfetto Series 4: Opening Large Traces via Command Line</a></li><li><a href="https://www.androidperformance.com/en/2025/03/26/Android-Perfetto-05-Chorergrapher/">Android Perfetto Series 5: Android App Rendering Flow Based on Choreographer</a></li><li><a href="https://www.androidperformance.com/en/2025/04/26/Android-Perfetto-06-Why-120Hz/">Android Perfetto Series 6: Why 120Hz? Advantages and Challenges of High Refresh Rates</a></li><li><a href="https://androidperformance.com/en/2025/08/02/Android-Perfetto-07-MainThread-And-RenderThread/">Android Perfetto Series 7: MainThread and RenderThread Deep Dive</a></li><li><a href="https://androidperformance.com/en/2025/08/05/Android-Perfetto-08-Vsync/">Android Perfetto Series 8: Understanding Vsync Mechanism and Performance Analysis</a></li><li><a href="https://www.androidperformance.com/en/2025/11/12/Android-Perfetto-09-CPU/">Android Perfetto Series 9: CPU Information Interpretation</a></li><li><a href="https://www.androidperformance.com/2025/11/16/Android-Perfetto-10-Binder/">Android Perfetto Series 10: Binder Scheduling and Lock Contention</a></li><li><a href="https://www.bilibili.com/video/BV1oi82efE4D/?vd_source=0c6d2191e785de0a36dc21a9da7e664e">Video (Bilibili) - Android Perfetto Basics and Case Sharing</a></li><li><a href="https://www.bilibili.com/video/BV17A6bBLECu/">Video (Bilibili) - Android Perfetto: Trace Graph Types - AOSP, WebView, Flutter + OEM System Optimization</a></li></ol><p>If you haven’t read the Systrace series yet, here are the links:</p><ol><li><a href="https://www.androidperformance.com/2019/05/26/Android_Systrace_0/#/Series-Catalog">Systrace Series Catalog</a>: A systematic introduction to Systrace, Perfetto’s predecessor, and learning about Android performance optimization and Android system operation basics through Systrace.</li><li><a href="https://www.androidperformance.com/">Personal Blog</a>: My personal blog, mainly Android-related content, with some life and work-related content as well.</li></ol><p>Welcome to join the WeChat group or community on the <a href="https://www.androidperformance.com/about/">About Me</a> page to discuss your questions, what you’d most like to see about Perfetto, and all Android development-related topics with fellow group members.</p><p><a id="what-is-vsync"></a></p><h2 id="What-is-Vsync"><a href="#What-is-Vsync" class="headerlink" title="What is Vsync"></a>What is Vsync</h2><p>Vsync (Vertical Synchronization) is the core mechanism of the Android graphics system. Its existence is to solve a fundamental problem: how to keep the software rendering rhythm synchronized with the hardware display rhythm.</p><p>Before the Vsync mechanism existed, the common problem was Screen Tearing. When the display reads the framebuffer while the GPU writes the next frame, the same refresh will show inconsistent top and bottom parts of the image.</p><h3 id="What-Problems-Does-Vsync-Solve"><a href="#What-Problems-Does-Vsync-Solve" class="headerlink" title="What Problems Does Vsync Solve?"></a>What Problems Does Vsync Solve?</h3><p>The core idea of the Vsync mechanism is very simple: <strong>make all rendering work proceed according to the display’s refresh beat</strong>. Specifically:</p><ol><li><strong>Synchronization Signal</strong>: The display emits a Vsync signal every time it starts a new refresh cycle.</li><li><strong>Frame Beat and Production</strong>: On the application side, when Vsync arrives, Choreographer drives the production of a frame (Input&#x2F;Animation&#x2F;Traversal); after the CPU submits rendering commands, the GPU executes asynchronously in a pipeline. On the SurfaceFlinger side, when Vsync arrives, Buffer composition operations are performed.</li><li><strong>Buffering Mechanism</strong>: Using double buffering or triple buffering technology ensures the display always reads complete frame data.</li></ol><p>This way, frame production and display are aligned with Vsync as the beat. Taking 120Hz as an example, there’s a display opportunity every 8.333ms; the application needs to submit a compositable Buffer to SurfaceFlinger before this window. The key constraint is the timing of <code>queueBuffer</code>&#x2F;<code>acquire_fence</code>&#x2F;<code>present_fence</code>; if it doesn’t catch up with this cycle, it will be delayed to the next cycle for display.</p><p><a id="principle"></a></p><h2 id="Basic-Working-Principles-of-Vsync-in-Android"><a href="#Basic-Working-Principles-of-Vsync-in-Android" class="headerlink" title="Basic Working Principles of Vsync in Android"></a>Basic Working Principles of Vsync in Android</h2><p>Android system’s Vsync implementation is much more complex than the basic concept, needing to consider multiple different rendering components and their coordinated work.</p><h3 id="Layered-Architecture-of-Vsync-Signals"><a href="#Layered-Architecture-of-Vsync-Signals" class="headerlink" title="Layered Architecture of Vsync Signals"></a>Layered Architecture of Vsync Signals</h3><p>In the Android system, there isn’t just one simple Vsync signal. In fact, the system maintains multiple Vsync signals for different purposes:</p><p><strong>Hardware Vsync (HW Vsync)</strong>:<br>This is the lowest-level Vsync signal, generated by the display hardware (HWC, Hardware Composer). Its frequency strictly corresponds to the display’s refresh rate, for example, a 60Hz display generates HW Vsync every 16.67ms, and a 120Hz display generates one every 8.333ms. (Hardware Vsync callbacks are managed by HWC&#x2F;SurfaceFlinger, see <code>frameworks/native/services/surfaceflinger</code> related implementation)</p><p>However, HW Vsync is not always on. Since frequent hardware interrupts consume considerable power, the Android system adopts an intelligent strategy: only enabling HW Vsync when precise synchronization is needed, and using software prediction to generate Vsync signals most of the time.</p><p><strong>Vsync-app (Application Vsync)</strong>:<br>This is a Vsync signal specifically used to drive application layer rendering. When an application needs to perform UI updates (such as user touch, animation running, interface scrolling, etc.), the application will request to receive Vsync-app signals from the system.</p><figure class="highlight java"><table><tr><td class="gutter"><pre><span class="line">1</span><br><span class="line">2</span><br><span class="line">3</span><br><span class="line">4</span><br><span class="line">5</span><br><span class="line">6</span><br><span class="line">7</span><br><span class="line">8</span><br><span class="line">9</span><br><span class="line">10</span><br></pre></td><td class="code"><pre><span class="line"><span class="comment">// frameworks/base/core/java/android/view/Choreographer.java</span></span><br><span class="line"><span class="keyword">private</span> <span class="keyword">void</span> <span class="title function_">scheduleFrameLocked</span><span class="params">(<span class="type">long</span> now)</span> &#123;</span><br><span class="line">    <span class="keyword">if</span> (!mFrameScheduled) &#123;</span><br><span class="line">        mFrameScheduled = <span class="literal">true</span>;</span><br><span class="line">        <span class="keyword">if</span> (USE_VSYNC) &#123;</span><br><span class="line">            <span class="comment">// Request next Vsync signal from system</span></span><br><span class="line">            mDisplayEventReceiver.scheduleVsync();</span><br><span class="line">        &#125;</span><br><span class="line">    &#125;</span><br><span class="line">&#125;</span><br></pre></td></tr></table></figure><p>Vsync-app is requested on-demand. If the application interface is static with no animations or user interaction, the application won’t request Vsync-app signals, and the system won’t generate Vsync events for this application.</p><p><strong>Vsync-sf (SurfaceFlinger Vsync)</strong>:<br>This is a Vsync signal specifically used to drive SurfaceFlinger for layer composition. SurfaceFlinger is the service in the Android system responsible for compositing all application layers into the final image.</p><p><strong>Vsync-appSf (Application-SurfaceFlinger Vsync)</strong>:<br>A new signal type introduced in Android 13. To eliminate the timing ambiguity brought by the old design where the sf EventThread both woke up SurfaceFlinger and served some Choreographer clients, the system separated the two responsibilities: <code>vsync-sf</code> focuses on waking up SurfaceFlinger, while <code>vsync-appSf</code> faces clients that need to synchronize with SurfaceFlinger.</p><p><a id="perfetto-observe"></a></p><h2 id="Observing-Vsync-in-Perfetto"><a href="#Observing-Vsync-in-Perfetto" class="headerlink" title="Observing Vsync in Perfetto"></a>Observing Vsync in Perfetto</h2><p>Perfetto traces contain multiple Vsync-related Tracks. Understanding the meaning of these Tracks helps analyze performance issues.</p><p><strong>In the SurfaceFlinger Process</strong>:</p><ol><li><p><strong>vsync-app</strong><br>Displays application Vsync signal status, with values changing between 0 and 1. Each value change represents a Vsync signal.<br><img src="/en/images/Android-Perfetto-08-Vsync/image-20250811221826847.webp" alt="image-20250811221826847"></p></li><li><p><strong>vsync-sf</strong><br>Displays SurfaceFlinger Vsync signal status. When there’s no Vsync Offset, it changes synchronously with <code>vsync-app</code>.<br><img src="/en/images/Android-Perfetto-08-Vsync/image-20250811221902646.webp" alt="image-20250811221902646"></p></li><li><p><strong>vsync-appSf</strong><br>Added in Android 13+, serves special Choreographer clients that need to synchronize with SurfaceFlinger.<br><img src="/en/images/Android-Perfetto-08-Vsync/image-20250811222036489.webp" alt="image-20250811222036489"></p></li><li><p><strong>HW_VSYNC</strong><br>Displays hardware Vsync enabled status. Value of 1 means enabled, value of 0 means disabled. To save power, hardware Vsync is only enabled when precise synchronization is needed.<br><img src="/en/images/Android-Perfetto-08-Vsync/image-20250811222159253.webp" alt="image-20250811222159253"></p></li></ol><p><strong>In the Application Process</strong>:</p><p><code>FrameDisplayEventReceiver.onVsync</code> Slice Track:<br>Displays the time point when the application receives Vsync signals. The connection is established through Binder, while events are delivered through <code>BitTube</code>&#x2F;Looper channels, so timing may be slightly later than <code>vsync-app</code> in SurfaceFlinger.</p><p><img src="/en/images/Android-Perfetto-08-Vsync/image-20250918220632473.webp" alt="image-20250918220632473"></p><p><code>UI Thread</code> Slice Track:<br>Contains <code>Choreographer#doFrame</code> and related Input, Animation, Traversal, etc. Slices. Each <code>doFrame</code> corresponds to one frame’s processing work.</p><p><img src="/en/images/Android-Perfetto-08-Vsync/image-20250918220709655.webp" alt="image-20250918220709655"></p><p><code>RenderThread</code> Slice Track:<br>Contains <code>DrawFrame</code>, <code>syncAndDrawFrame</code>, <code>queueBuffer</code>, etc. Slices, corresponding to render thread work.</p><p><img src="/en/images/Android-Perfetto-08-Vsync/image-20250918220730872.webp" alt="image-20250918220730872"></p><p><a id="app-frames"></a></p><h2 id="How-Android-App-Frames-Work-Based-on-Vsync"><a href="#How-Android-App-Frames-Work-Based-on-Vsync" class="headerlink" title="How Android App Frames Work Based on Vsync"></a>How Android App Frames Work Based on Vsync</h2><p>Each frame of an Android application completes the entire process from rendering to display based on the Vsync mechanism, involving multiple key steps.</p><p><img src="/en/images/Android-Perfetto-08-Vsync/image-20250918221821265.webp" alt="image-20250918221821265"></p><h3 id="Process-Overview-In-Order"><a href="#Process-Overview-In-Order" class="headerlink" title="Process Overview (In Order)"></a>Process Overview (In Order)</h3><ol><li>Trigger Redraw&#x2F;Input: <code>View.invalidate()</code>, animation, data change, or input event triggers → <code>ViewRootImpl.scheduleTraversals()</code> → <code>Choreographer.postCallback(TRAVERSAL)</code></li><li>Request Vsync: <code>Choreographer</code> requests next Vsync (app phase) through <code>DisplayEventReceiver.scheduleVsync()</code></li><li>Receive Vsync: After <code>DisplayEventReceiver.onVsync()</code> receives Vsync, it posts an asynchronous message to the main thread message queue</li><li>Main Thread Frame Processing: <code>Choreographer.doFrame()</code> executes five types of callbacks in order: <code>INPUT → ANIMATION → INSETS_ANIMATION → TRAVERSAL → COMMIT</code></li><li>Rendering Submission: <code>RenderThread</code> executes <code>syncAndDrawFrame/DrawFrame</code>, CPU records GPU commands, <code>queueBuffer</code> submits to BufferQueue</li><li>Composition Display: <code>SurfaceFlinger</code> composites (GPU&#x2F;or HWC) when <code>vsync-sf</code> arrives, generates <code>present_fence</code>, outputs to display</li><li>Frame Completion Measurement: Determines whether displayed on schedule through <code>FrameTimeline</code> (PresentType&#x2F;JankType) and <code>acquire/present_fence</code></li></ol><p>Below we’ll expand on each step’s key implementation and Perfetto observation points.</p><h3 id="When-Does-App-Request-Vsync-Signals"><a href="#When-Does-App-Request-Vsync-Signals" class="headerlink" title="When Does App Request Vsync Signals"></a>When Does App Request Vsync Signals</h3><p>Applications don’t request Vsync signals all the time. Vsync signals are requested on-demand, only in the following situations will applications request the next Vsync from the system:</p><p><strong>Scenarios Triggering Vsync Request</strong>:</p><ol><li><strong>UI Update Needs</strong>: When View calls <code>invalidate()</code></li><li><strong>Animation Execution</strong>: When ValueAnimator, ObjectAnimator, and other animations start</li><li><strong>User Interaction</strong>: Touch events, key events, etc. requiring UI response</li><li><strong>Data Changes</strong>: RecyclerView data updates, TextView text changes, etc.</li></ol><h3 id="Complete-Process-of-App-Requesting-Vsync"><a href="#Complete-Process-of-App-Requesting-Vsync" class="headerlink" title="Complete Process of App Requesting Vsync"></a>Complete Process of App Requesting Vsync</h3><p>When an application needs to update UI, it requests Vsync signals through the following process:</p><figure class="highlight java"><table><tr><td class="gutter"><pre><span class="line">1</span><br><span class="line">2</span><br><span class="line">3</span><br><span class="line">4</span><br><span class="line">5</span><br><span class="line">6</span><br><span class="line">7</span><br><span class="line">8</span><br><span class="line">9</span><br><span class="line">10</span><br><span class="line">11</span><br><span class="line">12</span><br><span class="line">13</span><br><span class="line">14</span><br><span class="line">15</span><br><span class="line">16</span><br><span class="line">17</span><br><span class="line">18</span><br><span class="line">19</span><br><span class="line">20</span><br><span class="line">21</span><br><span class="line">22</span><br><span class="line">23</span><br><span class="line">24</span><br><span class="line">25</span><br><span class="line">26</span><br><span class="line">27</span><br><span class="line">28</span><br><span class="line">29</span><br><span class="line">30</span><br><span class="line">31</span><br><span class="line">32</span><br><span class="line">33</span><br><span class="line">34</span><br><span class="line">35</span><br><span class="line">36</span><br><span class="line">37</span><br><span class="line">38</span><br><span class="line">39</span><br><span class="line">40</span><br><span class="line">41</span><br><span class="line">42</span><br><span class="line">43</span><br><span class="line">44</span><br><span class="line">45</span><br><span class="line">46</span><br><span class="line">47</span><br><span class="line">48</span><br><span class="line">49</span><br></pre></td><td class="code"><pre><span class="line"><span class="comment">// 1. UI component requests redraw</span></span><br><span class="line"><span class="comment">// frameworks/base/core/java/android/view/View.java</span></span><br><span class="line"><span class="keyword">public</span> <span class="keyword">void</span> <span class="title function_">invalidate</span><span class="params">()</span> &#123;</span><br><span class="line">    <span class="comment">// Mark as needing redraw, but don&#x27;t execute immediately</span></span><br><span class="line">    mPrivateFlags |= PFLAG_DIRTY;</span><br><span class="line"></span><br><span class="line">    <span class="keyword">if</span> (mParent != <span class="literal">null</span> &amp;&amp; mAttachInfo != <span class="literal">null</span>) &#123;</span><br><span class="line">        <span class="comment">// Request redraw from parent container</span></span><br><span class="line">        mParent.invalidateChild(<span class="built_in">this</span>, <span class="literal">null</span>);</span><br><span class="line">    &#125;</span><br><span class="line">&#125;</span><br><span class="line"></span><br><span class="line"><span class="comment">// 2. ViewRootImpl schedules traversal</span></span><br><span class="line"><span class="comment">// frameworks/base/core/java/android/view/ViewRootImpl.java</span></span><br><span class="line"><span class="keyword">void</span> <span class="title function_">scheduleTraversals</span><span class="params">()</span> &#123;</span><br><span class="line">    <span class="keyword">if</span> (!mTraversalScheduled) &#123;</span><br><span class="line">        mTraversalScheduled = <span class="literal">true</span>;</span><br><span class="line">        <span class="comment">// Key: Register callback with Choreographer, wait for next Vsync</span></span><br><span class="line">        mChoreographer.postCallback(</span><br><span class="line">            Choreographer.CALLBACK_TRAVERSAL, mTraversalRunnable, <span class="literal">null</span>);</span><br><span class="line">    &#125;</span><br><span class="line">&#125;</span><br><span class="line"></span><br><span class="line"><span class="comment">// 3. Choreographer requests Vsync</span></span><br><span class="line"><span class="comment">// frameworks/base/core/java/android/view/Choreographer.java</span></span><br><span class="line"><span class="keyword">private</span> <span class="keyword">void</span> <span class="title function_">postCallbackDelayedInternal</span><span class="params">(<span class="type">int</span> callbackType,</span></span><br><span class="line"><span class="params">        Object action, Object token, <span class="type">long</span> delayMillis)</span> &#123;</span><br><span class="line">    <span class="keyword">final</span> <span class="type">long</span> <span class="variable">now</span> <span class="operator">=</span> SystemClock.uptimeMillis();</span><br><span class="line">    <span class="keyword">final</span> <span class="type">long</span> <span class="variable">dueTime</span> <span class="operator">=</span> now + delayMillis;</span><br><span class="line">    mCallbackQueues[callbackType].addCallbackLocked(dueTime, action, token);</span><br><span class="line"></span><br><span class="line">    <span class="comment">// Important: not only TRAVERSAL; any due callback can trigger next-frame scheduling</span></span><br><span class="line">    <span class="keyword">if</span> (dueTime &lt;= now) &#123;</span><br><span class="line">        scheduleFrameLocked(now);</span><br><span class="line">    &#125;</span><br><span class="line">&#125;</span><br><span class="line"></span><br><span class="line"><span class="keyword">private</span> <span class="keyword">void</span> <span class="title function_">scheduleFrameLocked</span><span class="params">(<span class="type">long</span> now)</span> &#123;</span><br><span class="line">    <span class="keyword">if</span> (!mFrameScheduled) &#123;</span><br><span class="line">        mFrameScheduled = <span class="literal">true</span>;</span><br><span class="line">        <span class="keyword">if</span> (isRunningOnLooperThreadLocked()) &#123;</span><br><span class="line">            scheduleVsyncLocked();</span><br><span class="line">        &#125; <span class="keyword">else</span> &#123;</span><br><span class="line">            <span class="type">Message</span> <span class="variable">msg</span> <span class="operator">=</span> mHandler.obtainMessage(MSG_DO_SCHEDULE_VSYNC);</span><br><span class="line">            msg.setAsynchronous(<span class="literal">true</span>);</span><br><span class="line">            mHandler.sendMessageAtFrontOfQueue(msg);</span><br><span class="line">        &#125;</span><br><span class="line">    &#125;</span><br><span class="line">&#125;</span><br></pre></td></tr></table></figure><blockquote><p><code>TRAVERSAL</code> is still the most common trigger, but in AOSP main it is not the only path that requests Vsync.</p></blockquote><h3 id="How-Main-Thread-Listens-for-Vsync-Signals"><a href="#How-Main-Thread-Listens-for-Vsync-Signals" class="headerlink" title="How Main Thread Listens for Vsync Signals"></a>How Main Thread Listens for Vsync Signals</h3><p>The application main thread listens for Vsync signals through <code>DisplayEventReceiver</code>. This process involves several key steps:</p><p><strong>1. Establish Connection</strong>:</p><figure class="highlight java"><table><tr><td class="gutter"><pre><span class="line">1</span><br><span class="line">2</span><br><span class="line">3</span><br><span class="line">4</span><br><span class="line">5</span><br><span class="line">6</span><br><span class="line">7</span><br><span class="line">8</span><br><span class="line">9</span><br></pre></td><td class="code"><pre><span class="line"><span class="comment">// frameworks/base/core/java/android/view/Choreographer.java</span></span><br><span class="line"><span class="keyword">private</span> <span class="keyword">final</span> <span class="keyword">class</span> <span class="title class_">FrameDisplayEventReceiver</span> <span class="keyword">extends</span> <span class="title class_">DisplayEventReceiver</span></span><br><span class="line">        <span class="keyword">implements</span> <span class="title class_">Runnable</span> &#123;</span><br><span class="line"></span><br><span class="line">    <span class="keyword">public</span> <span class="title function_">FrameDisplayEventReceiver</span><span class="params">(Looper looper, <span class="type">int</span> vsyncSource, <span class="type">long</span> layerHandle)</span> &#123;</span><br><span class="line">        <span class="built_in">super</span>(looper, vsyncSource, <span class="comment">/* eventRegistration */</span> <span class="number">0</span>, layerHandle);</span><br><span class="line">        <span class="comment">// Establish connection with SurfaceFlinger during construction</span></span><br><span class="line">    &#125;</span><br><span class="line">&#125;</span><br></pre></td></tr></table></figure><p><strong>2. Receive Vsync Signal</strong>:</p><figure class="highlight java"><table><tr><td class="gutter"><pre><span class="line">1</span><br><span class="line">2</span><br><span class="line">3</span><br><span class="line">4</span><br><span class="line">5</span><br><span class="line">6</span><br><span class="line">7</span><br><span class="line">8</span><br><span class="line">9</span><br><span class="line">10</span><br><span class="line">11</span><br><span class="line">12</span><br><span class="line">13</span><br><span class="line">14</span><br><span class="line">15</span><br><span class="line">16</span><br><span class="line">17</span><br><span class="line">18</span><br><span class="line">19</span><br></pre></td><td class="code"><pre><span class="line"><span class="meta">@Override</span></span><br><span class="line"><span class="keyword">public</span> <span class="keyword">void</span> <span class="title function_">onVsync</span><span class="params">(<span class="type">long</span> timestampNanos, <span class="type">long</span> physicalDisplayId, <span class="type">int</span> frame,</span></span><br><span class="line"><span class="params">        VsyncEventData vsyncEventData)</span> &#123;</span><br><span class="line">    <span class="comment">// Received Vsync signal, but note: doFrame is not executed directly here</span></span><br><span class="line">    mTimestampNanos = timestampNanos;</span><br><span class="line">    mFrame = frame;</span><br><span class="line">    mLastVsyncEventData.copyFrom(vsyncEventData);</span><br><span class="line"></span><br><span class="line">    <span class="comment">// Key: Post work to main thread&#x27;s MessageQueue</span></span><br><span class="line">    <span class="type">Message</span> <span class="variable">msg</span> <span class="operator">=</span> Message.obtain(mHandler, <span class="built_in">this</span>);</span><br><span class="line">    msg.setAsynchronous(<span class="literal">true</span>);  <span class="comment">// Set as asynchronous message, priority processing</span></span><br><span class="line">    mHandler.sendMessageAtTime(msg, timestampNanos / TimeUtils.NANOS_PER_MS);</span><br><span class="line">&#125;</span><br><span class="line"></span><br><span class="line"><span class="meta">@Override</span></span><br><span class="line"><span class="keyword">public</span> <span class="keyword">void</span> <span class="title function_">run</span><span class="params">()</span> &#123;</span><br><span class="line">    <span class="comment">// This is where the work for one frame actually begins</span></span><br><span class="line">    doFrame(mTimestampNanos, mFrame, mLastVsyncEventData);</span><br><span class="line">&#125;</span><br></pre></td></tr></table></figure><h3 id="Several-Remaining-Questions"><a href="#Several-Remaining-Questions" class="headerlink" title="Several Remaining Questions"></a>Several Remaining Questions</h3><p><strong>Q1: Why not execute <code>doFrame()</code> directly in <code>onVsync()</code>?</strong><br><img src="/en/images/Android-Perfetto-08-Vsync/image-20250918221936675.webp" alt="image-20250918221936675"></p><ul><li>Thread boundary: In the <code>Choreographer</code> path, <code>onVsync()</code> runs on the bound Looper (usually the main thread). Routing work through the message queue before <code>doFrame()</code> keeps frame scheduling unified and ordered.</li><li>Scheduling control: Precisely align execution moment through <code>sendMessageAtTime()</code></li><li>Queue semantics: Enter main thread MessageQueue, ensure coordination with other high-priority tasks</li></ul><p><strong>Q2: If Vsync message arrives but main thread is busy, will it be lost?</strong><br><img src="/en/images/Android-Perfetto-08-Vsync/image-20250918222045731.webp" alt="image-20250918222045731"></p><ul><li>Not strictly “no loss”. A single <code>scheduleVsync()</code> is a one-shot request. If the main thread stays busy, multiple hardware beats may be skipped and only a newer frame gets processed. Use FrameTimeline to decide whether this became visible jank.</li><li>AOSP <code>DisplayEventDispatcher::processPendingEvents</code> explicitly overwrites older vsync events with newer ones (only the most recent one is dispatched).</li></ul><p><strong>Q3: Must CPU&#x2F;GPU complete within a single Vsync cycle?</strong> If any link exceeds 1 vsync, will it cause frame drops?</p><ul><li><p>Modern Android systems use multi-buffering (usually triple buffering) mechanism:</p><ul><li><p><strong>Application side</strong>: Front Buffer (displaying) + Back Buffer (rendering) + possible third Buffer</p></li><li><p><strong>SurfaceFlinger side</strong>: Also has similar buffering mechanism</p></li><li><p>This means even if one application frame exceeds the Vsync cycle, it won’t necessarily drop frames immediately.</p></li></ul></li><li><p>GPU asynchronous pipeline; the key is whether <code>queueBuffer</code> catches up with SF composition window. Multi-buffering can mask single frame delays but may introduce additional latency. As shown in the figure below, both App-side BufferQueue and SurfaceFlinger-side Buffers are sufficient with redundancy, so no frames are dropped.</p></li><li><p>However, if the App hasn’t accumulated Buffers before, frame drops will still occur.</p></li></ul><p><img src="/en/images/Android-Perfetto-08-Vsync/image-20250918222258536.webp" alt="image-20250918222258536"></p><p><strong>Q5: How do GPU and CPU coordinate?</strong>:</p><ul><li><p>GPU rendering is asynchronous, bringing additional complexity:</p><ul><li><strong>CPU works normally, GPU becomes bottleneck</strong>: Even if application main thread completes work within Vsync cycle, excessive GPU rendering time will still cause frame drops</li><li><strong>GPU Fence mechanism</strong>: In the latch stage, the critical sync point is usually <code>acquire fence</code> (when the Buffer is safe to read). <code>present fence</code> is more about when the frame is actually presented on display. With the system <code>Latch Unsignaled Buffers</code> strategy, SurfaceFlinger can move forward first under certain conditions, then wait on fence only when needed, hiding part of the latency.</li></ul><p><img src="/en/images/Android-Perfetto-08-Vsync/image-20250918222626100.webp" alt="image-20250918222626100"></p></li></ul><p><strong>Q6: What is the real role of Vsync Phase (phase difference)?</strong>:</p><ul><li><strong>Improve touch responsiveness</strong>: By adjusting sf vsync’s phase difference, the time from when an application starts drawing to displaying on screen can be shortened from 3 Vsync cycles to 2 Vsync cycles. This is very important for interaction scenarios like touch response.</li><li><strong>Solve application drawing timeout issues</strong>: When application drawing times out, a reasonable sf phase difference can buy more processing time for the application, avoiding frame drops due to improper timing.</li><li><code>VsyncWorkDuration</code> is closer to scheduling budget visualization (<code>workDuration</code>&#x2F;<code>readyDuration</code>) and is not a 1:1 mapping to a single app offset value. Correlate it with <code>vsync-app/sf</code> and FrameTimeline.</li><li>The time period shown in the figure below is the app offset (13.3ms) configured on my phone</li></ul><p><img src="/en/images/Android-Perfetto-08-Vsync/image-20250918222707300.webp" alt="image-20250918222707300"></p><h3 id="Technical-Implementation-of-Vsync-Offset-x2F-WorkDuration"><a href="#Technical-Implementation-of-Vsync-Offset-x2F-WorkDuration" class="headerlink" title="Technical Implementation of Vsync Offset &#x2F; WorkDuration"></a>Technical Implementation of Vsync Offset &#x2F; WorkDuration</h3><p>In current AOSP main, the entry point is the <code>VsyncConfiguration</code> abstraction, which returns a <code>VsyncConfigSet</code> organized by scenario. Implementation-wise, <code>PhaseOffsets</code> is the legacy path, while <code>WorkDuration</code> is one of the common paths in newer systems:</p><figure class="highlight cpp"><table><tr><td class="gutter"><pre><span class="line">1</span><br><span class="line">2</span><br><span class="line">3</span><br><span class="line">4</span><br><span class="line">5</span><br><span class="line">6</span><br><span class="line">7</span><br><span class="line">8</span><br><span class="line">9</span><br><span class="line">10</span><br><span class="line">11</span><br><span class="line">12</span><br><span class="line">13</span><br><span class="line">14</span><br><span class="line">15</span><br></pre></td><td class="code"><pre><span class="line"><span class="comment">// frameworks/native/services/surfaceflinger/Scheduler/VsyncConfiguration.h</span></span><br><span class="line"><span class="keyword">class</span> <span class="title class_">VsyncConfiguration</span> &#123;</span><br><span class="line"><span class="keyword">public</span>:</span><br><span class="line">    <span class="keyword">virtual</span> ~<span class="built_in">VsyncConfiguration</span>() = <span class="keyword">default</span>;</span><br><span class="line">    <span class="function"><span class="keyword">virtual</span> VsyncConfigSet <span class="title">getCurrentConfigs</span><span class="params">()</span> <span class="type">const</span> </span>= <span class="number">0</span>;</span><br><span class="line">    <span class="function"><span class="keyword">virtual</span> VsyncConfigSet <span class="title">getConfigsForRefreshRate</span><span class="params">(Fps fps)</span> <span class="type">const</span> </span>= <span class="number">0</span>;</span><br><span class="line">    <span class="function"><span class="keyword">virtual</span> <span class="type">void</span> <span class="title">setRefreshRateFps</span><span class="params">(Fps fps)</span> </span>= <span class="number">0</span>;</span><br><span class="line">    <span class="function"><span class="keyword">virtual</span> <span class="type">void</span> <span class="title">reset</span><span class="params">()</span> </span>= <span class="number">0</span>;</span><br><span class="line">&#125;;</span><br><span class="line"></span><br><span class="line"><span class="keyword">class</span> <span class="title class_">WorkDuration</span> : <span class="keyword">public</span> VsyncConfiguration &#123;</span><br><span class="line"><span class="keyword">public</span>:</span><br><span class="line">    <span class="function"><span class="keyword">explicit</span> <span class="title">WorkDuration</span><span class="params">(Fps currentRefreshRate)</span></span>;</span><br><span class="line">    <span class="comment">// Internally constructs offset configs from sf/app work durations</span></span><br><span class="line">&#125;;</span><br></pre></td></tr></table></figure><p><strong>Key Concepts</strong>:</p><ul><li><code>workDuration/readyDuration</code>: scheduling budget and lead time used to compute callback wakeup</li><li><code>app/sf offset</code>: still useful as an analysis lens, but it is an outcome of config sets plus scheduler model</li><li>In common practice, “app&#x2F;sf offset delta” means their phase gap (often viewed as <code>|sfOffset - appOffset|</code>; sign conventions depend on device implementation and metric definition)</li></ul><h3 id="Actual-Optimization-Effects"><a href="#Actual-Optimization-Effects" class="headerlink" title="Actual Optimization Effects"></a>Actual Optimization Effects</h3><p>Taking a 120Hz device as an example, the effect of configuring 3ms Offset:</p><p><strong>Without Offset (Traditional Method)</strong>:</p><ul><li>T0: Application and SurfaceFlinger receive Vsync simultaneously</li><li>T0+3ms: Application completes rendering</li><li>T0+8.333ms: Next Vsync, SurfaceFlinger starts composition</li><li>T0+16.666ms: User sees the image (total latency 16.666ms)</li></ul><p><strong>With Offset (Optimized Method)</strong>:</p><ul><li>T0+1ms: Application receives Vsync-app, starts rendering</li><li>T0+3ms: Application completes rendering, submits Buffer</li><li>T0+4ms: SurfaceFlinger receives Vsync-sf, immediately starts composition</li><li>T0+6ms: SurfaceFlinger completes composition</li><li>T0+8.333ms: User sees the image (total latency 8.333ms)</li></ul><p>Through reasonable Offset configuration, latency can be reduced from 16.666ms to 8.333ms, doubling response performance.</p><p><strong>Actual Time Budget Allocation</strong>:</p><p>Taking a 120Hz device as an example (8.333ms cycle):</p><ul><li><strong>Ideal case</strong>: Application 4ms + SurfaceFlinger 2ms + buffer 2.333ms</li><li><strong>But actually acceptable</strong>: Application 6ms + SurfaceFlinger 3ms (if there’s enough Buffer buffering)</li><li><strong>GPU limitation</strong>: On low-end devices, GPU rendering may need 10-15ms, becoming the real bottleneck</li></ul><p><strong>Real Causes of Frame Drops</strong>:</p><ol><li><strong>Application timeout + Buffer exhaustion</strong>: Continuous multiple frame timeouts lead to no available Buffers in BufferQueue</li><li><strong>GPU rendering timeout</strong>: Even if CPU work is normal, GPU rendering timeout will still cause frame drops</li><li><strong>SurfaceFlinger timeout</strong>: System-level composition timeout affects all applications</li><li><strong>System resource competition</strong>: CPU&#x2F;GPU&#x2F;memory and other resources occupied by other processes</li></ol><h2 id="Complete-Code-Flow-of-Vsync-Signals"><a href="#Complete-Code-Flow-of-Vsync-Signals" class="headerlink" title="Complete Code Flow of Vsync Signals"></a>Complete Code Flow of Vsync Signals</h2><p>The complete chain of Vsync signals from hardware to application layer is as follows.</p><h3 id="Key-Code-Paths-Aligned-with-AOSP-main-Condensed-Excerpts"><a href="#Key-Code-Paths-Aligned-with-AOSP-main-Condensed-Excerpts" class="headerlink" title="Key Code Paths Aligned with AOSP main (Condensed Excerpts)"></a>Key Code Paths Aligned with AOSP main (Condensed Excerpts)</h3><p>The snippets below are aligned with current AOSP main method signatures, with non-essential branches&#x2F;logging omitted.</p><p><strong>1) Choreographer requests the next Vsync (Java)</strong></p><figure class="highlight java"><table><tr><td class="gutter"><pre><span class="line">1</span><br><span class="line">2</span><br><span class="line">3</span><br><span class="line">4</span><br><span class="line">5</span><br><span class="line">6</span><br><span class="line">7</span><br><span class="line">8</span><br><span class="line">9</span><br><span class="line">10</span><br><span class="line">11</span><br><span class="line">12</span><br><span class="line">13</span><br><span class="line">14</span><br><span class="line">15</span><br><span class="line">16</span><br><span class="line">17</span><br><span class="line">18</span><br><span class="line">19</span><br></pre></td><td class="code"><pre><span class="line"><span class="comment">// frameworks/base/core/java/android/view/Choreographer.java</span></span><br><span class="line"><span class="keyword">private</span> <span class="keyword">void</span> <span class="title function_">scheduleFrameLocked</span><span class="params">(<span class="type">long</span> now)</span> &#123;</span><br><span class="line">    <span class="keyword">if</span> (!mFrameScheduled) &#123;</span><br><span class="line">        mFrameScheduled = <span class="literal">true</span>;</span><br><span class="line">        <span class="keyword">if</span> (USE_VSYNC) &#123;</span><br><span class="line">            <span class="keyword">if</span> (isRunningOnLooperThreadLocked()) &#123;</span><br><span class="line">                scheduleVsyncLocked();</span><br><span class="line">            &#125; <span class="keyword">else</span> &#123;</span><br><span class="line">                <span class="type">Message</span> <span class="variable">msg</span> <span class="operator">=</span> mHandler.obtainMessage(MSG_DO_SCHEDULE_VSYNC);</span><br><span class="line">                msg.setAsynchronous(<span class="literal">true</span>);</span><br><span class="line">                mHandler.sendMessageAtFrontOfQueue(msg);</span><br><span class="line">            &#125;</span><br><span class="line">        &#125;</span><br><span class="line">    &#125;</span><br><span class="line">&#125;</span><br><span class="line"></span><br><span class="line"><span class="keyword">private</span> <span class="keyword">void</span> <span class="title function_">scheduleVsyncLocked</span><span class="params">()</span> &#123;</span><br><span class="line">    mDisplayEventReceiver.scheduleVsync();</span><br><span class="line">&#125;</span><br></pre></td></tr></table></figure><p><strong>2) Choreographer receives Vsync (Java)</strong></p><figure class="highlight java"><table><tr><td class="gutter"><pre><span class="line">1</span><br><span class="line">2</span><br><span class="line">3</span><br><span class="line">4</span><br><span class="line">5</span><br><span class="line">6</span><br><span class="line">7</span><br><span class="line">8</span><br><span class="line">9</span><br><span class="line">10</span><br><span class="line">11</span><br><span class="line">12</span><br><span class="line">13</span><br><span class="line">14</span><br><span class="line">15</span><br><span class="line">16</span><br><span class="line">17</span><br><span class="line">18</span><br><span class="line">19</span><br></pre></td><td class="code"><pre><span class="line"><span class="comment">// frameworks/base/core/java/android/view/Choreographer.java</span></span><br><span class="line"><span class="comment">// TODO(b/116025192): physicalDisplayId is ignored because SF only emits VSYNC</span></span><br><span class="line"><span class="comment">// for the internal display and scheduleVsync only allows requesting internal VSYNC.</span></span><br><span class="line"><span class="meta">@Override</span></span><br><span class="line"><span class="keyword">public</span> <span class="keyword">void</span> <span class="title function_">onVsync</span><span class="params">(<span class="type">long</span> timestampNanos, <span class="type">long</span> physicalDisplayId, <span class="type">int</span> frame,</span></span><br><span class="line"><span class="params">        VsyncEventData vsyncEventData)</span> &#123;</span><br><span class="line">    mTimestampNanos = timestampNanos;</span><br><span class="line">    mFrame = frame;</span><br><span class="line">    mLastVsyncEventData.copyFrom(vsyncEventData);</span><br><span class="line">    <span class="type">Message</span> <span class="variable">msg</span> <span class="operator">=</span> Message.obtain(mHandler, <span class="built_in">this</span>);</span><br><span class="line">    msg.setAsynchronous(<span class="literal">true</span>);</span><br><span class="line">    mHandler.sendMessageAtTime(msg, timestampNanos / TimeUtils.NANOS_PER_MS);</span><br><span class="line">&#125;</span><br><span class="line"></span><br><span class="line"><span class="meta">@Override</span></span><br><span class="line"><span class="keyword">public</span> <span class="keyword">void</span> <span class="title function_">run</span><span class="params">()</span> &#123;</span><br><span class="line">    mHavePendingVsync = <span class="literal">false</span>;</span><br><span class="line">    doFrame(mTimestampNanos, mFrame, mLastVsyncEventData);</span><br><span class="line">&#125;</span><br></pre></td></tr></table></figure><p><strong>3) JNI bridge: <code>DisplayEventDispatcher</code> (C++)</strong></p><figure class="highlight cpp"><table><tr><td class="gutter"><pre><span class="line">1</span><br><span class="line">2</span><br><span class="line">3</span><br><span class="line">4</span><br><span class="line">5</span><br><span class="line">6</span><br><span class="line">7</span><br><span class="line">8</span><br><span class="line">9</span><br><span class="line">10</span><br><span class="line">11</span><br><span class="line">12</span><br></pre></td><td class="code"><pre><span class="line"><span class="comment">// frameworks/base/core/jni/android_view_DisplayEventReceiver.cpp</span></span><br><span class="line"><span class="keyword">class</span> <span class="title class_">NativeDisplayEventReceiver</span> : <span class="keyword">public</span> DisplayEventDispatcher &#123;</span><br><span class="line"><span class="keyword">public</span>:</span><br><span class="line">    <span class="built_in">NativeDisplayEventReceiver</span>(JNIEnv* env, jobject receiverWeak, jobject vsyncEventDataWeak,</span><br><span class="line">            <span class="type">const</span> sp&lt;MessageQueue&gt;&amp; messageQueue, jint vsyncSource,</span><br><span class="line">            jint eventRegistration, jlong layerHandle);</span><br><span class="line"></span><br><span class="line"><span class="keyword">private</span>:</span><br><span class="line">    <span class="function"><span class="type">void</span> <span class="title">dispatchVsync</span><span class="params">(<span class="type">nsecs_t</span> timestamp, PhysicalDisplayId displayId, <span class="type">uint32_t</span> count,</span></span></span><br><span class="line"><span class="params"><span class="function">            VsyncEventData vsyncEventData)</span> <span class="keyword">override</span></span>;</span><br><span class="line">    <span class="function"><span class="type">void</span> <span class="title">dispatchHotplug</span><span class="params">(<span class="type">nsecs_t</span> timestamp, PhysicalDisplayId displayId, <span class="type">bool</span> connected)</span> <span class="keyword">override</span></span>;</span><br><span class="line">&#125;;</span><br></pre></td></tr></table></figure><p><strong>4) Native transport: <code>DisplayEventReceiver</code> + <code>BitTube</code> (C++)</strong></p><figure class="highlight cpp"><table><tr><td class="gutter"><pre><span class="line">1</span><br><span class="line">2</span><br><span class="line">3</span><br><span class="line">4</span><br><span class="line">5</span><br><span class="line">6</span><br><span class="line">7</span><br><span class="line">8</span><br><span class="line">9</span><br><span class="line">10</span><br><span class="line">11</span><br><span class="line">12</span><br><span class="line">13</span><br><span class="line">14</span><br><span class="line">15</span><br><span class="line">16</span><br></pre></td><td class="code"><pre><span class="line"><span class="comment">// frameworks/native/libs/gui/DisplayEventReceiver.cpp</span></span><br><span class="line">DisplayEventReceiver::<span class="built_in">DisplayEventReceiver</span>(gui::ISurfaceComposer::VsyncSource vsyncSource,</span><br><span class="line">        EventRegistrationFlags eventRegistration, <span class="type">const</span> sp&lt;IBinder&gt;&amp; layerHandle) &#123;</span><br><span class="line">    sf-&gt;<span class="built_in">createDisplayEventConnection</span>(vsyncSource, ..., layerHandle, &amp;mEventConnection);</span><br><span class="line">    mDataChannel = std::<span class="built_in">make_unique</span>&lt;gui::BitTube&gt;();</span><br><span class="line">    mEventConnection-&gt;<span class="built_in">stealReceiveChannel</span>(mDataChannel.<span class="built_in">get</span>());</span><br><span class="line">&#125;</span><br><span class="line"></span><br><span class="line"><span class="function"><span class="type">status_t</span> <span class="title">DisplayEventReceiver::requestNextVsync</span><span class="params">()</span> </span>&#123;</span><br><span class="line">    mEventConnection-&gt;<span class="built_in">requestNextVsync</span>();</span><br><span class="line">    <span class="keyword">return</span> NO_ERROR;</span><br><span class="line">&#125;</span><br><span class="line"></span><br><span class="line"><span class="function"><span class="type">ssize_t</span> <span class="title">DisplayEventReceiver::getEvents</span><span class="params">(Event* events, <span class="type">size_t</span> count)</span> </span>&#123;</span><br><span class="line">    <span class="keyword">return</span> gui::BitTube::<span class="built_in">recvObjects</span>(mDataChannel.<span class="built_in">get</span>(), events, count);</span><br><span class="line">&#125;</span><br></pre></td></tr></table></figure><p><strong>5) SurfaceFlinger scheduling and distribution (C++)</strong></p><figure class="highlight cpp"><table><tr><td class="gutter"><pre><span class="line">1</span><br><span class="line">2</span><br><span class="line">3</span><br></pre></td><td class="code"><pre><span class="line"><span class="comment">// frameworks/native/services/surfaceflinger/Scheduler/VSyncDispatch.h</span></span><br><span class="line"><span class="function"><span class="keyword">virtual</span> std::optional&lt;ScheduleResult&gt; <span class="title">schedule</span><span class="params">(</span></span></span><br><span class="line"><span class="params"><span class="function">        CallbackToken token, ScheduleTiming scheduleTiming)</span> </span>= <span class="number">0</span>;</span><br></pre></td></tr></table></figure><figure class="highlight cpp"><table><tr><td class="gutter"><pre><span class="line">1</span><br><span class="line">2</span><br><span class="line">3</span><br><span class="line">4</span><br><span class="line">5</span><br><span class="line">6</span><br><span class="line">7</span><br><span class="line">8</span><br><span class="line">9</span><br><span class="line">10</span><br><span class="line">11</span><br><span class="line">12</span><br><span class="line">13</span><br><span class="line">14</span><br><span class="line">15</span><br><span class="line">16</span><br></pre></td><td class="code"><pre><span class="line"><span class="comment">// frameworks/native/services/surfaceflinger/Scheduler/EventThread.cpp</span></span><br><span class="line"><span class="function"><span class="type">void</span> <span class="title">EventThread::onVsync</span><span class="params">(<span class="type">nsecs_t</span> vsyncTime, <span class="type">nsecs_t</span> wakeupTime, <span class="type">nsecs_t</span> readyTime)</span> </span>&#123;</span><br><span class="line">    mPendingEvents.<span class="built_in">push_back</span>(<span class="built_in">makeVSync</span>(mVsyncSchedule-&gt;<span class="built_in">getPhysicalDisplayId</span>(), wakeupTime,</span><br><span class="line">            ++mVSyncState-&gt;count, vsyncTime, readyTime));</span><br><span class="line">&#125;</span><br><span class="line"></span><br><span class="line"><span class="function"><span class="type">void</span> <span class="title">EventThread::threadMain</span><span class="params">(std::unique_lock&lt;std::mutex&gt;&amp; lock)</span> </span>&#123;</span><br><span class="line">    ...</span><br><span class="line">    <span class="type">const</span> <span class="keyword">auto</span> scheduleResult = mVsyncRegistration.<span class="built_in">schedule</span>(&#123;</span><br><span class="line">            .workDuration = mWorkDuration.<span class="built_in">get</span>().<span class="built_in">count</span>(),</span><br><span class="line">            .readyDuration = mReadyDuration.<span class="built_in">count</span>(),</span><br><span class="line">            .lastVsync = mLastVsyncCallbackTime.<span class="built_in">ns</span>(),</span><br><span class="line">            .committedVsyncOpt = mLastCommittedVsyncTime.<span class="built_in">ns</span>()&#125;);</span><br><span class="line">    <span class="built_in">LOG_ALWAYS_FATAL_IF</span>(!scheduleResult, <span class="string">&quot;Error scheduling callback&quot;</span>);</span><br><span class="line">    ...</span><br><span class="line">&#125;</span><br></pre></td></tr></table></figure><h3 id="Key-Timing-Point-Analysis"><a href="#Key-Timing-Point-Analysis" class="headerlink" title="Key Timing Point Analysis"></a>Key Timing Point Analysis</h3><p>Through the above code flow, we can see the complete timing chain:</p><ol><li><strong>HWC emits hardware Vsync</strong> → SurfaceFlinger Scheduler captures display cadence</li><li><strong>Scheduler computes wakeup window</strong> → <code>VSyncDispatch::schedule(...)</code></li><li><strong>EventThread creates&#x2F;distributes events</strong> → <code>DisplayEventReceiver::Event</code> via <code>BitTube</code></li><li><strong>App-side Native receives event</strong> → <code>DisplayEventDispatcher::dispatchVsync(...)</code></li><li><strong>Java <code>FrameDisplayEventReceiver</code> callback</strong> → async message enters Looper queue</li><li><strong><code>Choreographer#doFrame(...)</code> executes</strong> → Input&#x2F;Animation&#x2F;Traversal&#x2F;Commit</li></ol><p>Each link has different responsibilities and optimization points. Understanding the complete process helps analyze Vsync-related performance issues in Perfetto.</p><h3 id="FrameTimeline"><a href="#FrameTimeline" class="headerlink" title="FrameTimeline"></a>FrameTimeline</h3><p>Both App and SurfaceFlinger have FrameTimeline</p><p><img src="/en/images/Android-Perfetto-08-Vsync/image-20250918223035361.webp" alt="image-20250918223035361"></p><ul><li><strong>Tracks</strong>: <code>Expected Timeline</code>, <code>Actual Timeline</code></li><li><strong>PresentType&#x2F;JankType</strong>:<ul><li>PresentType indicates how this frame was presented (e.g., On-time, Late), JankType indicates jank type source</li><li>Common JankType: <code>AppDeadlineMissed</code>, <code>BufferStuffing</code>, <code>SfCpuDeadlineMissed</code>, <code>SfGpuDeadlineMissed</code>, etc.</li></ul></li><li><strong>Operation Steps (Perfetto UI)</strong>:<ol><li>Select target <code>Surface/Layer</code> in application process or filter using FrameToken</li><li>Align Expected with Actual, view offset and color coding</li><li>Drill up: <code>Choreographer#doFrame</code>, <code>RenderThread</code>, <code>queueBuffer</code>, <code>acquire/present_fence</code></li></ol></li><li><strong>Avoiding Misjudgment</strong>:<ul><li>Judging frame drops solely by <code>doFrame</code> duration is unreliable; use FrameTimeline’s PresentType&#x2F;JankType as standard</li><li>Multi-buffering may mask single frame timeout, need to look at consecutive frames and Buffer availability</li></ul></li></ul><h3 id="Impact-of-Refresh-Rate-x2F-Display-Mode-x2F-VRR-on-Vsync-and-Offset-x2F-Prediction"><a href="#Impact-of-Refresh-Rate-x2F-Display-Mode-x2F-VRR-on-Vsync-and-Offset-x2F-Prediction" class="headerlink" title="Impact of Refresh Rate&#x2F;Display Mode&#x2F;VRR on Vsync and Offset&#x2F;Prediction"></a>Impact of Refresh Rate&#x2F;Display Mode&#x2F;VRR on Vsync and Offset&#x2F;Prediction</h3><ul><li><strong>Mode Switching</strong>: Refresh rate changes will reconfigure <code>VsyncConfiguration</code>, affecting app&#x2F;sf Offset and prediction model;<ul><li>Perfetto: Check <code>display mode change</code> events and subsequent <code>vsync</code> interval changes</li></ul></li><li><strong>VRR (Variable Refresh Rate)</strong>: Target cycle is not constant, software prediction relies more on present_fence feedback calibration;<ul><li>Perfetto: Observe <code>vsync</code> interval distribution and <code>present_fence</code> deviation</li></ul></li><li><strong>Multi-display&#x2F;External Display</strong>: Hardware can report vsync per <code>physicalDisplayId</code>; however, app-side Choreographer usually still follows internal&#x2F;pacesetter timing (details vary by branch and version). Confirm whether you’re reading HWC&#x2F;SF tracks or app tracks before drawing conclusions;<ul><li>Version difference: official docs state per-display VSYNC was not supported on Android 10 and below; this limitation is removed at the framework&#x2F;HWC capability level on Android 11+, but app-side <code>Choreographer</code> request paths still need branch-specific verification (AOSP main still has internal-display related notes)</li><li>Perfetto: Filter related Counter&#x2F;Slice by display ID</li></ul></li></ul><h3 id="Perfetto-Practice-Checklist-Recommended-Viewing-Order"><a href="#Perfetto-Practice-Checklist-Recommended-Viewing-Order" class="headerlink" title="Perfetto Practice Checklist (Recommended Viewing Order)"></a>Perfetto Practice Checklist (Recommended Viewing Order)</h3><ol><li><strong>Vsync Signal and Cycle</strong><ul><li>Whether <code>vsync-app / vsync-sf / vsync-appSf</code> intervals are stable (60&#x2F;90&#x2F;120Hz corresponding cycles)</li><li>Whether there are abnormally dense&#x2F;sparse Vsyncs (prediction jitter)<br><img src="/en/images/Android-Perfetto-08-Vsync/image-20250918223148748.webp" alt="image-20250918223148748"></li></ul></li><li><strong>Vsync Phase Difference Configuration</strong><ul><li>Whether <code>VsyncWorkDuration</code> matches device’s expected app&#x2F;sf Offset</li><li>Whether app and sf sequence matches “draw first then composite” strategy<br><img src="/en/images/Android-Perfetto-08-Vsync/image-20250918222707300.webp" alt="image-20250918222707300"></li></ul></li><li><strong>FrameTimeline Interpretation</strong><ul><li>First look at <code>PresentType</code>, then <code>JankType</code>; confirm whether it’s app or SF&#x2F;GPU side issue</li><li>Select target Surface&#x2F;FrameToken to locate specific frame<br><img src="/en/images/Android-Perfetto-08-Vsync/image-20250918223220718.webp" alt="image-20250918223220718"></li></ul></li><li><strong>Application Main Thread and Render Thread</strong><ul><li><code>Choreographer#doFrame</code> each stage duration (Input&#x2F;Animation&#x2F;Traversal)</li><li>Whether <code>RenderThread</code>‘s <code>syncAndDrawFrame/DrawFrame</code> duration is abnormal<br><img src="/en/images/Android-Perfetto-08-Vsync/image-20250918223340940.webp" alt="image-20250918223340940"></li></ul></li><li><strong>BufferQueue and Fence</strong><ul><li>Producer: After RenderThread <code>queueBuffer</code>, the Buffer enters the consumable queue. Whether SF can latch it immediately still depends on <code>acquire fence</code>. <code>present fence</code> is mainly for confirming when the frame is actually presented. Newer versions may advance with unsignaled buffers under specific policy, then wait later when needed.<br><img src="/en/images/Android-Perfetto-08-Vsync/image-20250918224205093.webp" alt="image-20250918224205093"></li><li>Consumer SF and BufferTX: At each composition beat, SF tries to fetch the latest available Buffer for a target layer. If BufferTX for a layer is 0, that layer usually has no new Buffer, so SF keeps composing with old content. For that app, this appears as visual stall&#x2F;jank, but SF does not globally “stop composing.”<br><img src="/en/images/Android-Perfetto-08-Vsync/image-20250918223441117.webp" alt="image-20250918223441117"></li></ul></li><li><strong>Composition Strategy and Display</strong><ul><li>Whether SF frequently goes ClientComposition; whether HWC validate&#x2F;present is abnormal</li><li>Whether there’s obvious prediction deviation during multi-display&#x2F;mode switching&#x2F;VRR<br><img src="/en/images/Android-Perfetto-08-Vsync/image-20250918223517315.webp" alt="image-20250918223517315"></li></ul></li><li><strong>Resources and Other Interference</strong><ul><li>CPU competition (big core occupation), GPU busy, IO&#x2F;memory jitter (GC&#x2F;compaction)</li><li>Whether other foreground apps&#x2F;system services occupy key resources<br><img src="/en/images/Android-Perfetto-08-Vsync/image-20250918223532482.webp" alt="image-20250918223532482"></li></ul></li></ol><p><a id="refs"></a></p><h2 id="References"><a href="#References" class="headerlink" title="References"></a>References</h2><ol><li><a href="https://source.android.com/docs/core/graphics">Android Graphics Architecture</a></li><li><a href="https://source.android.com/docs/core/graphics/implement-vsync">VSYNC Implementation Guide</a></li><li><a href="https://source.android.com/docs/core/graphics/frame-pacing">Frame Pacing</a></li><li><a href="https://perfetto.dev/docs/">Perfetto Documentation</a></li><li><a href="https://www.androidperformance.com/en/2025/03/26/Android-Perfetto-05-Chorergrapher/">Android Perfetto Series 5: Android App Rendering Flow Based on Choreographer</a></li><li><a href="https://www.androidperformance.com/en/2025/04/26/Android-Perfetto-06-Why-120Hz/">Android Perfetto Series 6: Why 120Hz? Advantages and Challenges of High Refresh Rates</a></li><li><a href="https://cloud.tencent.com/developer/article/1905184">Vsync offset Related Technical Analysis</a></li><li><a href="https://blog.csdn.net/learnframework/article/details/133964332">Android 13&#x2F;14 High Version SurfaceFlinger VSYNC-app&#x2F;VSYNC-appSf&#x2F;VSYNC-sf Analysis</a></li><li><a href="https://android.googlesource.com/platform/frameworks/base/+/refs/heads/main/core/java/android/view/Choreographer.java">AOSP - Choreographer.java (main)</a></li><li><a href="https://android.googlesource.com/platform/frameworks/base/+/refs/heads/main/core/jni/android_view_DisplayEventReceiver.cpp">AOSP - android_view_DisplayEventReceiver.cpp (main)</a></li><li><a href="https://android.googlesource.com/platform/frameworks/native/+/refs/heads/main/libs/gui/include/gui/DisplayEventDispatcher.h">AOSP - DisplayEventDispatcher.h (main)</a></li><li><a href="https://android.googlesource.com/platform/frameworks/native/+/refs/heads/main/libs/gui/DisplayEventReceiver.cpp">AOSP - DisplayEventReceiver.cpp (main)</a></li><li><a href="https://android.googlesource.com/platform/frameworks/native/+/refs/heads/main/services/surfaceflinger/Scheduler/VSyncDispatch.h">AOSP - VSyncDispatch.h (main)</a></li><li><a href="https://android.googlesource.com/platform/frameworks/native/+/refs/heads/main/services/surfaceflinger/Scheduler/EventThread.cpp">AOSP - EventThread.cpp (main)</a></li><li><a href="https://source.android.com/docs/core/display/multi_display/three-hardware-displays">Android Multi-display (official)</a></li><li><a href="https://android.googlesource.com/platform/frameworks/native/+/refs/heads/main/services/surfaceflinger/Scheduler/VsyncConfiguration.h">AOSP - VsyncConfiguration.h (main)</a></li><li><a href="https://android.googlesource.com/platform/frameworks/native/+/refs/heads/main/libs/gui/DisplayEventDispatcher.cpp">AOSP - DisplayEventDispatcher.cpp (main)</a></li><li><a href="https://source.android.com/docs/core/graphics/unsignaled-buffer-latch">Unsignaled buffer latch (official)</a></li></ol><p><a id="about"></a></p><h1 id="About-Me-amp-amp-Blog"><a href="#About-Me-amp-amp-Blog" class="headerlink" title="About Me &amp;&amp; Blog"></a>About Me &amp;&amp; Blog</h1><p>Below is a personal introduction and related links. I look forward to communicating with you all. When three people walk together, one of them can be my teacher!</p><ol><li><a href="https://www.androidperformance.com/about/">Blogger Personal Introduction</a>: Contains personal WeChat and WeChat group links.</li><li><a href="https://www.androidperformance.com/2019/12/01/BlogMap/">Blog Content Navigation</a>: A navigation of personal blog content.</li><li><a href="https://androidperformance.com/2018/05/07/Android-performance-optimization-skills-and-tools/">Excellent Blog Articles Collected and Organized by Individuals - Must-Know for Android Performance Optimization</a>: Welcome everyone to recommend yourself and recommend (WeChat private chat is fine)</li><li><a href="https://www.androidperformance.com/2023/12/30/the-performance/">Android Performance Optimization Knowledge Planet</a>: Welcome to join, thanks for support~</li></ol><blockquote><p><strong>One person can go faster, a group of people can go further</strong></p></blockquote><p><img src="/en/images/WechatIMG581.webp" alt="WeChat QR Code"></p>]]></content>
    
    
    <summary type="html">&lt;p&gt;This is the eighth article in the Perfetto series, providing an in-depth introduction to the Vsync mechanism in Android and its representation in Perfetto. The article will analyze how the Android system performs frame rendering and composition based on Vsync signals from Perfetto’s perspective, covering core concepts such as Vsync, Vsync-app, Vsync-sf, and VsyncWorkDuration.&lt;/p&gt;
&lt;p&gt;With the popularization of high refresh rate screens, understanding the Vsync mechanism has become increasingly important. This article uses 120Hz refresh rate as the main narrative thread to help developers understand the working principles of Vsync in modern Android devices, and how to observe and analyze Vsync-related performance issues in Perfetto.&lt;/p&gt;
&lt;blockquote&gt;
&lt;p&gt;&lt;strong&gt;Note: This article is based on the public evolution from Android 13 to Android 16. Code snippets are aligned to AOSP main signatures, with &lt;code&gt;...&lt;/code&gt; used in a few places to omit non-critical branches. Always verify against your target branch.&lt;/strong&gt;&lt;/p&gt;
&lt;/blockquote&gt;</summary>


    <category term="Java" scheme="https://androidperformance.com/en/categories/Java/"/>
    
    
    <category term="Android" scheme="https://androidperformance.com/en/tags/Android/"/>
    
    <category term="Perfetto" scheme="https://androidperformance.com/en/tags/Perfetto/"/>
    
    <category term="Systrace" scheme="https://androidperformance.com/en/tags/Systrace/"/>
    
    <category term="Performance" scheme="https://androidperformance.com/en/tags/Performance/"/>
    
    <category term="RenderThread" scheme="https://androidperformance.com/en/tags/RenderThread/"/>
    
  </entry>
  
  <entry>
    <title>Android Perfetto Series 7: MainThread and RenderThread Deep Dive</title>
    <link href="https://androidperformance.com/en/2025/08/02/Android-Perfetto-07-MainThread-And-RenderThread/"/>
    <id>https://androidperformance.com/en/2025/08/02/Android-Perfetto-07-MainThread-And-RenderThread/</id>
    <published>2025-08-02T02:11:45.000Z</published>
    <updated>2026-05-10T23:29:51.058Z</updated>
    
    <content type="html"><![CDATA[<p>This is the seventh article in the Perfetto series, focusing on <strong>MainThread</strong> (UI Thread) and <strong>RenderThread</strong>, the two most critical threads in any Android application. This article will examine the workflow of MainThread and RenderThread from Perfetto’s perspective, covering topics such as jank, software rendering, and frame drop calculations.</p><p>As Google officially promotes Perfetto as the replacement for Systrace, Perfetto has become the mainstream choice in performance analysis. This article combines specific Perfetto trace information to help readers understand the complete workflow of MainThread and RenderThread, enabling you to:</p><ul><li><strong>Accurately identify key trace tags</strong>: Understand the roles of critical threads like UI Thread and RenderThread</li><li><strong>Understand the complete frame rendering process</strong>: Every step from Vsync signal to screen display</li><li><strong>Locate performance bottlenecks</strong>: Quickly find the root cause of jank and performance issues through trace information</li></ul><span id="more"></span><h2 id="Table-of-Contents"><a href="#Table-of-Contents" class="headerlink" title="Table of Contents"></a>Table of Contents</h2><ul><li><a href="#series">Series Catalog</a></li><li><a href="#render-flow">Rendering Flow Analysis Based on Perfetto</a></li><li><a href="#evolution">Evolution of Dual-Thread Rendering Architecture</a></li><li><a href="#main-thread-create">Main Thread Creation Process</a></li><li><a href="#activitythread">ActivityThread Functionality</a></li><li><a href="#render-thread">RenderThread Creation and Development</a></li><li><a href="#performance">Performance</a></li><li><a href="#frametimeline">Perfetto’s Unique FrameTimeline Feature</a></li><li><a href="#vsync">Vsync Signals in Perfetto</a></li><li><a href="#refs">References</a></li><li><a href="#attachments">Attachments</a></li><li><a href="#about">About Me &amp;&amp; Blog</a></li></ul><p><a id="series"></a></p><h1 id="Series-Catalog"><a href="#Series-Catalog" class="headerlink" title="Series Catalog"></a>Series Catalog</h1><ol><li><a href="https://www.androidperformance.com/en/2024/03/27/Android-Perfetto-101/#/Perfetto-Series-Catalog">Android Perfetto Series Catalog</a></li><li><a href="https://www.androidperformance.com/en/2024/05/21/Android-Perfetto-01-What-is-perfetto/">Android Perfetto Series 1: Introduction to Perfetto</a></li><li><a href="https://www.androidperformance.com/en/2024/05/21/Android-Perfetto-02-how-to-get-perfetto/">Android Perfetto Series 2: Capturing Perfetto Traces</a></li><li><a href="https://www.androidperformance.com/en/2024/05/21/Android-Perfetto-03-how-to-analysis-perfetto/">Android Perfetto Series 3: Familiarizing with Perfetto View</a></li><li><a href="https://www.androidperformance.com/en/2025/02/08/Android-Perfetto-04-Open-Big-Trace-With-Command-Line/">Android Perfetto Series 4: Opening Large Traces via Command Line</a></li><li><a href="https://www.androidperformance.com/en/2025/03/26/Android-Perfetto-05-Chorergrapher/">Android Perfetto Series 5: Android App Rendering Flow Based on Choreographer</a></li><li><a href="https://www.androidperformance.com/en/2025/04/26/Android-Perfetto-06-Why-120Hz/">Android Perfetto Series 6: Why 120Hz? Advantages and Challenges of High Refresh Rates</a></li><li><a href="https://androidperformance.com/en/2025/08/02/Android-Perfetto-07-MainThread-And-RenderThread/">Android Perfetto Series 7: MainThread and RenderThread Deep Dive</a></li><li><a href="https://androidperformance.com/en/2025/08/05/Android-Perfetto-08-Vsync/">Android Perfetto Series 8: Understanding Vsync Mechanism and Performance Analysis</a></li><li><a href="https://www.androidperformance.com/en/2025/11/12/Android-Perfetto-09-CPU/">Android Perfetto Series 9: CPU Information Interpretation</a></li><li><a href="https://www.androidperformance.com/2025/11/16/Android-Perfetto-10-Binder/">Android Perfetto Series 10: Binder Scheduling and Lock Contention</a></li><li><a href="https://www.bilibili.com/video/BV1oi82efE4D/?vd_source=0c6d2191e785de0a36dc21a9da7e664e">Video (Bilibili) - Android Perfetto Basics and Case Sharing</a></li><li><a href="https://www.bilibili.com/video/BV17A6bBLECu/">Video (Bilibili) - Android Perfetto: Trace Graph Types - AOSP, WebView, Flutter + OEM System Optimization</a></li></ol><p>If you haven’t read the Systrace series yet, here are the links:</p><ol><li><a href="https://www.androidperformance.com/2019/05/26/Android_Systrace_0/#/Series-Catalog">Systrace Series Catalog</a>: A systematic introduction to Systrace, Perfetto’s predecessor, and learning about Android performance optimization and Android system operation basics through Systrace.</li><li><a href="https://www.androidperformance.com/">Personal Blog</a>: My personal blog, mainly Android-related content, with some life and work-related content as well.</li></ol><p>Welcome to join the WeChat group or community on the <a href="https://www.androidperformance.com/about/">About Me</a> page to discuss your questions, what you’d most like to see about Perfetto, and all Android development-related topics with fellow group members.</p><p>The trace files used in this article have been uploaded to Github: <a href="https://github.com/Gracker/SystraceForBlog/tree/master/Android_Perfetto/demo_app_aosp_scroll.perfetto-trace">https://github.com/Gracker/SystraceForBlog/tree/master/Android_Perfetto/demo_app_aosp_scroll.perfetto-trace</a>, feel free to download them.</p><blockquote><p><strong>Note: This article is based on Android 16’s latest rendering architecture</strong></p></blockquote><p><a id="render-flow"></a></p><h1 id="Rendering-Flow-Analysis-Based-on-Perfetto"><a href="#Rendering-Flow-Analysis-Based-on-Perfetto" class="headerlink" title="Rendering Flow Analysis Based on Perfetto"></a>Rendering Flow Analysis Based on Perfetto</h1><p>Using a scrolling list as an example, we’ll capture the workflow of the main thread and render thread for <strong>one frame</strong> through Perfetto (each frame follows this process, though some frames have more work to do than others). In the Perfetto UI, focus on observing the activities of the “UI Thread” and “RenderThread” threads.</p><h2 id="Frame-Concept-and-Basic-Parameters"><a href="#Frame-Concept-and-Basic-Parameters" class="headerlink" title="Frame Concept and Basic Parameters"></a>Frame Concept and Basic Parameters</h2><p>Before analyzing Perfetto traces, you need to understand the basic concept of frames. The Android system refreshes screen content at fixed time intervals:</p><ul><li><strong>60Hz devices</strong>: Refresh every 16.67ms, 60 frames per second</li><li><strong>90Hz devices</strong>: Refresh every 11.11ms, 90 frames per second</li><li><strong>120Hz devices</strong>: Refresh every 8.33ms, 120 frames per second</li></ul><p>When analyzing rendering performance in Perfetto, focus on these two threads:</p><ul><li><strong>UI Thread</strong>: The application main thread, handling user input, business logic, and layout calculations</li><li><strong>RenderThread</strong>: The rendering thread, executing GPU rendering commands and interacting with SurfaceFlinger</li></ul><h2 id="Main-Thread-and-RenderThread-Workflow"><a href="#Main-Thread-and-RenderThread-Workflow" class="headerlink" title="Main Thread and RenderThread Workflow"></a>Main Thread and RenderThread Workflow</h2><p><img src="/en/images/Android-Perfetto-07-MainThread-And-RenderThread/image-20250803165650716.webp" alt="image-20250803165650716"></p><p>Through the Perfetto screenshot above, you can see the complete rendering process for one frame. We can imagine the Perfetto diagram as a river: the main thread handles logic upstream, and the render thread executes drawing downstream. The river flows from left to right, with each segment representing a step.</p><p><strong>Important Note</strong>: Not every frame executes all steps. Input, Animation, and Insets Animation are all on-demand. Traversal (measure, layout, draw) is also on-demand: only when <code>requestLayout</code>, <code>invalidate</code>, window attribute changes, or visibility changes happen will <code>scheduleTraversals()</code> post <code>CALLBACK_TRAVERSAL</code>. In continuous scrolling&#x2F;animation scenarios, it often <em>looks like</em> it runs every frame.</p><p>Try to “play” this complete process in your mind through the following description:</p><h3 id="1-Main-Thread-Waits-for-Vsync-Signal"><a href="#1-Main-Thread-Waits-for-Vsync-Signal" class="headerlink" title="1. Main Thread Waits for Vsync Signal"></a>1. Main Thread Waits for Vsync Signal</h3><ul><li><strong>Perfetto trace</strong>: Main thread in Sleep state (shown as idle block)</li><li><strong>Process description</strong>: Main thread waits for the vertical sync signal (Vsync) to arrive, ensuring rendering synchronizes with screen refresh rate to avoid screen tearing</li></ul><h3 id="2-Vsync-app-Signal-Delivery-Process"><a href="#2-Vsync-app-Signal-Delivery-Process" class="headerlink" title="2. Vsync-app Signal Delivery Process"></a>2. Vsync-app Signal Delivery Process</h3><ul><li><strong>Perfetto trace</strong>: <code>vsync-app</code> related events, SurfaceFlinger app thread activity</li><li><strong>Process description</strong>: When hardware generates a Vsync signal, it’s first delivered to SurfaceFlinger. SurfaceFlinger’s app thread is awakened, responsible for managing and distributing Vsync signals to applications that need to render. This intermediary layer design allows for system-level Vsync scheduling and optimization</li></ul><p><strong>Important Notes</strong>:</p><ul><li><strong>Vsync-app is requested on-demand</strong>: Apps only receive vsync-app signals when actively requested; no request means no signal</li><li><strong>Multi-app sharing mechanism</strong>: Multiple apps may request vsync-app signals simultaneously</li><li><strong>Signal attribution issue</strong>: The vsync-app signal in SurfaceFlinger may be requested by other apps; if the currently analyzed app hasn’t requested it, there will be no frame output, which is normal</li></ul><h3 id="3-SurfaceFlinger-Wakes-Up-App-Main-Thread"><a href="#3-SurfaceFlinger-Wakes-Up-App-Main-Thread" class="headerlink" title="3. SurfaceFlinger Wakes Up App Main Thread"></a>3. SurfaceFlinger Wakes Up App Main Thread</h3><ul><li><strong>Perfetto trace</strong>: <code>FrameDisplayEventReceiver.onVsync</code></li><li><strong>Process description</strong>: SurfaceFlinger sends the Vsync signal to registered apps through the FrameDisplayEventReceiver mechanism. The app’s Choreographer receives the signal and begins the frame drawing process</li></ul><h3 id="4-Processing-Input-Events-Input"><a href="#4-Processing-Input-Events-Input" class="headerlink" title="4. Processing Input Events (Input)"></a>4. Processing Input Events (Input)</h3><ul><li><strong>Perfetto trace</strong>: <code>Input</code> block</li><li><strong>Process description</strong>: Only executes when there are input events, mainly handling touch, scroll, and other user interactions</li><li><strong>Trigger conditions</strong>:<ul><li><strong>Has Input callback</strong>: When finger presses and slides on screen (like list scrolling, page dragging)</li><li><strong>No Input callback</strong>: During inertial scrolling after finger lift, static state</li></ul></li><li><strong>Note</strong>: Input callback is determined by the previous frame’s user interaction behavior to decide whether to execute in the current frame</li></ul><h3 id="5-Processing-Animations-Animation"><a href="#5-Processing-Animations-Animation" class="headerlink" title="5. Processing Animations (Animation)"></a>5. Processing Animations (Animation)</h3><ul><li><strong>Perfetto trace</strong>: <code>Animation</code> block</li><li><strong>Process description</strong>: Only executes when animations need updating, updates animation state and current frame’s animation values</li><li><strong>Trigger conditions</strong>:<ul><li><strong>Has Animation callback</strong>: During inertial scrolling, property animations running, list item creation and content changes, page transition animations, etc.</li><li><strong>No Animation callback</strong>: Interface static state, pure Input interaction phase (when no animation effects)</li></ul></li><li><strong>Note</strong>: Animation callback is also determined by callbacks posted in the previous frame to decide whether to execute in the current frame</li></ul><h3 id="6-Processing-Insets-Animations"><a href="#6-Processing-Insets-Animations" class="headerlink" title="6. Processing Insets Animations"></a>6. Processing Insets Animations</h3><ul><li><strong>Perfetto trace</strong>: <code>Insets Animation</code> block</li><li><strong>Process description</strong>: Only executes when window inset changes occur, handles window boundary animations</li><li><strong>Trigger conditions</strong>:<ul><li><strong>Has Insets Animation callback</strong>: Keyboard show&#x2F;hide, status bar show&#x2F;hide, navigation bar changes, etc.</li><li><strong>No Insets Animation callback</strong>: Window boundary stable state, most common interaction scenarios</li></ul></li></ul><h3 id="7-Traversal-Measure-Layout-Draw-Preparation"><a href="#7-Traversal-Measure-Layout-Draw-Preparation" class="headerlink" title="7. Traversal (Measure, Layout, Draw Preparation)"></a>7. Traversal (Measure, Layout, Draw Preparation)</h3><ul><li><strong>Perfetto trace</strong>: <code>performTraversals</code>, <code>measure</code>, <code>layout</code>, <code>draw</code></li><li><strong>Process description</strong>: These are the three core UI rendering stages, but they do not run as a complete set on every Vsync. Execution depends on whether the current frame has layout&#x2F;draw requests.</li></ul><h4 id="7-1-Measure-Phase"><a href="#7-1-Measure-Phase" class="headerlink" title="7.1 Measure Phase"></a>7.1 Measure Phase</h4><ul><li><strong>Purpose</strong>: Determine the size of each View</li><li><strong>Process</strong>: Starting from the root View, recursively measure the width and height of all child Views</li><li><strong>Key concepts</strong>:<ul><li><code>MeasureSpec</code>: Encapsulates parent container’s size requirements for child Views (EXACTLY, AT_MOST, UNSPECIFIED)</li><li><code>onMeasure()</code>: Each View overrides this method to implement its own measurement logic</li></ul></li><li><strong>Perfetto representation</strong>: <code>measure</code> event, duration depends on View hierarchy complexity</li></ul><h4 id="7-2-Layout-Phase"><a href="#7-2-Layout-Phase" class="headerlink" title="7.2 Layout Phase"></a>7.2 Layout Phase</h4><ul><li><strong>Purpose</strong>: Determine each View’s position coordinates in the parent container</li><li><strong>Process</strong>: Based on Measure phase results, assign actual display positions to each View</li><li><strong>Key concepts</strong>:<ul><li><code>layout(left, top, right, bottom)</code>: Set View’s four boundary coordinates</li><li><code>onLayout()</code>: ViewGroup overrides this method to determine child View positions</li></ul></li><li><strong>Perfetto representation</strong>: <code>layout</code> event, usually faster than measure</li></ul><h4 id="7-3-Draw-Phase"><a href="#7-3-Draw-Phase" class="headerlink" title="7.3 Draw Phase"></a>7.3 Draw Phase</h4><ul><li><strong>Purpose</strong>: Draw View content onto canvas</li><li><strong>Modern implementation</strong>: Doesn’t directly draw pixels, but builds DisplayList (drawing instruction list)</li><li><strong>Key process</strong>:<ul><li><code>draw(Canvas)</code>: Draw View’s own content</li><li><code>onDraw(Canvas)</code>: Subclass overrides to implement specific drawing logic</li><li><code>dispatchDraw(Canvas)</code>: ViewGroup uses this to draw child Views</li></ul></li><li><strong>Perfetto representation</strong>: <code>draw</code> event, mainly builds DisplayList under hardware acceleration</li></ul><h4 id="ViewRootImpl-performTraversals-Core-Code"><a href="#ViewRootImpl-performTraversals-Core-Code" class="headerlink" title="ViewRootImpl.performTraversals Core Code"></a>ViewRootImpl.performTraversals Core Code</h4><figure class="highlight java"><table><tr><td class="gutter"><pre><span class="line">1</span><br><span class="line">2</span><br><span class="line">3</span><br><span class="line">4</span><br><span class="line">5</span><br><span class="line">6</span><br><span class="line">7</span><br><span class="line">8</span><br><span class="line">9</span><br><span class="line">10</span><br><span class="line">11</span><br><span class="line">12</span><br><span class="line">13</span><br><span class="line">14</span><br><span class="line">15</span><br><span class="line">16</span><br><span class="line">17</span><br><span class="line">18</span><br><span class="line">19</span><br><span class="line">20</span><br><span class="line">21</span><br><span class="line">22</span><br><span class="line">23</span><br><span class="line">24</span><br></pre></td><td class="code"><pre><span class="line"><span class="comment">// frameworks/base/core/java/android/view/ViewRootImpl.java</span></span><br><span class="line"><span class="keyword">void</span> <span class="title function_">scheduleTraversals</span><span class="params">()</span> &#123;</span><br><span class="line">    <span class="keyword">if</span> (!mTraversalScheduled) &#123;</span><br><span class="line">        mTraversalScheduled = <span class="literal">true</span>;</span><br><span class="line">        mTraversalBarrier = mHandler.getLooper().getQueue().postSyncBarrier();</span><br><span class="line">        mChoreographer.postCallback(CALLBACK_TRAVERSAL, mTraversalRunnable, <span class="literal">null</span>);</span><br><span class="line">    &#125;</span><br><span class="line">&#125;</span><br><span class="line"></span><br><span class="line"><span class="keyword">private</span> <span class="keyword">void</span> <span class="title function_">performTraversals</span><span class="params">()</span> &#123;</span><br><span class="line">    <span class="comment">// ... a lot of window/relayout/visibility/sync logic</span></span><br><span class="line">    <span class="type">boolean</span> <span class="variable">layoutRequested</span> <span class="operator">=</span> mLayoutRequested &amp;&amp; (!mStopped || mReportNextDraw);</span><br><span class="line">    <span class="keyword">if</span> (layoutRequested) &#123;</span><br><span class="line">        <span class="comment">// may trigger measureHierarchy / performMeasure</span></span><br><span class="line">    &#125;</span><br><span class="line"></span><br><span class="line">    <span class="keyword">final</span> <span class="type">boolean</span> <span class="variable">didLayout</span> <span class="operator">=</span> layoutRequested &amp;&amp; (!mStopped || mReportNextDraw);</span><br><span class="line">    <span class="keyword">if</span> (didLayout) &#123;</span><br><span class="line">        performLayout(lp, mWidth, mHeight);</span><br><span class="line">    &#125;</span><br><span class="line"></span><br><span class="line">    <span class="comment">// draw only when conditions are met; canceled draws will reschedule traversal</span></span><br><span class="line">    performDraw(mActiveSurfaceSyncGroup);</span><br><span class="line">&#125;</span><br></pre></td></tr></table></figure><blockquote><p>Note: In latest AOSP, <code>performTraversals</code> is much more complex (relayout, surface changes, sync groups, canceled draws, visibility, etc.). The snippet keeps only the flow directly related to Measure&#x2F;Layout&#x2F;Draw.</p></blockquote><p><strong>Execution conditions for the three phases</strong>:</p><ul><li><strong>Measure</strong>: Runs on first draw and when layout&#x2F;configuration&#x2F;insets&#x2F;window changes require it, not fixed every frame</li><li><strong>Layout</strong>: Runs when <code>layoutRequested</code> is true and the app is in a drawable state</li><li><strong>Draw</strong>: Runs only when draw conditions are satisfied; canceled&#x2F;pre-draw-blocked cases reschedule traversal</li></ul><h3 id="8-Sync-DisplayList-to-Render-Thread"><a href="#8-Sync-DisplayList-to-Render-Thread" class="headerlink" title="8. Sync DisplayList to Render Thread"></a>8. Sync DisplayList to Render Thread</h3><ul><li><strong>Perfetto trace</strong>: syncAndDrawFrame, visible “sync” or “syncAndDrawFrame” event (usually shown as data transfer point from main thread to render thread)</li><li><strong>Process description</strong>: Main thread syncs current-frame RenderNode&#x2F;DisplayList state to RenderThread through <code>syncAndDrawFrame</code>. This is not pure fire-and-forget async: UI thread waits briefly for a key sync point (<code>DrawFrameTask::postAndWait</code>) and is then unblocked as early as possible; it does not wait until the frame is actually presented.</li></ul><h3 id="9-Render-Thread-Acquires-Buffer"><a href="#9-Render-Thread-Acquires-Buffer" class="headerlink" title="9. Render Thread Acquires Buffer"></a>9. Render Thread Acquires Buffer</h3><ul><li><strong>Perfetto trace</strong>: You can often observe <code>DequeueBufferDuration</code> &#x2F; <code>QueueBufferDuration</code> related data (exact tags vary by Android version and OEM).</li><li><strong>Process description</strong>: During draw submission, RenderThread goes through the <code>ANativeWindow/RenderPipeline</code> path for buffer acquire&#x2F;swap. Whether it waits, and how long it waits, directly affects deadline miss risk.</li></ul><h3 id="10-Process-Rendering-Instructions-and-Flush-to-GPU"><a href="#10-Process-Rendering-Instructions-and-Flush-to-GPU" class="headerlink" title="10. Process Rendering Instructions and Flush to GPU"></a>10. Process Rendering Instructions and Flush to GPU</h3><ul><li><strong>Perfetto trace</strong>: <code>drawing</code> related blocks</li><li><strong>Process description</strong>: RenderThread (CPU side) processes the RenderNode tree synced from UI thread via <code>HardwareRenderer/CanvasContext</code>, builds GPU commands, and submits them. GPU executes asynchronously and produces fences for downstream composition sync.</li></ul><h3 id="11-Submit-Buffer-Possibly-Unsignaled"><a href="#11-Submit-Buffer-Possibly-Unsignaled" class="headerlink" title="11. Submit Buffer (Possibly Unsignaled)"></a>11. Submit Buffer (Possibly Unsignaled)</h3><ul><li><strong>Perfetto trace</strong>: queueBuffer (can observe acquireFence state)</li><li><strong>Process description</strong>: Frame submission enters SurfaceFlinger through BufferQueue&#x2F;BLAST. In some scenarios, unsignaled-fence behavior appears (policy-controlled), aiming to reduce end-to-end latency.</li></ul><h3 id="12-Trigger-Transaction-to-SurfaceFlinger"><a href="#12-Trigger-Transaction-to-SurfaceFlinger" class="headerlink" title="12. Trigger Transaction to SurfaceFlinger"></a>12. Trigger Transaction to SurfaceFlinger</h3><ul><li><strong>Perfetto trace</strong>: TransactionQueue or BLAST transaction events, generally after queueBuffer, some traces don’t have this tag</li><li><strong>Process description</strong>: App side associates buffer and layer-property updates via BLAST&#x2F;SurfaceControl transactions and submits them to SurfaceFlinger. SurfaceFlinger then decides latch timing based on <code>LatchUnsignaledConfig</code> and related policies, composes, and presents.</li></ul><p><strong>Identifying different rendering modes in Perfetto</strong>:</p><ul><li><strong>During finger sliding</strong>: Each frame has complete <code>Input</code> → <code>Traversal</code> → <code>RenderThread</code> chain</li><li><strong>During inertial scrolling</strong>: Each frame has <code>Animation</code> → <code>Traversal</code> → <code>RenderThread</code>, no <code>Input</code></li><li><strong>In static state</strong>: Occasionally appears <code>Animation</code> → <code>Traversal</code> → <code>RenderThread</code>, no <code>Input</code></li></ul><h2 id="Software-Drawing-vs-Hardware-Acceleration"><a href="#Software-Drawing-vs-Hardware-Acceleration" class="headerlink" title="Software Drawing vs Hardware Acceleration"></a>Software Drawing vs Hardware Acceleration</h2><p>Although hardware-accelerated rendering is now basically standard, understanding the differences between the two rendering modes still helps understand Perfetto traces:</p><table><thead><tr><th>Aspect</th><th>Software Drawing</th><th>Hardware Acceleration</th></tr></thead><tbody><tr><td><strong>Drawing Thread</strong></td><td>Main thread</td><td>RenderThread</td></tr><tr><td><strong>Drawing Engine</strong></td><td>Skia (CPU)</td><td>OpenGL&#x2F;Vulkan (GPU)</td></tr><tr><td><strong>Perfetto Characteristics</strong></td><td>Main thread has large <code>draw</code> events</td><td>Main thread completes quickly, RenderThread handles drawing</td></tr><tr><td><strong>Performance Impact</strong></td><td>May block main thread</td><td>Asynchronous rendering, better performance</td></tr></tbody></table><p>The above introduces the basic rendering process. For more detailed Choreographer principles, refer to <a href="https://androidperformance.com/en/2025/03/26/Android-Perfetto-05-Chorergrapher/">Android Perfetto Series 5: Android App Rendering Flow Based on Choreographer</a>.</p><hr><p>Next, we’ll focus on in-depth content about the main thread and render thread:</p><ol><li>Main thread development</li><li>Main thread creation</li><li>Render thread creation</li><li>Division of labor between main thread and render thread</li></ol><p><a id="evolution"></a></p><h1 id="Evolution-of-Dual-Thread-Rendering-Architecture"><a href="#Evolution-of-Dual-Thread-Rendering-Architecture" class="headerlink" title="Evolution of Dual-Thread Rendering Architecture"></a>Evolution of Dual-Thread Rendering Architecture</h1><p>Android’s rendering system has undergone an important evolution from single-thread to dual-thread.</p><h2 id="Single-Thread-Era-Before-Android-4-4"><a href="#Single-Thread-Era-Before-Android-4-4" class="headerlink" title="Single-Thread Era (Before Android 4.4)"></a>Single-Thread Era (Before Android 4.4)</h2><p>In early Android versions, all UI-related work was executed on the main thread:</p><ul><li>Processing user input events</li><li>Executing measure, layout, draw</li><li>Calling OpenGL for actual drawing</li><li>Interacting with SurfaceFlinger</li></ul><p>Problems with this design:</p><ol><li><strong>Poor responsiveness</strong>: Main thread overloaded, prone to ANR</li><li><strong>Performance bottleneck</strong>: CPU and GPU cannot work in parallel</li><li><strong>Unstable frame rate</strong>: Complex interfaces easily cause frame drops</li></ol><h2 id="Dual-Thread-Era-Starting-from-Android-5-0-Lollipop"><a href="#Dual-Thread-Era-Starting-from-Android-5-0-Lollipop" class="headerlink" title="Dual-Thread Era (Starting from Android 5.0 Lollipop)"></a>Dual-Thread Era (Starting from Android 5.0 Lollipop)</h2><p>Android 5.0 introduced <strong>RenderThread</strong>, implementing separation of rendering work:</p><p><strong>Main Thread Responsibilities</strong>:</p><ul><li>Processing user input and business logic</li><li>Executing View’s measure, layout, draw</li><li>Building DisplayList (drawing instruction list)</li><li>Synchronizing data with render thread</li></ul><p><strong>Render Thread Responsibilities</strong>:</p><ul><li>Receiving and processing DisplayList</li><li>Executing OpenGL&#x2F;Vulkan rendering commands</li><li>Managing textures and rendering resources</li><li>Interacting with SurfaceFlinger</li></ul><p>Advantages of this architecture:</p><ol><li><strong>Parallel processing</strong>: Main thread can process next frame while render thread works</li><li><strong>Improved responsiveness</strong>: Main thread no longer blocked by rendering</li><li><strong>Performance optimization</strong>: Better utilization of GPU resources</li></ol><p><a id="main-thread-create"></a></p><h1 id="Main-Thread-Creation-Process"><a href="#Main-Thread-Creation-Process" class="headerlink" title="Main Thread Creation Process"></a>Main Thread Creation Process</h1><p>Android App processes are Linux-based, and their management is also based on Linux process management mechanisms, so their creation also calls the fork function</p><p>frameworks&#x2F;base&#x2F;core&#x2F;jni&#x2F;com_android_internal_os_Zygote.cpp</p><figure class="highlight cpp"><table><tr><td class="gutter"><pre><span class="line">1</span><br></pre></td><td class="code"><pre><span class="line"><span class="type">pid_t</span> pid = fork();</span><br></pre></td></tr></table></figure><p>The forked process, we can consider it as the main thread here, but this thread hasn’t connected with Android yet, so it cannot handle Android App Messages; since Android App threads run <strong>based on the message mechanism</strong>, this forked main thread needs to bind with Android’s Message messaging to handle various Android App Messages.</p><p>This introduces <strong>ActivityThread</strong>. To be precise, ActivityThread should be named ProcessThread more appropriately. ActivityThread connects the forked process with App Messages, and their cooperation forms what we know as the Android App main thread. So ActivityThread is actually not a Thread, but it initializes the MessageQueue, Looper, and Handler required by the Message mechanism, and its Handler handles most Message messages, so we habitually think ActivityThread is the main thread, but it’s actually just a logical processing unit of the main thread.</p><h2 id="ActivityThread-Creation"><a href="#ActivityThread-Creation" class="headerlink" title="ActivityThread Creation"></a>ActivityThread Creation</h2><p>After app process fork, the main path is:<br><code>ZygoteConnection.handleChildProc</code> → <code>ZygoteInit.zygoteInit</code> → <code>RuntimeInit.applicationInit</code> → <code>ActivityThread.main</code></p><p>com&#x2F;android&#x2F;internal&#x2F;os&#x2F;ZygoteConnection.java</p><figure class="highlight java"><table><tr><td class="gutter"><pre><span class="line">1</span><br><span class="line">2</span><br><span class="line">3</span><br><span class="line">4</span><br><span class="line">5</span><br><span class="line">6</span><br><span class="line">7</span><br><span class="line">8</span><br><span class="line">9</span><br><span class="line">10</span><br><span class="line">11</span><br></pre></td><td class="code"><pre><span class="line"><span class="keyword">private</span> Runnable <span class="title function_">handleChildProc</span><span class="params">(ZygoteArguments parsedArgs, FileDescriptor pipeFd,</span></span><br><span class="line"><span class="params">        <span class="type">boolean</span> isZygote)</span> &#123;</span><br><span class="line">    <span class="comment">// ... omitted</span></span><br><span class="line">    <span class="keyword">if</span> (!isZygote) &#123;</span><br><span class="line">        <span class="keyword">return</span> ZygoteInit.zygoteInit(parsedArgs.mTargetSdkVersion,</span><br><span class="line">                parsedArgs.mDisabledCompatChanges,</span><br><span class="line">                parsedArgs.mRemainingArgs, <span class="literal">null</span> <span class="comment">/* classLoader */</span>);</span><br><span class="line">    &#125; <span class="keyword">else</span> &#123;</span><br><span class="line">        <span class="keyword">return</span> ZygoteInit.childZygoteInit(parsedArgs.mRemainingArgs);</span><br><span class="line">    &#125;</span><br><span class="line">&#125;</span><br></pre></td></tr></table></figure><p>For regular app processes, this goes through <code>zygoteInit</code> and eventually reaches <code>ActivityThread.main</code>. <code>childZygoteInit</code> is for child-zygote flow, not the normal app path.</p><p>android&#x2F;app&#x2F;ActivityThread.java</p><figure class="highlight java"><table><tr><td class="gutter"><pre><span class="line">1</span><br><span class="line">2</span><br><span class="line">3</span><br><span class="line">4</span><br><span class="line">5</span><br><span class="line">6</span><br><span class="line">7</span><br><span class="line">8</span><br><span class="line">9</span><br><span class="line">10</span><br><span class="line">11</span><br><span class="line">12</span><br><span class="line">13</span><br><span class="line">14</span><br><span class="line">15</span><br><span class="line">16</span><br><span class="line">17</span><br><span class="line">18</span><br><span class="line">19</span><br><span class="line">20</span><br><span class="line">21</span><br><span class="line">22</span><br><span class="line">23</span><br><span class="line">24</span><br><span class="line">25</span><br><span class="line">26</span><br><span class="line">27</span><br><span class="line">28</span><br><span class="line">29</span><br><span class="line">30</span><br><span class="line">31</span><br><span class="line">32</span><br><span class="line">33</span><br></pre></td><td class="code"><pre><span class="line"><span class="keyword">public</span> <span class="keyword">static</span> <span class="keyword">void</span> <span class="title function_">main</span><span class="params">(String[] args)</span> &#123;</span><br><span class="line">    Trace.traceBegin(Trace.TRACE_TAG_ACTIVITY_MANAGER, <span class="string">&quot;ActivityThreadMain&quot;</span>);</span><br><span class="line"></span><br><span class="line">    <span class="comment">// 1. Initialize Looper, MessageQueue</span></span><br><span class="line">    Looper.prepareMainLooper();</span><br><span class="line"></span><br><span class="line">    <span class="comment">// 2. Initialize ActivityThread</span></span><br><span class="line">    <span class="type">long</span> <span class="variable">startSeq</span> <span class="operator">=</span> <span class="number">0</span>;</span><br><span class="line">    <span class="keyword">if</span> (args != <span class="literal">null</span>) &#123;</span><br><span class="line">        <span class="keyword">for</span> (<span class="type">int</span> <span class="variable">i</span> <span class="operator">=</span> args.length - <span class="number">1</span>; i &gt;= <span class="number">0</span>; --i) &#123;</span><br><span class="line">            <span class="keyword">if</span> (args[i] != <span class="literal">null</span> &amp;&amp; args[i].startsWith(PROC_START_SEQ_IDENT)) &#123;</span><br><span class="line">                startSeq = Long.parseLong(</span><br><span class="line">                        args[i].substring(PROC_START_SEQ_IDENT.length()));</span><br><span class="line">            &#125;</span><br><span class="line">        &#125;</span><br><span class="line">    &#125;</span><br><span class="line">    <span class="type">ActivityThread</span> <span class="variable">thread</span> <span class="operator">=</span> <span class="keyword">new</span> <span class="title class_">ActivityThread</span>();</span><br><span class="line"></span><br><span class="line">    <span class="comment">// 3. Mainly calls AMS.attachApplicationLocked, syncs process info, does some initialization</span></span><br><span class="line">    thread.attach(<span class="literal">false</span>, startSeq);</span><br><span class="line"></span><br><span class="line">    <span class="comment">// 4. Get main thread&#x27;s Handler, which is H, basically all App Messages are processed in this Handler</span></span><br><span class="line">    <span class="keyword">if</span> (sMainThreadHandler == <span class="literal">null</span>) &#123;</span><br><span class="line">        sMainThreadHandler = thread.getHandler();</span><br><span class="line">    &#125;</span><br><span class="line"></span><br><span class="line">    Trace.traceEnd(Trace.TRACE_TAG_ACTIVITY_MANAGER);</span><br><span class="line"></span><br><span class="line">    <span class="comment">// 5. Initialization complete, Looper starts working</span></span><br><span class="line">    Looper.loop();</span><br><span class="line"></span><br><span class="line">    <span class="keyword">throw</span> <span class="keyword">new</span> <span class="title class_">RuntimeException</span>(<span class="string">&quot;Main thread loop unexpectedly exited&quot;</span>);</span><br><span class="line">&#125;</span><br></pre></td></tr></table></figure><p>The comments are very clear, so I won’t elaborate here. After the main function finishes processing, the main thread is officially online and starts working.</p><p><a id="activitythread"></a></p><h2 id="ActivityThread-Functionality"><a href="#ActivityThread-Functionality" class="headerlink" title="ActivityThread Functionality"></a>ActivityThread Functionality</h2><p>Also, what we often say is that Android’s four major components all run on the main thread. This is actually easy to understand by looking at ActivityThread’s Handler Messages</p><figure class="highlight java"><table><tr><td class="gutter"><pre><span class="line">1</span><br><span class="line">2</span><br><span class="line">3</span><br><span class="line">4</span><br><span class="line">5</span><br><span class="line">6</span><br><span class="line">7</span><br></pre></td><td class="code"><pre><span class="line"><span class="keyword">class</span> <span class="title class_">H</span> <span class="keyword">extends</span> <span class="title class_">Handler</span> &#123; <span class="comment">// Excerpt of some, based on Android 16 latest implementation</span></span><br><span class="line">    <span class="keyword">public</span> <span class="keyword">static</span> <span class="keyword">final</span> <span class="type">int</span> <span class="variable">BIND_APPLICATION</span>        <span class="operator">=</span> <span class="number">110</span>; <span class="comment">// Application startup</span></span><br><span class="line">    <span class="keyword">public</span> <span class="keyword">static</span> <span class="keyword">final</span> <span class="type">int</span> <span class="variable">CREATE_SERVICE</span>          <span class="operator">=</span> <span class="number">114</span>; <span class="comment">// Create Service</span></span><br><span class="line">    <span class="keyword">public</span> <span class="keyword">static</span> <span class="keyword">final</span> <span class="type">int</span> <span class="variable">BIND_SERVICE</span>            <span class="operator">=</span> <span class="number">121</span>; <span class="comment">// Bind Service</span></span><br><span class="line">    <span class="keyword">public</span> <span class="keyword">static</span> <span class="keyword">final</span> <span class="type">int</span> <span class="variable">RECEIVER</span>                <span class="operator">=</span> <span class="number">113</span>; <span class="comment">// Broadcast reception</span></span><br><span class="line">    <span class="comment">// ... and other four major component related message types</span></span><br><span class="line">&#125;</span><br></pre></td></tr></table></figure><p>You can see that process creation, Activity startup, Service management, Receiver management, and Provider management are all handled here, then proceed to specific handleXXX</p><p><a id="render-thread"></a></p><h1 id="RenderThread-Creation-and-Development"><a href="#RenderThread-Creation-and-Development" class="headerlink" title="RenderThread Creation and Development"></a>RenderThread Creation and Development</h1><p>After discussing the main thread, let’s talk about the render thread, which is RenderThread. The earliest Android versions didn’t have a render thread; rendering work was all done on the main thread using CPU, calling the libSkia library. RenderThread was a new component added in Android Lollipop, responsible for taking on part of the main thread’s previous rendering work, reducing the main thread’s burden.</p><h2 id="Software-Drawing"><a href="#Software-Drawing" class="headerlink" title="Software Drawing"></a>Software Drawing</h2><p>What we generally refer to as hardware acceleration means GPU acceleration, which can be understood as using RenderThread to call GPU for rendering acceleration. Hardware acceleration is enabled by default in current Android, so if we don’t set anything, our processes will have both main thread and render thread by default (with visible content). If we add this to the Application tag in the App’s AndroidManifest:</p><figure class="highlight plaintext"><table><tr><td class="gutter"><pre><span class="line">1</span><br></pre></td><td class="code"><pre><span class="line">android:hardwareAccelerated=&quot;false&quot;</span><br></pre></td></tr></table></figure><p>We can disable hardware acceleration. When the system detects that your App has disabled hardware acceleration, it won’t initialize RenderThread and will directly use CPU to call libSkia for rendering. Its Trace tracking performance is as follows <strong>(resources are older, using Systrace diagram)</strong></p><p><img src="/en/images/Android-Perfetto-07-MainThread-And-RenderThread/15717420572997.jpg" alt="img"></p><p>Compared with the Perfetto diagram with hardware acceleration enabled at the beginning of this article, you can see that the main thread takes longer to execute because it needs to perform rendering work, making it more prone to jank. At the same time, the idle interval between frames becomes shorter, compressing the execution time of other Messages. In Perfetto, this difference can be clearly observed through the length and density of thread activity.</p><h2 id="Hardware-Accelerated-Drawing"><a href="#Hardware-Accelerated-Drawing" class="headerlink" title="Hardware-Accelerated Drawing"></a>Hardware-Accelerated Drawing</h2><p>Under normal circumstances, hardware acceleration is enabled. Main thread draw mainly builds&#x2F;updates DisplayList (RenderNode tree), then syncs via <code>syncAndDrawFrame</code>. UI thread waits briefly on key sync path, returns quickly to process messages, and RenderThread continues rendering&#x2F;submission.</p><h2 id="Render-Thread-Initialization"><a href="#Render-Thread-Initialization" class="headerlink" title="Render Thread Initialization"></a>Render Thread Initialization</h2><p>Render thread initialization occurs when content actually needs to be drawn. Generally, when we start an Activity, during the first draw execution, it checks whether the render thread is initialized; if not, it proceeds with initialization</p><p>android&#x2F;view&#x2F;ViewRootImpl.java</p><figure class="highlight java"><table><tr><td class="gutter"><pre><span class="line">1</span><br><span class="line">2</span><br><span class="line">3</span><br><span class="line">4</span><br><span class="line">5</span><br><span class="line">6</span><br><span class="line">7</span><br><span class="line">8</span><br><span class="line">9</span><br><span class="line">10</span><br><span class="line">11</span><br><span class="line">12</span><br></pre></td><td class="code"><pre><span class="line"><span class="comment">// Render thread initialization</span></span><br><span class="line">mAttachInfo.mThreadedRenderer.initializeIfNeeded(</span><br><span class="line">        mWidth, mHeight, mAttachInfo, mSurface, surfaceInsets);</span><br><span class="line"></span><br><span class="line"><span class="comment">// Initialize BlastBufferQueue - App-side buffer manager</span></span><br><span class="line"><span class="keyword">if</span> (mBlastBufferQueue == <span class="literal">null</span>) &#123;</span><br><span class="line">    mBlastBufferQueue = <span class="keyword">new</span> <span class="title class_">BLASTBufferQueue</span>(mTag, mSurfaceControl,</span><br><span class="line">        mSurfaceSize.x, mSurfaceSize.y,</span><br><span class="line">        mWindowAttributes.format);</span><br><span class="line">    mBlastBufferQueue.update(mSurfaceControl,</span><br><span class="line">        mSurfaceSize.x, mSurfaceSize.y, mWindowAttributes.format);</span><br><span class="line">&#125;</span><br></pre></td></tr></table></figure><p>The BlastBufferQueue created here will play a key role in subsequent rendering processes:</p><ul><li>Provides efficient Buffer management for RenderThread</li><li>Supports batch Transaction submission, reducing interaction overhead with SurfaceFlinger</li><li>QueuedBuffer metric changes can be observed in Perfetto</li></ul><p>Subsequently, draw is called directly</p><p>android&#x2F;view&#x2F;ThreadedRenderer.java</p><figure class="highlight java"><table><tr><td class="gutter"><pre><span class="line">1</span><br><span class="line">2</span><br><span class="line">3</span><br><span class="line">4</span><br><span class="line">5</span><br><span class="line">6</span><br><span class="line">7</span><br><span class="line">8</span><br><span class="line">9</span><br><span class="line">10</span><br><span class="line">11</span><br><span class="line">12</span><br><span class="line">13</span><br><span class="line">14</span><br><span class="line">15</span><br><span class="line">16</span><br><span class="line">17</span><br><span class="line">18</span><br><span class="line">19</span><br><span class="line">20</span><br><span class="line">21</span><br><span class="line">22</span><br><span class="line">23</span><br><span class="line">24</span><br><span class="line">25</span><br><span class="line">26</span><br><span class="line">27</span><br><span class="line">28</span><br><span class="line">29</span><br><span class="line">30</span><br><span class="line">31</span><br><span class="line">32</span><br><span class="line">33</span><br></pre></td><td class="code"><pre><span class="line">mAttachInfo.mThreadedRenderer.draw(mView, mAttachInfo, <span class="built_in">this</span>);</span><br><span class="line"></span><br><span class="line"><span class="keyword">void</span> <span class="title function_">draw</span><span class="params">(View view, AttachInfo attachInfo, DrawCallbacks callbacks)</span> &#123;</span><br><span class="line">    <span class="keyword">final</span> <span class="type">Choreographer</span> <span class="variable">choreographer</span> <span class="operator">=</span> attachInfo.mViewRootImpl.mChoreographer;</span><br><span class="line">    choreographer.mFrameInfo.markDrawStart();</span><br><span class="line"></span><br><span class="line">    <span class="comment">// Update RootDisplayList, build RenderNode tree</span></span><br><span class="line">    updateRootDisplayList(view, callbacks);</span><br><span class="line"></span><br><span class="line">    <span class="comment">// Process animated RenderNodes</span></span><br><span class="line">    <span class="keyword">if</span> (attachInfo.mPendingAnimatingRenderNodes != <span class="literal">null</span>) &#123;</span><br><span class="line">        <span class="keyword">final</span> <span class="type">int</span> <span class="variable">count</span> <span class="operator">=</span> attachInfo.mPendingAnimatingRenderNodes.size();</span><br><span class="line">        <span class="keyword">for</span> (<span class="type">int</span> <span class="variable">i</span> <span class="operator">=</span> <span class="number">0</span>; i &lt; count; i++) &#123;</span><br><span class="line">            registerAnimatingRenderNode(</span><br><span class="line">                    attachInfo.mPendingAnimatingRenderNodes.get(i));</span><br><span class="line">        &#125;</span><br><span class="line">        attachInfo.mPendingAnimatingRenderNodes.clear();</span><br><span class="line">        attachInfo.mPendingAnimatingRenderNodes = <span class="literal">null</span>;</span><br><span class="line">    &#125;</span><br><span class="line"></span><br><span class="line">    <span class="comment">// Sync and draw frame, this triggers RenderThread work</span></span><br><span class="line">    <span class="type">int</span> <span class="variable">syncResult</span> <span class="operator">=</span> syncAndDrawFrame(choreographer.mFrameInfo);</span><br><span class="line"></span><br><span class="line">    <span class="comment">// Handle various result states</span></span><br><span class="line">    <span class="keyword">if</span> ((syncResult &amp; SYNC_LOST_SURFACE_REWARD_IF_FOUND) != <span class="number">0</span>) &#123;</span><br><span class="line">        setEnabled(<span class="literal">false</span>);</span><br><span class="line">        attachInfo.mViewRootImpl.mSurface.release();</span><br><span class="line">        attachInfo.mViewRootImpl.invalidate();</span><br><span class="line">    &#125;</span><br><span class="line">    <span class="keyword">if</span> ((syncResult &amp; SYNC_REDRAW_REQUESTED) != <span class="number">0</span>) &#123;</span><br><span class="line">        attachInfo.mViewRootImpl.invalidate();</span><br><span class="line">    &#125;</span><br><span class="line">&#125;</span><br></pre></td></tr></table></figure><p>The draw above updates DisplayList first, then calls <code>syncAndDrawFrame</code> for the key <strong>UI Thread to RenderThread</strong> sync stage.</p><h3 id="UI-Thread-and-RenderThread-DisplayList-Synchronization-Mechanism"><a href="#UI-Thread-and-RenderThread-DisplayList-Synchronization-Mechanism" class="headerlink" title="UI Thread and RenderThread DisplayList Synchronization Mechanism"></a>UI Thread and RenderThread DisplayList Synchronization Mechanism</h3><p>In the <code>syncAndDrawFrame</code> key function, the following important synchronization operations occur:</p><figure class="highlight cpp"><table><tr><td class="gutter"><pre><span class="line">1</span><br><span class="line">2</span><br><span class="line">3</span><br><span class="line">4</span><br><span class="line">5</span><br><span class="line">6</span><br></pre></td><td class="code"><pre><span class="line"><span class="comment">// frameworks/base/libs/hwui/renderthread/RenderProxy.cpp</span></span><br><span class="line"><span class="function"><span class="type">int</span> <span class="title">RenderProxy::syncAndDrawFrame</span><span class="params">()</span> </span>&#123;</span><br><span class="line">    <span class="comment">// 1. Sync UI Thread&#x27;s DisplayList to RenderThread</span></span><br><span class="line">    <span class="comment">// This passes the RenderNode tree built by main thread to render thread</span></span><br><span class="line">    <span class="keyword">return</span> mDrawFrameTask.<span class="built_in">drawFrame</span>();</span><br><span class="line">&#125;</span><br></pre></td></tr></table></figure><p><code>syncAndDrawFrame</code> is not fully non-blocking. In latest AOSP, <code>DrawFrameTask::drawFrame()</code> calls <code>postAndWait()</code>: it posts work to RenderThread queue and then waits on a condition variable; RenderThread unblocks UI at an appropriate sync point. So this is “wait a bit, unblock UI as early as possible”, not “UI never waits”.</p><figure class="highlight cpp"><table><tr><td class="gutter"><pre><span class="line">1</span><br><span class="line">2</span><br><span class="line">3</span><br><span class="line">4</span><br><span class="line">5</span><br><span class="line">6</span><br><span class="line">7</span><br><span class="line">8</span><br><span class="line">9</span><br><span class="line">10</span><br><span class="line">11</span><br><span class="line">12</span><br><span class="line">13</span><br></pre></td><td class="code"><pre><span class="line"><span class="comment">// frameworks/base/libs/hwui/renderthread/DrawFrameTask.cpp</span></span><br><span class="line"><span class="function"><span class="type">int</span> <span class="title">DrawFrameTask::drawFrame</span><span class="params">()</span> </span>&#123;</span><br><span class="line">    mSyncResult = SyncResult::OK;</span><br><span class="line">    mSyncQueued = <span class="built_in">systemTime</span>(SYSTEM_TIME_MONOTONIC);</span><br><span class="line">    <span class="built_in">postAndWait</span>();   <span class="comment">// key: UI waits here</span></span><br><span class="line">    <span class="keyword">return</span> mSyncResult;</span><br><span class="line">&#125;</span><br><span class="line"></span><br><span class="line"><span class="function"><span class="type">void</span> <span class="title">DrawFrameTask::postAndWait</span><span class="params">()</span> </span>&#123;</span><br><span class="line">    AutoMutex _lock(mLock);</span><br><span class="line">    mRenderThread-&gt;<span class="built_in">queue</span>().<span class="built_in">post</span>([<span class="keyword">this</span>]() &#123; <span class="built_in">run</span>(); &#125;);</span><br><span class="line">    mSignal.<span class="built_in">wait</span>(mLock);</span><br><span class="line">&#125;</span><br></pre></td></tr></table></figure><p>The specific synchronization process includes:</p><ol><li><strong>RenderNode tree transfer</strong>: The RenderNode tree (containing DisplayList) built by the main thread during the draw process is passed to RenderThread</li><li><strong>Property synchronization</strong>: View’s transformation matrices, transparency, clipping regions, and other properties are synchronized together</li><li><strong>Resource sharing</strong>: Drawing resources like textures, Paths, and Paints establish sharing mechanisms between the two threads</li><li><strong>Rendering state transfer</strong>: Rendering state information needed for the current frame is passed to RenderThread</li></ol><p>This synchronization process is the core of Android hardware-accelerated rendering. It implements a division of labor where UI Thread focuses on logic processing and RenderThread focuses on rendering.</p><p>The core implementation of the render thread is in the libhwui library, with code located at frameworks&#x2F;base&#x2F;libs&#x2F;hwui</p><h3 id="RenderThread-and-BlastBufferQueue-Interaction-Flow"><a href="#RenderThread-and-BlastBufferQueue-Interaction-Flow" class="headerlink" title="RenderThread and BlastBufferQueue Interaction Flow"></a>RenderThread and BlastBufferQueue Interaction Flow</h3><p>After RenderThread receives the synced DisplayList, it begins actual rendering work. During this process, it interacts closely with BlastBufferQueue:</p><figure class="highlight cpp"><table><tr><td class="gutter"><pre><span class="line">1</span><br><span class="line">2</span><br><span class="line">3</span><br><span class="line">4</span><br><span class="line">5</span><br><span class="line">6</span><br><span class="line">7</span><br></pre></td><td class="code"><pre><span class="line"><span class="comment">// frameworks/base/libs/hwui/renderthread/CanvasContext.cpp</span></span><br><span class="line"><span class="function"><span class="type">void</span> <span class="title">CanvasContext::draw</span><span class="params">(<span class="type">bool</span> solelyTextureViewUpdates)</span> </span>&#123;</span><br><span class="line">    <span class="comment">// 1. calculate dirty region and prepare frame</span></span><br><span class="line">    <span class="comment">// 2. generate draw commands via mRenderPipeline-&gt;draw(...)</span></span><br><span class="line">    <span class="comment">// 3. submit via mRenderPipeline-&gt;swapBuffers(...)</span></span><br><span class="line">    <span class="comment">// 4. record dequeue/queue durations in FrameInfo</span></span><br><span class="line">&#125;</span><br></pre></td></tr></table></figure><blockquote><p>Note: The old intuitive flow (<code>dequeueBuffer/queueBuffer/flushTransaction</code>) is still useful as a mental model, but in latest mainline these details are consolidated into <code>RenderPipeline</code>&#x2F;<code>ANativeWindow</code> path, and <code>CanvasContext::draw()</code> is no longer in the old shape.</p></blockquote><p><strong>Key Features of BlastBufferQueue:</strong></p><ol><li><strong>App-side management</strong>: Unlike traditional BufferQueue created by SurfaceFlinger, BlastBufferQueue is created and managed by the App side</li><li><strong>Reduced sync waiting</strong>: Through producer-consumer model, reduces RenderThread’s wait time during dequeueBuffer</li><li><strong>Efficient buffer rotation</strong>: Supports smarter buffer management strategies, especially adapted for high refresh rate displays</li><li><strong>Asynchronous submission</strong>: Asynchronously submits completed frames to SurfaceFlinger through transaction mechanism</li><li><strong>Supports unsignaled buffer</strong>: Cooperating with SurfaceFlinger unsignaled-latch policies can reduce end-to-end latency in specific scenarios</li></ol><p><strong>In-depth Discussion on Latching Unsignaled Buffers</strong></p><p>Modern Android systems have fine-grained control over <code>presentFence</code> handling, not always waiting. This mechanism is called <strong>“Latching Unsignaled Buffers”</strong> (capturing unready buffers).</p><ul><li><p><strong>Traditional mode</strong>: SurfaceFlinger must wait for App’s <code>presentFence</code> to be signaled by GPU before it can “latch” (capture) this Buffer for composition. This ensures safety but increases latency.</p></li><li><p><strong>Latch Unsignaled mode</strong>: In this mode, SurfaceFlinger can immediately latch a Buffer that GPU hasn’t finished rendering (i.e., fence unsignaled) and start partial composition work early. When it needs to actually use this Buffer’s content, it waits for <code>presentFence</code> internally. This further hides GPU rendering latency through pipelining, crucial for reducing input latency in fullscreen apps like games and videos.</p></li></ul><p><strong>Control Switch and Policy (Android 13+)</strong>:</p><p>This behavior can be globally debugged through system property <code>debug.sf.auto_latch_unsignaled</code>, but more importantly, it’s controlled by a layered policy called <code>LatchUnsignaledConfig</code>. A typical policy is <code>AutoSingleLayer</code>:</p><ul><li>When only a <strong>single layer</strong> on screen is updating (like fullscreen games or videos), the system automatically enables Latch Unsignaled mode, as there are no complex layer dependencies at this time, lowest risk, maximum benefit.</li><li>When multiple layers are updating, the system falls back to safer traditional waiting mode to avoid potential visual errors.</li></ul><p>Therefore, SurfaceFlinger doesn’t always blindly wait for <code>presentFence</code>, but decides whether to “jump the gun” based on precise policies, achieving a balance between stability and ultimate performance.</p><h2 id="Division-of-Labor-Between-Main-Thread-and-Render-Thread"><a href="#Division-of-Labor-Between-Main-Thread-and-Render-Thread" class="headerlink" title="Division of Labor Between Main Thread and Render Thread"></a>Division of Labor Between Main Thread and Render Thread</h2><p>The main thread handles process Messages, Input events, Animation logic, Measure, Layout, Draw, and updates DisplayList, but doesn’t directly interact with SurfaceFlinger; the render thread handles rendering-related work, including interaction with BlastBufferQueue, GPU rendering command execution, and final interaction with SurfaceFlinger.</p><p>When hardware acceleration is enabled, in the Draw phase of Measure, Layout, Draw, Android uses DisplayList for drawing rather than directly using CPU to draw each frame. DisplayList is a record of a series of drawing operations, abstracted as the RenderNode class. The advantages of this indirect drawing operation are as follows:</p><ol><li>DisplayList can be drawn multiple times on demand without interacting with business logic</li><li>Specific drawing operations (like translation, scale, etc.) can be applied to the entire DisplayList without redistributing drawing operations</li><li>When all drawing operations are known, they can be optimized: for example, all text can be drawn together at once</li><li>Processing of DisplayList can be transferred to another thread (i.e., RenderThread)</li><li>After sync ends, the main thread can process other Messages without waiting for RenderThread to finish</li><li>Through BlastBufferQueue, achieve more efficient buffer management, reducing rendering latency and main thread blocking</li></ol><h3 id="BlastBufferQueue-Working-Principle"><a href="#BlastBufferQueue-Working-Principle" class="headerlink" title="BlastBufferQueue Working Principle"></a>BlastBufferQueue Working Principle</h3><p>BlastBufferQueue is a key component in modern Android rendering architecture, changing traditional buffer management methods:</p><p><strong>Traditional BufferQueue vs BlastBufferQueue:</strong></p><ol><li><p><strong>Different creation entities</strong>:</p><ul><li>Traditional BufferQueue: Created and managed by SurfaceFlinger</li><li>BlastBufferQueue: Created and managed by App side (ViewRootImpl)</li></ul></li><li><p><strong>Buffer acquisition mechanism</strong>:</p><ul><li>Traditional method: RenderThread needs to request Buffer from SurfaceFlinger through Binder call, may block if no available Buffer</li><li>BlastBufferQueue: App side pre-manages buffer pool, RenderThread can acquire Buffer more efficiently</li></ul></li><li><p><strong>Submission mechanism</strong>:</p><ul><li>Traditional method: Directly submits to SurfaceFlinger through queueBuffer</li><li>BlastBufferQueue: Batch submits through transaction mechanism, reducing Binder call overhead</li></ul></li></ol><p><strong>Observing BlastBufferQueue in Perfetto:</strong></p><p>In Perfetto traces, BlastBufferQueue state is displayed through the following key metrics:</p><h3 id="App-side-QueuedBuffer-Metric"><a href="#App-side-QueuedBuffer-Metric" class="headerlink" title="App-side QueuedBuffer Metric"></a>App-side QueuedBuffer Metric</h3><ul><li><strong>Perfetto display</strong>: <code>QueuedBuffer</code> value track</li><li><strong>AOSP definition (BLASTBufferQueue)</strong>: <code>QueuedBuffer = mNumFrameAvailable + mNumAcquired - mPendingRelease.size()</code></li><li><strong>How to read it</strong>: This is a composite state metric, not a fixed-offset formula</li><li><strong>Practical use</strong>: Focus on trend and duration, not one instantaneous value</li></ul><p><img src="/en/images/Android-Perfetto-07-MainThread-And-RenderThread/image-20250803170713946.webp" alt="image-20250803170713946"></p><h3 id="QueuedBuffer-Value-Change-Timing"><a href="#QueuedBuffer-Value-Change-Timing" class="headerlink" title="QueuedBuffer Value Change Timing"></a>QueuedBuffer Value Change Timing</h3><p><strong>QueuedBuffer +1 timing</strong>:</p><ul><li><strong>Common trigger</strong>: New buffer arrives into BLAST and becomes pending&#x2F;processable</li><li><strong>Perfetto representation</strong>: <code>QueuedBuffer</code> track rises</li><li><strong>Meaning</strong>: Frame pressure between app side and SF side increases</li></ul><p><img src="/en/images/Android-Perfetto-07-MainThread-And-RenderThread/image-20250803170852607.webp" alt="image-20250803170852607"></p><p><strong>QueuedBuffer -1 timing</strong>:</p><ul><li><strong>Trigger condition</strong>: Receives SurfaceFlinger’s <code>releaseBufferCallback</code></li><li><strong>Perfetto representation</strong>: Can observe <code>releaseBuffer</code> related events</li><li><strong>Meaning</strong>: A buffer is consumed&#x2F;handled and released, queue pressure drops</li></ul><p><img src="/en/images/Android-Perfetto-07-MainThread-And-RenderThread/image-20250803171008400.webp" alt="image-20250803171008400"></p><h3 id="SurfaceFlinger-side-BufferTX-Metric"><a href="#SurfaceFlinger-side-BufferTX-Metric" class="headerlink" title="SurfaceFlinger-side BufferTX Metric"></a>SurfaceFlinger-side BufferTX Metric</h3><ul><li><strong>Perfetto display</strong>: <code>BufferTX</code> value track in SurfaceFlinger process</li><li><strong>AOSP definition (Layer)</strong>: This tracks per-layer <code>mPendingBuffers</code>; it increases when buffers arrive server-side and decreases when buffers are latched or dropped</li><li><strong>Trigger condition</strong>: Depends on transaction and buffer lifecycle together; do not reduce it to “transaction received &#x3D;&gt; +1”</li><li><strong>Note</strong>: It is not a universal fixed-max-3 metric; behavior depends on layer type, producer-consumer pacing, and system policy</li></ul><p><img src="/en/images/Android-Perfetto-07-MainThread-And-RenderThread/image-20250803171228146.webp" alt="image-20250803171228146"></p><h3 id="Collaboration-Flow-Between-App-Side-and-SF-Side"><a href="#Collaboration-Flow-Between-App-Side-and-SF-Side" class="headerlink" title="Collaboration Flow Between App Side and SF Side"></a>Collaboration Flow Between App Side and SF Side</h3><ol><li><strong>App side</strong>: after frame submission, <code>QueuedBuffer</code> often rises</li><li><strong>Cross-process</strong>: BLAST&#x2F;SurfaceControl transaction associates updates with frameNumber and enters SF-side processing</li><li><strong>SF side</strong>: <code>BufferTX</code> changes with pending-buffer lifecycle (arrive +, latch&#x2F;drop -)</li><li><strong>Backflow</strong>: <code>releaseBufferCallback</code> reaches app side and <code>QueuedBuffer</code> falls</li></ol><h3 id="Key-Performance-Observation-Points"><a href="#Key-Performance-Observation-Points" class="headerlink" title="Key Performance Observation Points"></a>Key Performance Observation Points</h3><p>When analyzing performance, focus on:</p><ul><li><strong>App-side QueuedBuffer trend</strong>: Continuous rise without fallback often means producer-consumer mismatch; correlate with main-thread <code>performTraversals</code> and RenderThread <code>DrawFrames</code> to localize bottleneck</li><li><strong>SurfaceFlinger-side BufferTX trend</strong>: Persistently high often indicates consumer-side pressure; persistently low while app keeps missing deadlines often points to producer-side starvation</li></ul><p><a id="performance"></a></p><h1 id="Performance"><a href="#Performance" class="headerlink" title="Performance"></a>Performance</h1><p>If the main thread needs to handle all tasks, executing time-consuming operations (e.g., network access or database queries) will block the entire UI thread. Once blocked, the thread cannot dispatch any events, including drawing events. Main thread execution timeout typically brings two problems:</p><ol><li><strong>Jank</strong>: If main thread + render thread execution for each frame exceeds 8.33ms (in 120fps case), frame drops may occur (saying “may” because in some cases frames won’t actually drop, due to app duration, buffer accumulation, etc.).</li><li><strong>Freeze</strong>: If the UI thread is blocked for more than a few seconds (this threshold varies depending on the component), users will see an “<a href="http://developer.android.google.cn/guide/practices/responsiveness.html">Application Not Responding</a>“ (ANR) dialog (some manufacturers block this dialog and will directly crash to desktop)</li></ol><p>For users, both situations are undesirable, so for App developers, both issues must be resolved before release. ANR is relatively easy to locate due to detailed call stacks; but intermittent jank may require tools for analysis: <strong>Perfetto + Trace View (already integrated in Android Studio)</strong>. Therefore, understanding the relationship between main thread and render thread and their working principles is very important, which is also an original intention of this series.</p><p><a id="frametimeline"></a></p><h2 id="Perfetto’s-Unique-FrameTimeline-Feature"><a href="#Perfetto’s-Unique-FrameTimeline-Feature" class="headerlink" title="Perfetto’s Unique FrameTimeline Feature"></a>Perfetto’s Unique FrameTimeline Feature</h2><p>An important advantage of Perfetto over Systrace is providing the <strong>FrameTimeline</strong> feature, which allows you to see jank locations at a glance.</p><blockquote><p><strong>Note</strong>: FrameTimeline requires Android 12(S) or higher version support</p></blockquote><h3 id="Core-Concepts-of-FrameTimeline"><a href="#Core-Concepts-of-FrameTimeline" class="headerlink" title="Core Concepts of FrameTimeline"></a>Core Concepts of FrameTimeline</h3><p>According to <a href="https://perfetto.dev/docs/data-sources/frametimeline">Perfetto official documentation</a>, jank occurs when a frame’s actual presentation time on screen doesn’t match the scheduler’s expected presentation time. FrameTimeline adds two new tracks for each application with frames displayed on screen:</p><p><img src="/en/images/Android-Perfetto-07-MainThread-And-RenderThread/image-20250803172616453.webp" alt="image-20250803172616453"></p><h4 id="1-Expected-Timeline"><a href="#1-Expected-Timeline" class="headerlink" title="1. Expected Timeline"></a>1. Expected Timeline</h4><ul><li><strong>Purpose</strong>: Shows the rendering time window allocated by the system to the application</li><li><strong>Start time</strong>: When Choreographer callback is scheduled to run</li><li><strong>Meaning</strong>: To avoid system jank, the application needs to complete work within this time range</li></ul><h4 id="2-Actual-Timeline"><a href="#2-Actual-Timeline" class="headerlink" title="2. Actual Timeline"></a>2. Actual Timeline</h4><ul><li><strong>Purpose</strong>: Shows the actual time the application completed the frame (including GPU work)</li><li><strong>Start time</strong>: When <code>Choreographer#doFrame</code> or <code>AChoreographer_vsyncCallback</code> starts running</li><li><strong>End time</strong>: <code>max(GPU time, Post time)</code>, where Post time is when the frame was submitted to SurfaceFlinger</li></ul><p>When you click on a trace in Actual Timeline, it will show the specific consumption time for this frame (can see latency).</p><p><img src="/en/images/Android-Perfetto-07-MainThread-And-RenderThread/image-20250803172911195.webp" alt="image-20250803172911195"></p><h3 id="Color-Coding-System"><a href="#Color-Coding-System" class="headerlink" title="Color Coding System"></a>Color Coding System</h3><p>FrameTimeline uses intuitive colors to identify different frame states:</p><table><thead><tr><th>Color</th><th>Meaning</th><th>Description</th></tr></thead><tbody><tr><td><strong>Green</strong></td><td>Normal frame</td><td>No jank observed, ideal state</td></tr><tr><td><strong>Light green</strong></td><td>High latency state</td><td>Stable frame rate but delayed frame presentation, causing increased input latency</td></tr><tr><td><strong>Red</strong></td><td>Jank frame</td><td>Jank caused by current process</td></tr><tr><td><strong>Yellow</strong></td><td>App-blameless jank</td><td>Frame has jank but app is not the cause, jank caused by SurfaceFlinger</td></tr><tr><td><strong>Blue</strong></td><td>Dropped frame</td><td>SurfaceFlinger discarded this frame, chose newer frame</td></tr></tbody></table><p>Clicking different colored ActualTimeline shows the following description in the info bar, telling you the cause of jank:<br><img src="/en/images/Android-Perfetto-07-MainThread-And-RenderThread/image-20250803173304026.webp" alt="image-20250803173304026"></p><h3 id="Jank-Type-Analysis"><a href="#Jank-Type-Analysis" class="headerlink" title="Jank Type Analysis"></a>Jank Type Analysis</h3><p>FrameTimeline can identify multiple jank types:</p><h4 id="App-side-jank"><a href="#App-side-jank" class="headerlink" title="App-side jank:"></a>App-side jank:</h4><ul><li><strong>AppDeadlineMissed</strong>: App runtime exceeded expectations</li><li><strong>BufferStuffing</strong>: App sends new frame before previous frame presents, causing Buffer queue accumulation</li></ul><h4 id="SurfaceFlinger-jank"><a href="#SurfaceFlinger-jank" class="headerlink" title="SurfaceFlinger jank:"></a>SurfaceFlinger jank:</h4><ul><li><strong>SurfaceFlingerCpuDeadlineMissed</strong>: SurfaceFlinger main thread timeout</li><li><strong>SurfaceFlingerGpuDeadlineMissed</strong>: GPU composition time timeout</li><li><strong>DisplayHAL</strong>: HAL layer presentation delay</li><li><strong>PredictionError</strong>: Scheduler prediction deviation</li></ul><h3 id="Configuring-FrameTimeline"><a href="#Configuring-FrameTimeline" class="headerlink" title="Configuring FrameTimeline"></a>Configuring FrameTimeline</h3><p>Enable FrameTimeline in Perfetto configuration:</p><figure class="highlight plaintext"><table><tr><td class="gutter"><pre><span class="line">1</span><br><span class="line">2</span><br><span class="line">3</span><br><span class="line">4</span><br><span class="line">5</span><br></pre></td><td class="code"><pre><span class="line">data_sources &#123;</span><br><span class="line">    config &#123;</span><br><span class="line">        name: &quot;android.surfaceflinger.frametimeline&quot;</span><br><span class="line">    &#125;</span><br><span class="line">&#125;</span><br></pre></td></tr></table></figure><p><a id="vsync"></a></p><h2 id="Vsync-Signals-in-Perfetto"><a href="#Vsync-Signals-in-Perfetto" class="headerlink" title="Vsync Signals in Perfetto"></a>Vsync Signals in Perfetto</h2><p>In Perfetto, <strong>Vsync signals are displayed using Counter type</strong>, which differs from many people’s intuitive understanding:</p><ul><li><strong>0 → 1 change</strong>: Represents a Vsync signal</li><li><strong>1 → 0 change</strong>: Also represents a Vsync signal</li><li><strong>Incorrect understanding</strong>: Many people mistakenly think only becoming 1 is a Vsync signal</li></ul><h3 id="Correct-Vsync-Signal-Identification"><a href="#Correct-Vsync-Signal-Identification" class="headerlink" title="Correct Vsync Signal Identification"></a>Correct Vsync Signal Identification</h3><p>In the diagram below, time points 1, 2, 3, 4 are all Vsync signal arrivals</p><p><img src="/en/images/Android-Perfetto-07-MainThread-And-RenderThread/image-20250803173809421.webp" alt="image-20250803173809421"></p><p><strong>Key points</strong>:</p><ol><li><strong>Each value change is a Vsync</strong>: Whether 0→1 or 1→0</li><li><strong>Signal frequency</strong>: On 120Hz devices, there’s approximately one change every 8.33ms (actual may vary slightly due to system scheduling, referring to continuous frame output scenarios)</li><li><strong>Multi-app scenario</strong>: Counter may remain active due to other apps’ requests</li></ol><h3 id="Analysis-Techniques"><a href="#Analysis-Techniques" class="headerlink" title="Analysis Techniques"></a>Analysis Techniques</h3><p><strong>Determining if App received Vsync</strong>:</p><ul><li><strong>Correct method</strong>: Check if there’s a corresponding <code>FrameDisplayEventReceiver.onVsync</code> event in the App process</li><li><strong>Incorrect method</strong>: Judging solely by <code>vsync-app</code> counter changes in SurfaceFlinger</li></ul><p><a id="refs"></a></p><h1 id="References"><a href="#References" class="headerlink" title="References"></a>References</h1><ol><li><a href="https://juejin.im/post/5a9e01c3f265da239d48ce32">https://juejin.im/post/5a9e01c3f265da239d48ce32</a></li><li><a href="http://www.cocoachina.com/articles/35302">http://www.cocoachina.com/articles/35302</a></li><li><a href="https://juejin.im/post/5b7767fef265da43803bdc65">https://juejin.im/post/5b7767fef265da43803bdc65</a></li><li><a href="http://gityuan.com/2019/06/15/flutter_ui_draw/">http://gityuan.com/2019/06/15/flutter_ui_draw&#x2F;</a></li><li><a href="https://developer.android.google.cn/guide/components/processes-and-threads">https://developer.android.google.cn/guide/components/processes-and-threads</a></li></ol><p><a id="attachments"></a></p><h1 id="Attachments"><a href="#Attachments" class="headerlink" title="Attachments"></a>Attachments</h1><p>The Perfetto trace files involved in this article have also been uploaded. You can download and open them in Perfetto UI (<a href="https://ui.perfetto.dev/">https://ui.perfetto.dev/</a>) for analysis</p><p><a href="https://github.com/Gracker/SystraceForBlog/tree/master/Android_Perfetto/demo_app_aosp_scroll.perfetto-trace">Click this link to download the Perfetto trace files involved in this article</a></p><p><a id="about"></a></p><h1 id="About-Me-amp-amp-Blog"><a href="#About-Me-amp-amp-Blog" class="headerlink" title="About Me &amp;&amp; Blog"></a>About Me &amp;&amp; Blog</h1><p>Below is a personal introduction and related links. I look forward to communicating with you all. When three people walk together, one of them can be my teacher!</p><ol><li><a href="https://www.androidperformance.com/about/">Blogger Personal Introduction</a>: Contains personal WeChat and WeChat group links.</li><li><a href="https://www.androidperformance.com/2019/12/01/BlogMap/">Blog Content Navigation</a>: A navigation of personal blog content.</li><li><a href="https://androidperformance.com/2018/05/07/Android-performance-optimization-skills-and-tools/">Excellent Blog Articles Collected and Organized by Individuals - Must-Know for Android Performance Optimization</a>: Welcome everyone to recommend yourself and recommend (WeChat private chat is fine)</li><li><a href="https://www.androidperformance.com/2023/12/30/the-performance/">Android Performance Optimization Knowledge Planet</a>: Welcome to join, thanks for support~</li></ol><blockquote><p><strong>One person can go faster, a group of people can go further</strong></p></blockquote><p><img src="/en/images/WechatIMG581.webp" alt="WeChat QR Code"></p>]]></content>
    
    
    <summary type="html">&lt;p&gt;This is the seventh article in the Perfetto series, focusing on &lt;strong&gt;MainThread&lt;/strong&gt; (UI Thread) and &lt;strong&gt;RenderThread&lt;/strong&gt;, the two most critical threads in any Android application. This article will examine the workflow of MainThread and RenderThread from Perfetto’s perspective, covering topics such as jank, software rendering, and frame drop calculations.&lt;/p&gt;
&lt;p&gt;As Google officially promotes Perfetto as the replacement for Systrace, Perfetto has become the mainstream choice in performance analysis. This article combines specific Perfetto trace information to help readers understand the complete workflow of MainThread and RenderThread, enabling you to:&lt;/p&gt;
&lt;ul&gt;
&lt;li&gt;&lt;strong&gt;Accurately identify key trace tags&lt;/strong&gt;: Understand the roles of critical threads like UI Thread and RenderThread&lt;/li&gt;
&lt;li&gt;&lt;strong&gt;Understand the complete frame rendering process&lt;/strong&gt;: Every step from Vsync signal to screen display&lt;/li&gt;
&lt;li&gt;&lt;strong&gt;Locate performance bottlenecks&lt;/strong&gt;: Quickly find the root cause of jank and performance issues through trace information&lt;/li&gt;
&lt;/ul&gt;</summary>


    <category term="Android" scheme="https://androidperformance.com/en/categories/Android/"/>
    
    
    <category term="Android" scheme="https://androidperformance.com/en/tags/Android/"/>
    
    <category term="Perfetto" scheme="https://androidperformance.com/en/tags/Perfetto/"/>
    
    <category term="Systrace" scheme="https://androidperformance.com/en/tags/Systrace/"/>
    
    <category term="Jank" scheme="https://androidperformance.com/en/tags/Jank/"/>
    
    <category term="Performance" scheme="https://androidperformance.com/en/tags/Performance/"/>
    
  </entry>
  
  <entry>
    <title>Android Perfetto Series 6: Why 120Hz? Advantages and Challenges</title>
    <link href="https://androidperformance.com/en/2025/04/26/Android-Perfetto-06-Why-120Hz/"/>
    <id>https://androidperformance.com/en/2025/04/26/Android-Perfetto-06-Why-120Hz/</id>
    <published>2025-04-26T06:13:38.000Z</published>
    <updated>2026-05-10T23:29:51.057Z</updated>
    
    <content type="html"><![CDATA[<p>This is the sixth article in the Android Perfetto series, mainly introducing knowledge related to 120Hz refresh rate on Android devices. Nowadays, 120Hz has become standard configuration for flagship Android phones. This article will discuss the advantages and challenges brought by high refresh rates, and analyze the working principle of 120Hz from a system perspective.</p><p>Over the past few years, the refresh rate of mobile device screens has evolved from 60Hz to 90Hz, and then to the now common 120Hz. This improvement not only brings smoother visual experience, but also puts forward new requirements for system architecture and application development. Through the Perfetto tool, we can more intuitively understand the process and performance of frame rendering on high refresh rate devices.</p><span id="more"></span><h2 id="Table-of-Contents"><a href="#Table-of-Contents" class="headerlink" title="Table of Contents"></a>Table of Contents</h2><ul><li><a href="#series">Perfetto Series Catalog</a></li><li><a href="#concepts">Basic Concepts</a></li><li><a href="#impl">System Implementation and Principles</a></li><li><a href="#pros-cons">Advantages and Challenges of 120Hz</a></li><li><a href="#thoughts">Thoughts and Future Outlook</a></li><li><a href="#conclusion">Conclusion</a></li><li><a href="#about">About Me &amp;&amp; Blog</a></li></ul><p><a id="series"></a></p><h1 id="Perfetto-Series-Catalog"><a href="#Perfetto-Series-Catalog" class="headerlink" title="Perfetto Series Catalog"></a>Perfetto Series Catalog</h1><ol><li><a href="https://www.androidperformance.com/en/2024/03/27/Android-Perfetto-101/">Android Perfetto Series Catalog</a></li><li><a href="https://www.androidperformance.com/en/2024/05/21/Android-Perfetto-01-What-is-perfetto/">Android Perfetto Series 1: Introduction to Perfetto</a></li><li><a href="https://www.androidperformance.com/en/2024/05/21/Android-Perfetto-02-how-to-get-perfetto/">Android Perfetto Series 2: Capturing Perfetto Traces</a></li><li><a href="https://www.androidperformance.com/en/2024/05/21/Android-Perfetto-03-how-to-analysis-perfetto/">Android Perfetto Series 3: Familiarizing with the Perfetto View</a></li><li><a href="https://www.androidperformance.com/en/2025/02/08/Android-Perfetto-04-Open-Big-Trace-With-Command-Line/">Android Perfetto Series 4: Opening Large Traces via Command Line</a></li><li><a href="https://www.androidperformance.com/en/2025/03/26/Android-Perfetto-05-Chorergrapher/">Android Perfetto Series 5: Choreographer-based Rendering Flow</a></li><li><a href="https://www.androidperformance.com/en/2025/04/26/Android-Perfetto-06-Why-120Hz/">Android Perfetto Series 6: Why 120Hz? Advantages and Challenges</a></li><li><a href="https://www.androidperformance.com/en/2025/08/02/Android-Perfetto-07-MainThread-And-RenderThread/">Android Perfetto Series 7: MainThread and RenderThread Deep Dive</a></li><li><a href="https://www.androidperformance.com/en/2025/08/05/Android-Perfetto-08-Vsync/">Android Perfetto Series 8: Understanding Vsync and Performance Analysis</a></li><li><a href="https://www.androidperformance.com/en/2025/11/12/Android-Perfetto-09-CPU/">Android Perfetto Series 9: Interpreting CPU Information</a></li><li><a href="https://www.androidperformance.com/2025/11/16/Android-Perfetto-10-Binder/">Android Perfetto Series 10: Binder Scheduling and Lock Contention</a></li><li><a href="https://www.bilibili.com/video/BV1oi82efE4D/">Video (Bilibili) - Android Perfetto Basics and Case Studies</a></li><li><a href="https://www.bilibili.com/video/BV17A6bBLECu/">Video (Bilibili) - Android Perfetto: Trace Graph Types - AOSP, WebView, Flutter + OEM System Optimization</a></li></ol><p>If you haven’t seen the Systrace series yet, here is the portal:</p><ol><li><a href="https://www.androidperformance.com/2019/05/26/Android_Systrace_0/#/%E7%B3%BB%E5%88%97%E6%96%87%E7%AB%A0%E7%9B%AE%E5%BD%95">Systrace Series Catalog</a>: Systematically introduced the use of Systrace, the predecessor of Perfetto, and used Systrace to learn and understand the basic rules of Android performance optimization and Android system operation.</li><li><a href="https://www.androidperformance.com/">Personal Blog</a>: Personal blog, mainly content related to Android, and also put some content related to life and work.</li></ol><p>Welcome everyone to join the WeChat group or Planet on the <a href="https://www.androidperformance.com/about/">About Me</a> page to discuss your problems, the parts about Perfetto you most want to see, and discuss all Android development related content with group friends.</p><p><a id="concepts"></a></p><h1 id="Basic-Concepts"><a href="#Basic-Concepts" class="headerlink" title="Basic Concepts"></a>Basic Concepts</h1><h2 id="What-is-Screen-Refresh-Rate"><a href="#What-is-Screen-Refresh-Rate" class="headerlink" title="What is Screen Refresh Rate?"></a>What is Screen Refresh Rate?</h2><p>Screen refresh rate is a <strong>hardware</strong> concept, referring to the number of times the screen refreshes the display content per second, in Hertz (Hz).</p><ul><li>60Hz screen: Refresh 60 times per second, each refresh interval is about 16.67ms</li><li>90Hz screen: Refresh 90 times per second, each refresh interval is about 11.11ms</li><li>120Hz screen: Refresh 120 times per second, each refresh interval is about 8.33ms</li></ul><p>The screen refresh rate determines the highest frame rate that the display device can display, but the screen is only responsible for displaying content at a fixed frequency, and the specific content displayed is determined by the software system.</p><h2 id="What-is-FPS"><a href="#What-is-FPS" class="headerlink" title="What is FPS?"></a>What is FPS?</h2><p>FPS (Frames Per Second) is a <strong>software</strong> concept, referring to how many frames of content the system generates per second for the screen to display.</p><ul><li>60FPS: The system generates 60 frames of content per second, with about 16.67ms processing time per frame</li><li>90FPS: The system generates 90 frames of content per second, with about 11.11ms processing time per frame</li><li>120FPS: The system generates 120 frames of content per second, with about 8.33ms processing time per frame</li></ul><p>To get the best visual experience, ideally FPS should match the screen refresh rate, but the actual experience is closely related to the content type and user perception:</p><ol><li><p><strong>Content Type Difference</strong>:</p><ul><li><strong>Video Content</strong>: Movies (24fps) or videos (30fps) look smooth even on 120Hz screens because video content contains natural motion blur and matches viewer expectations for the medium.</li><li><strong>Interactive Interface</strong>: Scrolling lists, animations, and other interactive scenarios have higher requirements for frame rate. Dropping from 120fps to 110fps may be perceived as stuttering by users.</li></ul></li><li><p><strong>Frame Rate Stability</strong>: Stable low frame rate (such as stable 60fps) usually has a better experience than unstable high frame rate (such as fluctuating between 90-120fps).</p></li><li><p><strong>System Behavior</strong>:</p><ul><li>When FPS is lower than the refresh rate, the display system will reuse frames or insert black frames.</li><li>When FPS is higher than the refresh rate, excess frames will be discarded, causing waste of computing resources.</li></ul></li></ol><p>Different application scenarios have different smoothness standards, and developers need to choose appropriate optimization strategies according to the application type.</p><h2 id="What-is-Vsync"><a href="#What-is-Vsync" class="headerlink" title="What is Vsync?"></a>What is Vsync?</h2><p>Vsync (Vertical Synchronization) is a mechanism that synchronizes software frame rate with screen refresh rate, aiming to avoid screen tearing phenomena. In Android systems, Vsync signals are used to trigger the timing for applications to render a new frame, ensuring that the rendering process remains consistent with the screen refresh cycle.</p><h2 id="Why-120Hz-Became-the-New-Standard"><a href="#Why-120Hz-Became-the-New-Standard" class="headerlink" title="Why 120Hz Became the New Standard?"></a>Why 120Hz Became the New Standard?</h2><p>The evolution of the market from 60Hz to 90Hz and then to 120Hz has clear technical and user experience driving factors:</p><ol><li><p><strong>Higher Smoothness</strong>: 120Hz provides twice the visual information of 60Hz, making scrolling, animation, and other interactions feel more fluid and natural.</p></li><li><p><strong>Reduced Latency</strong>: The delay from input event to display result is reduced from 16.67ms at 60Hz to 8.33ms at 120Hz, making user operation feedback more timely.</p></li><li><p><strong>Mature Hardware Support</strong>: Modern mobile processors (such as Qualcomm Snapdragon 8 series, MediaTek Dimensity series) have enough performance to support stable operation of 120Hz.</p></li><li><p><strong>Battery Technology Progress</strong>: More efficient battery and power management technologies alleviate the power consumption pressure brought by high refresh rates.</p></li><li><p><strong>Variable Refresh Rate Technology</strong>: Adaptive refresh rate technologies like LTPO allow devices to intelligently switch refresh rates in different scenarios, balancing smoothness and power consumption.</p></li></ol><p>Nowadays, 120Hz is not only standard for Android flagship models, but even iOS devices (iPhone 13 Pro and above) also support 120Hz ProMotion technology, marking that high refresh rate has become a basic feature of high-end mobile devices.</p><p><a id="impl"></a></p><h1 id="System-Implementation-and-Principles"><a href="#System-Implementation-and-Principles" class="headerlink" title="System Implementation and Principles"></a>System Implementation and Principles</h1><h2 id="120Hz-Rendering-Process-from-Perfetto’s-Perspective"><a href="#120Hz-Rendering-Process-from-Perfetto’s-Perspective" class="headerlink" title="120Hz Rendering Process from Perfetto’s Perspective"></a>120Hz Rendering Process from Perfetto’s Perspective</h2><p>At 120Hz refresh rate, the rendering process of the Android system has not changed fundamentally. The main difference is that the time budget for each frame is shortened from 16.67ms to 8.33ms (<strong>Of course, App duration is not discussed here. If App Duration configuration is greater than 8.33ms, then it is acceptable for App’s UI + Render to be completed within the App duration interval. Note that App Duration configuration varies by machine</strong>). The specific rendering Perfetto trace of the application in 120Hz environment is shown below:</p><p><img src="/en/images/Android-Perfetto-06-Why-120Hz/image-20250426144755156.webp" alt="120Hz App Rendering Flow"></p><p>On 120Hz devices, we can see:</p><ol><li><strong>Vsync Interval</strong>: VSYNC signal triggers once every 8.33ms</li><li><strong>Frame Processing Flow</strong>: Processing of each frame still follows the order of Input → Animation → Traversal</li><li><strong>Time Compression</strong>: All processing steps must be completed in a shorter time, placing higher demands on system and application performance</li></ol><p>Two Buffer-related Traces appear in the figure above. Here is a brief explanation:</p><ol><li><strong>QueuedBuffer</strong>: (e.g., QueuedBuffer - VRI[ImproveSnsTimelineUI]#748BLAST#748)<ul><li>This Trace Tag is printed in the <strong>App Process</strong></li><li>Indicates that the application has finished rendering one frame and put the rendered Buffer into the queue preparing to submit to SurfaceFlinger</li><li>In systems using BlastBufferQueue, this moment marks that RenderThread completes rendering and is ready to transmit the result to system service</li></ul></li><li><strong>BufferTX</strong>: (e.g., BufferTX - com.tencent.mm&#x2F;com.tencent.mm.plugin.sns.ui.improve.ImproveSnsTimelineUI#47974)<ul><li>This Trace Tag is printed in the <strong>SurfaceFlinger Process</strong></li><li>Indicates the moment SurfaceFlinger receives the Buffer transmitted from the application and starts processing</li><li>TX stands for “Transfer&#x2F;Transmission”, implying the transmission process of the buffer</li></ul></li></ol><p><strong>The correct process should be:</strong></p><ol><li>App’s RenderThread calls <code>queueBuffer</code>. At this time, the App considers itself to have handed over a Buffer, so <code>QueuedBuffer</code> <strong>+1</strong>.</li><li>The Buffer is transmitted to SF. After SF receives (latch&#x2F;acquire) it, <code>BufferTX</code> <strong>+1</strong>.</li><li>SF uses this Buffer to complete composition and display on screen in a future Vsync cycle.</li><li>When SF no longer needs this Buffer (for example, it has been replaced by a new frame, or has been stably displayed for enough time), SF will release this Buffer.</li><li>After SF releases the Buffer, <code>BufferTX</code> <strong>-1</strong>. At the same time, the App will receive a callback that the Buffer has been released. At this time, the App side’s <code>QueuedBuffer</code> <strong>will only -1</strong>, indicating that this Buffer has successfully returned to the buffer pool and can be used again.</li></ol><p>Perfetto also provides Buffer tracking function. Click Actual Timeline above App (this part of knowledge can be seen at <a href="https://www.androidperformance.com/en/2024/05/21/Android-Perfetto-01-What-is-perfetto/#Vsync-App-Is-Not-That-Intuitive">Actual Timeline Introduction</a>), and you can see the whole process of this Buffer from production to consumption.</p><p><img src="/en/images/Android-Perfetto-06-Why-120Hz/image-20250426150441133.webp" alt="image-20250426150441133"></p><h2 id="System-Architecture-Optimization-Supporting-120Hz"><a href="#System-Architecture-Optimization-Supporting-120Hz" class="headerlink" title="System Architecture Optimization Supporting 120Hz"></a>System Architecture Optimization Supporting 120Hz</h2><p>To support 120Hz high refresh rate smoothly, Android system architecture has made many <strong>adjustments and improvements</strong>. These changes involve multiple components, covering <strong>important optimizations</strong> of the entire rendering pipeline. Let’s look at several key technical points in detail:</p><h3 id="Adaptive-Refresh-Rate-Technology"><a href="#Adaptive-Refresh-Rate-Technology" class="headerlink" title="Adaptive Refresh Rate Technology"></a>Adaptive Refresh Rate Technology</h3><p>Modern Android devices adopt multi-level refresh rate management strategies:</p><ul><li><p><strong>Hardware Layer Support</strong>: LTPO (Low Temperature Polycrystalline Oxide) display technology allows the screen to precisely adjust refresh rate within the range of 1Hz to 120Hz, rather than switching between fixed gears.</p></li><li><p><strong>Content Perception Algorithm</strong>: The system automatically adjusts refresh rate by analyzing screen content types:</p><ul><li>Static content (reading, picture browsing): Drop to 10-30Hz</li><li>Video playback: Match video source frame rate (usually 24-60Hz)</li><li>Scrolling and interaction: Increase to 90-120Hz</li><li>Games: Dynamically adjust according to game engine output frame rate</li></ul></li><li><p><strong>API Support</strong>: Android provides <code>Surface.setFrameRate()</code> API, allowing applications to explicitly specify their preferred frame rate, and the system will try its best to meet this request.</p></li></ul><figure class="highlight java"><table><tr><td class="gutter"><pre><span class="line">1</span><br><span class="line">2</span><br></pre></td><td class="code"><pre><span class="line"><span class="comment">// Application can specify preferred frame rate and refresh rate behavior</span></span><br><span class="line">surface.setFrameRate(<span class="number">60.0f</span>, Surface.FRAME_RATE_COMPATIBILITY_DEFAULT);</span><br></pre></td></tr></table></figure><p><a id="pros-cons"></a></p><h1 id="Advantages-and-Challenges-of-120Hz"><a href="#Advantages-and-Challenges-of-120Hz" class="headerlink" title="Advantages and Challenges of 120Hz"></a>Advantages and Challenges of 120Hz</h1><h2 id="Experience-Improvements-Brought-by-120Hz"><a href="#Experience-Improvements-Brought-by-120Hz" class="headerlink" title="Experience Improvements Brought by 120Hz"></a>Experience Improvements Brought by 120Hz</h2><p>When I got my first 120Hz mobile phone, the most intuitive feeling was:</p><ol><li><p><strong>Everything becomes smoother</strong>: From desktop sliding, application switching to browsing Weibo, screen updates are more frequent, and content follows finger movement more accurately. Especially when quickly sliding Moments or Weibo feed stream, the text is still clear and distinguishable, rather than a blur.</p></li><li><p><strong>Game experience greatly improved</strong>: When playing competitive games like “Honor of Kings” or “Peacekeeper Elite”, the improvement in screen smoothness also improves my operation accuracy. In fierce confrontation, being able to see enemy actions 8ms earlier, although the time is short, does bring advantages.</p></li><li><p><strong>Reduced eye fatigue</strong>: This may be a personal feeling, but staring at a 120Hz screen for a long time is indeed more comfortable than 60Hz, especially when reading and sliding content, the burden on eyes tracking content is reduced.</p></li><li><p><strong>More precise touch experience</strong>: 120Hz is not only fast display update, but touch sampling rate usually also increases, making operation response more timely, whether typing or fine control is more accurate.</p></li></ol><h2 id="Practical-Problems-Faced-by-120Hz"><a href="#Practical-Problems-Faced-by-120Hz" class="headerlink" title="Practical Problems Faced by 120Hz"></a>Practical Problems Faced by 120Hz</h2><p>Of course, high refresh screens also bring a series of technical challenges:</p><ol><li><p><strong>Power consumption problem</strong>: In actual measurement, the same mobile phone consumes about 15-20% more power in 120Hz mode than in 60Hz. For the already tight mobile phone battery life, this is not a small pressure.</p></li><li><p><strong>Increased development threshold</strong>: Applications that could barely run in 60Hz environment may appear stuck when reaching 120Hz. Each frame has only 8.33ms processing time, which puts higher requirements on developer’s code efficiency.</p></li><li><p><strong>Increased heating</strong>: Running high frame rate games for a long time, mobile phone heating is significantly more serious than 60Hz, which not only affects experience but may also lead to performance throttling.</p></li><li><p><strong>Application adaptation is not perfect</strong>: Many applications have not been optimized for high brush. Even on 120Hz screens, the actual output frame rate may still be 60fps, wasting screen potential.</p></li></ol><p><a id="thoughts"></a></p><h1 id="Thoughts-and-Future-Outlook"><a href="#Thoughts-and-Future-Outlook" class="headerlink" title="Thoughts and Future Outlook"></a>Thoughts and Future Outlook</h1><h2 id="On-Demand-Adjustment-Intelligent-Management-of-Refresh-Rate-from-ProMotion"><a href="#On-Demand-Adjustment-Intelligent-Management-of-Refresh-Rate-from-ProMotion" class="headerlink" title="On-Demand Adjustment: Intelligent Management of Refresh Rate from ProMotion"></a>On-Demand Adjustment: Intelligent Management of Refresh Rate from ProMotion</h2><p>As 120Hz high refresh rate gradually becomes standard for flagship mobile phones, a question worth thinking about is: Do we really need to maintain 120Hz refresh rate in all scenarios?</p><p>Apple’s ProMotion technology actually gives a more reasonable answer: Activate high refresh rate only in animation scenarios with high perception, while appropriately reducing refresh rate in other scenarios to save power.</p><p><img src="/en/images/Android-Perfetto-06-Why-120Hz/image-20250426152428866.webp" alt="iOS Promotion Animation Recommended Frame Rate"></p><p>From the figure above, we can see that Apple provides very detailed ProMotion frame rate recommended configurations for different types of animation scenarios in iOS developer documentation:</p><ol><li><p><strong>High-impact animations</strong>:</p><ul><li>Applicable scenarios: Full screen transition (such as expanding when clicking thumbnail in Photos app), first-person games, Sheet popup display, etc.</li><li>Recommended frame rate: 80-120Hz, preferred 120Hz (CAFrameRateRange(minimum:80, maximum:120, preferred:120))</li><li>Usage suggestion: Use with caution, apply only in key interaction scenarios to reduce power consumption</li></ul></li><li><p><strong>Opacity&#x2F;Color transition and micro movement</strong>:</p><ul><li>Applicable scenarios: Switch state change, progress indicator rotation, background blur effect, etc.</li><li>Recommended frame rate: Use system default frame rate range (CAFrameRateRange.default)</li><li>Usage suggestion: These animations do not need excessively high frame rate, visual effect difference is not big</li></ul></li><li><p><strong>Low speed small animation</strong>:</p><ul><li>Applicable scenarios: Clock pointer movement, slow progress bar, etc.</li><li>Recommended frame rate: Depending on animation speed, choose 8-15Hz, 15-24Hz or 30-48Hz, etc.</li><li>Usage suggestion: Low frame rate visual effect is good enough in these scenarios, and can significantly save power</li></ul></li><li><p><strong>All other cases</strong>:</p><ul><li>Recommended using system default frame rate</li></ul></li></ol><p>This refined frame rate management strategy not only allows the system to achieve the best balance between user experience and battery life, but also provides clear guidance for developers. Compared with simply and crudely using 120Hz globally, this targeted frame rate adjustment scheme is obviously more scientific and efficient.</p><h2 id="Trade-off-Between-Power-and-Experience"><a href="#Trade-off-Between-Power-and-Experience" class="headerlink" title="Trade-off Between Power and Experience"></a>Trade-off Between Power and Experience</h2><p>Tests show that reducing refresh rate from 120Hz to 60Hz can save about 10-15% of power. Intelligently controlling refresh rate can significantly extend battery life while maintaining good user experience.</p><p>The main value of 120Hz lies in improving interaction smoothness and response speed, rather than always maintaining high refresh rate. A smarter approach is to dynamically adjust according to actual needs: <strong>Use high refresh rate in scenarios sensitive to user perception, and reduce refresh rate in scenarios insensitive to user perception</strong>.</p><h2 id="Developer’s-Adaptation-Strategy"><a href="#Developer’s-Adaptation-Strategy" class="headerlink" title="Developer’s Adaptation Strategy"></a>Developer’s Adaptation Strategy</h2><p>App developers should realize that not all content needs to be rendered at the highest frame rate. Through APIs provided by Android (such as <code>Surface.setFrameRate()</code>), appropriate frame rates can be specified for different content types, cooperating with the system’s adaptive refresh rate mechanism to achieve the best balance of performance and power.</p><p>In short, the future development direction of high refresh rate technology should be more intelligent and refined adaptive adjustment, rather than simply pursuing higher numbers. True technological progress is finding the best balance point between experience and energy efficiency without user perception.</p><p><a id="conclusion"></a></p><h1 id="Conclusion"><a href="#Conclusion" class="headerlink" title="Conclusion"></a>Conclusion</h1><p>Looking back at the development of high refresh screens in the past few years, I think 120Hz is indeed an important leap in mobile phone interaction experience. Although it brings challenges such as power consumption and development complexity, the benefits are obvious: smoother experience, lower input latency, and more natural animation effects.</p><p>For developers, tools like Perfetto allow us to see performance problems under 120Hz clearly and carry out targeted optimization. Although the budget reduction from 16ms to 8ms sounds tight, in fact mainstream processors already have enough ability to cope with this challenge. As long as UI complexity is planned reasonably and main thread blocking is avoided, smooth 120fps experience is completely achievable.</p><p>From the trend point of view, I don’t think mobile phone screen refresh rate will climb indefinitely. 120Hz may become the standard for a long time, and the future focus will be more on how to intelligently adjust refresh rate to find the best balance between experience and power consumption in different scenarios. After all, what we pursue is not high numbers, but good actual experience.</p><p><a id="about"></a></p><h1 id="About-Me-amp-amp-Blog"><a href="#About-Me-amp-amp-Blog" class="headerlink" title="About Me &amp;&amp; Blog"></a>About Me &amp;&amp; Blog</h1><p>Here is a personal introduction and related links. I hope to communicate more with my peers. When three people walk together, there must be one who can be my teacher!</p><ol><li><a href="https://www.androidperformance.com/about/">Blogger Personal Introduction</a>: Contains personal WeChat and WeChat group links.</li><li><a href="https://androidperformance.com/2019/12/01/BlogMap/">This Blog Content Navigation</a>: A navigation of personal blog content.</li><li><a href="https://androidperformance.com/2018/05/07/Android-performance-optimization-skills-and-tools/">Personal Collection of Excellent Blog Articles - Android Performance Optimization Must-Know</a>: Welcome everyone to recommend themselves and others (WeChat private chat is fine)</li><li><a href="https://www.androidperformance.com/2023/12/30/the-performance/">Android Performance Optimization Knowledge Planet</a>: Welcome to join, thank you for your support~</li></ol><blockquote><p><strong>One person can go faster, a group of people can go further</strong></p></blockquote><p><img src="/en/images/WechatIMG581.webp" alt="Wechat Scan"></p>]]></content>
    
    
    <summary type="html">&lt;p&gt;This is the sixth article in the Android Perfetto series, mainly introducing knowledge related to 120Hz refresh rate on Android devices. Nowadays, 120Hz has become standard configuration for flagship Android phones. This article will discuss the advantages and challenges brought by high refresh rates, and analyze the working principle of 120Hz from a system perspective.&lt;/p&gt;
&lt;p&gt;Over the past few years, the refresh rate of mobile device screens has evolved from 60Hz to 90Hz, and then to the now common 120Hz. This improvement not only brings smoother visual experience, but also puts forward new requirements for system architecture and application development. Through the Perfetto tool, we can more intuitively understand the process and performance of frame rendering on high refresh rate devices.&lt;/p&gt;</summary>


    <category term="Android" scheme="https://androidperformance.com/en/categories/Android/"/>
    
    
    <category term="Android" scheme="https://androidperformance.com/en/tags/Android/"/>
    
    <category term="Perfetto" scheme="https://androidperformance.com/en/tags/Perfetto/"/>
    
    <category term="Systrace" scheme="https://androidperformance.com/en/tags/Systrace/"/>
    
    <category term="Jank" scheme="https://androidperformance.com/en/tags/Jank/"/>
    
    <category term="Performance" scheme="https://androidperformance.com/en/tags/Performance/"/>
    
  </entry>
  
  <entry>
    <title>Android Perfetto Series 5: Choreographer-based Rendering Flow</title>
    <link href="https://androidperformance.com/en/2025/03/26/Android-Perfetto-05-Chorergrapher/"/>
    <id>https://androidperformance.com/en/2025/03/26/Android-Perfetto-05-Chorergrapher/</id>
    <published>2025-03-26T10:55:11.000Z</published>
    <updated>2026-05-10T23:29:51.057Z</updated>
    
    <content type="html"><![CDATA[<p>This article introduces <strong>Choreographer</strong>, a class that App developers may not frequently encounter but is critically important in the Android Framework rendering pipeline. We will cover the background of its introduction, a brief overview, partial source code analysis, its interaction with MessageQueue, its application in APM (Application Performance Monitoring), and some optimization ideas for Choreographer by mobile phone manufacturers.</p><p>The introduction of Choreographer is mainly to cooperate with Vsync to provide a stable Message processing timing for upper-layer application rendering. When the Vsync signal arrives, the system controls the timing of each frame’s drawing operation by adjusting the Vsync signal cycle. Currently, the screen refresh rate of mainstream mobile phones has reached 120Hz, which means refreshing once every 8.3ms. The system adjusts the Vsync cycle accordingly to match the screen refresh frequency. When each Vsync cycle arrives, the Vsync signal wakes up the Choreographer to execute the application’s drawing operation. This is the main purpose of introducing Choreographer. Understanding Choreographer can also help application developers deeply understand the operating principle of each frame, and at the same time deepen their understanding of core components such as <strong>Message</strong>, <strong>Handler</strong>, <strong>Looper</strong>, <strong>MessageQueue</strong>, <strong>Input</strong>, <strong>Animation</strong>, <strong>Measure</strong>, <strong>Layout</strong>, and <strong>Draw</strong>. Many <strong>APM</strong> (Application Performance Monitoring) tools also utilize the combination mechanisms of <strong>Choreographer</strong> (via FrameCallback), <strong>FrameMetrics&#x2F;gfxinfo framestats</strong> (internally backed by FrameInfo), <strong>MessageQueue</strong> (via IdleHandler), and <strong>Looper</strong> (via custom MessageLogging) for performance monitoring. After deeply understanding these mechanisms, developers can conduct performance optimization more specifically and form systematic optimization ideas.</p><span id="more"></span><h2 id="Table-of-Contents"><a href="#Table-of-Contents" class="headerlink" title="Table of Contents"></a>Table of Contents</h2><ul><li><a href="#series">Perfetto Series Catalog</a></li><li><a href="#main-thread-essence">The Essence of Main Thread Execution</a></li><li><a href="#choreographer-intro">Introduction to Choreographer</a></li><li><a href="#source">Source Code Analysis</a></li><li><a href="#messagequeue">MessageQueue and Choreographer</a></li><li><a href="#apm">APM and Choreographer</a></li><li><a href="#vendor">Manufacturer Optimizations</a></li><li><a href="#refs">Reference Materials</a></li><li><a href="#zhihu">Zhihu Address</a></li><li><a href="#about">About Me &amp; Blog</a></li></ul><p>This is the fifth article in the Perfetto series, mainly giving a brief introduction to Choreographer in Perfetto.</p><p>The <strong>purpose</strong> of this series is to view the overall operation of the Android system from another perspective through the Perfetto tool, and also to learn about the Framework from a different angle. Maybe you have read many articles about the Framework, but always can’t remember the code, or are not clear about its running process. Perhaps from the graphical perspective of Perfetto, you can understand it more deeply.</p><p><a id="series"></a></p><h1 id="Perfetto-Series-Catalog"><a href="#Perfetto-Series-Catalog" class="headerlink" title="Perfetto Series Catalog"></a>Perfetto Series Catalog</h1><ol><li><a href="https://www.androidperformance.com/2024/03/27/Android-Perfetto-101/#/Perfetto-%E7%B3%BB%E5%88%97%E7%9B%AE%E5%BD%95">Android Perfetto Series Catalog</a></li><li><a href="https://www.androidperformance.com/2024/05/21/Android-Perfetto-01-What-is-perfetto/">Android Perfetto Series 1: Introduction to Perfetto</a></li><li><a href="https://www.androidperformance.com/2024/05/21/Android-Perfetto-02-how-to-get-perfetto/">Android Perfetto Series 2: Perfetto Trace Capture</a></li><li><a href="https://www.androidperformance.com/2024/05/21/Android-Perfetto-03-how-to-analysis-perfetto/">Android Perfetto Series 3: Familiarizing with Perfetto View</a></li><li><a href="https://www.androidperformance.com/2025/02/08/Android-Perfetto-04-Open-Big-Trace-With-Command-Line/">Android Perfetto Series 4: Opening Large Traces Locally with Command Line</a></li><li><a href="https://www.androidperformance.com/2025/03/26/Android-Perfetto-05-Chorergrapher/">Android Perfetto Series 5: Android App Choreographer-based Rendering Flow</a></li><li><a href="https://www.androidperformance.com/2025/04/26/Android-Perfetto-06-Why-120Hz/">Android Perfetto Series 6: Why 120Hz? Advantages and Challenges of High Refresh Rate</a></li><li><a href="https://androidperformance.com/2025/08/02/Android-Perfetto-07-MainThread-And-RenderThread/">Android Perfetto Series 7: MainThread and RenderThread Interpretation</a></li><li><a href="https://androidperformance.com/2025/08/05/Android-Perfetto-08-Vsync/">Android Perfetto Series 8: Indepth Understanding of Vsync Mechanism and Performance Analysis</a></li><li><a href="https://www.androidperformance.com/2025/11/12/Android-Perfetto-09-CPU/">Android Perfetto Series 9: CPU Information Interpretation</a></li><li><a href="https://www.androidperformance.com/2025/11/16/Android-Perfetto-10-Binder/">Android Perfetto Series 10: Binder Scheduling and Lock Contention</a></li><li><a href="https://www.bilibili.com/video/BV1oi82efE4D/?vd_source=0c6d2191e785de0a36dc21a9da7e664e">Video (Bilibili) - Android Perfetto Basics and Case Sharing</a></li><li><a href="https://www.bilibili.com/video/BV17A6bBLECu/">Video (Bilibili) - Android Perfetto: Trace Graph Types - AOSP, WebView, Flutter + OEM System Optimization</a></li></ol><p>If you haven’t seen the Systrace series yet, here is the portal:</p><ol><li><a href="https://www.androidperformance.com/2019/05/26/Android_Systrace_0/#/%E7%B3%BB%E5%88%97%E6%96%87%E7%AB%A0%E7%9B%AE%E5%BD%95">Systrace Series Catalog</a>: Systematically introduces the use of Systrace, the predecessor of Perfetto, and learns and understands the basic rules of Android performance optimization and Android system operation through Systrace.</li><li>Systrace version of this article: <a href="https://androidperformance.com/2019/10/22/Android-Choreographer/">Detailed Explanation of Android Choreographer-based Rendering Mechanism</a></li><li><a href="https://www.androidperformance.com/">Personal Blog</a>: Personal blog, mainly Android-related content, also contains some life and work-related content.</li></ol><p>Everyone is welcome to join the WeChat group or Planet on the <a href="https://www.androidperformance.com/about/">About Me</a> page to discuss your questions, the parts of Perfetto you most want to see, and discuss all Android development-related content with other group members.</p><p><a id="main-thread-essence"></a></p><h1 id="The-Essence-of-Main-Thread-Execution"><a href="#The-Essence-of-Main-Thread-Execution" class="headerlink" title="The Essence of Main Thread Execution"></a>The Essence of Main Thread Execution</h1><p>Before discussing Choreographer, let’s first clarify the essence of Android’s main thread operation, which is actually the processing process of Messages. Our various operations, including the rendering operations of each frame, are sent to the MessageQueue of the main thread in the form of Messages. The MessageQueue continues to wait for the next message after processing the current one, as shown in the figure below.</p><p><strong>MethodTrace Illustration</strong></p><p><img src="/en/images/15717420275540.jpg"></p><p><strong>Perfetto Illustration</strong></p><p><img src="/en/images/Android-Perfetto-05-Chorergrapher/image-20250331235337987.webp" alt="image-20250331235337987"></p><h2 id="Evolution"><a href="#Evolution" class="headerlink" title="Evolution"></a>Evolution</h2><p>In Android versions before the introduction of Vsync, there was no interval between Messages related to rendering a frame. As soon as the previous frame was drawn, the Message for the next frame began to be processed immediately. The problem with this was that the frame rate was unstable, potentially high or low, as shown below:</p><p><strong>MethodTrace Illustration</strong></p><p><img src="/en/images/15717420453069.jpg"></p><p><strong>Trace Illustration (Resource is relatively old, using Systrace illustration)</strong></p><p><img src="/en/images/15717420572997.jpg"></p><p>It can be seen that the bottleneck at this time was in <code>dequeueBuffer</code>. Because the screen has a refresh cycle, the speed at which FB consumes the Front Buffer is constant, so the speed at which SF consumes the App Buffer is also constant. Therefore, the App would get stuck at <code>dequeueBuffer</code>. This would lead to unstable acquisition of the App Buffer, easily causing stuttering and dropped frames.</p><p>For users, a stable frame rate is a good experience. For example, when playing Honor of Kings, compared to frequent fluctuations between 60 and 40 fps, users feel better when it is stable at 50 fps.</p><p>Therefore, in the evolution of Android, the mechanism of <strong>Vsync + TripleBuffer + Choreographer</strong> was initially introduced. Later, starting from Android R (Android 11), <strong>BlastBufferQueue</strong> was introduced and then continuously refined, jointly forming the modern Android stable frame rate output mechanism, allowing the software layer and hardware layer to work together at a common frequency.</p><h2 id="Introducing-Choreographer"><a href="#Introducing-Choreographer" class="headerlink" title="Introducing Choreographer"></a>Introducing Choreographer</h2><p>The introduction of Choreographer is mainly to cooperate with Vsync to provide a stable Message processing timing for upper-layer application rendering. When the Vsync signal arrives, the system controls the timing of each frame’s drawing operation by adjusting the Vsync signal cycle. Currently, the screen refresh rate of mainstream mobile phones has reached 120Hz, which means refreshing once every 8.3ms. The system adjusts the Vsync cycle accordingly to match the screen refresh frequency. When each Vsync cycle arrives, the Vsync signal wakes up the Choreographer to execute the application’s drawing operation. If the application can complete rendering in each Vsync cycle, the application’s fps will be 120, and the user feels very smooth. This is the main function of introducing Choreographer.</p><p><img src="/en/images/15722752299458.jpg"></p><p>Of course, the refresh rate of mainstream flagship mobile phones has reached 120Hz, and the Vsync cycle has been shortened to 8.3ms. The operations in the above figure must be completed in a shorter time, and the performance requirements are getting higher and higher. For details, please refer to the article <a href="https://www.androidperformance.com/2019/05/15/90hz-on-android/">New Smooth Experience, 90Hz Rambling</a> (although the article discusses 90Hz, the same principle applies to 120Hz).</p><p><a id="choreographer-intro"></a></p><h1 id="Introduction-to-Choreographer"><a href="#Introduction-to-Choreographer" class="headerlink" title="Introduction to Choreographer"></a>Introduction to Choreographer</h1><p>Choreographer plays a connecting role in the Android rendering pipeline.</p><ol><li><strong>Upstream connection</strong>: Responsible for receiving and processing various update messages and callbacks from the App, and processing them uniformly when Vsync arrives. For example, centralized processing of Input (mainly processing of Input events), Animation (animation related), Traversal (including measure, layout, draw, etc. operations), judging stuck frames and dropped frames, recording Callback time consumption, etc.</li><li><strong>Downstream connection</strong>: Responsible for requesting and receiving Vsync signals. Receive Vsync event callbacks (via <code>FrameDisplayEventReceiver.onVsync</code>); Request Vsync (<code>FrameDisplayEventReceiver.scheduleVsync</code>).</li></ol><p>From the above, it can be seen that Choreographer plays a key coordinator role in the Android rendering pipeline. Its importance lies in ensuring that Android applications can run at a stable frame rate (60 fps, 90 fps, or 120 fps) through the complete rendering mechanism of <strong>Choreographer + SurfaceFlinger + Vsync + BlastBufferQueue</strong>, effectively reducing visual discomfort caused by frame rate fluctuations.</p><p>Understanding Choreographer can also help application developers deeply understand the operating principle of each frame, and at the same time deepen their understanding of core components such as <strong>Message</strong>, <strong>Handler</strong>, <strong>Looper</strong>, <strong>MessageQueue</strong>, <strong>Input</strong>, <strong>Animation</strong>, <strong>Measure</strong>, <strong>Layout</strong>, and <strong>Draw</strong>. Many <strong>APM</strong> (Application Performance Monitoring) tools also utilize the combination mechanisms of <strong>Choreographer</strong> (via FrameCallback), <strong>FrameMetrics&#x2F;gfxinfo framestats</strong> (internally backed by FrameInfo), <strong>MessageQueue</strong> (via IdleHandler), and <strong>Looper</strong> (via custom MessageLogging) for performance monitoring. After deeply understanding these mechanisms, developers can conduct performance optimization more specifically and form systematic optimization ideas.</p><p>In addition, although charts are an effective way to explain processes, this article will rely more on the visual output of Perfetto and MethodTrace tools. Perfetto displays the operating status of the entire system in a timeline manner (from left to right), covering the activities of key components such as CPU, SurfaceFlinger, SystemServer, and application processes. Using <strong>Perfetto</strong> and <strong>MethodTrace</strong> can intuitively display key execution processes. Once you are familiar with the system code, Perfetto’s output can be directly mapped to the actual running status of the device. Therefore, in addition to citing a small number of network charts, this article mainly relies on Perfetto to display analysis results.</p><h2 id="Choreographer’s-Workflow-from-the-Perspective-of-Perfetto"><a href="#Choreographer’s-Workflow-from-the-Perspective-of-Perfetto" class="headerlink" title="Choreographer’s Workflow from the Perspective of Perfetto"></a>Choreographer’s Workflow from the Perspective of Perfetto</h2><p>The figure below uses sliding the settings interface as an example. Let’s first look at a complete preview of the settings interface from top to bottom. It can be seen that in Perfetto, from left to right, each green frame represents a frame, representing the picture we can finally see on the phone.</p><ol><li>The interval of each VSYNC-app value in the figure is a Vsync time, corresponding to the refresh rate of the current device, such as 16.6ms at 60Hz and 8.3ms at 120Hz. The rising edge or falling edge is the arrival time of Vsync.</li><li>Processing flow of each frame: Receive Vsync signal callback -&gt; UI Thread –&gt; RenderThread –&gt; SurfaceFlinger</li><li>UI Thread and RenderThread can complete one App frame. In Android 11 and above, the rendered buffer is submitted via the BlastBufferQueue path to SurfaceFlinger for composition, and then we can see the frame on screen.</li><li>It can be seen that the time consumption of each frame of Settings sliding is very short (Ui Thread time consumption + RenderThread time consumption), but due to the existence of Vsync, each frame will wait until Vsync to be processed.</li></ol><p><img src="/en/images/Android-Perfetto-05-Chorergrapher/image-20250401001138400.webp" alt="image-20250401001138400"></p><p>With the overall concept above, let’s zoom in on each frame of the UI Thread to see the position of the Choreographer and how the Choreographer organizes each frame.</p><p><img src="/en/images/Android-Perfetto-05-Chorergrapher/image-20250401002047386.webp" alt="image-20250401002047386"></p><h2 id="Choreographer’s-Workflow"><a href="#Choreographer’s-Workflow" class="headerlink" title="Choreographer’s Workflow"></a>Choreographer’s Workflow</h2><ol><li>Choreographer Initialization</li><li>Initialize FrameHandler, bind Looper</li><li>Initialize FrameDisplayEventReceiver, establish communication with SurfaceFlinger for receiving and requesting Vsync</li><li>Initialize CallBackQueues</li><li>SurfaceFlinger’s appEventThread wakes up and sends Vsync, Choreographer callbacks <code>FrameDisplayEventReceiver.onVsync</code>, entering Choreographer’s main processing function <code>doFrame</code></li><li><code>Choreographer.doFrame</code> calculates frame drop logic</li><li><code>Choreographer.doFrame</code> processes Choreographer’s first callback: input</li><li><code>Choreographer.doFrame</code> processes Choreographer’s second callback: animation</li><li><code>Choreographer.doFrame</code> processes Choreographer’s third callback: insets animation</li><li><code>Choreographer.doFrame</code> processes Choreographer’s fourth callback: traversal</li><li>UIThread and RenderThread synchronize data in traversal-draw</li><li><code>Choreographer.doFrame</code> processes Choreographer’s fifth callback: commit</li><li>RenderThread processes drawing commands</li><li>In Android 11 and above, RenderThread submits drawing content to SurfaceFlinger through BlastBufferQueue (with implementation details evolving across releases)</li><li>BlastBufferQueue is created and managed by the App side</li><li>Works through producer (BBQ_BufferQueue_Producer) and consumer (BufferQueue_Consumer) models</li><li>The probability and duration of UI-thread waiting are usually reduced, so the next frame can often be prepared earlier (still depends on concrete sync points)</li></ol><p><strong>After the first step of initialization is completed, subsequent steps will loop between steps 2-10</strong></p><p>Also attached is the MethodTrace corresponding to this frame (just a preview here, there will be a detailed large picture below)</p><p><img src="/en/images/15717420948412.jpg"></p><h2 id="Interaction-between-Choreographer-RenderThread-and-BlastBufferQueue"><a href="#Interaction-between-Choreographer-RenderThread-and-BlastBufferQueue" class="headerlink" title="Interaction between Choreographer, RenderThread and BlastBufferQueue"></a>Interaction between Choreographer, RenderThread and BlastBufferQueue</h2><p>Starting from Android R (Android 11), the interaction between RenderThread and SurfaceFlinger underwent important changes, with BlastBufferQueue and its subsequent evolution at the core. Let’s see how this mechanism works.</p><h3 id="BlastBufferQueue-Working-Principle"><a href="#BlastBufferQueue-Working-Principle" class="headerlink" title="BlastBufferQueue Working Principle"></a>BlastBufferQueue Working Principle</h3><p>BlastBufferQueue is a BufferQueue variant optimized for UI rendering. It replaces the BufferQueue strictly created by SurfaceFlinger and is instead created and managed by the App side, used for buffer management between App and SurfaceFlinger.</p><ol><li><p><strong>More efficient buffer management</strong><br>In the traditional BufferQueue, the App needs to get an available buffer through <code>dequeueBuffer</code>, then render content, and finally submit the buffer to SurfaceFlinger through <code>queueBuffer</code>. In this process, if there is no available buffer, the App needs to wait, which leads to blocking.</p><p>BlastBufferQueue reduces this waiting through smarter buffer management, especially on high refresh rate devices, the effect is more obvious.</p></li><li><p><strong>Decoupling of RenderThread and UI Thread</strong><br>In older implementations, the UI thread and the buffer submission path were more tightly coupled, so the main thread was more likely to wait at key synchronization points. After BlastBufferQueue and later refinements, the UI thread can usually finish Java-side work earlier and move to next-frame preparation sooner, reducing main-thread blocking risk (still scenario-dependent).</p></li><li><p><strong>Creation Mechanism</strong><br>BlastBufferQueue is created during the <code>relayoutWindow</code> process of <code>ViewRootImpl</code>:</p><figure class="highlight java"><table><tr><td class="gutter"><pre><span class="line">1</span><br><span class="line">2</span><br><span class="line">3</span><br><span class="line">4</span><br><span class="line">5</span><br><span class="line">6</span><br></pre></td><td class="code"><pre><span class="line"><span class="comment">// Example code for creating BBQ</span></span><br><span class="line"><span class="keyword">if</span> (mBlastBufferQueue == <span class="literal">null</span>) &#123;</span><br><span class="line">    mBlastBufferQueue = <span class="keyword">new</span> <span class="title class_">BLASTBufferQueue</span>(mTag, mSurfaceControl,</span><br><span class="line">        mSurfaceSize.x, mSurfaceSize.y,</span><br><span class="line">        mWindowAttributes.format);</span><br><span class="line">&#125;</span><br></pre></td></tr></table></figure></li><li><p><strong>Cooperation with Choreographer</strong><br>Choreographer is still the core that coordinates all this. When the Vsync signal arrives, Choreographer will trigger <code>doFrame</code> and execute various callbacks, among which <code>CALLBACK_TRAVERSAL</code> will trigger <code>ViewRootImpl</code>‘s <code>performTraversals()</code>, eventually going to the draw process.</p><p>In the draw process, through BlastBufferQueue, RenderThread can work more independently, and the UI thread can return earlier to process other tasks.</p></li></ol><p>Below we will look at the specific implementation from the perspective of source code.</p><p><a id="source"></a></p><h1 id="Source-Code-Analysis"><a href="#Source-Code-Analysis" class="headerlink" title="Source Code Analysis"></a>Source Code Analysis</h1><p>Below is a brief look from the source code perspective. The source code only excerpts some important logic, other logic is removed. In addition, the Native part interacting with SurfaceFlinger is not included, which is not the focus of this article. Those interested can follow it themselves. The following source code is based on AOSP mainline (<code>frameworks/base</code> HEAD, verified in 2026-02). Details may vary across Android releases.</p><h2 id="Choreographer-Initialization"><a href="#Choreographer-Initialization" class="headerlink" title="Choreographer Initialization"></a>Choreographer Initialization</h2><h3 id="Choreographer-Singleton-Initialization"><a href="#Choreographer-Singleton-Initialization" class="headerlink" title="Choreographer Singleton Initialization"></a>Choreographer Singleton Initialization</h3><figure class="highlight java"><table><tr><td class="gutter"><pre><span class="line">1</span><br><span class="line">2</span><br><span class="line">3</span><br><span class="line">4</span><br><span class="line">5</span><br><span class="line">6</span><br><span class="line">7</span><br><span class="line">8</span><br><span class="line">9</span><br><span class="line">10</span><br><span class="line">11</span><br><span class="line">12</span><br><span class="line">13</span><br><span class="line">14</span><br><span class="line">15</span><br><span class="line">16</span><br><span class="line">17</span><br><span class="line">18</span><br></pre></td><td class="code"><pre><span class="line"><span class="comment">// Thread local storage for the choreographer.</span></span><br><span class="line"><span class="keyword">private</span> <span class="keyword">static</span> <span class="keyword">final</span> ThreadLocal&lt;Choreographer&gt; sThreadInstance =</span><br><span class="line">        <span class="keyword">new</span> <span class="title class_">ThreadLocal</span>&lt;Choreographer&gt;() &#123;</span><br><span class="line">    <span class="meta">@Override</span></span><br><span class="line">    <span class="keyword">protected</span> Choreographer <span class="title function_">initialValue</span><span class="params">()</span> &#123;</span><br><span class="line">        <span class="comment">// Get Looper of current thread</span></span><br><span class="line">        <span class="type">Looper</span> <span class="variable">looper</span> <span class="operator">=</span> Looper.myLooper();</span><br><span class="line">        <span class="keyword">if</span> (looper == <span class="literal">null</span>) &#123;</span><br><span class="line">            <span class="keyword">throw</span> <span class="keyword">new</span> <span class="title class_">IllegalStateException</span>(<span class="string">&quot;The current thread must have a looper!&quot;</span>);</span><br><span class="line">        &#125;</span><br><span class="line">        <span class="comment">// Construct Choreographer object, use VSYNC_SOURCE_APP as Vsync source</span></span><br><span class="line">        <span class="type">Choreographer</span> <span class="variable">choreographer</span> <span class="operator">=</span> <span class="keyword">new</span> <span class="title class_">Choreographer</span>(looper, VSYNC_SOURCE_APP);</span><br><span class="line">        <span class="keyword">if</span> (looper == Looper.getMainLooper()) &#123;</span><br><span class="line">            mMainInstance = choreographer;</span><br><span class="line">        &#125;</span><br><span class="line">        <span class="keyword">return</span> choreographer;</span><br><span class="line">    &#125;</span><br><span class="line">&#125;;</span><br></pre></td></tr></table></figure><h3 id="Choreographer-Constructor"><a href="#Choreographer-Constructor" class="headerlink" title="Choreographer Constructor"></a>Choreographer Constructor</h3><figure class="highlight java"><table><tr><td class="gutter"><pre><span class="line">1</span><br><span class="line">2</span><br><span class="line">3</span><br><span class="line">4</span><br><span class="line">5</span><br><span class="line">6</span><br><span class="line">7</span><br><span class="line">8</span><br><span class="line">9</span><br><span class="line">10</span><br><span class="line">11</span><br><span class="line">12</span><br><span class="line">13</span><br><span class="line">14</span><br><span class="line">15</span><br><span class="line">16</span><br><span class="line">17</span><br></pre></td><td class="code"><pre><span class="line"><span class="keyword">private</span> <span class="title function_">Choreographer</span><span class="params">(Looper looper, <span class="type">int</span> vsyncSource)</span> &#123;</span><br><span class="line">    mLooper = looper;</span><br><span class="line">    <span class="comment">// 1. Initialize FrameHandler</span></span><br><span class="line">    mHandler = <span class="keyword">new</span> <span class="title class_">FrameHandler</span>(looper);</span><br><span class="line">    <span class="comment">// 2. Initialize DisplayEventReceiver</span></span><br><span class="line">    mDisplayEventReceiver = USE_VSYNC</span><br><span class="line">            ? <span class="keyword">new</span> <span class="title class_">FrameDisplayEventReceiver</span>(looper, vsyncSource)</span><br><span class="line">            : <span class="literal">null</span>;</span><br><span class="line">    mLastFrameTimeNanos = Long.MIN_VALUE;</span><br><span class="line">    mFrameIntervalNanos = (<span class="type">long</span>)(<span class="number">1000000000</span> / getRefreshRate());</span><br><span class="line">    <span class="comment">//3. Initialize CallbacksQueues</span></span><br><span class="line">    mCallbackQueues = <span class="keyword">new</span> <span class="title class_">CallbackQueue</span>[CALLBACK_LAST + <span class="number">1</span>];</span><br><span class="line">    <span class="keyword">for</span> (<span class="type">int</span> <span class="variable">i</span> <span class="operator">=</span> <span class="number">0</span>; i &lt;= CALLBACK_LAST; i++) &#123;</span><br><span class="line">        mCallbackQueues[i] = <span class="keyword">new</span> <span class="title class_">CallbackQueue</span>();</span><br><span class="line">    &#125;</span><br><span class="line">    ......</span><br><span class="line">&#125;</span><br></pre></td></tr></table></figure><h3 id="FrameHandler"><a href="#FrameHandler" class="headerlink" title="FrameHandler"></a>FrameHandler</h3><figure class="highlight java"><table><tr><td class="gutter"><pre><span class="line">1</span><br><span class="line">2</span><br><span class="line">3</span><br><span class="line">4</span><br><span class="line">5</span><br><span class="line">6</span><br><span class="line">7</span><br><span class="line">8</span><br><span class="line">9</span><br><span class="line">10</span><br><span class="line">11</span><br><span class="line">12</span><br><span class="line">13</span><br><span class="line">14</span><br><span class="line">15</span><br><span class="line">16</span><br></pre></td><td class="code"><pre><span class="line"><span class="keyword">private</span> <span class="keyword">final</span> <span class="keyword">class</span> <span class="title class_">FrameHandler</span> <span class="keyword">extends</span> <span class="title class_">Handler</span> &#123;</span><br><span class="line">    ......</span><br><span class="line">    <span class="keyword">public</span> <span class="keyword">void</span> <span class="title function_">handleMessage</span><span class="params">(Message msg)</span> &#123;</span><br><span class="line">        <span class="keyword">switch</span> (msg.what) &#123;</span><br><span class="line">            <span class="keyword">case</span> MSG_DO_FRAME:<span class="comment">// Start operation for the next frame</span></span><br><span class="line">                doFrame(System.nanoTime(), <span class="number">0</span>);</span><br><span class="line">                <span class="keyword">break</span>;</span><br><span class="line">            <span class="keyword">case</span> MSG_DO_SCHEDULE_VSYNC:<span class="comment">// Request Vsync</span></span><br><span class="line">                doScheduleVsync();</span><br><span class="line">                <span class="keyword">break</span>;</span><br><span class="line">            <span class="keyword">case</span> MSG_DO_SCHEDULE_CALLBACK:<span class="comment">// Handle Callback</span></span><br><span class="line">                doScheduleCallback(msg.arg1);</span><br><span class="line">                <span class="keyword">break</span>;</span><br><span class="line">        &#125;</span><br><span class="line">    &#125;</span><br><span class="line">&#125;</span><br></pre></td></tr></table></figure><h3 id="Choreographer-Initialization-Chain"><a href="#Choreographer-Initialization-Chain" class="headerlink" title="Choreographer Initialization Chain"></a>Choreographer Initialization Chain</h3><p>During the Activity startup process, after <code>onResume</code> is executed, <code>Activity.makeVisible()</code> is called, and then <code>addView()</code> is called. The calls layer by layer enter the following method:</p><figure class="highlight java"><table><tr><td class="gutter"><pre><span class="line">1</span><br><span class="line">2</span><br><span class="line">3</span><br><span class="line">4</span><br><span class="line">5</span><br><span class="line">6</span><br><span class="line">7</span><br><span class="line">8</span><br><span class="line">9</span><br></pre></td><td class="code"><pre><span class="line">ActivityThread.handleResumeActivity(IBinder, <span class="type">boolean</span>, <span class="type">boolean</span>, String) (android.app)</span><br><span class="line">--&gt;WindowManagerImpl.addView(View, LayoutParams) (android.view)</span><br><span class="line">  --&gt;WindowManagerGlobal.addView(View, LayoutParams, Display, Window) (android.view)</span><br><span class="line">    --&gt;ViewRootImpl.ViewRootImpl(Context, Display) (android.view)</span><br><span class="line">    <span class="keyword">public</span> <span class="title function_">ViewRootImpl</span><span class="params">(Context context, Display display)</span> &#123;</span><br><span class="line">        ......</span><br><span class="line">        mChoreographer = Choreographer.getInstance();</span><br><span class="line">        ......</span><br><span class="line">    &#125;</span><br></pre></td></tr></table></figure><h2 id="Introduction-to-FrameDisplayEventReceiver"><a href="#Introduction-to-FrameDisplayEventReceiver" class="headerlink" title="Introduction to FrameDisplayEventReceiver"></a>Introduction to FrameDisplayEventReceiver</h2><p>Vsync registration, application, and reception are all done through the <code>FrameDisplayEventReceiver</code> class, so let’s introduce it simply first. <code>FrameDisplayEventReceiver</code> inherits from <code>DisplayEventReceiver</code> and has three important methods:</p><ol><li><code>onVsync</code> – Vsync signal callback</li><li><code>run</code> – Execute <code>doFrame</code></li><li><code>scheduleVsync</code>  – Request Vsync signal</li></ol><figure class="highlight java"><table><tr><td class="gutter"><pre><span class="line">1</span><br><span class="line">2</span><br><span class="line">3</span><br><span class="line">4</span><br><span class="line">5</span><br><span class="line">6</span><br><span class="line">7</span><br><span class="line">8</span><br><span class="line">9</span><br><span class="line">10</span><br><span class="line">11</span><br><span class="line">12</span><br><span class="line">13</span><br><span class="line">14</span><br><span class="line">15</span><br><span class="line">16</span><br><span class="line">17</span><br><span class="line">18</span><br><span class="line">19</span><br><span class="line">20</span><br><span class="line">21</span><br><span class="line">22</span><br><span class="line">23</span><br><span class="line">24</span><br><span class="line">25</span><br></pre></td><td class="code"><pre><span class="line"><span class="keyword">private</span> <span class="keyword">final</span> <span class="keyword">class</span> <span class="title class_">FrameDisplayEventReceiver</span> <span class="keyword">extends</span> <span class="title class_">DisplayEventReceiver</span> <span class="keyword">implements</span> <span class="title class_">Runnable</span> &#123;</span><br><span class="line">    ......</span><br><span class="line">    <span class="meta">@Override</span></span><br><span class="line">    <span class="keyword">public</span> <span class="keyword">void</span> <span class="title function_">onVsync</span><span class="params">(<span class="type">long</span> timestampNanos, <span class="type">long</span> physicalDisplayId, <span class="type">int</span> frame, VsyncEventData eventData)</span> &#123;</span><br><span class="line">        ......</span><br><span class="line">        mTimestampNanos = timestampNanos;</span><br><span class="line">        mFrame = frame;</span><br><span class="line">        <span class="comment">// VsyncEventData already existed in Android 13/14; newer versions further expanded fields</span></span><br><span class="line">        mVsyncEventData = eventData;</span><br><span class="line">        <span class="type">Message</span> <span class="variable">msg</span> <span class="operator">=</span> Message.obtain(mHandler, <span class="built_in">this</span>);</span><br><span class="line">        msg.setAsynchronous(<span class="literal">true</span>);</span><br><span class="line">        mHandler.sendMessageAtTime(msg, timestampNanos / TimeUtils.NANOS_PER_MS);</span><br><span class="line">    &#125;</span><br><span class="line">    <span class="meta">@Override</span></span><br><span class="line">    <span class="keyword">public</span> <span class="keyword">void</span> <span class="title function_">run</span><span class="params">()</span> &#123;</span><br><span class="line">        mHavePendingVsync = <span class="literal">false</span>;</span><br><span class="line">        doFrame(mTimestampNanos, mFrame, mVsyncEventData);</span><br><span class="line">    &#125;</span><br><span class="line"></span><br><span class="line">    <span class="keyword">public</span> <span class="keyword">void</span> <span class="title function_">scheduleVsync</span><span class="params">()</span> &#123;</span><br><span class="line">        ......</span><br><span class="line">        nativeScheduleVsync(mReceiverPtr);</span><br><span class="line">        ......</span><br><span class="line">    &#125;</span><br><span class="line">&#125;</span><br></pre></td></tr></table></figure><h2 id="Vsync-Registration-in-Choreographer"><a href="#Vsync-Registration-in-Choreographer" class="headerlink" title="Vsync Registration in Choreographer"></a>Vsync Registration in Choreographer</h2><p>From the function call stack below, we can see that <code>Choreographer</code>‘s inner class <code>FrameDisplayEventReceiver.onVsync</code> is responsible for receiving Vsync callbacks and notifying UIThread to process data.</p><p>So how does <code>FrameDisplayEventReceiver</code> callback <code>onVsync</code> when the Vsync signal arrives? The answer is that during the initialization of <code>FrameDisplayEventReceiver</code>, it finally listens to the file handle. The corresponding initialization process is as follows:</p><p>android&#x2F;view&#x2F;Choreographer.java</p><figure class="highlight java"><table><tr><td class="gutter"><pre><span class="line">1</span><br><span class="line">2</span><br><span class="line">3</span><br><span class="line">4</span><br><span class="line">5</span><br><span class="line">6</span><br><span class="line">7</span><br></pre></td><td class="code"><pre><span class="line"><span class="keyword">private</span> <span class="title function_">Choreographer</span><span class="params">(Looper looper, <span class="type">int</span> vsyncSource)</span> &#123;</span><br><span class="line">    mLooper = looper;</span><br><span class="line">    mDisplayEventReceiver = USE_VSYNC</span><br><span class="line">            ? <span class="keyword">new</span> <span class="title class_">FrameDisplayEventReceiver</span>(looper, vsyncSource)</span><br><span class="line">            : <span class="literal">null</span>;</span><br><span class="line">    ......</span><br><span class="line">&#125;</span><br></pre></td></tr></table></figure><p>android&#x2F;view&#x2F;Choreographer.java</p><figure class="highlight java"><table><tr><td class="gutter"><pre><span class="line">1</span><br><span class="line">2</span><br><span class="line">3</span><br></pre></td><td class="code"><pre><span class="line"><span class="keyword">public</span> <span class="title function_">FrameDisplayEventReceiver</span><span class="params">(Looper looper, <span class="type">int</span> vsyncSource)</span> &#123;</span><br><span class="line">    <span class="built_in">super</span>(looper, vsyncSource);</span><br><span class="line">&#125;</span><br></pre></td></tr></table></figure><p>android&#x2F;view&#x2F;DisplayEventReceiver.java</p><figure class="highlight java"><table><tr><td class="gutter"><pre><span class="line">1</span><br><span class="line">2</span><br><span class="line">3</span><br><span class="line">4</span><br><span class="line">5</span><br><span class="line">6</span><br></pre></td><td class="code"><pre><span class="line"><span class="keyword">public</span> <span class="title function_">DisplayEventReceiver</span><span class="params">(Looper looper, <span class="type">int</span> vsyncSource)</span> &#123;</span><br><span class="line">    ......</span><br><span class="line">    mMessageQueue = looper.getQueue();</span><br><span class="line">    mReceiverPtr = nativeInit(<span class="keyword">new</span> <span class="title class_">WeakReference</span>&lt;DisplayEventReceiver&gt;(<span class="built_in">this</span>), mMessageQueue,</span><br><span class="line">            vsyncSource);</span><br><span class="line">&#125;</span><br></pre></td></tr></table></figure><p>Simply put, during the initialization of <code>FrameDisplayEventReceiver</code>, Vsync events are passed and requested through BitTube (essentially a socket pair). After SurfaceFlinger receives the Vsync event, it passes this event to <code>DisplayEventDispatcher</code> through BitTube via <code>appEventThread</code>. After <code>DisplayEventDispatcher</code> listens to the Vsync event through the receiver end of BitTube, it callbacks <code>Choreographer.FrameDisplayEventReceiver.onVsync</code>, triggering the start of frame drawing, as shown in the figure below:</p><p><img src="/en/images/15717421215251.jpg"></p><h3 id="DisplayEventReceiver-Communication-Details-with-SurfaceFlinger"><a href="#DisplayEventReceiver-Communication-Details-with-SurfaceFlinger" class="headerlink" title="DisplayEventReceiver Communication Details with SurfaceFlinger"></a>DisplayEventReceiver Communication Details with SurfaceFlinger</h3><p>In the Android system, <code>DisplayEventReceiver</code> calls the <code>nativeInit</code> method via JNI to establish a communication channel with the SurfaceFlinger service. This process involves several key steps:</p><ol><li><p><strong>Create NativeDisplayEventReceiver Object</strong>: After calling <code>nativeInit</code> in the Java layer, JNI creates a <code>NativeDisplayEventReceiver</code> instance for receiving Vsync signals.</p></li><li><p><strong>Get IDisplayEventConnection</strong>: Get <code>IDisplayEventConnection</code> via <code>ISurfaceComposer</code> interface. This is a Binder interface used to communicate with the SurfaceFlinger service.</p></li><li><p><strong>Establish BitTube Connection</strong>: BitTube is a communication mechanism based on socket pair, designed for high-frequency, small-data-volume cross-process communication. It creates an efficient communication channel between the App process and the SurfaceFlinger process.</p></li><li><p><strong>File Descriptor Listening</strong>: Listen to the file descriptor of BitTube via <code>Looper</code>. When a Vsync signal arrives, <code>Looper</code> will notify <code>DisplayEventDispatcher</code> to process the event.</p></li></ol><p>The entire communication flow is as follows:</p><figure class="highlight plaintext"><table><tr><td class="gutter"><pre><span class="line">1</span><br><span class="line">2</span><br><span class="line">3</span><br><span class="line">4</span><br><span class="line">5</span><br><span class="line">6</span><br><span class="line">7</span><br><span class="line">8</span><br><span class="line">9</span><br><span class="line">10</span><br><span class="line">11</span><br><span class="line">12</span><br><span class="line">13</span><br><span class="line">14</span><br><span class="line">15</span><br><span class="line">16</span><br><span class="line">17</span><br><span class="line">18</span><br><span class="line">19</span><br><span class="line">20</span><br></pre></td><td class="code"><pre><span class="line">App Process                                    SurfaceFlinger Process</span><br><span class="line">  |                                             |</span><br><span class="line">  |-- Create DisplayEventReceiver -------------&gt;|</span><br><span class="line">  |                                             |</span><br><span class="line">  |&lt;- Return IDisplayEventConnection (Binder)---|</span><br><span class="line">  |                                             |</span><br><span class="line">  |-- Create BitTube --------------------------&gt;|</span><br><span class="line">  |                                             |</span><br><span class="line">  |&lt;- File Descriptor Exchange -----------------|</span><br><span class="line">  |                                             |</span><br><span class="line">  |-- Register File Descriptor to Looper -------|</span><br><span class="line">  |                                             |</span><br><span class="line">  |-- Request Vsync (requestNextVsync) --------&gt;|</span><br><span class="line">  |                                             |</span><br><span class="line">  |&lt;- Send Vsync Event Data --------------------|</span><br><span class="line">  |                                             |</span><br><span class="line">  |-- Looper Notify -&gt; handleEvent -------------|</span><br><span class="line">  |                                             |</span><br><span class="line">  |-- Callback Java Layer onVsync --------------|</span><br><span class="line">  |                                             |</span><br></pre></td></tr></table></figure><p>The advantage of this design is that it avoids using Binder to pass high-frequency Vsync event data, improving performance and real-time performance through direct socket communication, which is crucial for ensuring smooth UI rendering. At the same time, since BitTube uses file descriptors, it can be seamlessly integrated into Android’s Looper mechanism, enabling the entire system to work in an event-driven manner.</p><h2 id="Logic-of-Choreographer-Processing-a-Frame"><a href="#Logic-of-Choreographer-Processing-a-Frame" class="headerlink" title="Logic of Choreographer Processing a Frame"></a>Logic of Choreographer Processing a Frame</h2><p>The core of Choreographer’s drawing logic is in the <code>Choreographer.doFrame</code> function. As can be seen from the figure below, <code>FrameDisplayEventReceiver.onVsync</code> posts itself, and its <code>run</code> method directly calls <code>doFrame</code> to start the logic processing of a frame.</p><p>android&#x2F;view&#x2F;Choreographer.java</p><figure class="highlight java"><table><tr><td class="gutter"><pre><span class="line">1</span><br><span class="line">2</span><br><span class="line">3</span><br><span class="line">4</span><br><span class="line">5</span><br><span class="line">6</span><br><span class="line">7</span><br><span class="line">8</span><br><span class="line">9</span><br><span class="line">10</span><br><span class="line">11</span><br><span class="line">12</span><br><span class="line">13</span><br></pre></td><td class="code"><pre><span class="line"><span class="keyword">public</span> <span class="keyword">void</span> <span class="title function_">onVsync</span><span class="params">(<span class="type">long</span> timestampNanos, <span class="type">long</span> physicalDisplayId, <span class="type">int</span> frame, VsyncEventData eventData)</span> &#123;</span><br><span class="line">    ......</span><br><span class="line">    mTimestampNanos = timestampNanos;</span><br><span class="line">    mFrame = frame;</span><br><span class="line">    mVsyncEventData = eventData;</span><br><span class="line">    <span class="type">Message</span> <span class="variable">msg</span> <span class="operator">=</span> Message.obtain(mHandler, <span class="built_in">this</span>);</span><br><span class="line">    msg.setAsynchronous(<span class="literal">true</span>);</span><br><span class="line">    mHandler.sendMessageAtTime(msg, timestampNanos / TimeUtils.NANOS_PER_MS);</span><br><span class="line">&#125;</span><br><span class="line"><span class="keyword">public</span> <span class="keyword">void</span> <span class="title function_">run</span><span class="params">()</span> &#123;</span><br><span class="line">    mHavePendingVsync = <span class="literal">false</span>;</span><br><span class="line">    doFrame(mTimestampNanos, mFrame, mVsyncEventData);</span><br><span class="line">&#125;</span><br></pre></td></tr></table></figure><p>The <code>doFrame</code> function mainly does the following specific things:</p><ol><li>Calculate frame drop logic</li><li>Record frame drawing info</li><li>Execute <code>CALLBACK_INPUT</code>, <code>CALLBACK_ANIMATION</code>, <code>CALLBACK_INSETS_ANIMATION</code>, <code>CALLBACK_TRAVERSAL</code>, <code>CALLBACK_COMMIT</code></li></ol><h3 id="Recording-Frame-Drawing-Info"><a href="#Recording-Frame-Drawing-Info" class="headerlink" title="Recording Frame Drawing Info"></a>Recording Frame Drawing Info</h3><p><code>FrameInfo</code> in Choreographer is responsible for recording the drawing information of the frame. When <code>doFrame</code> is executed, the drawing time of each key node will be recorded down, which we can see using <code>dumpsys gfxinfo</code>. Of course, Choreographer only records a part, and the rest is recorded in hwui.</p><p>From these <code>FrameInfo</code> flags, we can see the recorded content. Later when we look at <code>dumpsys gfxinfo</code>, the data is arranged according to this.</p><figure class="highlight java"><table><tr><td class="gutter"><pre><span class="line">1</span><br><span class="line">2</span><br><span class="line">3</span><br><span class="line">4</span><br><span class="line">5</span><br><span class="line">6</span><br><span class="line">7</span><br><span class="line">8</span><br><span class="line">9</span><br><span class="line">10</span><br><span class="line">11</span><br><span class="line">12</span><br><span class="line">13</span><br><span class="line">14</span><br><span class="line">15</span><br><span class="line">16</span><br><span class="line">17</span><br><span class="line">18</span><br><span class="line">19</span><br><span class="line">20</span><br><span class="line">21</span><br><span class="line">22</span><br><span class="line">23</span><br><span class="line">24</span><br><span class="line">25</span><br><span class="line">26</span><br><span class="line">27</span><br><span class="line">28</span><br><span class="line">29</span><br><span class="line">30</span><br><span class="line">31</span><br><span class="line">32</span><br><span class="line">33</span><br><span class="line">34</span><br><span class="line">35</span><br><span class="line">36</span><br></pre></td><td class="code"><pre><span class="line"></span><br><span class="line"><span class="keyword">public</span> <span class="meta">@interface</span> FrameInfoFlags &#123;&#125;</span><br><span class="line"></span><br><span class="line">    <span class="keyword">public</span> <span class="keyword">static</span> <span class="keyword">final</span> <span class="type">int</span> <span class="variable">FRAME_TIMELINE_VSYNC_ID</span> <span class="operator">=</span> <span class="number">1</span>;</span><br><span class="line"></span><br><span class="line">    <span class="comment">// The intended vsync time, unadjusted by jitter</span></span><br><span class="line">    <span class="keyword">public</span> <span class="keyword">static</span> <span class="keyword">final</span> <span class="type">int</span> <span class="variable">INTENDED_VSYNC</span> <span class="operator">=</span> <span class="number">2</span>;</span><br><span class="line"></span><br><span class="line">    <span class="comment">// Jitter-adjusted vsync time, this is what was used as input into the</span></span><br><span class="line">    <span class="comment">// animation &amp; drawing system</span></span><br><span class="line">    <span class="keyword">public</span> <span class="keyword">static</span> <span class="keyword">final</span> <span class="type">int</span> <span class="variable">VSYNC</span> <span class="operator">=</span> <span class="number">3</span>;</span><br><span class="line"></span><br><span class="line">    <span class="comment">// The id of the input event that caused the current frame</span></span><br><span class="line">    <span class="keyword">public</span> <span class="keyword">static</span> <span class="keyword">final</span> <span class="type">int</span> <span class="variable">INPUT_EVENT_ID</span> <span class="operator">=</span> <span class="number">4</span>;</span><br><span class="line"></span><br><span class="line">    <span class="comment">// When input event handling started</span></span><br><span class="line">    <span class="keyword">public</span> <span class="keyword">static</span> <span class="keyword">final</span> <span class="type">int</span> <span class="variable">HANDLE_INPUT_START</span> <span class="operator">=</span> <span class="number">5</span>;</span><br><span class="line"></span><br><span class="line">    <span class="comment">// When animation evaluations started</span></span><br><span class="line">    <span class="keyword">public</span> <span class="keyword">static</span> <span class="keyword">final</span> <span class="type">int</span> <span class="variable">ANIMATION_START</span> <span class="operator">=</span> <span class="number">6</span>;</span><br><span class="line"></span><br><span class="line">    <span class="comment">// When ViewRootImpl#performTraversals() started</span></span><br><span class="line">    <span class="keyword">public</span> <span class="keyword">static</span> <span class="keyword">final</span> <span class="type">int</span> <span class="variable">PERFORM_TRAVERSALS_START</span> <span class="operator">=</span> <span class="number">7</span>;</span><br><span class="line"></span><br><span class="line">    <span class="comment">// When View:draw() started</span></span><br><span class="line">    <span class="keyword">public</span> <span class="keyword">static</span> <span class="keyword">final</span> <span class="type">int</span> <span class="variable">DRAW_START</span> <span class="operator">=</span> <span class="number">8</span>;</span><br><span class="line"></span><br><span class="line">    <span class="comment">// When the frame needs to be ready by</span></span><br><span class="line">    <span class="keyword">public</span> <span class="keyword">static</span> <span class="keyword">final</span> <span class="type">int</span> <span class="variable">FRAME_DEADLINE</span> <span class="operator">=</span> <span class="number">9</span>;</span><br><span class="line"></span><br><span class="line">    <span class="comment">// When frame actually started.</span></span><br><span class="line">    <span class="keyword">public</span> <span class="keyword">static</span> <span class="keyword">final</span> <span class="type">int</span> <span class="variable">FRAME_START_TIME</span> <span class="operator">=</span> <span class="number">10</span>;</span><br><span class="line"></span><br><span class="line">    <span class="comment">// Interval between two consecutive frames</span></span><br><span class="line">    <span class="keyword">public</span> <span class="keyword">static</span> <span class="keyword">final</span> <span class="type">int</span> <span class="variable">FRAME_INTERVAL</span> <span class="operator">=</span> <span class="number">11</span>;</span><br><span class="line"></span><br></pre></td></tr></table></figure><p>The <code>doFrame</code> function records the time from Vsync time to <code>markPerformTraversalsStart</code>.</p><figure class="highlight java"><table><tr><td class="gutter"><pre><span class="line">1</span><br><span class="line">2</span><br><span class="line">3</span><br><span class="line">4</span><br><span class="line">5</span><br><span class="line">6</span><br><span class="line">7</span><br><span class="line">8</span><br><span class="line">9</span><br><span class="line">10</span><br><span class="line">11</span><br><span class="line">12</span><br><span class="line">13</span><br></pre></td><td class="code"><pre><span class="line"><span class="keyword">void</span> <span class="title function_">doFrame</span><span class="params">(<span class="type">long</span> frameTimeNanos, <span class="type">int</span> frame, VsyncEventData eventData)</span> &#123;</span><br><span class="line">    ......</span><br><span class="line">    mFrameInfo.setVsync(intendedFrameTimeNanos, frameTimeNanos);</span><br><span class="line">    <span class="comment">// Handle CALLBACK_INPUT Callbacks</span></span><br><span class="line">    mFrameInfo.markInputHandlingStart();</span><br><span class="line">    <span class="comment">// Handle CALLBACK_ANIMATION Callbacks</span></span><br><span class="line">    mFrameInfo.markAnimationsStart();</span><br><span class="line">    <span class="comment">// Handle CALLBACK_INSETS_ANIMATION Callbacks</span></span><br><span class="line">    <span class="comment">// Handle CALLBACK_TRAVERSAL Callbacks</span></span><br><span class="line">    mFrameInfo.markPerformTraversalsStart();</span><br><span class="line">    <span class="comment">// Handle CALLBACK_COMMIT Callbacks</span></span><br><span class="line">    ......</span><br><span class="line">&#125;</span><br></pre></td></tr></table></figure><h3 id="Executing-Callbacks"><a href="#Executing-Callbacks" class="headerlink" title="Executing Callbacks"></a>Executing Callbacks</h3><figure class="highlight java"><table><tr><td class="gutter"><pre><span class="line">1</span><br><span class="line">2</span><br><span class="line">3</span><br><span class="line">4</span><br><span class="line">5</span><br><span class="line">6</span><br><span class="line">7</span><br><span class="line">8</span><br><span class="line">9</span><br><span class="line">10</span><br><span class="line">11</span><br><span class="line">12</span><br><span class="line">13</span><br><span class="line">14</span><br></pre></td><td class="code"><pre><span class="line"><span class="keyword">void</span> <span class="title function_">doFrame</span><span class="params">(<span class="type">long</span> frameTimeNanos, <span class="type">int</span> frame, VsyncEventData eventData)</span> &#123;</span><br><span class="line">    ......</span><br><span class="line">    <span class="comment">// Handle CALLBACK_INPUT Callbacks</span></span><br><span class="line">    doCallbacks(Choreographer.CALLBACK_INPUT, frameTimeNanos);</span><br><span class="line">    <span class="comment">// Handle CALLBACK_ANIMATION Callbacks</span></span><br><span class="line">    doCallbacks(Choreographer.CALLBACK_ANIMATION, frameTimeNanos);</span><br><span class="line">    <span class="comment">// Handle CALLBACK_INSETS_ANIMATION Callbacks</span></span><br><span class="line">    doCallbacks(Choreographer.CALLBACK_INSETS_ANIMATION, frameTimeNanos);</span><br><span class="line">    <span class="comment">// Handle CALLBACK_TRAVERSAL Callbacks</span></span><br><span class="line">    doCallbacks(Choreographer.CALLBACK_TRAVERSAL, frameTimeNanos);</span><br><span class="line">    <span class="comment">// Handle CALLBACK_COMMIT Callbacks</span></span><br><span class="line">    doCallbacks(Choreographer.CALLBACK_COMMIT, frameTimeNanos);</span><br><span class="line">    ......</span><br><span class="line">&#125;</span><br></pre></td></tr></table></figure><p><strong>Input Callback Call Stack</strong></p><p><strong>input callback</strong> generally executes <code>ViewRootImpl.ConsumeBatchedInputRunnable</code></p><p>android&#x2F;view&#x2F;ViewRootImpl.java</p><figure class="highlight java"><table><tr><td class="gutter"><pre><span class="line">1</span><br><span class="line">2</span><br><span class="line">3</span><br><span class="line">4</span><br><span class="line">5</span><br><span class="line">6</span><br><span class="line">7</span><br><span class="line">8</span><br><span class="line">9</span><br><span class="line">10</span><br><span class="line">11</span><br><span class="line">12</span><br><span class="line">13</span><br><span class="line">14</span><br><span class="line">15</span><br><span class="line">16</span><br><span class="line">17</span><br><span class="line">18</span><br></pre></td><td class="code"><pre><span class="line"><span class="keyword">final</span> <span class="keyword">class</span> <span class="title class_">ConsumeBatchedInputRunnable</span> <span class="keyword">implements</span> <span class="title class_">Runnable</span> &#123;</span><br><span class="line">    <span class="meta">@Override</span></span><br><span class="line">    <span class="keyword">public</span> <span class="keyword">void</span> <span class="title function_">run</span><span class="params">()</span> &#123;</span><br><span class="line">        doConsumeBatchedInput(mChoreographer.getFrameTimeNanos());</span><br><span class="line">    &#125;</span><br><span class="line">&#125;</span><br><span class="line"><span class="keyword">void</span> <span class="title function_">doConsumeBatchedInput</span><span class="params">(<span class="type">long</span> frameTimeNanos)</span> &#123;</span><br><span class="line">    <span class="keyword">if</span> (mConsumeBatchedInputScheduled) &#123;</span><br><span class="line">        mConsumeBatchedInputScheduled = <span class="literal">false</span>;</span><br><span class="line">        <span class="keyword">if</span> (mInputEventReceiver != <span class="literal">null</span>) &#123;</span><br><span class="line">            <span class="keyword">if</span> (mInputEventReceiver.consumeBatchedInputEvents(frameTimeNanos)</span><br><span class="line">                    &amp;&amp; frameTimeNanos != -<span class="number">1</span>) &#123;</span><br><span class="line">                scheduleConsumeBatchedInput();</span><br><span class="line">            &#125;</span><br><span class="line">        &#125;</span><br><span class="line">        doProcessInputEvents();</span><br><span class="line">    &#125;</span><br><span class="line">&#125;</span><br></pre></td></tr></table></figure><p>Input events are processed and finally passed to <code>DecorView</code>‘s <code>dispatchTouchEvent</code>, which leads to the familiar Input event dispatching.</p><p><img src="/en/images/15717421837064.jpg"></p><p><strong>Animation Callback Call Stack</strong></p><p>Generally, when we call <code>View.postOnAnimation</code> frequently, <code>CALLBACK_ANIMATION</code> is used.</p><figure class="highlight java"><table><tr><td class="gutter"><pre><span class="line">1</span><br><span class="line">2</span><br><span class="line">3</span><br><span class="line">4</span><br><span class="line">5</span><br><span class="line">6</span><br><span class="line">7</span><br><span class="line">8</span><br><span class="line">9</span><br><span class="line">10</span><br><span class="line">11</span><br></pre></td><td class="code"><pre><span class="line"><span class="keyword">public</span> <span class="keyword">void</span> <span class="title function_">postOnAnimation</span><span class="params">(Runnable action)</span> &#123;</span><br><span class="line">    <span class="keyword">final</span> <span class="type">AttachInfo</span> <span class="variable">attachInfo</span> <span class="operator">=</span> mAttachInfo;</span><br><span class="line">    <span class="keyword">if</span> (attachInfo != <span class="literal">null</span>) &#123;</span><br><span class="line">        attachInfo.mViewRootImpl.mChoreographer.postCallback(</span><br><span class="line">                Choreographer.CALLBACK_ANIMATION, action, <span class="literal">null</span>);</span><br><span class="line">    &#125; <span class="keyword">else</span> &#123;</span><br><span class="line">        <span class="comment">// Postpone the runnable until we know</span></span><br><span class="line">        <span class="comment">// on which thread it needs to run.</span></span><br><span class="line">        getRunQueue().post(action);</span><br><span class="line">    &#125;</span><br><span class="line">&#125;</span><br></pre></td></tr></table></figure><p>So when is <code>View.postOnAnimation</code> generally used? I took a screenshot, you can check it yourself. The most contacted should be operations like <code>startScroll</code>, <code>Fling</code>.</p><p><img src="/en/images/15717421963577.jpg"></p><p>Its call stack depends on what it posts. Below is the fling animation after releasing the hand.</p><p><img src="/en/images/15717422041938.jpg"></p><p>In addition, our <code>Choreographer</code>‘s <code>FrameCallback</code> also uses <code>CALLBACK_ANIMATION</code>.</p><figure class="highlight java"><table><tr><td class="gutter"><pre><span class="line">1</span><br><span class="line">2</span><br><span class="line">3</span><br><span class="line">4</span><br><span class="line">5</span><br><span class="line">6</span><br><span class="line">7</span><br><span class="line">8</span><br></pre></td><td class="code"><pre><span class="line"><span class="keyword">public</span> <span class="keyword">void</span> <span class="title function_">postFrameCallbackDelayed</span><span class="params">(FrameCallback callback, <span class="type">long</span> delayMillis)</span> &#123;</span><br><span class="line">    <span class="keyword">if</span> (callback == <span class="literal">null</span>) &#123;</span><br><span class="line">        <span class="keyword">throw</span> <span class="keyword">new</span> <span class="title class_">IllegalArgumentException</span>(<span class="string">&quot;callback must not be null&quot;</span>);</span><br><span class="line">    &#125;</span><br><span class="line"></span><br><span class="line">    postCallbackDelayedInternal(CALLBACK_ANIMATION,</span><br><span class="line">            callback, FRAME_CALLBACK_TOKEN, delayMillis);</span><br><span class="line">&#125;</span><br></pre></td></tr></table></figure><p><strong>Traversal Call Stack</strong></p><figure class="highlight java"><table><tr><td class="gutter"><pre><span class="line">1</span><br><span class="line">2</span><br><span class="line">3</span><br><span class="line">4</span><br><span class="line">5</span><br><span class="line">6</span><br><span class="line">7</span><br><span class="line">8</span><br><span class="line">9</span><br><span class="line">10</span><br><span class="line">11</span><br><span class="line">12</span><br><span class="line">13</span><br><span class="line">14</span><br><span class="line">15</span><br><span class="line">16</span><br><span class="line">17</span><br><span class="line">18</span><br><span class="line">19</span><br><span class="line">20</span><br><span class="line">21</span><br><span class="line">22</span><br><span class="line">23</span><br><span class="line">24</span><br><span class="line">25</span><br><span class="line">26</span><br><span class="line">27</span><br><span class="line">28</span><br><span class="line">29</span><br><span class="line">30</span><br><span class="line">31</span><br><span class="line">32</span><br><span class="line">33</span><br><span class="line">34</span><br><span class="line">35</span><br><span class="line">36</span><br><span class="line">37</span><br><span class="line">38</span><br><span class="line">39</span><br><span class="line">40</span><br></pre></td><td class="code"><pre><span class="line"><span class="keyword">void</span> <span class="title function_">scheduleTraversals</span><span class="params">()</span> &#123;</span><br><span class="line">    <span class="keyword">if</span> (!mTraversalScheduled) &#123;</span><br><span class="line">        mTraversalScheduled = <span class="literal">true</span>;</span><br><span class="line">        <span class="comment">// In order to increase priority, postSyncBarrier first</span></span><br><span class="line">        mTraversalBarrier = mHandler.getLooper().getQueue().postSyncBarrier();</span><br><span class="line">        mChoreographer.postCallback(</span><br><span class="line">                Choreographer.CALLBACK_TRAVERSAL, mTraversalRunnable, <span class="literal">null</span>);</span><br><span class="line">    &#125;</span><br><span class="line">&#125;</span><br><span class="line"></span><br><span class="line"><span class="keyword">final</span> <span class="keyword">class</span> <span class="title class_">TraversalRunnable</span> <span class="keyword">implements</span> <span class="title class_">Runnable</span> &#123;</span><br><span class="line">    <span class="meta">@Override</span></span><br><span class="line">    <span class="keyword">public</span> <span class="keyword">void</span> <span class="title function_">run</span><span class="params">()</span> &#123;</span><br><span class="line">        <span class="comment">// Really start executing measure, layout, draw</span></span><br><span class="line">        doTraversal();</span><br><span class="line">    &#125;</span><br><span class="line">&#125;</span><br><span class="line"><span class="keyword">void</span> <span class="title function_">doTraversal</span><span class="params">()</span> &#123;</span><br><span class="line">    <span class="keyword">if</span> (mTraversalScheduled) &#123;</span><br><span class="line">        mTraversalScheduled = <span class="literal">false</span>;</span><br><span class="line">        <span class="comment">// removing SyncBarrier here</span></span><br><span class="line">mHandler.getLooper().getQueue().removeSyncBarrier(mTraversalBarrier);</span><br><span class="line">        <span class="comment">// Really start</span></span><br><span class="line">        performTraversals();</span><br><span class="line">    &#125;</span><br><span class="line">&#125;</span><br><span class="line"><span class="keyword">private</span> <span class="keyword">void</span> <span class="title function_">performTraversals</span><span class="params">()</span> &#123;</span><br><span class="line">      <span class="comment">// measure operation</span></span><br><span class="line">      <span class="keyword">if</span> (focusChangedDueToTouchMode || mWidth != host.getMeasuredWidth() || mHeight != host.getMeasuredHeight() || contentInsetsChanged || updatedConfiguration) &#123;</span><br><span class="line">            performMeasure(childWidthMeasureSpec, childHeightMeasureSpec);</span><br><span class="line">      &#125;</span><br><span class="line">      <span class="comment">// layout operation</span></span><br><span class="line">      <span class="keyword">if</span> (didLayout) &#123;</span><br><span class="line">          performLayout(lp, mWidth, mHeight);</span><br><span class="line">      &#125;</span><br><span class="line">      <span class="comment">// draw operation</span></span><br><span class="line">      <span class="keyword">if</span> (!cancelDraw &amp;&amp; !newSurface) &#123;</span><br><span class="line">          performDraw();</span><br><span class="line">      &#125;</span><br><span class="line">&#125;</span><br></pre></td></tr></table></figure><p><strong>TraceView Example of doTraversal</strong></p><p><img src="/en/images/15717422180571.jpg"></p><h2 id="Next-Frame-Vsync-Request"><a href="#Next-Frame-Vsync-Request" class="headerlink" title="Next Frame Vsync Request"></a>Next Frame Vsync Request</h2><p>Due to the existence of operations such as animation, sliding, and Fling, we need a continuous and stable frame rate output mechanism. This involves the request logic of Vsync. In continuous operations, such as animation, sliding, and Fling, <code>doFrame</code> of each frame will trigger the application for the next Vsync according to the situation, so that we can obtain continuous Vsync signals.</p><p>See the call stack of <code>scheduleTraversals</code> below (<code>scheduleTraversals</code> will trigger Vsync request)<br><img src="/en/images/15724225347501.jpg"><br>We are familiar with <code>invalidate</code> and <code>requestLayout</code> triggering Vsync signal requests.</p><p>Let’s take Animation as an example to see how Animation drives the next Vsync to continuously update the screen.</p><h3 id="ObjectAnimator-Animation-Driving-Logic"><a href="#ObjectAnimator-Animation-Driving-Logic" class="headerlink" title="ObjectAnimator Animation Driving Logic"></a>ObjectAnimator Animation Driving Logic</h3><p>android&#x2F;animation&#x2F;ObjectAnimator.java</p><figure class="highlight java"><table><tr><td class="gutter"><pre><span class="line">1</span><br><span class="line">2</span><br><span class="line">3</span><br></pre></td><td class="code"><pre><span class="line"><span class="keyword">public</span> <span class="keyword">void</span> <span class="title function_">start</span><span class="params">()</span> &#123;</span><br><span class="line">    <span class="built_in">super</span>.start();</span><br><span class="line">&#125;</span><br></pre></td></tr></table></figure><p>android&#x2F;animation&#x2F;ValueAnimator.java</p><figure class="highlight java"><table><tr><td class="gutter"><pre><span class="line">1</span><br><span class="line">2</span><br><span class="line">3</span><br><span class="line">4</span><br><span class="line">5</span><br><span class="line">6</span><br><span class="line">7</span><br><span class="line">8</span><br><span class="line">9</span><br></pre></td><td class="code"><pre><span class="line"><span class="keyword">private</span> <span class="keyword">void</span> <span class="title function_">start</span><span class="params">(<span class="type">boolean</span> playBackwards)</span> &#123;</span><br><span class="line">    ......</span><br><span class="line">    addAnimationCallback(<span class="number">0</span>); <span class="comment">// Add Animation Callback when animation starts</span></span><br><span class="line">    ......</span><br><span class="line">&#125;</span><br><span class="line"><span class="keyword">private</span> <span class="keyword">void</span> <span class="title function_">addAnimationCallback</span><span class="params">(<span class="type">long</span> delay)</span> &#123;</span><br><span class="line">    ......</span><br><span class="line">    getAnimationHandler().addAnimationFrameCallback(<span class="built_in">this</span>, delay);</span><br><span class="line">&#125;</span><br></pre></td></tr></table></figure><p>android&#x2F;animation&#x2F;AnimationHandler.java</p><figure class="highlight java"><table><tr><td class="gutter"><pre><span class="line">1</span><br><span class="line">2</span><br><span class="line">3</span><br><span class="line">4</span><br><span class="line">5</span><br><span class="line">6</span><br><span class="line">7</span><br><span class="line">8</span><br><span class="line">9</span><br><span class="line">10</span><br><span class="line">11</span><br><span class="line">12</span><br><span class="line">13</span><br><span class="line">14</span><br><span class="line">15</span><br><span class="line">16</span><br><span class="line">17</span><br><span class="line">18</span><br><span class="line">19</span><br></pre></td><td class="code"><pre><span class="line"><span class="keyword">public</span> <span class="keyword">void</span> <span class="title function_">addAnimationFrameCallback</span><span class="params">(<span class="keyword">final</span> AnimationFrameCallback callback, <span class="type">long</span> delay)</span> &#123;</span><br><span class="line">    <span class="keyword">if</span> (mAnimationCallbacks.size() == <span class="number">0</span>) &#123;</span><br><span class="line">        <span class="comment">// post FrameCallback</span></span><br><span class="line">        getProvider().postFrameCallback(mFrameCallback);</span><br><span class="line">    &#125;</span><br><span class="line">    ......</span><br><span class="line">&#125;</span><br><span class="line"></span><br><span class="line"><span class="comment">// mFrameCallback here callbacks doFrame, inside posts itself</span></span><br><span class="line"><span class="keyword">private</span> <span class="keyword">final</span> Choreographer.<span class="type">FrameCallback</span> <span class="variable">mFrameCallback</span> <span class="operator">=</span> <span class="keyword">new</span> <span class="title class_">Choreographer</span>.FrameCallback() &#123;</span><br><span class="line">    <span class="meta">@Override</span></span><br><span class="line">    <span class="keyword">public</span> <span class="keyword">void</span> <span class="title function_">doFrame</span><span class="params">(<span class="type">long</span> frameTimeNanos)</span> &#123;</span><br><span class="line">        doAnimationFrame(getProvider().getFrameTime());</span><br><span class="line">        <span class="keyword">if</span> (mAnimationCallbacks.size() &gt; <span class="number">0</span>) &#123;</span><br><span class="line">            <span class="comment">// post itself</span></span><br><span class="line">            getProvider().postFrameCallback(<span class="built_in">this</span>);</span><br><span class="line">        &#125;</span><br><span class="line">    &#125;</span><br><span class="line">&#125;;</span><br></pre></td></tr></table></figure><p>Calling <code>postFrameCallback</code> will go to <code>mChoreographer.postFrameCallback</code>, where the Vsync request logic of <code>Choreographer</code> will be triggered.</p><p>android&#x2F;animation&#x2F;AnimationHandler.java</p><figure class="highlight java"><table><tr><td class="gutter"><pre><span class="line">1</span><br><span class="line">2</span><br><span class="line">3</span><br></pre></td><td class="code"><pre><span class="line"><span class="keyword">public</span> <span class="keyword">void</span> <span class="title function_">postFrameCallback</span><span class="params">(Choreographer.FrameCallback callback)</span> &#123;</span><br><span class="line">    mChoreographer.postFrameCallback(callback);</span><br><span class="line">&#125;</span><br></pre></td></tr></table></figure><p>android&#x2F;view&#x2F;Choreographer.java</p><figure class="highlight java"><table><tr><td class="gutter"><pre><span class="line">1</span><br><span class="line">2</span><br><span class="line">3</span><br><span class="line">4</span><br><span class="line">5</span><br><span class="line">6</span><br><span class="line">7</span><br><span class="line">8</span><br><span class="line">9</span><br><span class="line">10</span><br><span class="line">11</span><br><span class="line">12</span><br><span class="line">13</span><br><span class="line">14</span><br><span class="line">15</span><br><span class="line">16</span><br><span class="line">17</span><br><span class="line">18</span><br></pre></td><td class="code"><pre><span class="line"><span class="keyword">private</span> <span class="keyword">void</span> <span class="title function_">postCallbackDelayedInternal</span><span class="params">(<span class="type">int</span> callbackType,</span></span><br><span class="line"><span class="params">        Object action, Object token, <span class="type">long</span> delayMillis)</span> &#123;</span><br><span class="line">    <span class="keyword">synchronized</span> (mLock) &#123;</span><br><span class="line">        <span class="keyword">final</span> <span class="type">long</span> <span class="variable">now</span> <span class="operator">=</span> SystemClock.uptimeMillis();</span><br><span class="line">        <span class="keyword">final</span> <span class="type">long</span> <span class="variable">dueTime</span> <span class="operator">=</span> now + delayMillis;</span><br><span class="line">        mCallbackQueues[callbackType].addCallbackLocked(dueTime, action, token);</span><br><span class="line"></span><br><span class="line">        <span class="keyword">if</span> (dueTime &lt;= now) &#123;</span><br><span class="line">            <span class="comment">// Request Vsync scheduleFrameLocked -&gt;scheduleVsyncLocked-&gt; mDisplayEventReceiver.scheduleVsync -&gt;nativeScheduleVsync</span></span><br><span class="line">            scheduleFrameLocked(now);</span><br><span class="line">        &#125; <span class="keyword">else</span> &#123;</span><br><span class="line">            <span class="type">Message</span> <span class="variable">msg</span> <span class="operator">=</span> mHandler.obtainMessage(MSG_DO_SCHEDULE_CALLBACK, action);</span><br><span class="line">            msg.arg1 = callbackType;</span><br><span class="line">            msg.setAsynchronous(<span class="literal">true</span>);</span><br><span class="line">            mHandler.sendMessageAtTime(msg, dueTime);</span><br><span class="line">        &#125;</span><br><span class="line">    &#125;</span><br><span class="line">&#125;</span><br></pre></td></tr></table></figure><p>Through the <code>Animation.start</code> setting above, the <code>Choreographer.FrameCallback</code> interface is used to request the next Vsync every frame.<br><strong>TraceView Example of a Frame During Animation</strong></p><p><img src="/en/images/15717422327935.jpg"></p><h2 id="Source-Code-Summary"><a href="#Source-Code-Summary" class="headerlink" title="Source Code Summary"></a>Source Code Summary</h2><ol><li><p><strong>Choreographer</strong> is designed using a thread singleton mode and is strongly coupled with Looper. Each thread can only has one Choreographer instance, and it must be bound to a valid Looper object because its internal Handler relies on Looper for message dispatching. In applications, it is usually bound to the main thread’s Looper to ensure thread safety of UI operations.</p></li><li><p><strong>DisplayEventReceiver</strong> is an abstract base class, and its JNI implementation creates an <code>IDisplayEventConnection</code> object as a listener for Vsync signals. Through this mechanism, the Vsync interrupt signal sent by <code>AppEventThread</code> of SurfaceFlinger can be accurately delivered to the Choreographer instance. When the Vsync signal arrives, the system callbacks <code>onVsync</code> method of <code>DisplayEventReceiver</code>, triggering the rendering process.</p></li><li><p><strong>DisplayEventReceiver</strong> provides <code>scheduleVsync</code> method for requesting Vsync signals. When the application needs to update the UI, it first requests the next Vsync interrupt through this method, and then executes the actual drawing logic in the <code>onVsync</code> callback, ensuring that rendering is synchronized with the screen refresh.</p></li><li><p><strong>Choreographer</strong> defines the <code>FrameCallback</code> interface, and its <code>doFrame</code> method is called every time Vsync arrives. This design is of great significance to the Android animation system, enabling animations to be accurately synchronized with the screen refresh rate, providing a smoother and more power-saving animation experience compared to early self-timing implementations.</p></li><li><p><strong>Choreographer</strong>‘s core function is to receive Vsync signals and trigger callback functions registered through <code>postCallback</code>. The framework defines five types of callbacks, sorted by execution priority:</p><ol><li><strong>CALLBACK_INPUT</strong>: Handle input events, such as touch, key presses, etc.</li><li><strong>CALLBACK_ANIMATION</strong>: Handle various animation calculations and updates</li><li><strong>CALLBACK_INSETS_ANIMATION</strong>: Handle system inset animations, such as soft keyboard, status bar animations, etc.</li><li><strong>CALLBACK_TRAVERSAL</strong>: Handle measurement, layout, and drawing of the view tree</li><li><strong>CALLBACK_COMMIT</strong>: Perform post-draw finishing work, and adjust frame time when needed for better delay&#x2F;jitter accounting</li></ol></li><li><p><strong>ListView</strong> and <strong>RecyclerView</strong>‘s Item reuse mechanism (ViewHolder pattern) specific implementation at the framework level will involve <code>CALLBACK_INPUT</code> and <code>CALLBACK_ANIMATION</code> stages. When sliding or scrolling quickly, Item initialization, measurement, and drawing may be triggered in the Input callback (such as directly responding to touch events), or may be executed in the Animation callback (such as inertial sliding or automatic scrolling). RecyclerView, through a more efficient reuse mechanism and Prefetch strategy, can intelligently prepare ViewHolder in these two stages, reducing main thread blocking, performing especially well on high refresh rate devices.</p></li><li><p><strong>CALLBACK_INPUT</strong> and <strong>CALLBACK_ANIMATION</strong> will modify various properties of View (such as position, transparency, transformation matrix, etc.) during execution, so they must be executed before <code>CALLBACK_TRAVERSAL</code> to ensure that all state updates can be correctly applied during the measurement, layout, and drawing process of the current frame. This strict execution order guarantees the consistency and predictability of Android UI rendering.</p></li></ol><p><a id="apm"></a></p><h1 id="APM-and-Choreographer"><a href="#APM-and-Choreographer" class="headerlink" title="APM and Choreographer"></a>APM and Choreographer</h1><p>Due to Choreographer’s position in the rendering path, many performance monitoring methods are built around it. Note that <code>FrameInfo</code> itself is an internal Framework structure (<code>@hide</code>); app-side monitoring usually relies on <code>FrameCallback</code>, <code>FrameMetrics</code>, <code>dumpsys gfxinfo framestats</code>, Perfetto, and related tooling.</p><ol><li>Use <code>doFrame</code> callback of <code>FrameCallback</code></li><li>Use <code>FrameMetrics</code> API</li><li>Use <code>framestats</code> (internally backed by FrameInfo): <code>adb shell dumpsys gfxinfo &lt;packagename&gt; framestats</code></li><li>Use SurfaceFlinger latency: <code>adb shell dumpsys SurfaceFlinger --latency</code></li><li>Use SurfaceFlinger PageFlip mechanism: <code>adb service call SurfaceFlinger 1013</code> (system permission required)</li><li>Choreographer’s own dropped-frame calculation logic</li><li>BlockCanary performance monitoring based on Looper</li><li>Perfetto’s monitoring capabilities<ol><li>Perfetto is already Android’s mainline tracing infrastructure (Android 10+ largely replaced the old <code>systrace.py</code> workflow)</li><li>Perfetto can capture more detailed system performance data, including Choreographer details</li><li>Perfetto UI enables visual analysis of frame rendering</li></ol></li></ol><h2 id="Use-Perfetto-for-Advanced-Monitoring"><a href="#Use-Perfetto-for-Advanced-Monitoring" class="headerlink" title="Use Perfetto for Advanced Monitoring"></a>Use Perfetto for Advanced Monitoring</h2><p>Perfetto is Android’s main system-tracing solution. It provides more powerful functionality than legacy Systrace workflows:</p><ol><li><p><strong>Comparison of comprehensive performance data collection</strong><br>Perfetto can collect multi-dimensional data such as CPU, memory, graphics rendering, system services, etc. at the same time</p></li><li><p><strong>Lower overhead</strong><br>Using efficient tracking engine, less impact on system performance</p></li><li><p><strong>Better Choreographer tracking</strong><br>Can track Choreographer’s work process in detail, including:</p><ul><li>Reception and processing of Vsync signals</li><li>Execution details of <code>doFrame</code> method</li><li>Execution time of various callbacks</li><li>The collaboration process between UI thread and RenderThread</li></ul></li><li><p><strong>Tracking BlastBufferQueue-related paths</strong><br>Can track BlastBufferQueue behavior, helping developers understand buffer management</p></li></ol><h3 id="Use-Perfetto-to-Track-Choreographer"><a href="#Use-Perfetto-to-Track-Choreographer" class="headerlink" title="Use Perfetto to Track Choreographer"></a>Use Perfetto to Track Choreographer</h3><figure class="highlight bash"><table><tr><td class="gutter"><pre><span class="line">1</span><br><span class="line">2</span><br><span class="line">3</span><br><span class="line">4</span><br><span class="line">5</span><br><span class="line">6</span><br><span class="line">7</span><br><span class="line">8</span><br></pre></td><td class="code"><pre><span class="line"><span class="comment"># Start recording Perfetto trace (example: 15s with common categories)</span></span><br><span class="line">adb shell perfetto -o /data/misc/perfetto-traces/trace.perfetto-trace -t 15s \</span><br><span class="line">    <span class="built_in">sched</span> freq idle am wm gfx view binder_driver hal</span><br><span class="line"></span><br><span class="line"><span class="comment"># Get trace file after completion</span></span><br><span class="line">adb pull /data/misc/perfetto-traces/trace.perfetto-trace</span><br><span class="line"></span><br><span class="line"><span class="comment"># Analyze in Perfetto UI (https://ui.perfetto.dev/)</span></span><br></pre></td></tr></table></figure><p>In Perfetto UI, you can find the event named “Choreographer#doFrame”, which shows the processing time and details of each frame. You can also check the collaboration relationship between the UI thread and RenderThread, and the interaction with SurfaceFlinger.</p><h2 id="Use-framestats-internally-backed-by-FrameInfo-for-Monitoring"><a href="#Use-framestats-internally-backed-by-FrameInfo-for-Monitoring" class="headerlink" title="Use framestats (internally backed by FrameInfo) for Monitoring"></a>Use framestats (internally backed by FrameInfo) for Monitoring</h2><p><code>adb shell dumpsys gfxinfo &lt;packagename&gt; framestats</code></p><figure class="highlight shell"><table><tr><td class="gutter"><pre><span class="line">1</span><br><span class="line">2</span><br><span class="line">3</span><br><span class="line">4</span><br><span class="line">5</span><br><span class="line">6</span><br><span class="line">7</span><br><span class="line">8</span><br><span class="line">9</span><br><span class="line">10</span><br><span class="line">11</span><br><span class="line">12</span><br><span class="line">13</span><br><span class="line">14</span><br><span class="line">15</span><br><span class="line">16</span><br><span class="line">17</span><br><span class="line">18</span><br><span class="line">19</span><br><span class="line">20</span><br><span class="line">21</span><br><span class="line">22</span><br></pre></td><td class="code"><pre><span class="line">Window: StatusBar</span><br><span class="line">Stats since: 17990256398ns</span><br><span class="line">Total frames rendered: 1562</span><br><span class="line">Janky frames: 361 (23.11%)</span><br><span class="line">50th percentile: 6ms</span><br><span class="line">90th percentile: 23ms</span><br><span class="line">95th percentile: 36ms</span><br><span class="line">99th percentile: 101ms</span><br><span class="line">Number Missed Vsync: 33</span><br><span class="line">Number High input latency: 683</span><br><span class="line">Number Slow UI thread: 273</span><br><span class="line">Number Slow bitmap uploads: 8</span><br><span class="line">Number Slow issue draw commands: 18</span><br><span class="line">Number Frame deadline missed: 287</span><br><span class="line">HISTOGRAM: 5ms=670 6ms=128 7ms=84 8ms=63 9ms=38 10ms=23 11ms=21 12ms=20 13ms=25 14ms=39 15ms=65 16ms=36 17ms=51 18ms=37 19ms=41 20ms=20 21ms=19 22ms=18 23ms=15 24ms=14 25ms=8 26ms=4 27ms=6 28ms=3 29ms=4 30ms=2 31ms=2 32ms=6 34ms=12 36ms=10 38ms=9 40ms=3 42ms=4 44ms=5 46ms=8 48ms=6 53ms=6 57ms=4 61ms=1 65ms=0 69ms=2 73ms=2 77ms=3 81ms=4 85ms=1 89ms=2 93ms=0 97ms=2 101ms=1 105ms=1 109ms=1 113ms=1 117ms=1 121ms=2 125ms=1 129ms=0 133ms=1 150ms=2 200ms=3 250ms=0 300ms=1 350ms=1 400ms=0 450ms=0 500ms=0 550ms=0 600ms=0 650ms=0</span><br><span class="line"></span><br><span class="line">---PROFILEDATA---</span><br><span class="line">Flags,IntendedVsync,Vsync,OldestInputEvent,NewestInputEvent,HandleInputStart,AnimationStart,PerformTraversalsStart,DrawStart,SyncQueued,SyncStart,IssueDrawCommandsStart,SwapBuffers,FrameCompleted,DequeueBufferDuration,QueueBufferDuration,</span><br><span class="line">0,10158314881426,10158314881426,9223372036854775807,0,10158315693363,10158315760759,10158315769821,10158316032165,10158316627842,10158316838988,10158318055915,10158320387269,10158321770654,428000,773000,</span><br><span class="line">0,10158332036261,10158332036261,9223372036854775807,0,10158332799196,10158332868519,10158332877269,10158333137738,10158333780654,10158333993206,10158335078467,10158337689561,10158339307061,474000,885000,</span><br><span class="line">0,10158348665353,10158348665353,9223372036854775807,0,10158349710238,10158349773102,10158349780863,10158350405863,10158351135967,10158351360446,10158352300863,10158354305654,10158355814509,471000,836000,</span><br><span class="line">0,10158365296729,10158365296729,9223372036854775807,0,10158365782373,10158365821019,10158365825238,10158365975290,10158366547946,10158366687217,10158367240706,10158368429248,10158369291852,269000,476000,</span><br></pre></td></tr></table></figure><h2 id="Use-SurfaceFlinger-for-Monitoring"><a href="#Use-SurfaceFlinger-for-Monitoring" class="headerlink" title="Use SurfaceFlinger for Monitoring"></a>Use SurfaceFlinger for Monitoring</h2><p>Command explanation:</p><ol><li>The unit of data is nanoseconds, and the time starts from the boot time</li><li>Each command will get 128 lines of frame-related data</li></ol><p>Data:</p><ol><li>The first line of data indicates the refresh interval <code>refresh_period</code></li><li>Column 1: This part of the data indicates the time point when the application draws the image</li><li>Column 2: The vertical sync time before SF (software) submits the frame to H&#x2F;W (hardware) for drawing, that is, the timestamp submitted to hardware after each frame is drawn. This column is the vertical sync timestamp.</li><li>Column 3: The time point when SF submits the frame to H&#x2F;W, which is regarded as the time point when H&#x2F;W finishes receiving data from SF, and the time point when drawing is completed.</li></ol><p><strong>Frame Drop (Jank) Calculation</strong></p><p>Each line can get a value through the following formula, which is a standard we call <code>jankflag</code>. If the <code>jankflag</code> of the current line changes compared to the <code>jankflag</code> of the previous line, it is called a dropped frame.</p><p><code>ceil((C - A) / refresh-period)</code></p><h2 id="Use-SurfaceFlinger-PageFlip-Mechanism-for-Monitoring"><a href="#Use-SurfaceFlinger-PageFlip-Mechanism-for-Monitoring" class="headerlink" title="Use SurfaceFlinger PageFlip Mechanism for Monitoring"></a>Use SurfaceFlinger PageFlip Mechanism for Monitoring</h2><figure class="highlight java"><table><tr><td class="gutter"><pre><span class="line">1</span><br><span class="line">2</span><br><span class="line">3</span><br><span class="line">4</span><br><span class="line">5</span><br><span class="line">6</span><br><span class="line">7</span><br><span class="line">8</span><br><span class="line">9</span><br><span class="line">10</span><br><span class="line">11</span><br><span class="line">12</span><br><span class="line">13</span><br><span class="line">14</span><br></pre></td><td class="code"><pre><span class="line"><span class="type">Parcel</span> <span class="variable">data</span> <span class="operator">=</span> Parcel.obtain();</span><br><span class="line"><span class="type">Parcel</span> <span class="variable">reply</span> <span class="operator">=</span> Parcel.obtain();</span><br><span class="line">    data.writeInterfaceToken(<span class="string">&quot;android.ui.ISurfaceComposer&quot;</span>);</span><br><span class="line">mFlinger.transact(<span class="number">1013</span>, data, reply, <span class="number">0</span>);</span><br><span class="line"><span class="keyword">final</span> <span class="type">int</span> <span class="variable">pageFlipCount</span> <span class="operator">=</span> reply.readInt();</span><br><span class="line"></span><br><span class="line"><span class="keyword">final</span> <span class="type">long</span> <span class="variable">now</span> <span class="operator">=</span> System.nanoTime();</span><br><span class="line"><span class="keyword">final</span> <span class="type">int</span> <span class="variable">frames</span> <span class="operator">=</span> pageFlipCount - mLastPageFlipCount;</span><br><span class="line"><span class="keyword">final</span> <span class="type">long</span> <span class="variable">duration</span> <span class="operator">=</span> now - mLastUpdateTime;</span><br><span class="line">mFps = (<span class="type">float</span>) (frames * <span class="number">1e9</span> / duration);</span><br><span class="line">mLastPageFlipCount = pageFlipCount;</span><br><span class="line">mLastUpdateTime = now;</span><br><span class="line">reply.recycle();</span><br><span class="line">data.recycle();</span><br></pre></td></tr></table></figure><h2 id="Choreographer’s-Own-Dropped-Frame-Calculation-Logic"><a href="#Choreographer’s-Own-Dropped-Frame-Calculation-Logic" class="headerlink" title="Choreographer’s Own Dropped Frame Calculation Logic"></a>Choreographer’s Own Dropped Frame Calculation Logic</h2><p><code>SKIPPED_FRAME_WARNING_LIMIT</code> is 30 by default, controlled by the property <code>debug.choreographer.skipwarning</code>.</p><figure class="highlight java"><table><tr><td class="gutter"><pre><span class="line">1</span><br><span class="line">2</span><br><span class="line">3</span><br><span class="line">4</span><br><span class="line">5</span><br><span class="line">6</span><br><span class="line">7</span><br></pre></td><td class="code"><pre><span class="line"><span class="keyword">if</span> (jitterNanos &gt;= mFrameIntervalNanos) &#123;</span><br><span class="line">    <span class="keyword">final</span> <span class="type">long</span> <span class="variable">skippedFrames</span> <span class="operator">=</span> jitterNanos / mFrameIntervalNanos;</span><br><span class="line">    <span class="keyword">if</span> (skippedFrames &gt;= SKIPPED_FRAME_WARNING_LIMIT) &#123;</span><br><span class="line">        Log.i(TAG, <span class="string">&quot;Skipped &quot;</span> + skippedFrames + <span class="string">&quot; frames!  &quot;</span></span><br><span class="line">                + <span class="string">&quot;The application may be doing too much work on its main thread.&quot;</span>);</span><br><span class="line">    &#125;</span><br><span class="line">&#125;</span><br></pre></td></tr></table></figure><h2 id="BlockCanary"><a href="#BlockCanary" class="headerlink" title="BlockCanary"></a>BlockCanary</h2><p>BlockCanary uses Looper’s message mechanism for performance monitoring. It achieves the purpose of monitoring performance by recording before and after each Message in the MessageQueue.</p><p>android&#x2F;os&#x2F;Looper.java</p><figure class="highlight java"><table><tr><td class="gutter"><pre><span class="line">1</span><br><span class="line">2</span><br><span class="line">3</span><br><span class="line">4</span><br><span class="line">5</span><br><span class="line">6</span><br><span class="line">7</span><br><span class="line">8</span><br><span class="line">9</span><br><span class="line">10</span><br><span class="line">11</span><br><span class="line">12</span><br><span class="line">13</span><br><span class="line">14</span><br><span class="line">15</span><br><span class="line">16</span><br><span class="line">17</span><br></pre></td><td class="code"><pre><span class="line"><span class="keyword">public</span> <span class="keyword">static</span> <span class="keyword">void</span> <span class="title function_">loop</span><span class="params">()</span> &#123;</span><br><span class="line">    ...</span><br><span class="line">    <span class="keyword">for</span> (;;) &#123;</span><br><span class="line">        ...</span><br><span class="line">        <span class="comment">// This must be in a local variable, in case a UI event sets the logger</span></span><br><span class="line">        <span class="type">Printer</span> <span class="variable">logging</span> <span class="operator">=</span> me.mLogging;</span><br><span class="line">        <span class="keyword">if</span> (logging != <span class="literal">null</span>) &#123;</span><br><span class="line">            logging.println(<span class="string">&quot;&gt;&gt;&gt;&gt;&gt; Dispatching to &quot;</span> + msg.target + <span class="string">&quot; &quot;</span> +</span><br><span class="line">                    msg.callback + <span class="string">&quot;: &quot;</span> + msg.what);</span><br><span class="line">        &#125;</span><br><span class="line">        msg.target.dispatchMessage(msg);</span><br><span class="line">        <span class="keyword">if</span> (logging != <span class="literal">null</span>) &#123;</span><br><span class="line">            logging.println(<span class="string">&quot;&lt;&lt;&lt;&lt;&lt; Finished to &quot;</span> + msg.target + <span class="string">&quot; &quot;</span> + msg.callback);</span><br><span class="line">        &#125;</span><br><span class="line">        ...</span><br><span class="line">    &#125;</span><br><span class="line">&#125;</span><br></pre></td></tr></table></figure><p><a id="messagequeue"></a></p><h1 id="MessageQueue-and-Choreographer"><a href="#MessageQueue-and-Choreographer" class="headerlink" title="MessageQueue and Choreographer"></a>MessageQueue and Choreographer</h1><p>In the Android message mechanism, asynchronous messages have special processing priority. The system can insert a barrier (Barrier) into the message queue through the <code>enqueueBarrier</code> method, so that all synchronous messages after the barrier cannot be executed temporarily until <code>removeBarrier</code> method is called to remove the barrier. Messages marked as asynchronous are not affected by the barrier and can be processed normally.</p><p>Messages are synchronous by default. Only by using the <code>setAsynchronous</code> method of Message (this method is a hidden API) can the message be set to asynchronous. When initializing Handler, specific parameters can be passed to specify that all messages sent by this Handler are asynchronous. In this case, the <code>enqueueMessage</code> method of Handler will automatically call the <code>setAsynchronous</code> method of Message.</p><p>The core value of asynchronous messages lies in being able to bypass message barriers to proceed execution. If there is no barrier set, asynchronous messages are processed in exactly the same way as synchronous messages. The <code>removeSyncBarrier</code> method can be used to remove the previously set barrier.</p><h2 id="An-Example-of-SyncBarrier-Used-in-Choreographer"><a href="#An-Example-of-SyncBarrier-Used-in-Choreographer" class="headerlink" title="An Example of SyncBarrier Used in Choreographer"></a>An Example of SyncBarrier Used in Choreographer</h2><p><code>postSyncBarrier</code> is called when <code>scheduleTraversals</code>.</p><figure class="highlight java"><table><tr><td class="gutter"><pre><span class="line">1</span><br><span class="line">2</span><br><span class="line">3</span><br><span class="line">4</span><br><span class="line">5</span><br><span class="line">6</span><br><span class="line">7</span><br><span class="line">8</span><br><span class="line">9</span><br></pre></td><td class="code"><pre><span class="line"><span class="keyword">void</span> <span class="title function_">scheduleTraversals</span><span class="params">()</span> &#123;</span><br><span class="line">    <span class="keyword">if</span> (!mTraversalScheduled) &#123;</span><br><span class="line">        mTraversalScheduled = <span class="literal">true</span>;</span><br><span class="line">        <span class="comment">// In order to increase priority, postSyncBarrier first</span></span><br><span class="line">        mTraversalBarrier = mHandler.getLooper().getQueue().postSyncBarrier();</span><br><span class="line">        mChoreographer.postCallback(</span><br><span class="line">                Choreographer.CALLBACK_TRAVERSAL, mTraversalRunnable, <span class="literal">null</span>);</span><br><span class="line">    &#125;</span><br><span class="line">&#125;</span><br></pre></td></tr></table></figure><p><code>removeSyncBarrier</code> is called when <code>doTraversal</code>.</p><figure class="highlight java"><table><tr><td class="gutter"><pre><span class="line">1</span><br><span class="line">2</span><br><span class="line">3</span><br><span class="line">4</span><br><span class="line">5</span><br><span class="line">6</span><br><span class="line">7</span><br><span class="line">8</span><br><span class="line">9</span><br></pre></td><td class="code"><pre><span class="line"><span class="keyword">void</span> <span class="title function_">doTraversal</span><span class="params">()</span> &#123;</span><br><span class="line">    <span class="keyword">if</span> (mTraversalScheduled) &#123;</span><br><span class="line">        mTraversalScheduled = <span class="literal">false</span>;</span><br><span class="line">        <span class="comment">// Remove SyncBarrier here</span></span><br><span class="line">mHandler.getLooper().getQueue().removeSyncBarrier(mTraversalBarrier);</span><br><span class="line">        <span class="comment">// Really start</span></span><br><span class="line">        performTraversals();</span><br><span class="line">    &#125;</span><br><span class="line">&#125;</span><br></pre></td></tr></table></figure><p>When Choreographer posts a Message, it sets these messages as Asynchronous, so the priority of these Messages in Choreographer will be relatively high.</p><figure class="highlight java"><table><tr><td class="gutter"><pre><span class="line">1</span><br><span class="line">2</span><br><span class="line">3</span><br><span class="line">4</span><br></pre></td><td class="code"><pre><span class="line"><span class="type">Message</span> <span class="variable">msg</span> <span class="operator">=</span> mHandler.obtainMessage(MSG_DO_SCHEDULE_CALLBACK, action);</span><br><span class="line">msg.arg1 = callbackType;</span><br><span class="line">msg.setAsynchronous(<span class="literal">true</span>);</span><br><span class="line">mHandler.sendMessageAtTime(msg, dueTime);</span><br></pre></td></tr></table></figure><p><a id="vendor"></a></p><h1 id="Manufacturer-Optimizations"><a href="#Manufacturer-Optimizations" class="headerlink" title="Manufacturer Optimizations"></a>Manufacturer Optimizations</h1><p>Since system manufacturers can directly modify the source code, they also take advantage of this to do some functions and optimizations. However, due to confidentiality issues, the code will not be put up directly. I can roughly talk about the ideas. Those interested can discuss privately.</p><h2 id="Input-Event-Optimization"><a href="#Input-Event-Optimization" class="headerlink" title="Input Event Optimization"></a>Input Event Optimization</h2><p>Choreographer itself does not have input messages, but after modifying the source code, input messages can be directly given to Choreographer. With these Input messages, Choreographer can do some things, such as responding in advance without waiting for Vsync.</p><h2 id="Background-Animation-Optimization"><a href="#Background-Animation-Optimization" class="headerlink" title="Background Animation Optimization"></a>Background Animation Optimization</h2><p>When an Android application retreats to the background, if it is not terminated by the system, it may still continue to execute various operations. In some cases, the application will continue to call Animation Callback in Choreographer. Even if these animations are invisible to the user, the execution of these Callbacks is completely meaningless, but it will cause high CPU resource usage.</p><p>Therefore, system manufacturers will optimize for this situation in Choreographer, restricting background applications that do not meet the conditions from continuing to execute meaningless animation callbacks through a series of strategies, effectively reducing system resource usage.</p><p><img src="/en/images/15717422623134.jpg"></p><h2 id="Frame-Drawing-Optimization"><a href="#Frame-Drawing-Optimization" class="headerlink" title="Frame Drawing Optimization"></a>Frame Drawing Optimization</h2><p>Like input event optimization, since we have Input event information, in some scenarios we can notify SurfaceFlinger not to wait for Vsync to do composition operations directly.</p><h2 id="App-Launch-Optimization"><a href="#App-Launch-Optimization" class="headerlink" title="App Launch Optimization"></a>App Launch Optimization</h2><p>We said earlier that all operations of the main thread are based on <code>Message</code>. If an operation, a non-important <code>Message</code>, is arranged at the back of the queue, it will affect this operation; by rearranging <code>MessageQueue</code>, when the application starts, important startup <code>Message</code>s are placed in front of the queue to speed up the startup speed.</p><h2 id="Animation-Callback-Front-loading"><a href="#Animation-Callback-Front-loading" class="headerlink" title="Animation Callback Front-loading"></a>Animation Callback Front-loading</h2><p>After the main thread of the previous frame is finished, there is actually a period of idle time before the next Vsync. This period of time can actually be used to prepare for the next frame. Then we can advance the animation callback of the next frame to do it here, which can effectively use the idle time of the CPU and reduce dropped frames.</p><h2 id="Frame-Interpolation"><a href="#Frame-Interpolation" class="headerlink" title="Frame Interpolation"></a>Frame Interpolation</h2><p>Like Animation callback front-loading, after the main thread of the previous frame is finished, there is actually a period of idle time before the next Vsync. This period of time can actually be used to prepare for the next frame. It’s just that here we directly generate a new frame: that is, execute <code>doFrame</code> twice in one Vsync. Frame interpolation is equivalent to preparing the data of the next few frames in advance, so that when encountering a truly time-consuming frame, there will be no stuttering.</p><p>Frame interpolation implementation is mainly in sliding scenarios, used on sliding components that implement <code>OverScroller</code>, such as <code>ListView</code>, <code>RecyclerView</code>. Because if <code>OverScroller</code> is used, we will know the sliding time and distance when touch up, and we can do tricks (frame interpolation) in the middle, equivalent to drawing the content of the next few VSyncs in one Vsync.</p><h2 id="High-Refresh-Rate-Optimization"><a href="#High-Refresh-Rate-Optimization" class="headerlink" title="High Refresh Rate Optimization"></a>High Refresh Rate Optimization</h2><p>The high refresh rate (120 Hz) on modern Android devices shortens the Vsync interval from 16.6 ms to 8.3 ms, which brings huge performance and power consumption challenges. How to complete the necessary operations for rendering in one frame is a place that mobile phone manufacturers must think about and optimize:</p><ol><li>Performance performance and optimization of Super App</li><li>Game high frame rate cooperation</li><li>Logic of mutual switching between 120 fps, 90 fps and 60 fps</li></ol><p><a id="refs"></a></p><h1 id="Reference-Materials"><a href="#Reference-Materials" class="headerlink" title="Reference Materials"></a>Reference Materials</h1><ol><li><a href="https://www.jianshu.com/p/304f56f5d486">https://www.jianshu.com/p/304f56f5d486</a></li><li><a href="http://gityuan.com/2017/02/25/choreographer/">http://gityuan.com/2017/02/25/choreographer/</a></li><li><a href="https://developer.android.com/reference/android/view/Choreographer">https://developer.android.com/reference/android/view/Choreographer</a></li><li><a href="https://www.jishuwen.com/d/2Vcc">https://www.jishuwen.com/d/2Vcc</a></li><li><a href="https://juejin.im/entry/5c8772eee51d456cda2e8099">https://juejin.im/entry/5c8772eee51d456cda2e8099</a></li><li><a href="https://time.geekbang.org/column/intro/142">Android Development Expert Class</a></li><li><a href="https://perfetto.dev/">Perfetto - System profiling, app tracing, and trace analysis</a></li><li><a href="https://developer.android.com/studio/profile/perfetto-ui">Use Perfetto to analyze UI performance</a></li><li><a href="https://source.android.com/docs/core/graphics/arch-bq-gralloc">BufferQueue and Gralloc</a></li><li><a href="https://developer.android.com/about/versions/15/features#graphics">Android 15 Graphics Rendering Optimization</a></li></ol><p><a id="zhihu"></a></p><h1 id="Zhihu-Address"><a href="#Zhihu-Address" class="headerlink" title="Zhihu Address"></a>Zhihu Address</h1><p>Since blog comments are inconvenient, if you want to like or communicate, please move to the Zhihu page of this article<br><a href="https://zhuanlan.zhihu.com/p/87954949">Zhihu - Detailed Explanation of Android Choreographer-based Rendering Mechanism - Perfetto Version</a><br><a href="https://juejin.im/post/5daedc65e51d457834735c65">Juejin - Detailed Explanation of Android Choreographer-based Rendering Mechanism - Perfetto Version</a></p><p><a id="about"></a></p><h1 id="About-Me-amp-Blog"><a href="#About-Me-amp-Blog" class="headerlink" title="About Me &amp; Blog"></a>About Me &amp; Blog</h1><p>Below is a personal introduction and related links. I look forward to communicating with you all!</p><ol><li><a href="https://www.androidperformance.com/about/">Blogger Personal Introduction</a>: Contains personal WeChat and WeChat group links.</li><li><a href="https://androidperformance.com/2019/12/01/BlogMap/">Blog Content Navigation</a>: A navigation of personal blog content.</li><li><a href="https://androidperformance.com/2018/05/07/Android-performance-optimization-skills-and-tools/">Excellent Blog Articles Collected and Organized by Individuals - Must-Know for Android Performance Optimization</a>: Welcome everyone to recommend yourself and recommend (WeChat private chat is fine)</li><li><a href="https://www.androidperformance.com/2023/12/30/the-performance/">Android Performance Optimization Knowledge Planet</a>: Welcome to join, thanks for support~</li></ol><blockquote><p><strong>One person can go faster, a group of people can go further</strong></p></blockquote><p><img src="/en/images/WechatIMG581.webp" alt="Wechat Scan"></p>]]></content>
    
    
    <summary type="html">&lt;p&gt;This article introduces &lt;strong&gt;Choreographer&lt;/strong&gt;, a class that App developers may not frequently encounter but is critically important in the Android Framework rendering pipeline. We will cover the background of its introduction, a brief overview, partial source code analysis, its interaction with MessageQueue, its application in APM (Application Performance Monitoring), and some optimization ideas for Choreographer by mobile phone manufacturers.&lt;/p&gt;
&lt;p&gt;The introduction of Choreographer is mainly to cooperate with Vsync to provide a stable Message processing timing for upper-layer application rendering. When the Vsync signal arrives, the system controls the timing of each frame’s drawing operation by adjusting the Vsync signal cycle. Currently, the screen refresh rate of mainstream mobile phones has reached 120Hz, which means refreshing once every 8.3ms. The system adjusts the Vsync cycle accordingly to match the screen refresh frequency. When each Vsync cycle arrives, the Vsync signal wakes up the Choreographer to execute the application’s drawing operation. This is the main purpose of introducing Choreographer. Understanding Choreographer can also help application developers deeply understand the operating principle of each frame, and at the same time deepen their understanding of core components such as &lt;strong&gt;Message&lt;/strong&gt;, &lt;strong&gt;Handler&lt;/strong&gt;, &lt;strong&gt;Looper&lt;/strong&gt;, &lt;strong&gt;MessageQueue&lt;/strong&gt;, &lt;strong&gt;Input&lt;/strong&gt;, &lt;strong&gt;Animation&lt;/strong&gt;, &lt;strong&gt;Measure&lt;/strong&gt;, &lt;strong&gt;Layout&lt;/strong&gt;, and &lt;strong&gt;Draw&lt;/strong&gt;. Many &lt;strong&gt;APM&lt;/strong&gt; (Application Performance Monitoring) tools also utilize the combination mechanisms of &lt;strong&gt;Choreographer&lt;/strong&gt; (via FrameCallback), &lt;strong&gt;FrameMetrics&amp;#x2F;gfxinfo framestats&lt;/strong&gt; (internally backed by FrameInfo), &lt;strong&gt;MessageQueue&lt;/strong&gt; (via IdleHandler), and &lt;strong&gt;Looper&lt;/strong&gt; (via custom MessageLogging) for performance monitoring. After deeply understanding these mechanisms, developers can conduct performance optimization more specifically and form systematic optimization ideas.&lt;/p&gt;</summary>


    <category term="Android" scheme="https://androidperformance.com/en/categories/Android/"/>
    
    
    <category term="Android" scheme="https://androidperformance.com/en/tags/Android/"/>
    
    <category term="Perfetto" scheme="https://androidperformance.com/en/tags/Perfetto/"/>
    
    <category term="Systrace" scheme="https://androidperformance.com/en/tags/Systrace/"/>
    
    <category term="Jank" scheme="https://androidperformance.com/en/tags/Jank/"/>
    
    <category term="RenderThread" scheme="https://androidperformance.com/en/tags/RenderThread/"/>
    
  </entry>
  
  <entry>
    <title>Android Perfetto Series 4: Opening Large Traces via Command Line</title>
    <link href="https://androidperformance.com/en/2025/02/08/Android-Perfetto-04-Open-Big-Trace-With-Command-Line/"/>
    <id>https://androidperformance.com/en/2025/02/08/Android-Perfetto-04-Open-Big-Trace-With-Command-Line/</id>
    <published>2025-02-08T09:53:03.000Z</published>
    <updated>2026-05-10T23:29:51.057Z</updated>
    
    <content type="html"><![CDATA[<p>This is the fourth article in the Perfetto series, explaining how to use <code>trace_processor_shell</code> to open large files exceeding 2GB locally. In actual problem analysis, we often encounter very large Trace files (greater than 2GB) that cannot be opened by directly dragging them into ui.perfetto.dev due to browser memory limitations. In this case, we need to use the <code>trace_processor_shell</code> tool provided by the official to open large files locally.</p><p>With Google announcing the deprecation of the Systrace tool and the release of Perfetto, Perfetto has basically replaced Systrace in my daily work. At the same time, major manufacturers like OPPO and Vivo have also switched from Systrace to Perfetto. Many friends who are new to Android performance optimization feel a headache when facing the dazzling interface and complex functions of Perfetto. They hope that I can present those previous Systrace articles using Perfetto.</p><span id="more"></span><h2 id="Table-of-Contents"><a href="#Table-of-Contents" class="headerlink" title="Table of Contents"></a>Table of Contents</h2><ul><li><a href="#series">Perfetto Series Catalog</a></li><li><a href="#dl">0. trace_processor_shell Tool Download</a></li><li><a href="#open-big">1. Using trace_processor_shell to Open Large Trace Files</a></li><li><a href="#compare">2. Difference Between Command Line Startup and Direct UI Opening</a></li><li><a href="#mac">3. Mac Permission Issues</a></li><li><a href="#refs">Reference Documents</a></li><li><a href="#about">About Me &amp;&amp; Blog</a></li></ul><p>Paul Graham said: “<strong>Either give a lot of people something they kind of want, or give a small number of people something they really want.</strong>“ Perfetto is actually something that a small number of people really want, so let’s start writing. I welcome everyone to exchange and communicate. If you find errors or inaccurate descriptions, please inform me in time, and I will modify them in time to avoid misleading others.</p><p>This series aims to examine the overall operation of the Android system from a new perspective through the tool Perfetto. In addition, it also aims to provide a different angle to learn key modules such as App, Framework, and Linux. Although you may have read many articles about Android Framework, App, and performance optimization, you may still feel confused because it is difficult to remember the code or understand its running process. Through the graphical tool Perfetto, you may gain a deeper understanding.</p><p><a id="series"></a></p><h1 id="Perfetto-Series-Catalog"><a href="#Perfetto-Series-Catalog" class="headerlink" title="Perfetto Series Catalog"></a>Perfetto Series Catalog</h1><ol><li><a href="https://www.androidperformance.com/en/2024/03/27/Android-Perfetto-101/">Android Perfetto Series Catalog</a></li><li><a href="https://www.androidperformance.com/en/2024/05/21/Android-Perfetto-01-What-is-perfetto/">Android Perfetto Series 1: Introduction to Perfetto</a></li><li><a href="https://www.androidperformance.com/en/2024/05/21/Android-Perfetto-02-how-to-get-perfetto/">Android Perfetto Series 2: Capturing Perfetto Traces</a></li><li><a href="https://www.androidperformance.com/en/2024/05/21/Android-Perfetto-03-how-to-analysis-perfetto/">Android Perfetto Series 3: Familiarizing with the Perfetto View</a></li><li><a href="https://www.androidperformance.com/en/2025/02/08/Android-Perfetto-04-Open-Big-Trace-With-Command-Line/">Android Perfetto Series 4: Opening Large Traces via Command Line</a></li><li><a href="https://www.androidperformance.com/en/2025/03/26/Android-Perfetto-05-Chorergrapher/">Android Perfetto Series 5: Choreographer-based Rendering Flow</a></li><li><a href="https://www.androidperformance.com/en/2025/04/26/Android-Perfetto-06-Why-120Hz/">Android Perfetto Series 6: Why 120Hz? Advantages and Challenges</a></li><li><a href="https://www.androidperformance.com/en/2025/08/02/Android-Perfetto-07-MainThread-And-RenderThread/">Android Perfetto Series 7: MainThread and RenderThread Deep Dive</a></li><li><a href="https://www.androidperformance.com/en/2025/08/05/Android-Perfetto-08-Vsync/">Android Perfetto Series 8: Understanding Vsync and Performance Analysis</a></li><li><a href="https://www.androidperformance.com/en/2025/11/12/Android-Perfetto-09-CPU/">Android Perfetto Series 9: Interpreting CPU Information</a></li><li><a href="https://www.androidperformance.com/2025/11/16/Android-Perfetto-10-Binder/">Android Perfetto Series 10: Binder Scheduling and Lock Contention</a></li><li><a href="https://www.bilibili.com/video/BV1oi82efE4D/">Video (Bilibili) - Android Perfetto Basics and Case Studies</a></li><li><a href="https://www.bilibili.com/video/BV17A6bBLECu/">Video (Bilibili) - Android Perfetto: Trace Graph Types - AOSP, WebView, Flutter + OEM System Optimization</a></li></ol><p>If you haven’t seen the Systrace series yet, here is the portal:</p><ol><li><a href="https://www.androidperformance.com/2019/05/26/Android_Systrace_0/#/%E7%B3%BB%E5%88%97%E6%96%87%E7%AB%A0%E7%9B%AE%E5%BD%95">Systrace Series Catalog</a>: Systematically introduced the use of Systrace, the predecessor of Perfetto, and used Systrace to learn and understand the basic rules of Android performance optimization and Android system operation.</li><li><a href="https://www.androidperformance.com/">Personal Blog</a>: Personal blog, mainly content related to Android, and also put some content related to life and work.</li></ol><p>Welcome everyone to join the WeChat group or Planet on the <a href="https://www.androidperformance.com/about/">About Me</a> page to discuss your problems, the parts about Perfetto you most want to see, and discuss all Android development related content with group friends.</p><p><a id="dl"></a></p><h1 id="0-trace-processor-shell-Tool-Download"><a href="#0-trace-processor-shell-Tool-Download" class="headerlink" title="0. trace_processor_shell Tool Download"></a>0. trace_processor_shell Tool Download</h1><p>Official download address: <a href="https://github.com/google/perfetto/releases">https://github.com/google/perfetto/releases</a> , find the latest release version, and choose your own platform to download:</p><p><img src="/en/images/Android-Perfetto-04-Open-Big-Trace-With-Command-Line/08561ad6-fbe2-4d43-af51-b0c82bead328.webp"></p><p>After downloading, there will be the trace_processor_shell tool inside (taking Mac platform as an example)</p><p><img src="/en/images/Android-Perfetto-04-Open-Big-Trace-With-Command-Line/5a1880b4-88bd-4e76-82a2-08a9f83e05f0.webp"></p><p>trace_processor_shell is one of the core tools of the Perfetto open source project, providing high-performance local Trace parsing services. After starting the HTTP server via the –httpd parameter, it allows:</p><ul><li><strong>Local native acceleration</strong>: Bypass the performance limitations of the browser WASM and directly call the parsing engine implemented in C++. Based on the parsing engine implemented by Rust&#x2F;C++ mixing, it optimizes memory layout and parallel processing, and supports flow parsing of ultra-large trace files.</li><li><strong>Interactive analysis</strong>: Deeply integrated with Perfetto UI to support dynamic queries and visualization.</li><li><strong>Offline debugging</strong>: No need to upload trace to the cloud, protect privacy and support intranet environment.</li></ul><p><strong>Other parameters</strong></p><table><thead><tr><th>Parameter</th><th>Function</th><th>Example Value</th></tr></thead><tbody><tr><td><code>--http-port</code></td><td>Specify listening port</td><td><code>--httpd :8080</code></td></tr><tr><td><code>--preload</code></td><td>Preload common data tables</td><td><code>--preload sched</code></td></tr><tr><td><code>--num-threads</code></td><td>Set parsing thread count (default is CPU core count)</td><td><code>--num-threads 8</code></td></tr></tbody></table><p><a id="open-big"></a></p><h1 id="1-Using-trace-processor-shell-to-Open-Large-Trace-Files"><a href="#1-Using-trace-processor-shell-to-Open-Large-Trace-Files" class="headerlink" title="1. Using trace_processor_shell to Open Large Trace Files"></a>1. Using trace_processor_shell to Open Large Trace Files</h1><figure class="highlight bash"><table><tr><td class="gutter"><pre><span class="line">1</span><br></pre></td><td class="code"><pre><span class="line">./trace_processor_shell --httpd ../jank-HangLVZongHeng-TrainTicket-ScrollSuperJank.perfetto-trace</span><br></pre></td></tr></table></figure><p><img src="/en/images/Android-Perfetto-04-Open-Big-Trace-With-Command-Line/a12d4ea1-3db3-4dc6-a262-2bc116bada2e.webp"></p><p>At this time, open <a href="https://ui.perfetto.dev/">https://ui.perfetto.dev</a> on the web page, and there will be the following pop-up box</p><p><img src="/en/images/Android-Perfetto-04-Open-Big-Trace-With-Command-Line/69ef4b6e-2751-4c52-97d4-c465eefed07f.webp"></p><p>The detailed functions of the pop-up options are as follows</p><h3 id="1-YES-use-loaded-trace"><a href="#1-YES-use-loaded-trace" class="headerlink" title="1. YES, use loaded trace"></a>1. <strong><code>YES, use loaded trace</code></strong></h3><ul><li><strong>Function</strong>: Directly reuse the trace file state currently loaded by Trace Processor (that is, <code>../jank-HangLVZongHeng-TrainTicket-ScrollSuperJank.perfetto-trace</code> specified in the command line).</li><li><strong>Applicable Scenario</strong>:<br>If you have already loaded the trace file via <code>trace_processor_shell --httpd</code> and hope that the UI directly uses the parsing state of the current process (including executed SQL queries, filtering conditions, etc.), choose this option.</li><li><strong>Advantage</strong>:<br>Avoid re-parsing files to save time and memory.</li></ul><h3 id="2-YES-but-reset-state"><a href="#2-YES-but-reset-state" class="headerlink" title="2. YES, but reset state"></a>2. <strong><code>YES, but reset state</code></strong></h3><ul><li><strong>Function</strong>: Force reset the Trace Processor state and reload the current trace file (or load a new file).</li><li><strong>Applicable Scenario</strong>:<ul><li>Need to clear all states of the current Trace Processor (such as temporary query results, filters, etc.) and start analysis again.</li><li>Want to load another trace file through the same port (need to stop the current process or change the port first).</li></ul></li><li><strong>Equivalent Operation</strong>:<br>Equivalent to closing the current <code>trace_processor_shell</code> process and re-executing the command.</li></ul><h3 id="3-NO-Use-builtin-WASM"><a href="#3-NO-Use-builtin-WASM" class="headerlink" title="3. NO, Use builtin WASM"></a>3. <strong><code>NO, Use builtin WASM</code></strong></h3><ul><li><strong>Function</strong>: Completely bypass the local Trace Processor service and use the browser’s built-in WebAssembly (WASM) engine to parse the trace file instead.</li><li><strong>Applicable Scenario</strong>:<ul><li>The local Trace Processor service is unavailable or has compatibility issues.</li><li>Need to support WASM mode exclusive functions such as sharing links and downloading modified trace files.</li></ul></li><li><strong>Cost</strong>:<br>Parsing speed of large files (such as &gt;100MB) drops significantly, and may crash due to browser memory limitations.</li></ul><hr><p>If you choose YES, use loaded trace, after opening Trace, the following functions are unavailable</p><p><img src="/en/images/Android-Perfetto-04-Open-Big-Trace-With-Command-Line/437aea7f-3a0e-4832-992a-8590affca72f.webp"></p><p><a id="compare"></a></p><h1 id="2-Difference-Between-Command-Line-Startup-and-Direct-UI-Opening"><a href="#2-Difference-Between-Command-Line-Startup-and-Direct-UI-Opening" class="headerlink" title="2. Difference Between Command Line Startup and Direct UI Opening"></a>2. Difference Between Command Line Startup and Direct UI Opening</h1><h2 id="Startup-via-Command-Line-trace-processor-shell-httpd"><a href="#Startup-via-Command-Line-trace-processor-shell-httpd" class="headerlink" title="Startup via Command Line (trace_processor_shell --httpd)"></a><strong>Startup via Command Line (<code>trace_processor_shell --httpd</code>)</strong></h2><ul><li><strong>Core Mechanism</strong>:<br>Start a high-performance C++ Trace Processor service locally (listening on <code>127.0.0.1:9001</code>) to provide native accelerated trace parsing capabilities.</li><li><strong>Advantage</strong>:<ul><li><strong>Performance</strong>: Native code parsing speed far exceeds WASM, especially suitable for large trace files (such as &gt;100MB).</li><li><strong>Function Scalability</strong>: Support advanced functions such as SQL query and custom metric calculation.</li><li><strong>State Retention</strong>: The parsing state of Trace Processor (such as SQL temporary tables) can be retained across page sessions.</li></ul></li><li><strong>Limitation</strong>:<ul><li>Cannot directly share trace file links or download modified files via UI.</li><li>Only one browser tab is allowed to use the acceleration service at the same time.</li></ul></li></ul><h2 id="Directly-Open-UI-Web-Page-ui-perfetto-dev"><a href="#Directly-Open-UI-Web-Page-ui-perfetto-dev" class="headerlink" title="Directly Open UI Web Page (ui.perfetto.dev)"></a><strong>Directly Open UI Web Page (<code>ui.perfetto.dev</code>)</strong></h2><ul><li><strong>Core Mechanism</strong>:<br>Completely rely on the browser’s built-in WebAssembly engine to parse trace files, with no local service participation.</li><li><strong>Advantage</strong>:<ul><li><strong>Convenience</strong>: No need to install or start local tools, suitable for quickly viewing small traces.</li><li><strong>Function Completeness</strong>: Support collaboration functions such as sharing links and downloading modified trace files.</li></ul></li><li><strong>Disadvantage</strong>:<ul><li><strong>Performance Bottleneck</strong>: WASM parsing speed is slow, and large files may cause the browser to freeze or crash.</li><li><strong>Function Limitation</strong>: Does not support some advanced SQL queries and custom analysis functions.</li></ul></li></ul><hr><h2 id="Summary-and-Suggestions"><a href="#Summary-and-Suggestions" class="headerlink" title="Summary and Suggestions"></a>Summary and Suggestions</h2><ul><li><strong>Prioritize Command Line Startup</strong>: When processing large traces or requiring complex analysis, use <code>trace_processor_shell --httpd</code> to improve performance.</li><li><strong>Temporary Lightweight Analysis</strong>: Directly uploading to <code>ui.perfetto.dev</code> is more convenient, but pay attention to file size limits.</li></ul><p><a id="mac"></a></p><h1 id="3-Mac-Permission-Issues"><a href="#3-Mac-Permission-Issues" class="headerlink" title="3. Mac Permission Issues"></a>3. Mac Permission Issues</h1><p>Running <code>./trace_processor_shell --httpd</code> directly on Mac will verify the following error<br><img src="/en/images/Android-Perfetto-04-Open-Big-Trace-With-Command-Line/d07f0af0-33c2-4353-9bac-aa55ae2b239a.webp"></p><p>You need to click Allow in Settings - Privacy &amp; Security to continue running<br><img src="/en/images/Android-Perfetto-04-Open-Big-Trace-With-Command-Line/d7ac3779-ad32-4884-a70f-ea46ff39cf1b.webp"></p><p><a id="refs"></a></p><h1 id="Reference-Documents"><a href="#Reference-Documents" class="headerlink" title="Reference Documents"></a>Reference Documents</h1><ol><li><a href="https://github.com/google/perfetto">Perfetto Github Repository</a></li><li><a href="https://perfetto.dev/docs/">Perfetto Official Documentation</a></li></ol><p><a id="about"></a></p><h1 id="About-Me-amp-amp-Blog"><a href="#About-Me-amp-amp-Blog" class="headerlink" title="About Me &amp;&amp; Blog"></a>About Me &amp;&amp; Blog</h1><p>Here is a personal introduction and related links. I hope to communicate more with my peers. When three people walk together, there must be one who can be my teacher!</p><ol><li><a href="https://www.androidperformance.com/about/">Blogger Personal Introduction</a>: Contains personal WeChat and WeChat group links.</li><li><a href="https://androidperformance.com/2019/12/01/BlogMap/">This Blog Content Navigation</a>: A navigation of personal blog content.</li><li><a href="https://androidperformance.com/2018/05/07/Android-performance-optimization-skills-and-tools/">Personal Collection of Excellent Blog Articles - Android Performance Optimization Must-Know</a>: Welcome everyone to recommend themselves and others (WeChat private chat is fine)</li><li><a href="https://www.androidperformance.com/2023/12/30/the-performance/">Android Performance Optimization Knowledge Planet</a>: Welcome to join, thank you for your support~</li></ol><blockquote><p><strong>One person can go faster, a group of people can go further</strong></p></blockquote><p><img src="/en/images/WechatIMG581.webp" alt="Wechat Scan"></p>]]></content>
    
    
    <summary type="html">&lt;p&gt;This is the fourth article in the Perfetto series, explaining how to use &lt;code&gt;trace_processor_shell&lt;/code&gt; to open large files exceeding 2GB locally. In actual problem analysis, we often encounter very large Trace files (greater than 2GB) that cannot be opened by directly dragging them into ui.perfetto.dev due to browser memory limitations. In this case, we need to use the &lt;code&gt;trace_processor_shell&lt;/code&gt; tool provided by the official to open large files locally.&lt;/p&gt;
&lt;p&gt;With Google announcing the deprecation of the Systrace tool and the release of Perfetto, Perfetto has basically replaced Systrace in my daily work. At the same time, major manufacturers like OPPO and Vivo have also switched from Systrace to Perfetto. Many friends who are new to Android performance optimization feel a headache when facing the dazzling interface and complex functions of Perfetto. They hope that I can present those previous Systrace articles using Perfetto.&lt;/p&gt;</summary>


    <category term="Android" scheme="https://androidperformance.com/en/categories/Android/"/>
    
    
    <category term="Android" scheme="https://androidperformance.com/en/tags/Android/"/>
    
    <category term="Perfetto" scheme="https://androidperformance.com/en/tags/Perfetto/"/>
    
    <category term="Systrace" scheme="https://androidperformance.com/en/tags/Systrace/"/>
    
    <category term="Memory" scheme="https://androidperformance.com/en/tags/Memory/"/>
    
    <category term="Performance" scheme="https://androidperformance.com/en/tags/Performance/"/>
    
  </entry>
  
  <entry>
    <title>Android ANR Series 3 - ANR Case Studies</title>
    <link href="https://androidperformance.com/en/2025/02/08/Android-ANR-03-ANR-Case-Share/"/>
    <id>https://androidperformance.com/en/2025/02/08/Android-ANR-03-ANR-Case-Share/</id>
    <published>2025-02-08T08:29:30.000Z</published>
    <updated>2026-05-10T23:29:51.053Z</updated>
    
    <content type="html"><![CDATA[<p>This is the third article in the Android App ANR series, focusing on real-world ANR cases. The series includes:</p><ol><li><a href="https://www.androidperformance.com/en/2025/02/08/Android-ANR-01-ANR-Design/">Android App ANR Series 1: Understanding Android ANR Design Philosophy</a></li><li><a href="https://www.androidperformance.com/en/2025/02/08/Android-ANR-02-How-to-analysis-ANR/">Android App ANR Series 2: ANR Analysis Workflow and Key Logs</a></li><li><a href="https://www.androidperformance.com/en/2025/02/08/Android-ANR-03-ANR-Case-Share/">Android App ANR Series 3: ANR Case Studies</a></li></ol><span id="more"></span><p>The case-analysis method below still applies, but the evidence entry points should be expanded for the current workflow. Do not rely on a single ANR trace or logcat snippet. Start from Android Vitals or field monitoring to identify type and impact, then use bugreports, <code>/data/anr/anr_*</code>, EventLog, main&#x2F;system logs, and <code>ApplicationExitInfo</code> to reconstruct the trigger point. If the case involves Binder waits, CPU saturation, low memory, I&#x2F;O, or rendering stalls, include Perfetto&#x2F;System Trace for the same interval in the evidence chain.</p><blockquote><p>ANR (Application Not Responding) is a simple definition that covers many Android system design philosophies.</p><p>First, ANR belongs to the application scope. This differs from SNR (System Not Responding), which reflects issues in the system process (<code>system_server</code>). SNR is managed by the Watchdog mechanism, while ANR is managed by the message handling mechanism at the system layer through message scheduling and timeout handling.</p><p>Second, the ANR mechanism is primarily implemented in the system layer. All ANR-related messages are scheduled by <code>system_server</code> and dispatched to the application process. The system uses various timeout limits to track message processing. If an app fails to respond within these limits, the system collects diagnostics (CPU&#x2F;IO usage, thread stacks) and reports that the process is not responding.</p><p>Third, ANR is essentially a performance issue. The mechanism limits the app’s main thread, requiring it to handle common operations (starting services, processing broadcasts, input) within fixed timeframes. Time-consuming operations in the main thread (heavy calculations, heavy I&#x2F;O, complex layouts) reduce responsiveness.</p><p>Finally, some ANR issues are very difficult to analyze. System-level issues like Linux kernel bugs, memory fragmentation, or hardware failures can cause message scheduling failures that are hard to reproduce and diagnose.</p><p>– From <a href="https://duanqz.github.io/2015-10-12-ANR-Analysis">duanqz</a></p></blockquote><h1 id="Common-Causes-of-ANR"><a href="#Common-Causes-of-ANR" class="headerlink" title="Common Causes of ANR"></a>Common Causes of ANR</h1><p>When investigating ANR reasons, usually we must follow the rule: <strong>Boldly hypothesize, carefully verify</strong>. After extracting the abnormal parts, first hypothesize that the problem is caused here, and then use this hypothesis as a starting point to check the Logs before and after to see if they can support your hypothesis. If not, then switch to another point.</p><h2 id="Issues-Within-the-Current-Process"><a href="#Issues-Within-the-Current-Process" class="headerlink" title="Issues Within the Current Process"></a>Issues Within the Current Process</h2><ol><li>Deadlocks.</li><li>Main thread calls <code>thread.join()</code>, <code>sleep()</code>, <code>wait()</code>, or waits for a thread lock.</li><li>Main thread is blocked in <code>nSyncDraw</code> (waiting for RenderThread).</li><li>Time-consuming operations on the main thread, such as complex layouts, massive <code>for</code> loops, IO, etc.</li><li>Main thread is blocked by a sub-thread’s synchronized lock.</li><li>Main thread times out waiting for a sub-thread.</li><li>Main thread Activity lifecycle method execution timeout.</li><li>Main thread Service lifecycle method execution timeout.</li><li>Main thread <code>Broadcast.onReceive</code> function execution timeout (even if <code>goAsync</code> is called).</li><li>RenderThread is time-consuming.</li><li>Time-consuming network access.</li><li>Application reads and writes a large amount of data.</li><li>Database operations.</li><li>Hardware operations (such as Camera).</li><li>The number of service binders reaches the upper limit.</li><li>Other threads terminate or crash, causing the main thread to wait indefinitely.</li><li>Dump memory operations.</li><li>A large number of <code>SharedPreference</code> reads and writes at the same time.</li></ol><h2 id="Issues-in-Remote-Processes-or-the-System"><a href="#Issues-in-Remote-Processes-or-the-System" class="headerlink" title="Issues in Remote Processes or the System"></a>Issues in Remote Processes or the System</h2><ol><li>Binder communication with <code>SystemServer</code>, and <code>SystemServer</code> execution is time-consuming.<ol><li>The method itself takes a long time to execute causing timeout.</li><li>Too much lock contention in <code>SystemServer</code>, resulting in lock wait timeout.</li></ol></li><li>Timeout waiting for other processes to return, such as getting data from other processes’ <code>ContentProvider</code>.</li><li>Window state confusion leading to Input dispatch timeout.</li><li>Frequent crashes of the process corresponding to the <code>ContentProvider</code> will also kill the current process.</li><li>System-wide low memory.</li><li>System-wide high CPU usage.</li><li>System-wide high IO usage.</li><li><code>SurfaceFlinger</code> timeout.</li><li>Bug in system freezing function.</li><li>WatchDog ANR in <code>System Server</code>.</li><li>The device triggers thermal control frequency limitation.</li></ol><h1 id="ANR-Case-Studies"><a href="#ANR-Case-Studies" class="headerlink" title="ANR Case Studies"></a>ANR Case Studies</h1><h2 id="ANR-Case-Toutiao-Deadlock"><a href="#ANR-Case-Toutiao-Deadlock" class="headerlink" title="ANR Case: Toutiao - Deadlock"></a>ANR Case: Toutiao - Deadlock</h2><p>The main operation is frequently pulling out Toutiao from the sidebar for split-screen operations. After multiple operations, the application experienced an ANR, which caused the phone to briefly black screen and freeze in the application interface in the split-screen bar. However, it returned to normal after 4-5 seconds.</p><p>The reason for the application ANR is that its own main thread is blocked.</p><figure class="highlight java"><table><tr><td class="gutter"><pre><span class="line">1</span><br><span class="line">2</span><br><span class="line">3</span><br><span class="line">4</span><br><span class="line">5</span><br><span class="line">6</span><br><span class="line">7</span><br><span class="line">8</span><br><span class="line">9</span><br><span class="line">10</span><br><span class="line">11</span><br><span class="line">12</span><br></pre></td><td class="code"><pre><span class="line"><span class="string">&quot;main&quot;</span>prio=5tid=1Blocked</span><br><span class="line">| group=<span class="string">&quot;main&quot;</span>sCount=1dsCount=0obj=0x74f9bbe8self=<span class="number">0xe7084400</span></span><br><span class="line">| sysTid=28210nice=0cgrp=defaultsched=<span class="number">0</span>/0handle=<span class="number">0xe9dcd534</span></span><br><span class="line">| state=S schedstat=(<span class="number">13454428309928953492</span>) utm=121stm=13core=3HZ=<span class="number">100</span></span><br><span class="line">| stack=<span class="number">0xff3b6000</span>-0xff3b8000stackSize=8MB</span><br><span class="line">| held mutexes=</span><br><span class="line">at com.ss.android.common.applog.LogReaper.insertCrashLog(SourceFile:<span class="number">98</span>)</span><br><span class="line">- waiting to lock &lt;<span class="number">0x0d3fbd00</span>&gt; (a com.ss.android.common.applog.LogReaper) held by thread34</span><br><span class="line">at com.ss.android.common.applog.AppLog.uncaughtException(SourceFile:<span class="number">1408</span></span><br><span class="line">at u.aly.n.uncaughtException(SourceFile:<span class="number">34</span>)</span><br><span class="line">at java.lang.ThreadGroup.uncaughtException(ThreadGroup.java:<span class="number">1068</span>)</span><br><span class="line">at java.lang.ThreadGroup.uncaughtException(ThreadGroup.java:<span class="number">1063</span>)</span><br></pre></td></tr></table></figure><p>Key Information:</p><figure class="highlight java"><table><tr><td class="gutter"><pre><span class="line">1</span><br></pre></td><td class="code"><pre><span class="line">waiting to lock &lt;<span class="number">0x0d3fbd00</span>&gt; (a com.ss.android.common.applog.LogReaper) held by thread34</span><br></pre></td></tr></table></figure><p>Therefore, in the ANR log below, search for <code>tid==34</code>:</p><figure class="highlight java"><table><tr><td class="gutter"><pre><span class="line">1</span><br><span class="line">2</span><br><span class="line">3</span><br><span class="line">4</span><br><span class="line">5</span><br><span class="line">6</span><br><span class="line">7</span><br><span class="line">8</span><br><span class="line">9</span><br><span class="line">10</span><br><span class="line">11</span><br><span class="line">12</span><br><span class="line">13</span><br><span class="line">14</span><br><span class="line">15</span><br><span class="line">16</span><br><span class="line">17</span><br><span class="line">18</span><br></pre></td><td class="code"><pre><span class="line"><span class="string">&quot;LogReaper&quot;</span>prio=5tid=34TimedWaiting</span><br><span class="line">| group=<span class="string">&quot;main&quot;</span>sCount=1dsCount=0obj=0x12fcaba0self=<span class="number">0xcb226e00</span></span><br><span class="line">| sysTid=28274nice=0cgrp=defaultsched=<span class="number">0</span>/0handle=<span class="number">0xc9f9b920</span></span><br><span class="line">| state=S schedstat=(<span class="number">77341565269270880</span>) utm=7stm=0core=5HZ=<span class="number">100</span></span><br><span class="line">| stack=<span class="number">0xc9e99000</span>-0xc9e9b000stackSize=1038KB</span><br><span class="line">| held mutexes=</span><br><span class="line">at java.lang.Object.wait!(Native method)</span><br><span class="line">- waiting on &lt;<span class="number">0x00fc7065</span>&gt; (a java.util.concurrent.atomic.AtomicInteger)</span><br><span class="line">at java.lang.Object.wait(Object.java:<span class="number">407</span>)</span><br><span class="line">at com.ss.android.action.b.d.a(SourceFile:<span class="number">216</span>)</span><br><span class="line">at com.ss.android.newmedia.b.onLogSessionBatchEvent(SourceFile:<span class="number">468</span>)</span><br><span class="line">at com.ss.android.common.applog.DBHelper.batchSession(SourceFile:<span class="number">616</span>)</span><br><span class="line">- locked &lt;<span class="number">0x0d4ff1c4</span>&gt; (a com.ss.android.common.applog.DBHelper)</span><br><span class="line">at com.ss.android.common.applog.LogReaper.switchSession(SourceFile:<span class="number">175</span>)</span><br><span class="line">at com.ss.android.common.applog.LogReaper.switchSession(SourceFile:<span class="number">153</span>)</span><br><span class="line">at com.ss.android.common.applog.LogReaper.processItem(SourceFile:<span class="number">122</span>)</span><br><span class="line">- locked &lt;<span class="number">0x0d3fbd00</span>&gt; (a com.ss.android.common.applog.LogReaper)</span><br><span class="line">at com.ss.android.common.applog.LogReaper.run(SourceFile:<span class="number">632</span>)</span><br></pre></td></tr></table></figure><p>Key Information:</p><figure class="highlight java"><table><tr><td class="gutter"><pre><span class="line">1</span><br></pre></td><td class="code"><pre><span class="line">waiting on &lt;<span class="number">0x00fc7065</span>&gt; (a java.util.concurrent.atomic.AtomicInteger)</span><br></pre></td></tr></table></figure><p>Caused by code blocking within the app.</p><h2 id="ANR-Case-ANR-caused-by-Freezing"><a href="#ANR-Case-ANR-caused-by-Freezing" class="headerlink" title="ANR Case: ANR caused by Freezing"></a>ANR Case: ANR caused by Freezing</h2><p>Search for <code>am_anr</code> to view the time when the ANR occurred.</p><figure class="highlight java"><table><tr><td class="gutter"><pre><span class="line">1</span><br></pre></td><td class="code"><pre><span class="line"><span class="number">05</span>-<span class="number">0100</span>:<span class="number">51</span>:<span class="number">39.594</span> <span class="number">1449</span> 5234I am_anr  : [<span class="number">0</span>,<span class="number">2169</span>,com.xxx.weather2,<span class="number">820526660</span>,Input dispatching timed <span class="title function_">out</span> <span class="params">(Waiting to send key event because the focused window has not finished processing all of the input events that were previously delivered to it.  Outbound queue length: <span class="number">0.</span>  Wait queue length: <span class="number">1.</span>)</span>]</span><br></pre></td></tr></table></figure><p>From the ANR description, it can be seen that the current Window timed out while processing the previous Input event, causing the new event not to be processed in time, so an ANR occurred.</p><p>Search for <code>ANR in</code> to view the CPU information at that time.</p><figure class="highlight java"><table><tr><td class="gutter"><pre><span class="line">1</span><br><span class="line">2</span><br><span class="line">3</span><br><span class="line">4</span><br><span class="line">5</span><br><span class="line">6</span><br><span class="line">7</span><br><span class="line">8</span><br><span class="line">9</span><br></pre></td><td class="code"><pre><span class="line"><span class="number">05</span>-<span class="number">0100</span>:<span class="number">51</span>:<span class="number">53.974</span> <span class="number">1449</span> 5234E ActivityManager: ANR in com.xxx.weather2 (com.xxx.weather2/com.xxx.weather.xxxMainActivity)</span><br><span class="line"><span class="number">05</span>-<span class="number">0100</span>:<span class="number">51</span>:<span class="number">53.974</span> <span class="number">1449</span> 5234E ActivityManager: PID:<span class="number">2169</span></span><br><span class="line"><span class="number">05</span>-<span class="number">0100</span>:<span class="number">51</span>:<span class="number">53.974</span> <span class="number">1449</span> 5234E ActivityManager: Reason:Input dispatching timed <span class="title function_">out</span> <span class="params">(Waiting to send key event because the focused window has not finished processing all of the input events that were previously delivered to it.  Outbound queue length: <span class="number">0.</span>  Wait queue length: <span class="number">1.</span>)</span></span><br><span class="line"><span class="number">05</span>-<span class="number">01</span> <span class="number">00</span>:<span class="number">51</span>:<span class="number">53.974</span>  <span class="number">1449</span>  <span class="number">5234</span> E ActivityManager: Parent: com.xxx.weather2/com.xxx.weather.xxxMainActivity</span><br><span class="line"><span class="number">05</span>-<span class="number">01</span> <span class="number">00</span>:<span class="number">51</span>:<span class="number">53.974</span>  <span class="number">1449</span>  <span class="number">5234</span> E ActivityManager: Load: <span class="number">29.89</span> / <span class="number">31.82</span> / <span class="number">32.27</span></span><br><span class="line"><span class="number">05</span>-<span class="number">01</span> <span class="number">00</span>:<span class="number">51</span>:<span class="number">53.974</span>  <span class="number">1449</span>  <span class="number">5234</span> E ActivityManager: CPU usage from 4583ms to 12043ms <span class="title function_">later</span> <span class="params">(<span class="number">2020</span>-<span class="number">05</span>-<span class="number">01</span> <span class="number">00</span>:<span class="number">51</span>:<span class="number">44.177</span> to <span class="number">2020</span>-<span class="number">05</span>-<span class="number">01</span> <span class="number">00</span>:<span class="number">51</span>:<span class="number">51.637</span>)</span>:</span><br><span class="line"><span class="number">05</span>-<span class="number">01</span> <span class="number">00</span>:<span class="number">51</span>:<span class="number">53.974</span>  <span class="number">1449</span>  <span class="number">5234</span> E ActivityManager:   <span class="number">18</span>% <span class="number">1449</span>/system_server: <span class="number">9.1</span>% user + <span class="number">9.3</span>% kernel / faults: <span class="number">7819</span> minor <span class="number">1</span> major</span><br><span class="line"><span class="number">05</span>-<span class="number">01</span> <span class="number">00</span>:<span class="number">51</span>:<span class="number">53.974</span>  <span class="number">1449</span>  <span class="number">5234</span> E ActivityManager:   <span class="number">10</span>% <span class="number">720</span>/surfaceflinger: <span class="number">6.2</span>% user + <span class="number">4.4</span>% kernel / faults: <span class="number">734</span> minor <span class="number">26</span> major</span><br><span class="line"><span class="number">05</span>-<span class="number">01</span> <span class="number">00</span>:<span class="number">51</span>:<span class="number">53.974</span>  <span class="number">1449</span>  <span class="number">5234</span> E ActivityManager:   <span class="number">10</span>% <span class="number">651</span>/android.hardware.audio@<span class="number">5.0</span>-service-mediatek: <span class="number">9.5</span>% user + <span class="number">0.8</span>% kernel / faults: <span class="number">1</span> minor <span class="number">4</span> major</span><br></pre></td></tr></table></figure><p>It can be seen that the CPU was not busy at that time, so it was not an ANR caused by system load. Therefore, subsequent analysis needs to extract corresponding information from the Log to analyze what the system was doing before and after the timeout input event occurred.</p><p>The analysis process is as follows:</p><ol><li>Find the specific time when the ANR occurred: <code>00:51:39.594</code>.</li><li>Start looking from the Log 5s ago and find useful information: <code>00:51:34.478</code>.</li><li>It was found that there was nothing abnormal at this time point, only that the application did not respond to <code>key_back_down</code>, causing an ANR reported 5s later.</li><li>From the Log after ANR, it is found that <code>xxxHansManager : unfreeze uid: 10182 package: com.xxx.weather2 reason: Signal</code>. This Log indicates that <code>com.xxx.weather2</code> was in a frozen state before and was unfrozen here. So we can verify the bold guess: was <code>com.xxx.weather2</code> unable to respond to events after being frozen, causing the issue?</li><li>Search for the freezing Log. It can be seen that at <code>00:51:04.000</code>, the system froze <code>com.xxx.weather2</code>: <code>xxxHansManager : freeze uid: 10182 package: com.xxx.weather2 reason: LcdOff</code>.</li><li>This requires the system team to check if there is a problem with the logic of freezing.</li></ol><figure class="highlight java"><table><tr><td class="gutter"><pre><span class="line">1</span><br><span class="line">2</span><br><span class="line">3</span><br><span class="line">4</span><br><span class="line">5</span><br><span class="line">6</span><br><span class="line">7</span><br><span class="line">8</span><br><span class="line">9</span><br><span class="line">10</span><br><span class="line">11</span><br><span class="line">12</span><br><span class="line">13</span><br><span class="line">14</span><br><span class="line">15</span><br><span class="line">16</span><br><span class="line">17</span><br><span class="line">18</span><br><span class="line">19</span><br><span class="line">20</span><br><span class="line">21</span><br><span class="line">22</span><br><span class="line">23</span><br><span class="line">24</span><br><span class="line">25</span><br><span class="line">26</span><br><span class="line">27</span><br><span class="line">28</span><br><span class="line">29</span><br><span class="line">30</span><br><span class="line">31</span><br><span class="line">32</span><br><span class="line">33</span><br><span class="line">34</span><br><span class="line">35</span><br><span class="line">36</span><br><span class="line">37</span><br><span class="line">38</span><br><span class="line">39</span><br><span class="line">40</span><br><span class="line">41</span><br><span class="line">42</span><br><span class="line">43</span><br><span class="line">44</span><br></pre></td><td class="code"><pre><span class="line"><span class="comment">// Due to LcdOff, initiate freezing, weather2 is frozen: com.xxx.weather2 reason: LcdOff</span></span><br><span class="line"><span class="number">05</span>-<span class="number">01</span> <span class="number">00</span>:<span class="number">51</span>:<span class="number">03.994</span>  <span class="number">1449</span>  <span class="number">2187</span> I xxxHansManager : freeze uid: <span class="number">10245</span> <span class="keyword">package</span>: com.tencent.mm reason: LcdOff</span><br><span class="line"><span class="number">05</span>-<span class="number">01</span> <span class="number">00</span>:<span class="number">51</span>:<span class="number">03.994</span>  <span class="number">1449</span>  <span class="number">2187</span> D xxxListManagerImpl: com.tencent.mm in autoStart list!</span><br><span class="line"><span class="number">05</span>-<span class="number">01</span> <span class="number">00</span>:<span class="number">51</span>:<span class="number">03.998</span>  <span class="number">1449</span>  <span class="number">2187</span> I xxxHansManager : freeze uid: <span class="number">10246</span> <span class="keyword">package</span>: com.xunmeng.pinduoduo reason: LcdOff</span><br><span class="line"><span class="number">05</span>-<span class="number">01</span> <span class="number">00</span>:<span class="number">51</span>:<span class="number">03.998</span>  <span class="number">1449</span>  <span class="number">2187</span> D xxxListManagerImpl: com.xunmeng.pinduoduo in autoStart list!</span><br><span class="line"><span class="number">05</span>-<span class="number">01</span> <span class="number">00</span>:<span class="number">51</span>:<span class="number">04.000</span>  <span class="number">1449</span>  <span class="number">2187</span> I xxxHansManager : freeze uid: <span class="number">10182</span> <span class="keyword">package</span>: com.xxx.weather2 reason: LcdOff</span><br><span class="line"><span class="number">05</span>-<span class="number">01</span> <span class="number">00</span>:<span class="number">51</span>:<span class="number">04.002</span>   <span class="number">645</span> <span class="number">30914</span> I netd    : firewallSetUidRule(<span class="number">4</span>, <span class="number">10182</span>, <span class="number">2</span>) &lt;<span class="number">0.</span>09ms&gt;</span><br><span class="line"><span class="number">05</span>-<span class="number">01</span> <span class="number">00</span>:<span class="number">51</span>:<span class="number">04.005</span>  <span class="number">1449</span>  <span class="number">2187</span> I xxxHansManager : freeze uid: <span class="number">10187</span> <span class="keyword">package</span>: com.heytap.yoli reason: LcdOff</span><br><span class="line"><span class="number">05</span>-<span class="number">01</span> <span class="number">00</span>:<span class="number">51</span>:<span class="number">04.005</span>  <span class="number">1449</span>  <span class="number">2187</span> D xxxListManagerImpl: com.heytap.yoli in autoStart list!</span><br><span class="line"><span class="number">05</span>-<span class="number">01</span> <span class="number">00</span>:<span class="number">51</span>:<span class="number">04.005</span>  <span class="number">1449</span>  <span class="number">2187</span> I xxxHansManager : isHansImportantCase uid: <span class="number">10196</span> pkg: cn.kuwo.player reason: audiofocus</span><br><span class="line"><span class="number">05</span>-<span class="number">01</span> <span class="number">00</span>:<span class="number">51</span>:<span class="number">04.007</span>  <span class="number">1449</span>  <span class="number">2187</span> I xxxHansManager : freeze uid: <span class="number">10234</span> <span class="keyword">package</span>: com.tencent.mobileqq reason: LcdOff</span><br><span class="line"><span class="number">05</span>-<span class="number">01</span> <span class="number">00</span>:<span class="number">51</span>:<span class="number">04.008</span>  <span class="number">1449</span>  <span class="number">2187</span> D xxxListManagerImpl: com.tencent.mobileqq in autoStart list!</span><br><span class="line"><span class="number">05</span>-<span class="number">01</span> <span class="number">00</span>:<span class="number">51</span>:<span class="number">04.014</span>  <span class="number">1449</span>  <span class="number">2187</span> I xxxHansManager : freeze uid: <span class="number">10235</span> <span class="keyword">package</span>: com.tencent.qqlive reason: LcdOff</span><br><span class="line"></span><br><span class="line"><span class="comment">// weather2 Received KEYCODE_BACK ACTION_DOWN</span></span><br><span class="line"><span class="number">05</span>-<span class="number">01</span> <span class="number">00</span>:<span class="number">51</span>:<span class="number">04.471</span>  <span class="number">1449</span>  <span class="number">9842</span> D xxxPhoneWindowManager: interceptKeyBeforeQueueing:KeyEvent &#123; action=ACTION_DOWN, keyCode=KEYCODE_BACK, scanCode=<span class="number">0</span>, metaState=<span class="number">0</span>, flags=<span class="number">0x8</span>, repeatCount=<span class="number">0</span>, eventTime=<span class="number">38812125</span>, downTime=<span class="number">38812125</span>, deviceId=-<span class="number">1</span>, source=<span class="number">0x101</span>, displayId=<span class="number">0</span> &#125;</span><br><span class="line"><span class="number">05</span>-<span class="number">01</span> <span class="number">00</span>:<span class="number">51</span>:<span class="number">04.471</span>  <span class="number">1449</span>  <span class="number">9842</span> I sysui_multi_action: [<span class="number">757</span>,<span class="number">803</span>,<span class="number">799</span>,key_back_down,<span class="number">802</span>,<span class="number">1</span>]</span><br><span class="line"><span class="number">05</span>-<span class="number">01</span> <span class="number">00</span>:<span class="number">51</span>:<span class="number">04.477</span>  <span class="number">1449</span>  <span class="number">1620</span> D xxxPhoneWindowManager: interceptKeyBeforeDispatching key: win=Window&#123;1b36ae8 u0 com.xxx.weather2/com.xxx.weather.xxxMainActivity&#125;  event = KeyEvent &#123; action=ACTION_DOWN, keyCode=KEYCODE_BACK, scanCode=<span class="number">0</span>, metaState=<span class="number">0</span>, flags=<span class="number">0x8</span>, repeatCount=<span class="number">0</span>, eventTime=<span class="number">38812125</span>, downTime=<span class="number">38812125</span>, deviceId=-<span class="number">1</span>, source=<span class="number">0x101</span>, displayId=<span class="number">0</span> &#125;</span><br><span class="line"><span class="number">05</span>-<span class="number">01</span> <span class="number">00</span>:<span class="number">51</span>:<span class="number">04.477</span>  <span class="number">1449</span>  <span class="number">1620</span> D xxxPhoneWindowManager: interceptKeyBeforeDispatching <span class="type">newEvent</span> <span class="variable">keyCode</span> <span class="operator">=</span> <span class="number">4</span></span><br><span class="line"></span><br><span class="line"><span class="comment">// weather2 Received KEYCODE_BACK ACTION_UP</span></span><br><span class="line"><span class="number">05</span>-<span class="number">01</span> <span class="number">00</span>:<span class="number">51</span>:<span class="number">34.478</span>  <span class="number">1449</span>  <span class="number">1620</span> D xxxPhoneWindowManager: interceptKeyBeforeDispatching key: win=Window&#123;1b36ae8 u0 com.xxx.weather2/com.xxx.weather.xxxMainActivity&#125;  event = KeyEvent &#123; action=ACTION_UP, keyCode=KEYCODE_BACK, scanCode=<span class="number">0</span>, metaState=<span class="number">0</span>, flags=<span class="number">0x8</span>, repeatCount=<span class="number">0</span>, eventTime=<span class="number">38842126</span>, downTime=<span class="number">38842126</span>, deviceId=-<span class="number">1</span>, source=<span class="number">0x101</span>, displayId=<span class="number">0</span> &#125;</span><br><span class="line"><span class="number">05</span>-<span class="number">01</span> <span class="number">00</span>:<span class="number">51</span>:<span class="number">34.478</span>  <span class="number">1449</span>  <span class="number">1620</span> D xxxPhoneWindowManager: interceptKeyBeforeDispatching <span class="type">newEvent</span> <span class="variable">keyCode</span> <span class="operator">=</span> <span class="number">4</span></span><br><span class="line"></span><br><span class="line"><span class="comment">// KEYCODE_BACK ACTION_UP did not respond for 5s, triggering ANR</span></span><br><span class="line"><span class="number">05</span>-<span class="number">01</span> <span class="number">00</span>:<span class="number">51</span>:<span class="number">39.484</span>  <span class="number">1449</span>  <span class="number">1620</span> I WindowManager: Input event dispatching timed out sending to com.xxx.weather2/com.xxx.weather.xxxMainActivity.  Reason: Waiting to send key event because the focused window has not finished processing all of the input events that were previously delivered to it.  Outbound queue length: <span class="number">0.</span>  Wait queue length: <span class="number">1.</span></span><br><span class="line"><span class="number">05</span>-<span class="number">01</span> <span class="number">00</span>:<span class="number">51</span>:<span class="number">39.484</span>  <span class="number">2256</span>  <span class="number">5518</span> I QUALITY-TOTAL: exp: anr</span><br><span class="line"><span class="number">05</span>-<span class="number">01</span> <span class="number">00</span>:<span class="number">51</span>:<span class="number">39.594</span>  <span class="number">1449</span>  <span class="number">5234</span> I am_anr  : [<span class="number">0</span>,<span class="number">2169</span>,com.xxx.weather2,<span class="number">820526660</span>,Input dispatching timed <span class="title function_">out</span> <span class="params">(Waiting to send key event because the focused window has not finished processing all of the input events that were previously delivered to it.  Outbound queue length: <span class="number">0.</span>  Wait queue length: <span class="number">1.</span>)</span>]</span><br><span class="line"><span class="number">05</span>-<span class="number">01</span> <span class="number">00</span>:<span class="number">51</span>:<span class="number">39.593</span>  <span class="number">1449</span>  <span class="number">1620</span> D ActivityManager:  ANR post Runnable <span class="keyword">for</span> ProcessRecord&#123;ae0c833 <span class="number">2169</span>:com.xxx.weather2/u0a182&#125; to deal with anr happend at <span class="number">38847248</span>@#@<span class="number">2169</span></span><br><span class="line"><span class="number">05</span>-<span class="number">01</span> <span class="number">00</span>:<span class="number">51</span>:<span class="number">39.593</span>  <span class="number">1449</span>  <span class="number">1620</span> D ActivityManager:  ANR <span class="title function_">caller</span><span class="params">(<span class="number">2</span>)</span> = com.android.server.am.ActivityManagerService$LocalService.inputDispatchingTimedOut:<span class="number">19872</span> com.android.server.wm.ActivityRecord.keyDispatchingTimedOut:<span class="number">2641</span> com.android.server.wm.AppWindowToken.keyDispatchingTimedOut:<span class="number">2007</span> com.android.server.wm.InputManagerCallback.notifyANR:<span class="number">111</span> com.android.server.input.InputManagerService.notifyANR:<span class="number">1822</span> &lt;bottom of call stack&gt; &lt;bottom of call stack&gt; &lt;bottom of call stack&gt;</span><br><span class="line"></span><br><span class="line"><span class="comment">// The system sends Signal 3 to weather2 (SIGNAL_QUIT = 3, given to the Signal Catcher thread to output Trace)</span></span><br><span class="line"><span class="number">05</span>-<span class="number">01</span> <span class="number">00</span>:<span class="number">51</span>:<span class="number">40.868</span>  <span class="number">2169</span>  <span class="number">2202</span> I oloros.weather: Thread[<span class="number">7</span>,tid=<span class="number">2202</span>,WaitingInMainSignalCatcherLoop,Thread*=<span class="number">0xd9878400</span>,peer=<span class="number">0x138c0250</span>,<span class="string">&quot;Signal Catcher&quot;</span>]: reacting to signal</span><br><span class="line"></span><br><span class="line"><span class="comment">// The system detected the Signal given to weather2, so unfreeze com.xxx.weather2</span></span><br><span class="line"><span class="number">05</span>-<span class="number">01</span> <span class="number">00</span>:<span class="number">51</span>:<span class="number">40.869</span>  <span class="number">1449</span>  <span class="number">9811</span> I xxxHansManager : unfreeze uid: <span class="number">10182</span> <span class="keyword">package</span>: com.xxx.weather2 reason: Signal</span><br><span class="line"><span class="number">05</span>-<span class="number">01</span> <span class="number">00</span>:<span class="number">51</span>:<span class="number">40.869</span>  <span class="number">2169</span>  <span class="number">2202</span> I oloros.weather:</span><br><span class="line"><span class="number">05</span>-<span class="number">01</span> <span class="number">00</span>:<span class="number">51</span>:<span class="number">40.869</span>  <span class="number">2169</span>  <span class="number">2169</span> W ViewRootImpl[xxxMainActivity]: Dropping event due to no window focus: KeyEvent &#123; action=ACTION_DOWN, keyCode=KEYCODE_BACK, scanCode=<span class="number">0</span>, metaState=<span class="number">0</span>, flags=<span class="number">0x8</span>, repeatCount=<span class="number">0</span>, eventTime=<span class="number">38812125</span>, downTime=<span class="number">38812125</span>, deviceId=-<span class="number">1</span>, source=<span class="number">0x101</span>, displayId=<span class="number">0</span> &#125;, hasFocus:<span class="literal">true</span>, mStopped:<span class="literal">true</span>, mPausedForTransition:<span class="literal">false</span></span><br><span class="line"><span class="number">05</span>-<span class="number">01</span> <span class="number">00</span>:<span class="number">51</span>:<span class="number">40.869</span>  <span class="number">2169</span>  <span class="number">2169</span> W ViewRootImpl[xxxMainActivity]: Cancelling event due to no window focus: KeyEvent &#123; action=ACTION_UP, keyCode=KEYCODE_BACK, scanCode=<span class="number">0</span>, metaState=<span class="number">0</span>, flags=<span class="number">0x28</span>, repeatCount=<span class="number">0</span>, eventTime=<span class="number">38847249</span>, downTime=<span class="number">38812125</span>, deviceId=-<span class="number">1</span>, source=<span class="number">0x101</span>, displayId=<span class="number">0</span> &#125;, hasFocus:<span class="literal">true</span>, mStopped:<span class="literal">true</span>, mPausedForTransition:<span class="literal">false</span></span><br><span class="line"></span><br><span class="line"><span class="comment">// You can see here that weather2 was stuck for 36391.9ms, which is the time from 00:51:04.471 (KEYCODE_BACK sent) to 00:51:40.869 (current time)</span></span><br><span class="line"><span class="number">05</span>-<span class="number">01</span> <span class="number">00</span>:<span class="number">51</span>:<span class="number">40.869</span>  <span class="number">1449</span>  <span class="number">1620</span> I InputDispatcher: Window <span class="string">&#x27;1b36ae8 com.xxx.weather2/com.xxx.weather.xxxMainActivity (server)&#x27;</span> spent <span class="number">36391.</span>9ms processing the last input event: KeyEvent</span><br><span class="line"><span class="number">05</span>-<span class="number">01</span> <span class="number">00</span>:<span class="number">51</span>:<span class="number">40.869</span>  <span class="number">2169</span>  <span class="number">2169</span> V ViewRootImpl[xxxMainActivity]: Sending input event to IME: KeyEvent &#123; action=ACTION_UP, keyCode=KEYCODE_BACK, scanCode=<span class="number">0</span>, metaState=<span class="number">0</span>, flags=<span class="number">0x28</span>, repeatCount=<span class="number">0</span>, eventTime=<span class="number">38847249</span>, downTime=<span class="number">38812125</span>, deviceId=-<span class="number">1</span>, source=<span class="number">0x101</span>, displayId=<span class="number">0</span> &#125;</span><br><span class="line"><span class="number">05</span>-<span class="number">01</span> <span class="number">00</span>:<span class="number">51</span>:<span class="number">40.870</span>  <span class="number">2169</span>  <span class="number">2169</span> I Choreographer: Skipped <span class="number">2212</span> frames!  The application may be doing too much work on its main thread.</span><br></pre></td></tr></table></figure><h2 id="ANR-Case-Broadcast-Timeout-causing-ANR"><a href="#ANR-Case-Broadcast-Timeout-causing-ANR" class="headerlink" title="ANR Case: Broadcast Timeout causing ANR"></a>ANR Case: Broadcast Timeout causing ANR</h2><p>Logs for this case are missing, but specifically, the user was performing a migration. The <code>BroadcastReceiver</code>‘s <code>onReceive</code> started a thread to handle it, and eventually reported a <code>BroadcastReceiver</code> ANR.</p><figure class="highlight java"><table><tr><td class="gutter"><pre><span class="line">1</span><br><span class="line">2</span><br></pre></td><td class="code"><pre><span class="line"><span class="number">04</span>-<span class="number">0717</span>:<span class="number">03</span>:<span class="number">17.174435</span> <span class="number">1448</span> 1476V WindowManager: Lookingforfocus: Window&#123;efa2a4f u0 正在升级数据库，数据量较大，请耐心等待&#125;, flags=<span class="number">25296898</span>, canReceive=true1</span><br><span class="line"><span class="number">04</span>-<span class="number">0717</span>:<span class="number">03</span>:<span class="number">17.174459</span> <span class="number">1448</span> 1476V WindowManager: findFocusedWindow: Foundnewfocus @ Window&#123;efa2a4f u0 正在升级数据库，数据量较大，请耐心等待&#125;<span class="number">2</span></span><br></pre></td></tr></table></figure><p>Analysis is as follows:</p><ol><li>The reason for the calendar background broadcast ANR is that <code>onReceive</code> execution timed out. Previously, it wasn’t obvious because the time-consuming operation in <code>onReceive</code> used <code>new Thread</code>, so it was thought that doing time-consuming operations in a sub-thread would not affect the execution of subsequent broadcasts.</li><li>Later it was found that <code>PendingResult result = goAsync();</code> was called in <code>onReceive</code>. This statement allows time-consuming operations to be performed in a sub-thread during the execution of an ordered broadcast receiver, without affecting the receiver’s lifecycle. This method is very simple, returning <code>mPendingResult</code> and setting it to null.</li><li>If we call this method in <code>onReceive</code>, it means the broadcast processing flow is interrupted. When <code>onReceive</code> finishes execution, since <code>mPendingResult</code> is null, <code>AMS.finishReceiver</code> will not be called immediately. And because <code>goAsync</code> returns a <code>PendingResult</code>, we can call <code>PendingResult.finish</code> at any time and on any thread to callback AMS. This is equivalent to turning a synchronous callback into an asynchronous callback. During this asynchronous callback process, we can start a new thread to perform some time-consuming IO operations, etc. Simply put, <code>goAsync</code> provides a mechanism that allows us to process broadcast messages in an asynchronous thread to prevent the main thread from being blocked.</li><li>In this case, although a thread was used to handle the time-consuming task in <code>onReceive</code>, since <code>goAsync</code> was called, the timeout is still calculated. If it is not completed within the specified time, even if it is in a sub-thread, it will trigger an ANR for the <code>BroadcastReceiver</code>.</li></ol><p>You can look at the official comments for the <code>goAsync</code> method:</p><figure class="highlight java"><table><tr><td class="gutter"><pre><span class="line">1</span><br><span class="line">2</span><br><span class="line">3</span><br><span class="line">4</span><br><span class="line">5</span><br><span class="line">6</span><br><span class="line">7</span><br><span class="line">8</span><br><span class="line">9</span><br><span class="line">10</span><br><span class="line">11</span><br><span class="line">12</span><br><span class="line">13</span><br><span class="line">14</span><br><span class="line">15</span><br><span class="line">16</span><br><span class="line">17</span><br><span class="line">18</span><br><span class="line">19</span><br><span class="line">20</span><br><span class="line">21</span><br><span class="line">22</span><br><span class="line">23</span><br><span class="line">24</span><br><span class="line">25</span><br><span class="line">26</span><br><span class="line">27</span><br><span class="line">28</span><br><span class="line">29</span><br><span class="line">30</span><br><span class="line">31</span><br><span class="line">32</span><br><span class="line">33</span><br><span class="line">34</span><br><span class="line">35</span><br><span class="line">36</span><br><span class="line">37</span><br><span class="line">38</span><br><span class="line">39</span><br><span class="line">40</span><br><span class="line">41</span><br></pre></td><td class="code"><pre><span class="line"><span class="comment">/**</span></span><br><span class="line"><span class="comment"> * This can be called by an application in &#123;<span class="doctag">@link</span> #onReceive&#125; to allow</span></span><br><span class="line"><span class="comment"> * it to keep the broadcast active after returning from that function.</span></span><br><span class="line"><span class="comment"> * This does &lt;em&gt;not&lt;/em&gt; change the expectation of being relatively</span></span><br><span class="line"><span class="comment"> * responsive to the broadcast, but does allow</span></span><br><span class="line"><span class="comment"> * the implementation to move work related to it over to another thread</span></span><br><span class="line"><span class="comment"> * to avoid glitching the main UI thread due to disk IO.</span></span><br><span class="line"><span class="comment"> *</span></span><br><span class="line"><span class="comment"> * &lt;p&gt;As a general rule, broadcast receivers are allowed to run for up to 10 seconds</span></span><br><span class="line"><span class="comment"> * before they system will consider them non-responsive and ANR the app.  Since these usually</span></span><br><span class="line"><span class="comment"> * execute on the app&#x27;s main thread, they are already bound by the ~5 second time limit</span></span><br><span class="line"><span class="comment"> * of various operations that can happen there (not to mention just avoiding UI jank), so</span></span><br><span class="line"><span class="comment"> * the receive limit is generally not of concern.  However, once you use &#123;<span class="doctag">@code</span> goAsync&#125;, though</span></span><br><span class="line"><span class="comment"> * able to be off the main thread, the broadcast execution limit still applies, and that</span></span><br><span class="line"><span class="comment"> * includes the time spent between calling this method and ultimately</span></span><br><span class="line"><span class="comment"> * &#123;<span class="doctag">@link</span> PendingResult#finish() PendingResult.finish()&#125;.&lt;/p&gt;</span></span><br><span class="line"><span class="comment"> *</span></span><br><span class="line"><span class="comment"> * &lt;p&gt;If you are taking advantage of this method to have more time to execute, it is useful</span></span><br><span class="line"><span class="comment"> * to know that the available time can be longer in certain situations.  In particular, if</span></span><br><span class="line"><span class="comment"> * the broadcast you are receiving is not a foreground broadcast (that is, the sender has not</span></span><br><span class="line"><span class="comment"> * used &#123;<span class="doctag">@link</span> Intent#FLAG_RECEIVER_FOREGROUND&#125;), then more time is allowed for the receivers</span></span><br><span class="line"><span class="comment"> * to run, allowing them to execute for 30 seconds or even a bit more.  This is something that</span></span><br><span class="line"><span class="comment"> * receivers should rarely take advantage of (long work should be punted to another system</span></span><br><span class="line"><span class="comment"> * facility such as &#123;<span class="doctag">@link</span> android.app.job.JobScheduler&#125;, &#123;<span class="doctag">@link</span> android.app.Service&#125;, or</span></span><br><span class="line"><span class="comment"> * see especially &#123;<span class="doctag">@link</span> android.support.v4.app.JobIntentService&#125;), but can be useful in</span></span><br><span class="line"><span class="comment"> * certain rare cases where it is necessary to do some work as soon as the broadcast is</span></span><br><span class="line"><span class="comment"> * delivered.  Keep in mind that the work you do here will block further broadcasts until</span></span><br><span class="line"><span class="comment"> * it completes, so taking advantage of this at all excessively can be counter-productive</span></span><br><span class="line"><span class="comment"> * and cause later events to be received more slowly.&lt;/p&gt;</span></span><br><span class="line"><span class="comment"> *</span></span><br><span class="line"><span class="comment"> * <span class="doctag">@return</span> Returns a &#123;<span class="doctag">@link</span> PendingResult&#125; representing the result of</span></span><br><span class="line"><span class="comment"> * the active broadcast.  The BroadcastRecord itself is no longer active;</span></span><br><span class="line"><span class="comment"> * all data and other interaction must go through &#123;<span class="doctag">@link</span> PendingResult&#125;</span></span><br><span class="line"><span class="comment"> * APIs.  The &#123;<span class="doctag">@link</span> PendingResult#finish PendingResult.finish()&#125; method</span></span><br><span class="line"><span class="comment"> * must be called once processing of the broadcast is done.</span></span><br><span class="line"><span class="comment"> */</span></span><br><span class="line"><span class="keyword">public</span> <span class="keyword">final</span> PendingResult <span class="title function_">goAsync</span><span class="params">()</span>&#123;</span><br><span class="line">    <span class="type">PendingResult</span> <span class="variable">res</span> <span class="operator">=</span> mPendingResult;</span><br><span class="line">    mPendingResult =<span class="literal">null</span>;</span><br><span class="line">    <span class="keyword">return</span> res;</span><br><span class="line">&#125;</span><br></pre></td></tr></table></figure><p>Its usage is as follows:</p><figure class="highlight java"><table><tr><td class="gutter"><pre><span class="line">1</span><br><span class="line">2</span><br><span class="line">3</span><br><span class="line">4</span><br><span class="line">5</span><br><span class="line">6</span><br><span class="line">7</span><br><span class="line">8</span><br><span class="line">9</span><br><span class="line">10</span><br><span class="line">11</span><br><span class="line">12</span><br></pre></td><td class="code"><pre><span class="line"><span class="meta">@Override</span></span><br><span class="line"><span class="keyword">public</span> <span class="keyword">void</span> <span class="title function_">onReceive</span><span class="params">(<span class="keyword">final</span> Context context, <span class="keyword">final</span> Intent intent)</span>&#123;</span><br><span class="line">    <span class="keyword">final</span> <span class="type">PendingResult</span> <span class="variable">result</span> <span class="operator">=</span> goAsync();</span><br><span class="line">    <span class="type">Runnable</span> <span class="variable">worker</span> <span class="operator">=</span> <span class="keyword">new</span> <span class="title class_">Runnable</span>() &#123;</span><br><span class="line">       <span class="meta">@Override</span></span><br><span class="line">       <span class="keyword">public</span> <span class="keyword">void</span> <span class="title function_">run</span><span class="params">()</span>&#123;</span><br><span class="line">            onReceiveAsync(context, intent);</span><br><span class="line">            result.finish();</span><br><span class="line">        &#125;</span><br><span class="line">    &#125;;</span><br><span class="line">    mAsyncHandler.post(worker);</span><br><span class="line">&#125;</span><br></pre></td></tr></table></figure><h2 id="ANR-Case-Launcher-Input-ANR"><a href="#ANR-Case-Launcher-Input-ANR" class="headerlink" title="ANR Case: Launcher - Input ANR"></a>ANR Case: Launcher - Input ANR</h2><p>Search <code>am_anr</code> to find the time point when ANR occurred.</p><ol><li>It belongs to input dispatch anr.</li><li>It belongs to application processing input event timeout (instead of no focus window).</li></ol><figure class="highlight arduino"><table><tr><td class="gutter"><pre><span class="line">1</span><br></pre></td><td class="code"><pre><span class="line"><span class="number">19</span>:<span class="number">44</span>:<span class="number">56.815</span>  <span class="number">2515</span> <span class="number">25056</span> I am_anr  : [<span class="number">0</span>,<span class="number">3365</span>,com.xxx.launcher,<span class="number">819478085</span>,<span class="function">Input dispatching timed <span class="title">out</span> <span class="params">(Waiting to send key event because the focused window has <span class="keyword">not</span> finished processing all of the input events that were previously delivered to it.  Outbound queue length: <span class="number">0.</span>  Wait queue length: <span class="number">9.</span>)</span>]</span></span><br></pre></td></tr></table></figure><p>Search <code>ANR in</code> to find CPU usage.</p><ol><li>From <code>Load : 0.02 / 0.01 / 0.0</code>, the overall load of the device is not high, so it is likely an ANR caused by logic.</li><li>The CPU usage of <code>logd</code> and <code>SurfaceFlinger</code> is slightly high, which can be regarded as suspicious objects for focused observation.</li></ol><figure class="highlight arduino"><table><tr><td class="gutter"><pre><span class="line">1</span><br><span class="line">2</span><br><span class="line">3</span><br><span class="line">4</span><br><span class="line">5</span><br><span class="line">6</span><br><span class="line">7</span><br><span class="line">8</span><br><span class="line">9</span><br><span class="line">10</span><br><span class="line">11</span><br><span class="line">12</span><br></pre></td><td class="code"><pre><span class="line"><span class="number">1</span><span class="number">-0119</span>:<span class="number">45</span>:<span class="number">07.753</span> <span class="number">251525056</span>E ActivityManager: ANR in com.xxx.<span class="built_in">launcher</span> (com.xxx.launcher/.Launcher)</span><br><span class="line"> <span class="number">19</span>:<span class="number">45</span>:<span class="number">07.753</span> <span class="number">251525056</span>E ActivityManager: PID:<span class="number">3365</span></span><br><span class="line"> <span class="number">19</span>:<span class="number">45</span>:<span class="number">07.753</span> <span class="number">251525056</span>E ActivityManager: Reason: <span class="function">Input dispatching timed <span class="title">out</span> <span class="params">(Waiting to send key event because the focused window hasnotfinished processing all of the input events that were previously delivered to it.  Outbound queue length:<span class="number">0.</span>  Wait queue length:<span class="number">9.</span>)</span></span></span><br><span class="line"><span class="function"> 19:<span class="number">45</span>:<span class="number">07.753</span> <span class="number">251525056</span>E ActivityManager: Parent: com.xxx.launcher/.Launcher</span></span><br><span class="line"><span class="function"> <span class="number">19</span>:<span class="number">45</span>:<span class="number">07.753</span> <span class="number">251525056</span>E ActivityManager: Load:<span class="number">0.02</span>/<span class="number">0.01</span>/<span class="number">0.0</span></span></span><br><span class="line"><span class="function"> <span class="number">19</span>:<span class="number">45</span>:<span class="number">07.753</span> <span class="number">251525056</span>E ActivityManager: CPU usage from0ms to10936ms later (<span class="number">2020</span>- <span class="number">19</span>:<span class="number">44</span>:<span class="number">56.751</span>to2020- <span class="number">19</span>:<span class="number">45</span>:<span class="number">07.688</span>):</span></span><br><span class="line"><span class="function"> <span class="number">19</span>:<span class="number">45</span>:<span class="number">07.753</span> <span class="number">251525056</span>E ActivityManager:   <span class="number">97</span>%<span class="number">546</span>/logd:<span class="number">97</span>% user +<span class="number">0.2</span>% kernel / faults:<span class="number">12</span>minor</span></span><br><span class="line"><span class="function"> <span class="number">19</span>:<span class="number">45</span>:<span class="number">07.753</span> <span class="number">251525056</span>E ActivityManager:   <span class="number">25</span>%<span class="number">956</span>/surfaceflinger:<span class="number">11</span>% user +<span class="number">13</span>% kernel / faults:<span class="number">151</span>minor17major</span></span><br><span class="line"><span class="function"> <span class="number">19</span>:<span class="number">45</span>:<span class="number">07.753</span> <span class="number">251525056</span>E ActivityManager:   <span class="number">1.4</span>%<span class="number">1664</span>/media.codec:<span class="number">0.9</span>% user +<span class="number">0.5</span>% kernel / faults:<span class="number">28729</span>minor4major</span></span><br><span class="line"><span class="function"> <span class="number">19</span>:<span class="number">45</span>:<span class="number">07.753</span> <span class="number">251525056</span>E ActivityManager:   <span class="number">7.5</span>%<span class="number">2515</span>/system_server:<span class="number">2.9</span>% user +<span class="number">4.6</span>% kernel / faults:<span class="number">1818</span>minor8major</span></span><br><span class="line"><span class="function"> <span class="number">19</span>:<span class="number">45</span>:<span class="number">07.753</span> <span class="number">251525056</span>E ActivityManager:   <span class="number">3.2</span>%<span class="number">3365</span>/com.xxx.launcher:<span class="number">2.1</span>% user +<span class="number">1</span>% kernel / faults:<span class="number">3535</span>minor29major</span></span><br><span class="line"><span class="function"> <span class="number">19</span>:<span class="number">45</span>:<span class="number">07.753</span> <span class="number">251525056</span>E ActivityManager:   <span class="number">2</span>%<span class="number">3620</span>/com.xxx.persist.system:<span class="number">1.2</span>% user +<span class="number">0.7</span>% kernel / faults:<span class="number">870</span>minor</span></span><br></pre></td></tr></table></figure><p>Analyze <code>trace.txt</code> to see if there is any useful information. First look at the Launcher’s main thread stack.</p><figure class="highlight c++"><table><tr><td class="gutter"><pre><span class="line">1</span><br><span class="line">2</span><br><span class="line">3</span><br><span class="line">4</span><br><span class="line">5</span><br><span class="line">6</span><br><span class="line">7</span><br><span class="line">8</span><br><span class="line">9</span><br><span class="line">10</span><br><span class="line">11</span><br><span class="line">12</span><br><span class="line">13</span><br><span class="line">14</span><br><span class="line">15</span><br><span class="line">16</span><br><span class="line">17</span><br><span class="line">18</span><br><span class="line">19</span><br><span class="line">20</span><br><span class="line">21</span><br><span class="line">22</span><br><span class="line">23</span><br><span class="line">24</span><br><span class="line">25</span><br><span class="line">26</span><br><span class="line">27</span><br><span class="line">28</span><br><span class="line">29</span><br><span class="line">30</span><br><span class="line">31</span><br></pre></td><td class="code"><pre><span class="line"><span class="string">&quot;main&quot;</span>prio=<span class="number">5</span>tid=<span class="number">1</span>Native</span><br><span class="line">  | group=<span class="string">&quot;main&quot;</span>sCount=<span class="number">1</span>dsCount=<span class="number">0f</span>lags=<span class="number">1</span>obj=<span class="number">0x72a50cd0</span>self=<span class="number">0x6f7ae10800</span></span><br><span class="line">  | sysTid=<span class="number">3365</span>nice=<span class="number">-10</span>cgrp=defaultsched=<span class="number">0</span>/<span class="number">0</span>handle=<span class="number">0x700123bed8</span></span><br><span class="line">  | state=S schedstat=(<span class="number">37451337214473599138010494263</span>) utm=<span class="number">26967</span>stm=<span class="number">10484</span>core=<span class="number">0</span>HZ=<span class="number">100</span></span><br><span class="line">  |stack=<span class="number">0x7fc0270000</span><span class="number">-0x7fc0272000</span>stackSize=<span class="number">8192</span>KB</span><br><span class="line">  | held mutexes=</span><br><span class="line">  kernel: (couldn<span class="number">&#x27;</span>t read /proc/self/task/<span class="number">3365</span>/stack)</span><br><span class="line">  native: #<span class="number">00</span>pc0000000000071a8c  /apex/com.android.runtime/lib64/bionic/libc.<span class="built_in">so</span> (syscall+<span class="number">28</span>)</span><br><span class="line">  native: #<span class="number">01</span>pc0000000000075710  /apex/com.android.runtime/lib64/bionic/libc.<span class="built_in">so</span> (__futex_wait_ex(voidvolatile*,<span class="type">bool</span>,<span class="type">int</span>,<span class="type">bool</span>, timespecconst*)+<span class="number">140</span>)</span><br><span class="line">  native: #<span class="number">02</span>pc00000000000d9744  /apex/com.android.runtime/lib64/bionic/libc.<span class="built_in">so</span> (pthread_cond_wait+<span class="number">60</span>)</span><br><span class="line">  native: #<span class="number">03</span>pc00000000002bf5e8  /system/lib64/libhwui.<span class="built_in">so</span> (android::uirenderer::renderthread::DrawFrameTask::<span class="built_in">postAndWait</span>()+<span class="number">168</span>)</span><br><span class="line">  native: #<span class="number">04</span>pc00000000002bf510  /system/lib64/libhwui.<span class="built_in">so</span> (android::uirenderer::renderthread::DrawFrameTask::<span class="built_in">drawFrame</span>()+<span class="number">44</span>)<span class="number">12</span></span><br><span class="line">  at android.graphics.HardwareRenderer.<span class="built_in">nSyncAndDrawFrame</span>(Native method)</span><br><span class="line">  at android.graphics.HardwareRenderer.<span class="built_in">syncAndDrawFrame</span>(HardwareRenderer.java:<span class="number">422</span>)</span><br><span class="line">  at android.view.ThreadedRenderer.<span class="built_in">draw</span>(ThreadedRenderer.java:<span class="number">671</span>)</span><br><span class="line">  at android.view.ViewRootImpl.<span class="built_in">draw</span>(ViewRootImpl.java:<span class="number">3983</span>)</span><br><span class="line">  - locked &lt;<span class="number">0x030694da</span>&gt; (a java.lang.Object)</span><br><span class="line">  at android.view.ViewRootImpl.<span class="built_in">performDraw</span>(ViewRootImpl.java:<span class="number">3782</span>)</span><br><span class="line">  at android.view.ViewRootImpl.<span class="built_in">performTraversals</span>(ViewRootImpl.java:<span class="number">3085</span>)</span><br><span class="line">  at android.view.ViewRootImpl.<span class="built_in">doTraversal</span>(ViewRootImpl.java:<span class="number">1994</span>)</span><br><span class="line">  at android.view.ViewRootImpl$TraversalRunnable.<span class="built_in">run</span>(ViewRootImpl.java:<span class="number">8201</span>)</span><br><span class="line">  at android.view.Choreographer$CallbackRecord.<span class="built_in">run</span>(Choreographer.java:<span class="number">1085</span>)</span><br><span class="line">  at android.view.Choreographer.<span class="built_in">doCallbacks</span>(Choreographer.java:<span class="number">908</span>)</span><br><span class="line">  at android.view.Choreographer.<span class="built_in">doFrame</span>(Choreographer.java:<span class="number">835</span>)</span><br><span class="line">  at android.view.Choreographer$FrameHandler.<span class="built_in">handleMessage</span>(Choreographer.java:<span class="number">1013</span>)</span><br><span class="line">  at android.os.Handler.<span class="built_in">dispatchMessage</span>(Handler.java:<span class="number">107</span>)</span><br><span class="line">  at android.os.Looper.<span class="built_in">loop</span>(Looper.java:<span class="number">238</span>)</span><br><span class="line">  at android.app.ActivityThread.<span class="built_in">main</span>(ActivityThread.java:<span class="number">7798</span>)</span><br><span class="line">  at java.lang.reflect.Method.<span class="built_in">invoke</span>(Native method)</span><br><span class="line">  at com.android.internal.os.RuntimeInit$MethodAndArgsCaller.<span class="built_in">run</span>(RuntimeInit.java:<span class="number">492</span>)</span><br><span class="line">  at com.android.internal.os.ZygoteInit.<span class="built_in">main</span>(ZygoteInit.java:<span class="number">995</span>)</span><br></pre></td></tr></table></figure><p>It can be seen that the main thread is blocked waiting for RenderThread to return, so continue to check the RenderThread stack.</p><figure class="highlight c++"><table><tr><td class="gutter"><pre><span class="line">1</span><br><span class="line">2</span><br><span class="line">3</span><br><span class="line">4</span><br><span class="line">5</span><br><span class="line">6</span><br><span class="line">7</span><br><span class="line">8</span><br><span class="line">9</span><br><span class="line">10</span><br><span class="line">11</span><br><span class="line">12</span><br><span class="line">13</span><br><span class="line">14</span><br><span class="line">15</span><br><span class="line">16</span><br><span class="line">17</span><br><span class="line">18</span><br><span class="line">19</span><br><span class="line">20</span><br><span class="line">21</span><br><span class="line">22</span><br><span class="line">23</span><br><span class="line">24</span><br><span class="line">25</span><br><span class="line">26</span><br><span class="line">27</span><br><span class="line">28</span><br><span class="line">29</span><br></pre></td><td class="code"><pre><span class="line"><span class="string">&quot;RenderThread&quot;</span>daemon prio=<span class="number">7</span>tid=<span class="number">25</span>Native</span><br><span class="line">  | group=<span class="string">&quot;main&quot;</span>sCount=<span class="number">1</span>dsCount=<span class="number">0f</span>lags=<span class="number">1</span>obj=<span class="number">0x13100b00</span>self=<span class="number">0x6f0c698c00</span></span><br><span class="line">  | sysTid=<span class="number">3616</span>nice=<span class="number">-10</span>cgrp=defaultsched=<span class="number">0</span>/<span class="number">0</span>handle=<span class="number">0x6f072e0d50</span></span><br><span class="line">  | state=S schedstat=(<span class="number">35808915205059629728352628704</span>) utm=<span class="number">29226</span>stm=<span class="number">6582</span>core=<span class="number">3</span>HZ=<span class="number">100</span></span><br><span class="line">  |stack=<span class="number">0x6f071ea000</span><span class="number">-0x6f071ec000</span>stackSize=<span class="number">991</span>KB</span><br><span class="line">  | held mutexes=</span><br><span class="line">  kernel: (couldn<span class="number">&#x27;</span>t read /proc/self/task/<span class="number">3616</span>/stack)</span><br><span class="line">  native: #<span class="number">00</span>pc00000000000c49f4  /apex/com.android.runtime/lib64/bionic/libc.<span class="built_in">so</span> (__ioctl+<span class="number">4</span>)</span><br><span class="line">  native: #<span class="number">01</span>pc000000000007d518  /apex/com.android.runtime/lib64/bionic/libc.<span class="built_in">so</span> (ioctl+<span class="number">132</span>)</span><br><span class="line">  native: #<span class="number">02</span>pc0000000000059e58  /system/lib64/libbinder.<span class="built_in">so</span> (android::IPCThreadState::<span class="built_in">talkWithDriver</span>(<span class="type">bool</span>)+<span class="number">244</span>)</span><br><span class="line">  native: #<span class="number">03</span>pc000000000005ad94  /system/lib64/libbinder.<span class="built_in">so</span> (android::IPCThreadState::<span class="built_in">waitForResponse</span>(android::Parcel*,<span class="type">int</span>*)+<span class="number">60</span></span><br><span class="line">  native: #<span class="number">04</span>pc000000000005ab38  /system/lib64/libbinder.<span class="built_in">so</span> (android::IPCThreadState::<span class="built_in">transact</span>(<span class="type">int</span>,unsignedint, android::Parcelconst&amp;, android::Parcel*,unsignedint)+<span class="number">180</span>)</span><br><span class="line">  native: #<span class="number">05</span>pc000000000004f000  /system/lib64/libbinder.<span class="built_in">so</span> (android::BpBinder::<span class="built_in">transact</span>(unsignedint, android::Parcelconst&amp;, android::Parcel*,unsignedint)+<span class="number">228</span>)</span><br><span class="line">  native: #<span class="number">06</span>pc000000000007fef8  /system/lib64/libgui.<span class="built_in">so</span> (android::BpGraphicBufferProducer::<span class="built_in">dequeueBuffer</span>(<span class="type">int</span>*, android::sp&lt;android::Fence&gt;*,unsignedint,unsignedint,<span class="type">int</span>,unsignedlong,unsignedlong*, android::FrameEventHistoryDelta*)+<span class="number">224</span>)</span><br><span class="line">  native: #<span class="number">07</span>pc00000000000b9880  /system/lib64/libgui.<span class="built_in">so</span> (android::Surface::<span class="built_in">dequeueBuffer</span>(ANativeWindowBuffer**,<span class="type">int</span>*)+<span class="number">392</span>)</span><br><span class="line">  native: #<span class="number">08</span>pc0000000000380540  /system/lib64/libhwui.<span class="built_in">so</span> (android::uirenderer::renderthread::ReliableSurface::<span class="built_in">hook_dequeueBuffer</span>(ANativeWindow*, ANativeWindowBuffer**,<span class="type">int</span>*)+<span class="number">104</span>)</span><br><span class="line">  native: #<span class="number">09</span>pc000000000000989c  /vendor/lib64/egl/eglSubDriverAndroid.<span class="built_in">so</span> (???)</span><br><span class="line">  native: #<span class="number">10</span>pc0000000000009388  /vendor/lib64/egl/eglSubDriverAndroid.<span class="built_in">so</span> (???)</span><br><span class="line">  native: #<span class="number">11</span>pc000000000022cd2c  /vendor/lib64/egl/libGLESv2_adreno.<span class="built_in">so</span> (???)</span><br><span class="line">  native: #<span class="number">12</span>pc0000000000212b8c  /vendor/lib64/egl/libGLESv2_adreno.<span class="built_in">so</span> (???)</span><br><span class="line">  native: #<span class="number">13</span>pc0000000000020838  /system/lib64/libEGL.<span class="built_in">so</span> (android::<span class="built_in">eglQuerySurfaceImpl</span>(<span class="type">void</span>*,<span class="type">void</span>*,<span class="type">int</span>,<span class="type">int</span>*)+<span class="number">248</span>)</span><br><span class="line">  native: #<span class="number">14</span>pc00000000002c6794  /system/lib64/libhwui.<span class="built_in">so</span> (android::uirenderer::renderthread::EglManager::<span class="built_in">beginFrame</span>(<span class="type">void</span>*)+<span class="number">224</span>)</span><br><span class="line">  native: #<span class="number">15</span>pc00000000002d414c  /system/lib64/libhwui.<span class="built_in">so</span> (android::uirenderer::renderthread::CanvasContext::<span class="built_in">draw</span>()+<span class="number">236</span>)</span><br><span class="line">  native: #<span class="number">16</span>pc00000000002d34e8  /system/lib64/libhwui.<span class="built_in">so</span> (_ZNSt3__110__function6__funcIZN7android10uirenderer12renderthread13DrawFrameTask11postAndWaitEvE3$_0NS_9allocatorIS6_EEFvvEEclEv$c303f2d2360db58ed70a2d0ac7ed911b+<span class="number">380</span>)</span><br><span class="line">  native: #<span class="number">17</span>pc00000000002de044  /system/lib64/libhwui.<span class="built_in">so</span> (android::uirenderer::WorkQueue::<span class="built_in">process</span>()+<span class="number">228</span>)</span><br><span class="line">  native: #<span class="number">18</span>pc00000000002ddd24  /system/lib64/libhwui.<span class="built_in">so</span> (android::uirenderer::renderthread::RenderThread::<span class="built_in">threadLoop</span>()+<span class="number">576</span>)</span><br><span class="line">  native: #<span class="number">19</span>pc0000000000013654  /system/lib64/libutils.<span class="built_in">so</span> (android::Thread::_threadLoop(<span class="type">void</span>*)+<span class="number">328</span>)</span><br><span class="line">  native: #<span class="number">20</span>pc00000000000da200  /apex/com.android.runtime/lib64/bionic/libc.<span class="built_in">so</span> (__pthread_start(<span class="type">void</span>*)+<span class="number">36</span>)</span><br><span class="line">  native: #<span class="number">21</span>pc00000000000769d4  /apex/com.android.runtime/lib64/bionic/libc.<span class="built_in">so</span> (__start_thread+<span class="number">64</span>)</span><br></pre></td></tr></table></figure><p>It can be seen that RenderThread is stuck on binder communication, calling the method <code>dequeueBuffer</code>, waiting for the <code>dequeueBuffer</code> return result. Normally, the main thread does not wait for <code>dequeueBuffer</code>; it continues to execute after <code>nSyncAndDrawFrame</code> returns. It is stuck here because it is waiting for the previous draw task of RenderThread to complete, that is, the previous draw task is stuck in <code>dequeueBuffer</code>, causing the main thread of this frame to be stuck and timeout.</p><p>If you are familiar with the frame rendering process, you should know that the peer of <code>dequeueBuffer</code> is <code>SurfaceFlinger</code>. At this time, you need to check whether <code>SurfaceFlinger</code> has any problems (here if there is binder info, you can directly see which thread RenderThread is communicating with in SurfaceFlinger. Binder info can see the details of binder communication, for example, we should be able to see this case (since the binder info is not dumped, the following is just an example).</p><figure class="highlight arduino"><table><tr><td class="gutter"><pre><span class="line">1</span><br><span class="line">2</span><br><span class="line">3</span><br><span class="line">4</span><br><span class="line">5</span><br><span class="line">6</span><br><span class="line">7</span><br></pre></td><td class="code"><pre><span class="line"><span class="comment">// 956 is SurfaceFlinger, here is the incoming binder information of SurfaceFlinger</span></span><br><span class="line">proc956：</span><br><span class="line">incoming transaction28350131:<span class="number">0000000000000000f</span>rom3365:<span class="number">3616</span>to956:<span class="number">1357</span>code2flags10pri0:<span class="number">110</span>r1 node28346208size112:<span class="number">0</span>data0000000000000000</span><br><span class="line"></span><br><span class="line"><span class="comment">// 3365 is Launcher, 3365:3616 =&gt; 956:1356 means from Launcher (3365) rendering thread (3616) to SurfaceFlinger (956) Binder: 956_4 (1357)</span></span><br><span class="line">proc3365：</span><br><span class="line">outgoing transaction28350131:<span class="number">0000000000000000f</span>rom3365:<span class="number">3616</span>to956:<span class="number">1357</span>code2flags10pri0:<span class="number">110</span>r1</span><br></pre></td></tr></table></figure><p>Here we search for <code>dequeueBuffer</code> to see which Binder thread in <code>SurfaceFlinger</code> that <code>RenderThread</code> is communicating with, and found that it is Binder:956_4.</p><p>Corresponding <code>sysTid=1357</code></p><figure class="highlight arduino"><table><tr><td class="gutter"><pre><span class="line">1</span><br><span class="line">2</span><br><span class="line">3</span><br><span class="line">4</span><br><span class="line">5</span><br><span class="line">6</span><br><span class="line">7</span><br><span class="line">8</span><br><span class="line">9</span><br><span class="line">10</span><br><span class="line">11</span><br><span class="line">12</span><br><span class="line">13</span><br><span class="line">14</span><br><span class="line">15</span><br><span class="line">16</span><br></pre></td><td class="code"><pre><span class="line"><span class="string">&quot;Binder:956_4&quot;</span>sysTid=<span class="number">1357</span></span><br><span class="line">    #<span class="number">00</span>pc0000000000071a8c  /apex/com.android.runtime/lib64/bionic/libc.<span class="built_in">so</span> (syscall+<span class="number">28</span>) (BuildId:<span class="number">340</span>eb42dd36c6541aec54c306eb4d0ee)</span><br><span class="line">    #<span class="number">01</span>pc0000000000075710  /apex/com.android.runtime/lib64/bionic/libc.<span class="built_in">so</span> (__futex_wait_ex(voidvolatile*,<span class="type">bool</span>,<span class="type">int</span>,<span class="type">bool</span>, timespecconst*)+<span class="number">140</span>) (BuildId:<span class="number">340</span>eb42dd36c6541aec54c306eb4d0ee)</span><br><span class="line">    #<span class="number">02</span>pc00000000000d97e8  /apex/com.android.runtime/lib64/bionic/libc.<span class="built_in">so</span> (pthread_cond_timedwait+<span class="number">120</span>) (BuildId:<span class="number">340</span>eb42dd36c6541aec54c306eb4d0ee)</span><br><span class="line">    #<span class="number">03</span>pc0000000000072df0  /system/lib64/libc++.<span class="built_in">so</span> (_ZNSt3__118condition_variable15__do_timed_waitERNS_11unique_lockINS_5mutexEEENS_6chrono10time_pointINS5_12system_clockENS5_8durationIxNS_5ratioILl1ELl1000000000EEEEEEE+<span class="number">108</span>) (BuildId:<span class="number">5</span>aad1075509f6e517eb78db32da8fbf6)</span><br><span class="line">    #<span class="number">04</span>pc000000000006f9d8  /system/lib64/libgui.<span class="built_in">so</span> (android::BufferQueueProducer::<span class="built_in">waitForFreeSlotThenRelock</span>(android::BufferQueueProducer::FreeSlotCaller, std::__1::unique_lock&lt;std::__1::mutex&gt;&amp;,<span class="type">int</span>*)<span class="type">const</span>+<span class="number">788</span>) (BuildId: e017958f19275814d1f2d55ce8b10bfa)</span><br><span class="line">    #<span class="number">05</span>pc000000000006fd8c  /system/lib64/libgui.<span class="built_in">so</span> (android::BufferQueueProducer::<span class="built_in">dequeueBuffer</span>(<span class="type">int</span>*, android::sp&lt;android::Fence&gt;*,unsignedint,unsignedint,<span class="type">int</span>,unsignedlong,unsignedlong*, android::FrameEventHistoryDelta*)+<span class="number">776</span>) (BuildId: e017958f19275814d1f2d55ce8b10bfa)</span><br><span class="line">    #<span class="number">06</span>pc000000000007f0a8  /system/lib64/libgui.<span class="built_in">so</span> (android::BnGraphicBufferProducer::<span class="built_in">onTransact</span>(unsignedint, android::Parcelconst&amp;, android::Parcel*,unsignedint)+<span class="number">3580</span>) (BuildId: e017958f19275814d1f2d55ce8b10bfa)</span><br><span class="line">    #<span class="number">07</span>pc000000000004d67c  /system/lib64/libbinder.<span class="built_in">so</span> (android::BBinder::<span class="built_in">transact</span>(unsignedint, android::Parcelconst&amp;, android::Parcel*,unsignedint)+<span class="number">136</span>) (BuildId: bb7ca5d12323a310f26473506cf070ed)</span><br><span class="line">    #<span class="number">08</span>pc000000000005a55c  /system/lib64/libbinder.<span class="built_in">so</span> (android::IPCThreadState::<span class="built_in">executeCommand</span>(<span class="type">int</span>)+<span class="number">1008</span>) (BuildId: bb7ca5d12323a310f26473506cf070ed)</span><br><span class="line">    #<span class="number">09</span>pc000000000005a0b8  /system/lib64/libbinder.<span class="built_in">so</span> (android::IPCThreadState::<span class="built_in">getAndExecuteCommand</span>()+<span class="number">156</span>) (BuildId: bb7ca5d12323a310f26473506cf070ed)</span><br><span class="line">    #<span class="number">10</span>pc000000000005a898  /system/lib64/libbinder.<span class="built_in">so</span> (android::IPCThreadState::<span class="built_in">joinThreadPool</span>(<span class="type">bool</span>)+<span class="number">220</span>) (BuildId: bb7ca5d12323a310f26473506cf070ed)</span><br><span class="line">    #<span class="number">11</span>pc000000000008093c  /system/lib64/libbinder.<span class="built_in">so</span> (android::PoolThread::<span class="built_in">threadLoop</span>()+<span class="number">24</span>) (BuildId: bb7ca5d12323a310f26473506cf070ed)</span><br><span class="line">    #<span class="number">12</span>pc0000000000013654  /system/lib64/libutils.<span class="built_in">so</span> (android::Thread::_threadLoop(<span class="type">void</span>*)+<span class="number">328</span>) (BuildId:<span class="number">594f</span>10db565bb0b9cf0223c7a1990ce5)</span><br><span class="line">    #<span class="number">13</span>pc00000000000da200  /apex/com.android.runtime/lib64/bionic/libc.<span class="built_in">so</span> (__pthread_start(<span class="type">void</span>*)+<span class="number">36</span>) (BuildId:<span class="number">340</span>eb42dd36c6541aec54c306eb4d0ee)</span><br><span class="line">    #<span class="number">14</span>pc00000000000769d4  /apex/com.android.runtime/lib64/bionic/libc.<span class="built_in">so</span> (__start_thread+<span class="number">64</span>) (BuildId:<span class="number">340</span>eb42dd36c6541aec54c306eb4d0ee)</span><br></pre></td></tr></table></figure><p>It can be seen that it is stuck in <code>waitForFreeSlotThenRelock</code>, and its code logic is in <code>frameworks/native/libs/gui/BufferQueueProducer.cpp</code>. Those interested can check it out themselves.</p><p>Being stuck in <code>waitForFreeSlotThenRelock</code> means that there are not enough Buffers, because the number of Buffers corresponding to each Layer is fixed (2 or 3 or 4, generally 3 or 4). If all 4 Buffers are in use, then the application calls <code>dequeueBuffer</code> to apply for a free Buffer will not be successful, and it needs to wait. Here, wait for free buffer times out, resulting in the application’s ANR.</p><p>The SurfaceFlinger and hwui parts of the Log also frequently print prompts for problem points.</p><figure class="highlight arduino"><table><tr><td class="gutter"><pre><span class="line">1</span><br><span class="line">2</span><br><span class="line">3</span><br><span class="line">4</span><br><span class="line">5</span><br><span class="line">6</span><br><span class="line">7</span><br><span class="line">8</span><br><span class="line">9</span><br><span class="line">10</span><br><span class="line">11</span><br><span class="line">12</span><br><span class="line">13</span><br><span class="line">14</span><br><span class="line">15</span><br><span class="line">16</span><br><span class="line">17</span><br><span class="line">18</span><br><span class="line">19</span><br><span class="line">20</span><br><span class="line">21</span><br></pre></td><td class="code"><pre><span class="line"><span class="comment">// SurfaceFlinger Log prompts that the number of available buffers is insufficient</span></span><br><span class="line">  <span class="number">19</span>:<span class="number">44</span>:<span class="number">42.371</span>   <span class="number">956</span>   <span class="number">956</span> E BufferQueueConsumer: [com.xxx.launcher/com.xxx.launcher.Launcher#<span class="number">0</span>] acquireBuffer: max acquired buffer count reached: <span class="number">2</span> (max <span class="number">1</span>)</span><br><span class="line">  <span class="number">19</span>:<span class="number">44</span>:<span class="number">42.371</span>   <span class="number">956</span>   <span class="number">956</span> E BufferLayerConsumer: [com.xxx.launcher/com.xxx.launcher.Launcher#<span class="number">0</span>] updateTexImage: acquire failed: <span class="function">Function <span class="keyword">not</span> <span class="title">implemented</span> <span class="params">(<span class="number">-38</span>)</span></span></span><br><span class="line"><span class="function"></span></span><br><span class="line"><span class="function"><span class="comment">// Prompt is dequeueBuffer failed</span></span></span><br><span class="line"><span class="function">  19:<span class="number">45</span>:<span class="number">45.127</span>  <span class="number">3365</span>  <span class="number">3616</span> W OpenGLRenderer: dequeueBuffer failed, error =</span> <span class="number">-110</span>; switching to fallback</span><br><span class="line"></span><br><span class="line">  <span class="number">19</span>:<span class="number">45</span>:<span class="number">45.138</span>  <span class="number">3365</span>  <span class="number">3616</span> I OpenGLRenderer: Davey! duration=<span class="number">4015</span>ms; Flags=<span class="number">0</span>, IntendedVsync=<span class="number">21148991192817</span>, Vsync=<span class="number">21148991192817</span>, OldestInputEvent=<span class="number">9223372036854775807</span>, NewestInputEvent=<span class="number">0</span>, HandleInputStart=<span class="number">21148991206202</span>, AnimationStart=<span class="number">21148991249587</span>, PerformTraversalsStart=<span class="number">21148991252765</span>, DrawStart=<span class="number">21148991798858</span>, SyncQueued=<span class="number">21148991974796</span>, SyncStart=<span class="number">21152137782451</span>, IssueDrawCommandsStart=<span class="number">21152138724534</span>, SwapBuffers=<span class="number">21156150646824</span>, FrameCompleted=<span class="number">21156152280366</span>, DequeueBufferDuration=<span class="number">0</span>, QueueBufferDuration=<span class="number">0</span>,</span><br><span class="line"></span><br><span class="line"><span class="comment">// MessageQueue information identifies which Message blocks</span></span><br><span class="line">  <span class="number">19</span>:<span class="number">45</span>:<span class="number">45.142</span>  <span class="number">3365</span>  <span class="number">3365</span> E ANR_LOG : &gt;&gt;&gt; msg<span class="number">&#x27;</span>s executing time is too <span class="type">long</span></span><br><span class="line">  <span class="number">19</span>:<span class="number">45</span>:<span class="number">45.142</span>  <span class="number">3365</span>  <span class="number">3365</span> E ANR_LOG : Blocked msg = &#123; when=<span class="number">-4</span>s2ms what=<span class="number">0</span> target=android.view.Choreographer$FrameHandler callback=android.view.Choreographer$FrameDisplayEventReceiver &#125; , cost  = <span class="number">4002</span> ms</span><br><span class="line">  <span class="number">19</span>:<span class="number">45</span>:<span class="number">45.142</span>  <span class="number">3365</span>  <span class="number">3365</span> E ANR_LOG : &gt;&gt;&gt;Current msg List is:</span><br><span class="line">  <span class="number">19</span>:<span class="number">45</span>:<span class="number">45.142</span>  <span class="number">3365</span>  <span class="number">3365</span> E ANR_LOG : Current msg &lt;<span class="number">1</span>&gt;  = &#123; when=<span class="number">-4</span>s5ms what=<span class="number">13</span> target=android.view.ViewRootImpl$ViewRootHandler &#125;</span><br><span class="line">  <span class="number">19</span>:<span class="number">45</span>:<span class="number">45.142</span>  <span class="number">3365</span>  <span class="number">3365</span> E ANR_LOG : Current msg &lt;<span class="number">2</span>&gt;  = &#123; when=<span class="number">-4</span>s1ms what=<span class="number">0</span> target=android.view.ViewRootImpl$ViewRootHandler callback=com.android.launcher3.util.ViewOnDrawExecutor &#125;</span><br><span class="line">  <span class="number">19</span>:<span class="number">45</span>:<span class="number">45.143</span>  <span class="number">3365</span>  <span class="number">3365</span> E ANR_LOG : Current msg &lt;<span class="number">3</span>&gt;  = &#123; when=<span class="number">-4</span>s1ms what=<span class="number">0</span> target=android.view.ViewRootImpl$ViewRootHandler callback=android.widget.Editor$<span class="number">1</span> &#125;</span><br><span class="line">  <span class="number">19</span>:<span class="number">45</span>:<span class="number">45.143</span>  <span class="number">3365</span>  <span class="number">3365</span> E ANR_LOG : Current msg &lt;<span class="number">4</span>&gt;  = &#123; when=<span class="number">-3</span>s23ms what=<span class="number">0</span> target=android.view.ViewRootImpl$ViewRootHandler callback=android.widget.ViewFlipper$<span class="number">2</span> &#125;</span><br><span class="line">  <span class="number">19</span>:<span class="number">45</span>:<span class="number">45.143</span>  <span class="number">3365</span>  <span class="number">3365</span> E ANR_LOG : Current msg &lt;<span class="number">5</span>&gt;  = &#123; when=<span class="number">-1</span>s502ms what=<span class="number">6</span> target=android.view.inputmethod.InputMethodManager$H arg1=<span class="number">74627</span> obj=android.view.inputmethod.InputMethodManager$PendingEvent@<span class="number">561b</span>ec9 &#125;</span><br><span class="line">  <span class="number">19</span>:<span class="number">45</span>:<span class="number">45.143</span>  <span class="number">3365</span>  <span class="number">3365</span> E ANR_LOG : Current msg &lt;<span class="number">6</span>&gt;  = &#123; when=+<span class="number">14</span>s859ms what=<span class="number">0</span> target=android.os.Handler callback=xxxUIEngineProguard.i.b$b &#125;</span><br><span class="line">  <span class="number">19</span>:<span class="number">45</span>:<span class="number">45.143</span>  <span class="number">3365</span>  <span class="number">3365</span> E ANR_LOG : Current msg &lt;<span class="number">7</span>&gt;  = &#123; when=+<span class="number">24</span>d20h30m18s414ms what=<span class="number">0</span> target=android.view.ViewRootImpl$ViewRootHandler callback=android.widget.ViewFlipper$<span class="number">2</span> &#125;</span><br><span class="line">  <span class="number">19</span>:<span class="number">45</span>:<span class="number">45.143</span>  <span class="number">3365</span>  <span class="number">3365</span> E ANR_LOG : &gt;&gt;&gt;CURRENT MSG DUMP OVER&lt;&lt;&lt;</span><br></pre></td></tr></table></figure><p>This kind of problem is generally a SurfaceFlinger problem, which can be transferred to the corresponding person in charge for further analysis.</p><h1 id="Anomalous-Log-Examples"><a href="#Anomalous-Log-Examples" class="headerlink" title="Anomalous Log Examples"></a>Anomalous Log Examples</h1><h2 id="Main-Thread-Database-Operation"><a href="#Main-Thread-Database-Operation" class="headerlink" title="Main Thread Database Operation"></a>Main Thread Database Operation</h2><figure class="highlight c#"><table><tr><td class="gutter"><pre><span class="line">1</span><br><span class="line">2</span><br><span class="line">3</span><br><span class="line">4</span><br><span class="line">5</span><br><span class="line">6</span><br><span class="line">7</span><br><span class="line">8</span><br><span class="line">9</span><br><span class="line">10</span><br><span class="line">11</span><br><span class="line">12</span><br><span class="line">13</span><br><span class="line">14</span><br><span class="line">15</span><br><span class="line">16</span><br><span class="line">17</span><br><span class="line">18</span><br><span class="line">19</span><br><span class="line">20</span><br><span class="line">21</span><br><span class="line">22</span><br><span class="line">23</span><br><span class="line">24</span><br><span class="line">25</span><br><span class="line">26</span><br><span class="line">27</span><br><span class="line">28</span><br><span class="line">29</span><br><span class="line">30</span><br></pre></td><td class="code"><pre><span class="line"><span class="string">&quot;main&quot;</span> prio=<span class="number">5</span> tid=<span class="number">1</span> Native</span><br><span class="line">held mutexes=</span><br><span class="line">kernel: (couldn<span class="string">&#x27;t read /proc/self/task/11003/stack)</span></span><br><span class="line"><span class="string">native: #00 pc 000492a4 /system/lib/libc.so (nanosleep+12)</span></span><br><span class="line"><span class="string">native: #01 pc 0002dc21 /system/lib/libc.so (usleep+52)</span></span><br><span class="line"><span class="string">native: #02 pc 00009cab /system/lib/libsqlite.so (???)</span></span><br><span class="line"><span class="string">native: #03 pc 00011119 /system/lib/libsqlite.so (???)</span></span><br><span class="line"><span class="string">native: #04 pc 00016455 /system/lib/libsqlite.so (???)</span></span><br><span class="line"><span class="string">native: #16 pc 0000fa29 /system/lib/libsqlite.so (???)</span></span><br><span class="line"><span class="string">native: #17 pc 0000fad7 /system/lib/libsqlite.so (sqlite3_prepare16_v2+14)</span></span><br><span class="line"><span class="string">native: #18 pc 0007f671 /system/lib/libandroid_runtime.so (???)</span></span><br><span class="line"><span class="string">native: #19 pc 002b4721 /system/framework/arm/boot-framework.oat (Java_android_database_sqlite_SQLiteConnection_nativePrepareStatement__JLjava_lang_String_2+116)</span></span><br><span class="line"><span class="string">at android.database.sqlite.SQLiteConnection.setWalModeFromConfiguration(SQLiteConnection.java:294)</span></span><br><span class="line"><span class="string">at android.database.sqlite.SQLiteConnection.open(SQLiteConnection.java:215)</span></span><br><span class="line"><span class="string">at android.database.sqlite.SQLiteConnection.open(SQLiteConnection.java:193)</span></span><br><span class="line"><span class="string">at android.database.sqlite.SQLiteConnectionPool.openConnectionLocked(SQLiteConnectionPool.java:463)</span></span><br><span class="line"><span class="string">at android.database.sqlite.SQLiteConnectionPool.open(SQLiteConnectionPool.java:185)</span></span><br><span class="line"><span class="string">at android.database.sqlite.SQLiteConnectionPool.open(SQLiteConnectionPool.java:177)</span></span><br><span class="line"><span class="string">at android.database.sqlite.SQLiteDatabase.openInner(SQLiteDatabase.java:808)</span></span><br><span class="line"><span class="string">locked &lt;0x0db193bf&gt; (a java.lang.Object)</span></span><br><span class="line"><span class="string">at android.database.sqlite.SQLiteDatabase.open(SQLiteDatabase.java:793)</span></span><br><span class="line"><span class="string">at android.database.sqlite.SQLiteDatabase.openDatabase(SQLiteDatabase.java:696)</span></span><br><span class="line"><span class="string">at android.app.ContextImpl.openOrCreateDatabase(ContextImpl.java:690)</span></span><br><span class="line"><span class="string">at android.content.ContextWrapper.openOrCreateDatabase(ContextWrapper.java:299)</span></span><br><span class="line"><span class="string">at android.database.sqlite.SQLiteOpenHelper.getDatabaseLocked(SQLiteOpenHelper.java:223)</span></span><br><span class="line"><span class="string">at android.database.sqlite.SQLiteOpenHelper.getWritableDatabase(SQLiteOpenHelper.java:163)</span></span><br><span class="line"><span class="string">locked &lt;0x045a4a8c&gt; (a com.xxxx.video.common.data.DataBaseHelper)</span></span><br><span class="line"><span class="string">at com.xxxx.video.common.data.DataBaseORM.&lt;init&gt;(DataBaseORM.java:46)</span></span><br><span class="line"><span class="string">at com.xxxx.video.common.data.DataBaseORM.getInstance(DataBaseORM.java:53)</span></span><br><span class="line"><span class="string">locked &lt;0x017095d5&gt; (a java.lang.Class&lt;com.xxxx.video.common.data.DataBaseORM&gt;)</span></span><br></pre></td></tr></table></figure><h2 id="Large-Binder-Payloads"><a href="#Large-Binder-Payloads" class="headerlink" title="Large Binder Payloads"></a>Large Binder Payloads</h2><figure class="highlight arduino"><table><tr><td class="gutter"><pre><span class="line">1</span><br><span class="line">2</span><br><span class="line">3</span><br><span class="line">4</span><br><span class="line">5</span><br></pre></td><td class="code"><pre><span class="line"><span class="number">07</span><span class="number">-2104</span>:<span class="number">43</span>:<span class="number">21.573</span> <span class="number">1000</span> <span class="number">148812756</span>E Binder  : Unreasonably large binder replybuffer: on android.content.pm.BaseParceledListSlice$<span class="number">1</span>@<span class="number">770</span><span class="function">c74f <span class="title">calling1size388568</span><span class="params">(data:<span class="number">1</span>,<span class="number">32</span>,<span class="number">7274595</span>)</span></span></span><br><span class="line"><span class="function">07-2104:<span class="number">43</span>:<span class="number">21.573</span> <span class="number">1000</span> <span class="number">148812756</span>E Binder  : android.util.Log$TerribleFailure: Unreasonably large binder replybuffer: on android.content.pm.BaseParceledListSlice$<span class="number">1</span>@<span class="number">770</span>c74f calling1size388568(data:<span class="number">1</span>,<span class="number">32</span>,<span class="number">7274595</span>)</span></span><br><span class="line"><span class="function"><span class="number">07</span><span class="number">-2104</span>:<span class="number">43</span>:<span class="number">21.607</span> <span class="number">1000</span> <span class="number">1488</span> <span class="number">2951</span>E Binder  : Unreasonably large binder replybuffer: on android.content.pm.BaseParceledListSlice$<span class="number">1</span>@<span class="number">770</span>c74f calling1size211848(data:<span class="number">1</span>,<span class="number">23</span>,<span class="number">7274595</span>)</span></span><br><span class="line"><span class="function"><span class="number">07</span><span class="number">-2104</span>:<span class="number">43</span>:<span class="number">21.607</span> <span class="number">1000</span> <span class="number">1488</span> <span class="number">2951</span>E Binder  : android.util.Log$TerribleFailure: Unreasonably large binder replybuffer: on android.content.pm.BaseParceledListSlice$<span class="number">1</span>@<span class="number">770</span>c74f calling1size211848(data:<span class="number">1</span>,<span class="number">23</span>,<span class="number">7274595</span>)</span></span><br><span class="line"><span class="function"><span class="number">07</span><span class="number">-2104</span>:<span class="number">43</span>:<span class="number">21.662</span> <span class="number">1000</span> <span class="number">1488</span> <span class="number">6258</span>E Binder  : Unreasonably large binder replybuffer: on android.content.pm.BaseParceledListSlice$<span class="number">1</span>@<span class="number">770</span>c74f calling1size259300(data:<span class="number">1</span>,<span class="number">33</span>,<span class="number">7274595</span>)</span></span><br></pre></td></tr></table></figure><h2 id="Binder-Communication-Failure"><a href="#Binder-Communication-Failure" class="headerlink" title="Binder Communication Failure"></a>Binder Communication Failure</h2><figure class="highlight arduino"><table><tr><td class="gutter"><pre><span class="line">1</span><br><span class="line">2</span><br><span class="line">3</span><br><span class="line">4</span><br></pre></td><td class="code"><pre><span class="line"><span class="number">07</span><span class="number">-2106</span>:<span class="number">04</span>:<span class="number">35.580</span>&lt;<span class="number">6</span>&gt;[<span class="number">32837.690321</span>] binder:<span class="number">1698</span>:<span class="number">2362</span>transaction failed29189/<span class="number">-3</span>,size100<span class="number">-0l</span>ine3042</span><br><span class="line"><span class="number">07</span><span class="number">-2106</span>:<span class="number">04</span>:<span class="number">35.594</span>&lt;<span class="number">6</span>&gt;[<span class="number">32837.704042</span>] binder:<span class="number">1765</span>:<span class="number">4071</span>transaction failed29189/<span class="number">-3</span>,size76<span class="number">-0l</span>ine3042</span><br><span class="line"><span class="number">07</span><span class="number">-2106</span>:<span class="number">04</span>:<span class="number">35.899</span>&lt;<span class="number">6</span>&gt;[<span class="number">32838.009132</span>] binder:<span class="number">1765</span>:<span class="number">4067</span>transaction failed29189/<span class="number">-3</span>,size224<span class="number">-8l</span>ine3042</span><br><span class="line"><span class="number">07</span><span class="number">-2106</span>:<span class="number">04</span>:<span class="number">36.018</span>&lt;<span class="number">6</span>&gt;[<span class="number">32838.128903</span>] binder:<span class="number">1765</span>:<span class="number">2397</span>transaction failed29189/<span class="number">-22</span>,size348<span class="number">-0l</span>ine2916</span><br></pre></td></tr></table></figure><h1 id="ANR-Related-Information-Sharing"><a href="#ANR-Related-Information-Sharing" class="headerlink" title="ANR Related Information Sharing"></a>ANR Related Information Sharing</h1><ol><li><a href="https://mp.weixin.qq.com/s?__biz=MzI1MzYzMjE0MQ==&mid=2247487203&idx=1&sn=182584b69910c843ae95f60e74127249&chksm=e9d0c501dea74c178e16f95a2ffc5007c5dbca89a02d56895ed9b05883cf0562da689ac6146b&token=2044639920&lang=zh_CN&scene=21#wechat_redirect">Xigua Video Stability Governance System Construction 1: Tailor Principle and Practice</a></li><li><a href="https://mp.weixin.qq.com/s/RF3m9_v5bYTYbwY-d1RloQ">Xigua Video Stability Governance System Construction 2: Raphael Principle and Practice</a></li><li><a href="https://mp.weixin.qq.com/s?__biz=MzI1MzYzMjE0MQ==&mid=2247489902&idx=1&sn=bfdf9f48dc6dc973722b5dcab9cd5882&chksm=e9d0d28cdea75b9ad255eb5de227240d2e6f0e9d66e562d3f49cf69f8ed4127c9954ef21bb6d&scene=178&cur_album_id=1833937688379310087#rd">Xigua Video Stability Governance System Construction 3: Sliver Principle and Practice</a></li><li><a href="https://mp.weixin.qq.com/s?__biz=MzI1MzYzMjE0MQ==&mid=2247489949&idx=1&sn=01948c047c0ce203956a3cf81dd20e83&chksm=e9d0d27fdea75b697e70a665b4c6912a8081649700766cf007a7b75d420a57089fe06d2e85b0&scene=178&cur_album_id=1833937688379310087#rd">Xigua Freeze &amp; ANR Optimization Governance and Monitoring System Construction</a></li><li><a href="https://mp.weixin.qq.com/s?__biz=MzI1MzYzMjE0MQ==&mid=2247488116&idx=1&sn=fdf80fa52c57a3360ad1999da2a9656b&chksm=e9d0d996dea750807aadc62d7ed442948ad197607afb9409dd5a296b16fb3d5243f9224b5763&scene=178&cur_album_id=1780091311874686979#rd">Toutiao ANR Optimization Practice Series - Design Principle and Influencing Factors</a></li><li><a href="https://mp.weixin.qq.com/s?__biz=MzI1MzYzMjE0MQ==&mid=2247488182&idx=1&sn=6337f1b51d487057b162064c3e24c439&chksm=e9d0d954dea75042193ed09f30eb8ba0acd93870227c5d33b33361b739a03562afb685df9215&scene=178&cur_album_id=1780091311874686979#rd">Toutiao ANR Optimization Practice Series - Monitoring Tools and Analysis Ideas</a></li><li><a href="https://mp.weixin.qq.com/s?__biz=MzI1MzYzMjE0MQ==&mid=2247488243&idx=1&sn=1f948e0ef616c6dfe54513a2a94357be&chksm=e9d0d911dea75007f36b3701b51842b9fa40969fe8175c2cb4aecf96793504602c574945d636&scene=178&cur_album_id=1780091311874686979#rd">Toutiao ANR Optimization Practice Series - Example Analysis Collection</a></li><li><a href="https://mp.weixin.qq.com/s?__biz=MzI1MzYzMjE0MQ==&mid=2247488314&idx=1&sn=559e52288ae2730a580fcd550f22d895&chksm=e9d0d8d8dea751ceecb715d472796f0c678a9358abf91eb279cdb0576329595e87531e221438&scene=178&cur_album_id=1780091311874686979#rd">Toutiao ANR Optimization Practice Series - Barrier Causes Main Thread Deadlock</a></li><li><a href="https://mp.weixin.qq.com/s?__biz=MzI1MzYzMjE0MQ==&mid=2247488558&idx=1&sn=27dda3c3630116d37ab56a8c7bdf1382&chksm=e9d0dfccdea756daed46b340fb8021b57ea8cc300e58bdb59f0305f8290704984308a089bf2d&scene=178&cur_album_id=1780091311874686979#rd">Toutiao ANR Optimization Practice Series - Goodbye, SharedPreference Waiting</a></li><li><a href="https://mp.weixin.qq.com/s/40T6ITvJNWR8F42530k4DA">Android ANR | Principle Analysis and Common Cases</a></li></ol><h1 id="Reference"><a href="#Reference" class="headerlink" title="Reference"></a>Reference</h1><ol><li><a href="https://duanqz.github.io/2015-10-12-ANR-Analysis#1-%E6%A6%82%E8%A7%88">https://duanqz.github.io/2015-10-12-ANR-Analysis#1-%E6%A6%82%E8%A7%88</a></li><li><a href="https://duanqz.github.io/2015-10-12-ANR-Analysis">https://duanqz.github.io/2015-10-12-ANR-Analysis</a></li><li><a href="http://gityuan.com/2016/12/02/app-not-response/">http://gityuan.com/2016/12/02/app-not-response/</a></li><li><a href="http://gityuan.com/2017/01/01/input-anr/">http://gityuan.com/2017/01/01/input-anr/</a></li><li><a href="https://xiaozhuanlan.com/topic/5097486132">https://xiaozhuanlan.com/topic/5097486132</a></li></ol><h1 id="About-Me-amp-amp-Blog"><a href="#About-Me-amp-amp-Blog" class="headerlink" title="About Me &amp;&amp; Blog"></a>About Me &amp;&amp; Blog</h1><p>Below is a personal introduction and related links. I look forward to communicating with you all!</p><ol><li><a href="https://www.androidperformance.com/about/">Blogger Personal Introduction</a>: Contains personal WeChat and WeChat group links.</li><li><a href="https://androidperformance.com/2019/12/01/BlogMap/">Blog Content Navigation</a>: A navigation of personal blog content.</li><li><a href="https://androidperformance.com/2018/05/07/Android-performance-optimization-skills-and-tools/">Excellent Blog Articles Collected and Organized by Individuals - Must-Know for Android Performance Optimization</a>: Welcome everyone to recommend yourself and recommend (WeChat private chat is fine)</li><li><a href="https://www.androidperformance.com/2023/12/30/the-performance/">Android Performance Optimization Knowledge Planet</a>: Welcome to join, thanks for support~</li></ol><blockquote><p><strong>One person can go faster, a group of people can go further</strong></p></blockquote>]]></content>
    
    
    <summary type="html">&lt;p&gt;This is the third article in the Android App ANR series, focusing on real-world ANR cases. The series includes:&lt;/p&gt;
&lt;ol&gt;
&lt;li&gt;&lt;a href=&quot;https://www.androidperformance.com/en/2025/02/08/Android-ANR-01-ANR-Design/&quot;&gt;Android App ANR Series 1: Understanding Android ANR Design Philosophy&lt;/a&gt;&lt;/li&gt;
&lt;li&gt;&lt;a href=&quot;https://www.androidperformance.com/en/2025/02/08/Android-ANR-02-How-to-analysis-ANR/&quot;&gt;Android App ANR Series 2: ANR Analysis Workflow and Key Logs&lt;/a&gt;&lt;/li&gt;
&lt;li&gt;&lt;a href=&quot;https://www.androidperformance.com/en/2025/02/08/Android-ANR-03-ANR-Case-Share/&quot;&gt;Android App ANR Series 3: ANR Case Studies&lt;/a&gt;&lt;/li&gt;
&lt;/ol&gt;</summary>


    <category term="Java" scheme="https://androidperformance.com/en/categories/Java/"/>
    
    
    <category term="Android" scheme="https://androidperformance.com/en/tags/Android/"/>
    
    <category term="Startup" scheme="https://androidperformance.com/en/tags/Startup/"/>
    
    <category term="Memory" scheme="https://androidperformance.com/en/tags/Memory/"/>
    
    <category term="ANR" scheme="https://androidperformance.com/en/tags/ANR/"/>
    
    <category term="RenderThread" scheme="https://androidperformance.com/en/tags/RenderThread/"/>
    
  </entry>
  
  <entry>
    <title>Android ANR Series 2: ANR Analysis Methodology and Key Logs</title>
    <link href="https://androidperformance.com/en/2025/02/08/Android-ANR-02-How-to-analysis-ANR/"/>
    <id>https://androidperformance.com/en/2025/02/08/Android-ANR-02-How-to-analysis-ANR/</id>
    <published>2025-02-08T08:29:09.000Z</published>
    <updated>2026-05-10T23:29:51.053Z</updated>
    
    <content type="html"><![CDATA[<p>This is the second article in the Android App ANR series, focusing on ANR analysis methodology and key logs. The series includes:</p><ol><li><a href="https://www.androidperformance.com/en/2025/02/08/Android-ANR-01-ANR-Design/">Android App ANR Series 1: Understanding Android ANR Design Philosophy</a></li><li><a href="https://www.androidperformance.com/en/2025/02/08/Android-ANR-02-How-to-analysis-ANR/">Android App ANR Series 2: ANR Analysis Methodology and Key Logs</a></li><li><a href="https://www.androidperformance.com/en/2025/02/08/Android-ANR-03-ANR-Case-Share/">Android App ANR Series 3: ANR Case Studies</a></li></ol><span id="more"></span><blockquote><p>ANR (Application Not Responding) - a simple definition that encompasses much of Android’s system design philosophy.</p><p>First, ANR falls within the application domain. This differs from SNR (System Not Responding), which reflects issues where the system process (<code>system_server</code>) loses responsiveness, while ANR explicitly confines the problem to applications. SNR is ensured by the Watchdog mechanism (details can be found in Watchdog mechanism and problem analysis); ANR is ensured by the message handling mechanism. Android implements a sophisticated mechanism at the system layer to detect ANR, with the core principle being message scheduling and timeout handling.</p><p>Second, the ANR mechanism is primarily implemented at the system layer. All ANR-related messages are scheduled by the system process (<code>system_server</code>) and then dispatched to application processes for actual processing. Simultaneously, the system process designs different timeout limits to track message processing. Once an application mishandles a message, the timeout limit takes effect: it collects system states such as CPU&#x2F;IO usage, process function call stacks, and reports to the user that a process is not responding (ANR dialog; some ROMs don’t display the ANR dialog but directly crash to the home screen).</p><p>Third, ANR issues are essentially performance problems. The ANR mechanism actually imposes restrictions on the application’s main thread, requiring it to complete the most common operations (starting services, processing broadcasts, handling input) within specified time limits. If processing times out, the main thread is considered to have lost the ability to respond to other operations. Time-consuming operations on the main thread, such as intensive CPU computations, heavy I&#x2F;O, complex UI layouts, etc., all reduce the application’s responsiveness.</p><p>Finally, some ANR problems are very difficult to analyze. Sometimes due to underlying system influences, message scheduling fails, and the problematic scenario is hard to reproduce. Such ANR issues often require significant time to understand system behaviors, going beyond the scope of the ANR mechanism itself. Some ANR problems are hard to investigate because there are many factors causing system instability, such as memory fragmentation caused by Linux Kernel bugs, hardware damage, etc. Such low-level causes often leave ANR problems untraceable, and these aren’t application issues at all, wasting much time for application developers. If you’ve worked on entire system development and maintenance, you’ll deeply understand this. Therefore, I cannot guarantee that understanding all content in this chapter will solve every ANR problem. If you encounter very difficult ANR issues, I suggest talking to friends working on Framework, drivers, and kernel, or if the problem is just a one-in-a-hundred-thousand phenomenon that doesn’t affect normal program operation, I’d suggest ignoring it.</p><p>– From <a href="https://duanqz.github.io/2015-10-12-ANR-Analysis">duanqz</a></p></blockquote><h1 id="ANR-Analysis-Methodology"><a href="#ANR-Analysis-Methodology" class="headerlink" title="ANR Analysis Methodology"></a>ANR Analysis Methodology</h1><p>Start by ordering the current evidence sources. For field issues, first check Android Vitals or your monitoring platform to identify whether the ANR is Input dispatch, Service, Broadcast, JobScheduler, or another type, and to understand affected devices and versions. For local reproduction or test devices, collect a bugreport, EventLog, main&#x2F;system logs, and <code>/data/anr/anr_*</code>. On Android 11 (API 30)+, use <code>ApplicationExitInfo</code> to inspect historical exits and ANR information. If system load, Binder, lock waits, I&#x2F;O, RenderThread, or SurfaceFlinger are suspected, capture Perfetto&#x2F;System Trace for the same time window. The EventLog, MainLog, and trace-reading methods below still apply, but they are now part of a larger evidence set rather than the only entry point.</p><p>ANR problems mainly stem from two causes: <strong>application-side issues</strong> and <strong>system-side anomalies</strong>. When analyzing ANR problems, the most important task is to determine which cause is responsible (though there are some gray areas, such as poorly written code that doesn’t manifest under normal conditions but quickly surfaces when the system has problems).</p><h2 id="General-ANR-Analysis-Steps"><a href="#General-ANR-Analysis-Steps" class="headerlink" title="General ANR Analysis Steps:"></a>General ANR Analysis Steps:</h2><ol><li>Check EventLog for specific ANR time (search for <code>am_anr</code>) to see if it matches the ANR log, determining whether the ANR log is valid. If the ANR log is valid, analyze it to extract useful information: pid, tid, deadlocks, etc. When facing ANR problems, we need to question whether the trace before us is the original crime scene. If there is a lot of information output when ANR occurs, and CPU and I&#x2F;O resources were tight at that time, the log output timestamp might be delayed by 10 to 20 seconds. So we sometimes need to be vigilant. However, normally, the <code>am_anr</code> output time in EventLog is the earliest and closest to the actual ANR time.</li><li>Check MainLog (Android Log) or SystemLog for ANR details (search for “ANR in”), extracting effective information:<ol><li>Time when ANR occurred</li><li>Process that printed the ANR log</li><li>Process where ANR occurred</li><li>Reason for ANR</li><li>CPU load</li><li>Memory load</li><li>CPU usage statistics time period</li><li>CPU usage rate of each process<ol><li>Total CPU usage rate</li><li>Page fault counts<ol><li>xxx minor indicates page faults in cache, which can be understood as the process performing memory access</li><li>xxx major indicates page faults in memory, which can be understood as the process performing I&#x2F;O operations</li></ol></li></ol></li><li>CPU usage summary</li></ol></li><li>Combine MainLog (Android Log) and EventLog to extract all useful information within the CPU start and end time points into a file:<ol><li>Collect key operations, such as unlock, app installation, screen on&#x2F;off, app launch, etc.</li><li>Collect exceptions and system key logs:<ol><li>System slowdown: such as Slow operation, Slow dispatch, Slow delivery, <code>dvm_lock_sample</code></li><li>Process changes: <code>am_kill</code>, <code>am_proc_died</code>, <code>lowmemorykiller</code>, ANR, app launch relationships, etc.</li><li>System information: cpu info, meminfo, binder info (whether full), iowait (whether too high)</li></ol></li><li>Collect all key thread running conditions and thread priorities of the ANR process</li><li>Based on the key information file extracted in step 4, further understand the system’s situation and state at that time (recommend using vscode or notepad++ with global search for clues), such as:<ol><li>Was it in low memory frequently killing processes?</li><li>First unlock after reboot with system busy?</li><li>Multiple app launches in short time causing system busy?</li><li>Or application’s own logic waiting?</li></ol></li></ol></li><li>If still unclear, add logs to reproduce.</li></ol><h2 id="Distinguishing-Between-Application-Problems-and-System-Problems"><a href="#Distinguishing-Between-Application-Problems-and-System-Problems" class="headerlink" title="Distinguishing Between Application Problems and System Problems"></a>Distinguishing Between Application Problems and System Problems</h2><h3 id="First-Analyze-Whether-It’s-an-Application-Problem"><a href="#First-Analyze-Whether-It’s-an-Application-Problem" class="headerlink" title="First, Analyze Whether It’s an Application Problem"></a>First, Analyze Whether It’s an Application Problem</h3><p>The key to analyzing application problems is to understand what the user was doing at that time and what role the application played during this user operation, then proceed with further analysis:</p><ol><li>Analyze whether there are time-consuming operations in key component lifecycles that might not be exposed normally but surface when system load increases (suggest adding corresponding logs in key lifecycle functions for easier debugging).</li><li>Analyze whether extreme situations occurred causing application logic to be time-consuming, such as large amounts of data processing or import, too many threads running simultaneously, etc. (check application’s CPU &#x2F; IO usage).</li><li>Analyze whether deadlocks exist.</li><li>Analyze whether waiting for binder return.</li><li>Analyze whether MainThread and RenderThread have abnormalities in Trace files.</li><li>Analyze whether MainThread and WorkerThread have waiting relationships in Trace files.</li></ol><h3 id="Analyze-System-State"><a href="#Analyze-System-State" class="headerlink" title="Analyze System State"></a>Analyze System State</h3><ol><li>Check CPU usage (CPU usage rate and CPU load), see if system-related processes or threads like SystemServer, <code>lowmemorykiller</code>, <code>HeapTaskDeamon</code>, Audio, SurfaceFlinger occupy high resources.</li><li>Check whether significant IO situations exist, check IO load:<ol><li>faults: 118172 minor (page faults in cache).</li><li>major (page faults in memory).</li></ol></li><li>Check whether system is in low memory:<ol><li>Check <code>dumpsys meminfo</code> results to see if in low memory.</li><li>Check kernel log for frequent <code>lowmemorykiller</code>.</li><li>Check event log for frequent applications killed by system low memory policy.</li><li>Check <code>kswapd0</code>.</li></ol></li><li>Whether application is frozen: Application in D state, ANR occurs. If the last operation is <code>refriger</code>, then the application was frozen. Normally caused by power optimization; check if there are <code>xxxHansManager : unfreeze</code> logs around; or in Systrace’s Kernel Callstack containing: <code>&#123;kernel callsite when blocked:: &quot;\_\_refrigerator+0xe4/0x198&quot;&#125;</code>.</li><li>Check for system anomalies: For instance, custom features causing system business, failing to respond to application Binder requests in time. This requires analyzing SystemServer logs in the Log to see if there are abnormal log outputs.</li></ol><h2 id="Continue-Analysis-Can-Application-Resolve-It-or-System-Resolve-It"><a href="#Continue-Analysis-Can-Application-Resolve-It-or-System-Resolve-It" class="headerlink" title="Continue Analysis: Can Application Resolve It or System Resolve It?"></a>Continue Analysis: Can Application Resolve It or System Resolve It?</h2><ol><li>If the ANR problem is transferred to the system side, there is a high probability it’s unsolvable by the app.</li><li>If the application code is normal, and there are no extreme usage scenarios or data processing, purely caused by the system or other Apps, then it can be considered a system issue.</li><li>If the application code itself has certain issues, which are not exposed in non-extreme scenarios or non-system anomalies, then the application needs to consider mitigation plans.</li></ol><h1 id="ANR-Log-Content"><a href="#ANR-Log-Content" class="headerlink" title="ANR Log Content"></a>ANR Log Content</h1><p>Logs can be captured via test tools, obtained from online platforms, or captured manually:</p><figure class="highlight bash"><table><tr><td class="gutter"><pre><span class="line">1</span><br></pre></td><td class="code"><pre><span class="line">adb bugreport log.zip</span><br></pre></td></tr></table></figure><p>ANR Trace Log contains the following content:</p><h2 id="Thread-Details"><a href="#Thread-Details" class="headerlink" title="Thread Details"></a>Thread Details</h2><figure class="highlight java"><table><tr><td class="gutter"><pre><span class="line">1</span><br><span class="line">2</span><br><span class="line">3</span><br><span class="line">4</span><br><span class="line">5</span><br><span class="line">6</span><br><span class="line">7</span><br><span class="line">8</span><br><span class="line">9</span><br><span class="line">10</span><br><span class="line">11</span><br><span class="line">12</span><br><span class="line">13</span><br><span class="line">14</span><br><span class="line">15</span><br><span class="line">16</span><br><span class="line">17</span><br></pre></td><td class="code"><pre><span class="line"><span class="string">&quot;main&quot;</span> prio=<span class="number">5</span> tid=<span class="number">1</span> Native</span><br><span class="line">  | group=<span class="string">&quot;main&quot;</span> sCount=<span class="number">1</span> dsCount=<span class="number">0</span> flags=<span class="number">1</span> obj=<span class="number">0x72c8bbf8</span> self=<span class="number">0xb400007b0ec10800</span></span><br><span class="line">  | sysTid=<span class="number">5991</span> nice=-<span class="number">10</span> cgrp=<span class="keyword">default</span> sched=<span class="number">0</span>/<span class="number">0</span> handle=<span class="number">0x7b95f61500</span></span><br><span class="line">  | state=S schedstat=( <span class="number">807053249</span> <span class="number">267562324</span> <span class="number">1494</span> ) utm=<span class="number">63</span> stm=<span class="number">17</span> core=<span class="number">3</span> HZ=<span class="number">100</span></span><br><span class="line">  | stack=<span class="number">0x7fcccd9000</span>-<span class="number">0x7fcccdb000</span> stackSize=8192KB</span><br><span class="line">  | held mutexes=</span><br><span class="line">  <span class="keyword">native</span>: #<span class="number">00</span> pc 00000000000c6418  /apex/com.android.runtime/lib64/bionic/libc.so (__epoll_pwait+<span class="number">8</span>)</span><br><span class="line">  <span class="keyword">native</span>: #<span class="number">01</span> pc 0000000000019a9c  /system/lib64/libutils.so (android::Looper::pollInner(<span class="type">int</span>)+<span class="number">184</span>)</span><br><span class="line">  <span class="keyword">native</span>: #<span class="number">02</span> pc 000000000001997c  /system/lib64/libutils.so (android::Looper::pollOnce(<span class="type">int</span>, <span class="type">int</span>*, <span class="type">int</span>*, <span class="keyword">void</span>**)+<span class="number">112</span>)</span><br><span class="line">  <span class="keyword">native</span>: #<span class="number">03</span> pc <span class="number">0000000000114310</span>  /system/lib64/libandroid_runtime.so (android::android_os_MessageQueue_nativePollOnce(_JNIEnv*, _jobject*, <span class="type">long</span>, <span class="type">int</span>)+<span class="number">44</span>)</span><br><span class="line">  at android.os.MessageQueue.nativePollOnce(Native method)</span><br><span class="line">  at android.os.MessageQueue.next(MessageQueue.java:<span class="number">339</span>)</span><br><span class="line">  at android.os.Looper.loop(Looper.java:<span class="number">198</span>)</span><br><span class="line">  at android.app.ActivityThread.main(ActivityThread.java:<span class="number">8142</span>)</span><br><span class="line">  at java.lang.reflect.Method.invoke(Native method)</span><br><span class="line">  at com.android.internal.os.RuntimeInit$MethodAndArgsCaller.run(RuntimeInit.java:<span class="number">592</span>)</span><br><span class="line">  at com.android.internal.os.ZygoteInit.main(ZygoteInit.java:<span class="number">1006</span>)</span><br></pre></td></tr></table></figure><p>Ideally, the meaning of some fields in the Trace above:</p><p><img src="/en/images/Android-ANR-02-How-to-analysis-ANR/894ce64d-1586-459b-92cd-45f5999bd666.webp"></p><h2 id="Thread-Stack"><a href="#Thread-Stack" class="headerlink" title="Thread Stack"></a><strong>Thread Stack</strong></h2><p>Below is the call stack corresponding to the thread:</p><figure class="highlight java"><table><tr><td class="gutter"><pre><span class="line">1</span><br><span class="line">2</span><br><span class="line">3</span><br><span class="line">4</span><br><span class="line">5</span><br><span class="line">6</span><br><span class="line">7</span><br><span class="line">8</span><br><span class="line">9</span><br><span class="line">10</span><br><span class="line">11</span><br></pre></td><td class="code"><pre><span class="line"><span class="keyword">native</span>: #<span class="number">00</span> pc 00000000000c6418 /apex/com.android.runtime/lib64/bionic/libc.so (__epoll_pwait+<span class="number">8</span>)</span><br><span class="line"><span class="keyword">native</span>: #<span class="number">01</span> pc 0000000000019a9c /system/lib64/libutils.so (android::Looper::pollInner(<span class="type">int</span>)+<span class="number">184</span>)</span><br><span class="line"><span class="keyword">native</span>: #<span class="number">02</span> pc 000000000001997c /system/lib64/libutils.so (android::Looper::pollOnce(<span class="type">int</span>, <span class="type">int</span>*, <span class="type">int</span>*, <span class="keyword">void</span>**)+<span class="number">112</span>)</span><br><span class="line"><span class="keyword">native</span>: #<span class="number">03</span> pc <span class="number">0000000000114310</span> /system/lib64/libandroid_runtime.so (android::android_os_MessageQueue_nativePollOnce(_JNIEnv*, _jobject*, <span class="type">long</span>, <span class="type">int</span>)+<span class="number">44</span>)</span><br><span class="line">at android.os.MessageQueue.nativePollOnce(Native method)</span><br><span class="line">at android.os.MessageQueue.next(MessageQueue.java:<span class="number">339</span>)</span><br><span class="line">at android.os.Looper.loop(Looper.java:<span class="number">198</span>)</span><br><span class="line">at android.app.ActivityThread.main(ActivityThread.java:<span class="number">8142</span>)</span><br><span class="line">at java.lang.reflect.Method.invoke(Native method)</span><br><span class="line">at com.android.internal.os.RuntimeInit$MethodAndArgsCaller.run(RuntimeInit.java:<span class="number">592</span>)</span><br><span class="line">at com.android.internal.os.ZygoteInit.main(ZygoteInit.java:<span class="number">1006</span>)</span><br></pre></td></tr></table></figure><p>Divided into Java and Native. Generally speaking, <code>nativePollOnce</code> is waiting for a Message, which is normal.</p><h2 id="Thread-State"><a href="#Thread-State" class="headerlink" title="Thread State"></a>Thread State</h2><p><img src="/en/images/Android-ANR-02-How-to-analysis-ANR/dde07d81-cefd-4478-9704-c81b900bb54d.webp"></p><p>There is a correspondence between the state in <code>Thread.java</code> and the state in <code>Thread.cpp</code>. It can be seen that the former is more generalized and easier to understand, oriented towards Java users; while the latter is more detailed, oriented towards the internal environment of the virtual machine. The thread states displayed in <code>traces.txt</code> are defined in <code>Thread.cpp</code>. The complete correspondence is as follows:</p><p><code>art/runtime/thread_state.h</code></p><figure class="highlight cpp"><table><tr><td class="gutter"><pre><span class="line">1</span><br><span class="line">2</span><br><span class="line">3</span><br><span class="line">4</span><br><span class="line">5</span><br><span class="line">6</span><br><span class="line">7</span><br><span class="line">8</span><br><span class="line">9</span><br><span class="line">10</span><br><span class="line">11</span><br><span class="line">12</span><br><span class="line">13</span><br><span class="line">14</span><br><span class="line">15</span><br><span class="line">16</span><br><span class="line">17</span><br><span class="line">18</span><br><span class="line">19</span><br><span class="line">20</span><br><span class="line">21</span><br><span class="line">22</span><br><span class="line">23</span><br><span class="line">24</span><br><span class="line">25</span><br><span class="line">26</span><br><span class="line">27</span><br><span class="line">28</span><br><span class="line">29</span><br><span class="line">30</span><br><span class="line">31</span><br><span class="line">32</span><br><span class="line">33</span><br><span class="line">34</span><br><span class="line">35</span><br><span class="line">36</span><br></pre></td><td class="code"><pre><span class="line"><span class="comment">// State stored in our C++ class Thread.</span></span><br><span class="line"><span class="comment">// When we refer to &quot;a suspended state&quot;, or when function names mention &quot;ToSuspended&quot; or</span></span><br><span class="line"><span class="comment">// &quot;FromSuspended&quot;, we mean any state other than kRunnable, i.e. any state in which the thread is</span></span><br><span class="line"><span class="comment">// guaranteed not to access the Java heap. The kSuspended state is merely one of these.</span></span><br><span class="line"><span class="keyword">enum</span> <span class="title class_">ThreadState</span> &#123;</span><br><span class="line">  <span class="comment">//                                   Java</span></span><br><span class="line">  <span class="comment">//                                   Thread.State   JDWP state</span></span><br><span class="line">  kTerminated = <span class="number">66</span>,                 <span class="comment">// TERMINATED     TS_ZOMBIE    Thread.run has returned, but Thread* still around</span></span><br><span class="line">  kRunnable,                        <span class="comment">// RUNNABLE       TS_RUNNING   runnable</span></span><br><span class="line">  kTimedWaiting,                    <span class="comment">// TIMED_WAITING  TS_WAIT      in Object.wait() with a timeout</span></span><br><span class="line">  kSleeping,                        <span class="comment">// TIMED_WAITING  TS_SLEEPING  in Thread.sleep()</span></span><br><span class="line">  kBlocked,                         <span class="comment">// BLOCKED        TS_MONITOR   blocked on a monitor</span></span><br><span class="line">  kWaiting,                         <span class="comment">// WAITING        TS_WAIT      in Object.wait()</span></span><br><span class="line">  kWaitingForLockInflation,         <span class="comment">// WAITING        TS_WAIT      blocked inflating a thin-lock</span></span><br><span class="line">  kWaitingForTaskProcessor,         <span class="comment">// WAITING        TS_WAIT      blocked waiting for taskProcessor</span></span><br><span class="line">  kWaitingForGcToComplete,          <span class="comment">// WAITING        TS_WAIT      blocked waiting for GC</span></span><br><span class="line">  kWaitingForCheckPointsToRun,      <span class="comment">// WAITING        TS_WAIT      GC waiting for checkpoints to run</span></span><br><span class="line">  kWaitingPerformingGc,             <span class="comment">// WAITING        TS_WAIT      performing GC</span></span><br><span class="line">  kWaitingForDebuggerSend,          <span class="comment">// WAITING        TS_WAIT      blocked waiting for events to be sent</span></span><br><span class="line">  kWaitingForDebuggerToAttach,      <span class="comment">// WAITING        TS_WAIT      blocked waiting for debugger to attach</span></span><br><span class="line">  kWaitingInMainDebuggerLoop,       <span class="comment">// WAITING        TS_WAIT      blocking/reading/processing debugger events</span></span><br><span class="line">  kWaitingForDebuggerSuspension,    <span class="comment">// WAITING        TS_WAIT      waiting for debugger suspend all</span></span><br><span class="line">  kWaitingForJniOnLoad,             <span class="comment">// WAITING        TS_WAIT      waiting for execution of dlopen and JNI on load code</span></span><br><span class="line">  kWaitingForSignalCatcherOutput,   <span class="comment">// WAITING        TS_WAIT      waiting for signal catcher IO to complete</span></span><br><span class="line">  kWaitingInMainSignalCatcherLoop,  <span class="comment">// WAITING        TS_WAIT      blocking/reading/processing signals</span></span><br><span class="line">  kWaitingForDeoptimization,        <span class="comment">// WAITING        TS_WAIT      waiting for deoptimization suspend all</span></span><br><span class="line">  kWaitingForMethodTracingStart,    <span class="comment">// WAITING        TS_WAIT      waiting for method tracing to start</span></span><br><span class="line">  kWaitingForVisitObjects,          <span class="comment">// WAITING        TS_WAIT      waiting for visiting objects</span></span><br><span class="line">  kWaitingForGetObjectsAllocated,   <span class="comment">// WAITING        TS_WAIT      waiting for getting the number of allocated objects</span></span><br><span class="line">  kWaitingWeakGcRootRead,           <span class="comment">// WAITING        TS_WAIT      waiting on the GC to read a weak root</span></span><br><span class="line">  kWaitingForGcThreadFlip,          <span class="comment">// WAITING        TS_WAIT      waiting on the GC thread flip (CC collector) to finish</span></span><br><span class="line">  kNativeForAbort,                  <span class="comment">// WAITING        TS_WAIT      checking other threads are not run on abort.</span></span><br><span class="line">  kStarting,                        <span class="comment">// NEW            TS_WAIT      native thread started, not yet ready to run managed code</span></span><br><span class="line">  kNative,                          <span class="comment">// RUNNABLE       TS_RUNNING   running in a JNI native method</span></span><br><span class="line">  kSuspended,                       <span class="comment">// RUNNABLE       TS_RUNNING   suspended by GC or debugger</span></span><br><span class="line">&#125;;</span><br></pre></td></tr></table></figure><p>In the Trace file, the last line of the thread name identifies the current state of the thread.</p><p><img src="/en/images/Android-ANR-02-How-to-analysis-ANR/4878f3bb-ac76-4804-928f-894ab90cfb1b.webp"></p><h3 id="Normal-Main-Thread-Trace"><a href="#Normal-Main-Thread-Trace" class="headerlink" title="Normal Main Thread Trace"></a>Normal Main Thread Trace</h3><figure class="highlight java"><table><tr><td class="gutter"><pre><span class="line">1</span><br><span class="line">2</span><br><span class="line">3</span><br><span class="line">4</span><br><span class="line">5</span><br><span class="line">6</span><br><span class="line">7</span><br><span class="line">8</span><br><span class="line">9</span><br><span class="line">10</span><br><span class="line">11</span><br><span class="line">12</span><br><span class="line">13</span><br><span class="line">14</span><br><span class="line">15</span><br><span class="line">16</span><br><span class="line">17</span><br></pre></td><td class="code"><pre><span class="line"><span class="string">&quot;main&quot;</span> prio=<span class="number">5</span> tid=<span class="number">1</span> Native</span><br><span class="line">  | group=<span class="string">&quot;main&quot;</span> sCount=<span class="number">1</span> dsCount=<span class="number">0</span> flags=<span class="number">1</span> obj=<span class="number">0x72c8bbf8</span> self=<span class="number">0xb400007b0ec10800</span></span><br><span class="line">  | sysTid=<span class="number">5991</span> nice=-<span class="number">10</span> cgrp=<span class="keyword">default</span> sched=<span class="number">0</span>/<span class="number">0</span> handle=<span class="number">0x7b95f61500</span></span><br><span class="line">  | state=S schedstat=( <span class="number">807053249</span> <span class="number">267562324</span> <span class="number">1494</span> ) utm=<span class="number">63</span> stm=<span class="number">17</span> core=<span class="number">3</span> HZ=<span class="number">100</span></span><br><span class="line">  | stack=<span class="number">0x7fcccd9000</span>-<span class="number">0x7fcccdb000</span> stackSize=8192KB</span><br><span class="line">  | held mutexes=</span><br><span class="line">  <span class="keyword">native</span>: #<span class="number">00</span> pc 00000000000c6418  /apex/com.android.runtime/lib64/bionic/libc.so (__epoll_pwait+<span class="number">8</span>)</span><br><span class="line">  <span class="keyword">native</span>: #<span class="number">01</span> pc 0000000000019a9c  /system/lib64/libutils.so (android::Looper::pollInner(<span class="type">int</span>)+<span class="number">184</span>)</span><br><span class="line">  <span class="keyword">native</span>: #<span class="number">02</span> pc 000000000001997c  /system/lib64/libutils.so (android::Looper::pollOnce(<span class="type">int</span>, <span class="type">int</span>*, <span class="type">int</span>*, <span class="keyword">void</span>**)+<span class="number">112</span>)</span><br><span class="line">  <span class="keyword">native</span>: #<span class="number">03</span> pc <span class="number">0000000000114310</span>  /system/lib64/libandroid_runtime.so (android::android_os_MessageQueue_nativePollOnce(_JNIEnv*, _jobject*, <span class="type">long</span>, <span class="type">int</span>)+<span class="number">44</span>)</span><br><span class="line">  at android.os.MessageQueue.nativePollOnce(Native method)</span><br><span class="line">  at android.os.MessageQueue.next(MessageQueue.java:<span class="number">339</span>)</span><br><span class="line">  at android.os.Looper.loop(Looper.java:<span class="number">198</span>)</span><br><span class="line">  at android.app.ActivityThread.main(ActivityThread.java:<span class="number">8142</span>)</span><br><span class="line">  at java.lang.reflect.Method.invoke(Native method)</span><br><span class="line">  at com.android.internal.os.RuntimeInit$MethodAndArgsCaller.run(RuntimeInit.java:<span class="number">592</span>)</span><br><span class="line">  at com.android.internal.os.ZygoteInit.main(ZygoteInit.java:<span class="number">1006</span>)</span><br></pre></td></tr></table></figure><h3 id="Abnormal-Main-Thread-Trace"><a href="#Abnormal-Main-Thread-Trace" class="headerlink" title="Abnormal Main Thread Trace"></a>Abnormal Main Thread Trace</h3><figure class="highlight java"><table><tr><td class="gutter"><pre><span class="line">1</span><br><span class="line">2</span><br><span class="line">3</span><br><span class="line">4</span><br><span class="line">5</span><br><span class="line">6</span><br><span class="line">7</span><br><span class="line">8</span><br><span class="line">9</span><br><span class="line">10</span><br><span class="line">11</span><br><span class="line">12</span><br><span class="line">13</span><br><span class="line">14</span><br><span class="line">15</span><br><span class="line">16</span><br><span class="line">17</span><br></pre></td><td class="code"><pre><span class="line"><span class="string">&quot;main&quot;</span> prio=<span class="number">5</span> tid=<span class="number">1</span> Blocked</span><br><span class="line">  | group=<span class="string">&quot;main&quot;</span> sCount=<span class="number">1</span> dsCount=<span class="number">0</span> flags=<span class="number">1</span> obj=<span class="number">0x70f65400</span> self=<span class="number">0xe28dae00</span></span><br><span class="line">  | sysTid=<span class="number">22002</span> nice=-<span class="number">10</span> cgrp=<span class="keyword">default</span> sched=<span class="number">0</span>/<span class="number">0</span> handle=<span class="number">0xe9674474</span></span><br><span class="line">  | state=S schedstat=( <span class="number">1943159901</span> <span class="number">290647362</span> <span class="number">1661</span> ) utm=<span class="number">159</span> stm=<span class="number">34</span> core=<span class="number">7</span> HZ=<span class="number">100</span></span><br><span class="line">  | stack=<span class="number">0xff041000</span>-<span class="number">0xff043000</span> stackSize=8192KB</span><br><span class="line">  | held mutexes=</span><br><span class="line">  at com.facebook.cache.disk.DiskStorageCache.e(DiskStorageCache.java:<span class="number">3</span>)</span><br><span class="line">  - waiting to lock &lt;<span class="number">0x0e57c91f</span>&gt; (a java.lang.Object) held by thread <span class="number">89</span></span><br><span class="line">  at com.xxx.community.util.imageloader.FrescoImageLoader.a(FrescoImageLoader.java:<span class="number">18</span>)</span><br><span class="line">  at com.xxx.community.util.imageloader.FrescoImageLoader$<span class="number">2</span>$<span class="number">1.</span>run(FrescoImageLoader.java:<span class="number">2</span>)</span><br><span class="line">  at android.os.Handler.handleCallback(Handler.java:<span class="number">938</span>)</span><br><span class="line">  at android.os.Handler.dispatchMessage(Handler.java:<span class="number">99</span>)</span><br><span class="line">  at android.os.Looper.loop(Looper.java:<span class="number">254</span>)</span><br><span class="line">  at android.app.ActivityThread.main(ActivityThread.java:<span class="number">8142</span>)</span><br><span class="line">  at java.lang.reflect.Method.invoke(Native method)</span><br><span class="line">  at com.android.internal.os.RuntimeInit$MethodAndArgsCaller.run(RuntimeInit.java:<span class="number">592</span>)</span><br><span class="line">  at com.android.internal.os.ZygoteInit.main(ZygoteInit.java:<span class="number">1006</span>)</span><br></pre></td></tr></table></figure><h2 id="CPU-Usage-Analysis"><a href="#CPU-Usage-Analysis" class="headerlink" title="CPU Usage Analysis"></a>CPU Usage Analysis</h2><p>Searching for the keyword <code>ANR in</code> reveals the CPU usage within a period of time before the ANR. The parsing is as follows:</p><figure class="highlight java"><table><tr><td class="gutter"><pre><span class="line">1</span><br><span class="line">2</span><br><span class="line">3</span><br><span class="line">4</span><br><span class="line">5</span><br><span class="line">6</span><br><span class="line">7</span><br><span class="line">8</span><br><span class="line">9</span><br><span class="line">10</span><br><span class="line">11</span><br><span class="line">12</span><br><span class="line">13</span><br><span class="line">14</span><br><span class="line">15</span><br><span class="line">16</span><br><span class="line">17</span><br><span class="line">18</span><br><span class="line">19</span><br><span class="line">20</span><br><span class="line">21</span><br><span class="line">22</span><br><span class="line">23</span><br><span class="line">24</span><br><span class="line">25</span><br><span class="line">26</span><br><span class="line">27</span><br><span class="line">28</span><br><span class="line">29</span><br><span class="line">30</span><br><span class="line">31</span><br><span class="line">32</span><br><span class="line">33</span><br></pre></td><td class="code"><pre><span class="line">ActivityManager: ANR in com.xxx.launcher (com.xxx.launcher/.Launcher)(Process Name)</span><br><span class="line">ActivityManager: PID: <span class="number">5991</span>(Process PID)</span><br><span class="line">ActivityManager: Reason: Input dispatching timed <span class="title function_">out</span> <span class="params">(6a6083a com.xxx.launcher/com.xxx.launcher.Launcher (server)</span> is not responding. Waited 5001ms <span class="keyword">for</span> <span class="title function_">FocusEvent</span><span class="params">(hasFocus=<span class="literal">true</span>)</span>)(Reason)</span><br><span class="line">ActivityManager: Parent: com.xxx.launcher/.Launcher</span><br><span class="line">ActivityManager: Load: <span class="number">15.29</span> / <span class="number">5.19</span> / <span class="number">1.87</span>(Load indicates CPU load <span class="keyword">for</span> <span class="number">1</span> min, <span class="number">5</span> min, <span class="number">15</span> min)</span><br><span class="line">ActivityManager: ----- Output from /proc/pressure/memory -----(Memory Pressure)</span><br><span class="line">ActivityManager: somavg10=<span class="number">1.35</span> avg60=<span class="number">0.31</span> avg300=<span class="number">0.06</span> total=<span class="number">346727</span></span><br><span class="line">ActivityManager: full avg10=<span class="number">0.00</span> avg60=<span class="number">0.00</span> avg300=<span class="number">0.00</span> total=<span class="number">34803</span></span><br><span class="line">ActivityManager: ----- End output from /proc/pressure/memory -----</span><br><span class="line"></span><br><span class="line"><span class="comment">// CPU usage within 13s</span></span><br><span class="line">ActivityManager: CPU usage from 0ms to 13135ms <span class="title function_">later</span> <span class="params">(<span class="number">2020</span>-09-09 <span class="number">02</span>:09:<span class="number">54.942</span> to <span class="number">2020</span>-09-09 <span class="number">02</span>:<span class="number">10</span>:<span class="number">08.077</span>)</span>:</span><br><span class="line">ActivityManager:   <span class="number">191</span>%(Total CPU Usage) <span class="number">1948</span>/system_server: <span class="number">72</span>%(User Space Usage) user + <span class="number">119</span>%(Kernel Space Usage) kernel / faults: <span class="number">78816</span> minor <span class="number">9</span> major</span><br><span class="line">ActivityManager:     <span class="number">10</span>% <span class="number">2218</span>/android.bg: <span class="number">3.6</span>% user + <span class="number">6.6</span>% kernel</span><br><span class="line">ActivityManager:   <span class="number">30</span>% <span class="number">5991</span>/com.xxx.launcher: <span class="number">23</span>% user + <span class="number">6.4</span>% kernel / faults: <span class="number">118172</span> minor(Minor page faults) <span class="number">2</span> major(Major Page faults)</span><br><span class="line">ActivityManager:     <span class="number">16</span>% <span class="number">6174</span>/launcher-loader: <span class="number">13</span>% user + <span class="number">2.8</span>% kernel</span><br><span class="line">ActivityManager:     <span class="number">3.9</span>% <span class="number">5991</span>/m.xxx.launcher: <span class="number">3.1</span>% user + <span class="number">0.8</span>% kernel</span><br><span class="line">ActivityManager:   <span class="number">20</span>% <span class="number">6549</span>/com.xxx.xxx: <span class="number">16</span>% user + <span class="number">3.7</span>% kernel / faults: <span class="number">3541</span> minor</span><br><span class="line">ActivityManager:     <span class="number">10</span>% <span class="number">6889</span>/DBCacheManager: <span class="number">8.7</span>% user + <span class="number">1.2</span>% kernel</span><br><span class="line">ActivityManager:     <span class="number">9.4</span>% <span class="number">6942</span>/DefaultDispatch: <span class="number">7.1</span>% user + <span class="number">2.2</span>% kernel</span><br><span class="line"></span><br><span class="line"><span class="comment">// CPU usage of each thread of each process within 1s</span></span><br><span class="line">ActivityManager: CPU usage from 246ms to 1271ms <span class="title function_">later</span> <span class="params">(<span class="number">2020</span>-09-09 <span class="number">02</span>:09:<span class="number">55.188</span> to <span class="number">2020</span>-09-09 <span class="number">02</span>:09:<span class="number">56.213</span>)</span>:</span><br><span class="line">ActivityManager:   <span class="number">290</span>% <span class="number">1948</span>/system_server: <span class="number">114</span>% user + <span class="number">176</span>% kernel / faults: <span class="number">9353</span> minor</span><br><span class="line">ActivityManager:     <span class="number">32</span>% <span class="number">5159</span>/LockSettingsSer: <span class="number">29</span>% user + <span class="number">2.9</span>% kernel</span><br><span class="line">ActivityManager:     <span class="number">25</span>% <span class="number">8661</span>/AnrConsumer: <span class="number">8.8</span>% user + <span class="number">16</span>% kernel</span><br><span class="line">ActivityManager:   <span class="number">44</span>% <span class="number">5991</span>/com.xxx.launcher: <span class="number">37</span>% user + <span class="number">7.4</span>% kernel / faults: <span class="number">5756</span> minor</span><br><span class="line">ActivityManager:     <span class="number">16</span>% <span class="number">6174</span>/launcher-loader: <span class="number">13</span>% user + <span class="number">3.7</span>% kernel</span><br><span class="line">ActivityManager:     <span class="number">14</span>% <span class="number">5991</span>/m.xxx.launcher: <span class="number">14</span>% user + <span class="number">0</span>% kernel</span><br><span class="line">ActivityManager:   <span class="number">37</span>% <span class="number">6549</span>/com.xxx.xxx: <span class="number">28</span>% user + <span class="number">9.3</span>% kernel / faults: <span class="number">153</span> minor</span><br><span class="line">ActivityManager:     <span class="number">37</span>% <span class="number">6942</span>/DefaultDispatch: <span class="number">28</span>% user + <span class="number">9.3</span>% kernel</span><br><span class="line">ActivityManager:   <span class="number">20</span>% <span class="number">5962</span>/com.android.phone: <span class="number">14</span>% user + <span class="number">5.5</span>% kernel / faults: <span class="number">1345</span> minor</span><br><span class="line">ActivityManager:     <span class="number">11</span>% <span class="number">5962</span>/m.android.phone: <span class="number">7.4</span>% user + <span class="number">3.7</span>% kernel</span><br></pre></td></tr></table></figure><h2 id="CPU-Load"><a href="#CPU-Load" class="headerlink" title="CPU Load"></a>CPU Load</h2><figure class="highlight cpp"><table><tr><td class="gutter"><pre><span class="line">1</span><br></pre></td><td class="code"><pre><span class="line">ActivityManager: Load: <span class="number">15.29</span> / <span class="number">5.19</span> / <span class="number">1.871</span></span><br></pre></td></tr></table></figure><p>The three numbers after Load mean the average system load in 1 minute, 5 minutes, and 15 minutes respectively. When the CPU is completely idle, the average load is 0; when the CPU workload is saturated, the average load is 1. The Load helps to judge whether the system load is too heavy.</p><p>There is a vivid metaphor: Imagine the CPU as a bridge with only one lane. All vehicles must pass through this lane. A system load of 0 means there are no cars on the bridge. A system load of 0.5 means half of the bridge section has cars. A system load of 1.0 means all sections of the bridge have cars, that is, the bridge is already “full”. A system load of 2.0 means there are too many vehicles, the bridge is already full (100%), and there are clearly as many vehicles waiting to get on the bridge. The traffic capacity of the bridge is the maximum workload of the CPU; the vehicles on the bridge are the waiting processes.</p><p>The rule of thumb is:</p><ol><li>When the system load is consistently greater than 0.7, you must verify it, where is the problem, to prevent the situation from getting worse.</li><li>When the system load is consistently greater than 1.0, you must find a solution to bring this value down.</li><li>When the system load reaches 5.0, it indicates that your system has serious problems.</li></ol><p>Modern mobile phones use multi-core CPU architectures. Eight cores are common, meaning the CPU processing capacity is multiplied by 8. The running time of each core can be obtained from the following file: <code>/sys/devices/system/cpu/cpu%d/cpufreq/stats/time_in_state</code>, where <code>%d</code> represents the CPU core. The file records the running time of the CPU at various frequencies from boot to reading the file, unit: 10 ms.</p><h2 id="Memory-Load"><a href="#Memory-Load" class="headerlink" title="Memory Load"></a>Memory Load</h2><figure class="highlight java"><table><tr><td class="gutter"><pre><span class="line">1</span><br><span class="line">2</span><br><span class="line">3</span><br><span class="line">4</span><br></pre></td><td class="code"><pre><span class="line">ActivityManager: ----- Output from /proc/pressure/memory -----(Memory Pressure)</span><br><span class="line">ActivityManager: somavg10=<span class="number">1.35</span> avg60=<span class="number">0.31</span> avg300=<span class="number">0.06</span> total=<span class="number">346727</span></span><br><span class="line">ActivityManager: full avg10=<span class="number">0.00</span> avg60=<span class="number">0.00</span> avg300=<span class="number">0.00</span> total=<span class="number">34803</span></span><br><span class="line">ActivityManager: ----- End output from /proc/pressure/memory -----</span><br></pre></td></tr></table></figure><p>Memory load is obtained from <code>/proc/pressure/memory</code>.</p><p><code>avg10</code>, <code>avg60</code>, <code>avg300</code> represent the percentage of blocking time within the time period of 10s, 60s, and 300s respectively. <code>total</code> is the total accumulated time in milliseconds.</p><p>The <code>some</code> line represents the percentage of time that at least one task is blocked on a certain resource. The <code>full</code> line represents the percentage of time that all non-idle tasks are blocked at the same time. During this period, the CPU is completely wasted, which will bring serious performance problems. Let’s take IO <code>some</code> and <code>full</code> as an example. Suppose that in a 60-second time period, the system has two tasks. The running status within the 60-second cycle is shown in the figure below:</p><p><img src="/en/images/Android-ANR-02-How-to-analysis-ANR/ce7a3897-9d73-43e1-8b55-d7fb11727489.webp"></p><p>The red shaded part indicates that the task enters the blocked state due to waiting for IO resources. The part where Task A and Task B are blocked at the same time is <code>full</code>, accounting for 16.66%; the part where at least one task is blocked (including the part where only Task B is blocked) is <code>some</code>, accounting for 50%.</p><p><code>some</code> and <code>full</code> are the sum of the proportion of blocking time within a certain period of time. The blocking time is not necessarily continuous, as shown in the figure below:</p><p><img src="/en/images/Android-ANR-02-How-to-analysis-ANR/a62e6bd8-8672-4cb7-8815-ff740d0eaec9.webp"></p><p>For details, please refer to the article by Kernel Craftsman: <a href="https://blog.csdn.net/feelabclihu/article/details/105534140">https://blog.csdn.net/feelabclihu/article/details/105534140</a></p><h2 id="IO-Load"><a href="#IO-Load" class="headerlink" title="IO Load"></a>IO Load</h2><figure class="highlight java"><table><tr><td class="gutter"><pre><span class="line">1</span><br></pre></td><td class="code"><pre><span class="line">ActivityManager:   <span class="number">30</span>% <span class="number">5991</span>/com.xxx.launcher: <span class="number">23</span>% user + <span class="number">6.4</span>% kernel / faults: <span class="number">118172</span> minor(cache page faults) <span class="number">2</span> major(memory page faults)</span><br></pre></td></tr></table></figure><ol><li><strong>Minor</strong>: Page faults in high-speed cache, referring to Minor Page Fault (MnPF). When disk data is loaded into memory, the kernel will issue an MnPF message when reading it again. When a file is read and written for the first time, there will be many MPFs. After being cached into memory, accessing MPF again will be very few, and MnPF will increase instead. This is the result of the caching technology adopted by the kernel to reduce inefficient disk I&#x2F;O operations. It can be understood as the process performing memory access.</li><li><strong>Major</strong>: Page faults in memory, referring to Major Page Fault (MPF). When the kernel reads data, it will search the CPU’s high-speed cache and physical memory successively. If not found, it will issue an MPF message requesting to load data into memory. It can be understood as the process performing IO operations.</li></ol><p>If there are a large number of <code>major</code>, it means that the IO operation load was relatively high at that time.</p><h2 id="Process-Load"><a href="#Process-Load" class="headerlink" title="Process Load"></a>Process Load</h2><figure class="highlight java"><table><tr><td class="gutter"><pre><span class="line">1</span><br></pre></td><td class="code"><pre><span class="line">ActivityManager:   <span class="number">30</span>% <span class="number">5991</span>/com.xxx.launcher: <span class="number">23</span>% user + <span class="number">6.4</span>% kernel / faults: <span class="number">118172</span> minor(Minor page faults) <span class="number">2</span> major(Major Page faults)</span><br></pre></td></tr></table></figure><ol><li>23% user: cpu usage in user mode</li><li>6.4% kernel: cpu usage in kernel mode</li></ol><h2 id="CPU-Anomalous-Process"><a href="#CPU-Anomalous-Process" class="headerlink" title="CPU Anomalous Process"></a>CPU Anomalous Process</h2><ol><li><strong>SystemServer</strong> cpu usage is high: the overall system operation will be slow.</li><li><strong>kswapd0</strong> cpu usage is high: the overall system operation will be slow, causing various ANRs. Transfer the problem to “Memory Optimization” and ask them to optimize.</li><li><strong>logd</strong> CPU usage is high: causes system lag and ANR because the operation of each process outputting LOG is blocked and executes extremely slowly.</li><li><strong>Vold</strong> CPU usage is too high: causes system lag and ANR, please verify with the colleague responsible for storage first.</li><li><strong>Application itself</strong> CPU usage is high: high probability of the application’s own problem.</li><li><strong>Application is in D state</strong>, ANR occurs: If the last operation is <code>refriger</code>, then the application is frozen. Normally, it is caused by power consumption optimization. You can check whether there is a Log like <code>xxxHansManager : unfreeze</code> before and after; or in Systrace, the Kernel Callstack shows: <code>&#123;kernel callsite when blocked:: &quot;__refrigerator+0xe4/0x198&quot;&#125;</code>.</li><li><strong>“+” before CPU usage rate</strong>: Some processes have a “+” sign before their CPU usage rate, such as <code>cat</code> and <code>zygote64</code>, indicating that these processes did not exist in the last CPU statistics time slice, but ran in this CPU statistics time slice. Similarly, there is a “-“ sign, indicating that these processes died during the two CPU statistics time slices.</li></ol><h1 id="Key-System-Log-Introduction"><a href="#Key-System-Log-Introduction" class="headerlink" title="Key System Log Introduction"></a>Key System Log Introduction</h1><h2 id="Application-Freezing"><a href="#Application-Freezing" class="headerlink" title="Application Freezing"></a>Application Freezing</h2><figure class="highlight java"><table><tr><td class="gutter"><pre><span class="line">1</span><br></pre></td><td class="code"><pre><span class="line">xxxHansManager : freeze uid: <span class="number">10245</span> <span class="keyword">package</span>: com.tencent.mm reason: LcdOff</span><br></pre></td></tr></table></figure><p>If the freezing logic has a Bug, it will also cause the application to generate an ANR. This line of Log is relatively simple, mainly the frozen process information and the reason for freezing.</p><h2 id="ActivityManager-Slow-operation"><a href="#ActivityManager-Slow-operation" class="headerlink" title="ActivityManager : Slow operation"></a>ActivityManager : Slow operation</h2><p>When AMS performs key tasks, if the task takes longer than 50 ms, it will print the corresponding Log.</p><p><code>frameworks/base/services/core/java/com/android/server/am/ActivityManagerService.java</code></p><figure class="highlight java"><table><tr><td class="gutter"><pre><span class="line">1</span><br><span class="line">2</span><br><span class="line">3</span><br><span class="line">4</span><br><span class="line">5</span><br><span class="line">6</span><br><span class="line">7</span><br></pre></td><td class="code"><pre><span class="line"><span class="keyword">void</span> <span class="title function_">checkTime</span><span class="params">(<span class="type">long</span> startTime, String where)</span> &#123;</span><br><span class="line">    <span class="type">long</span> <span class="variable">now</span> <span class="operator">=</span> SystemClock.uptimeMillis();</span><br><span class="line">    <span class="keyword">if</span> ((now-startTime) &gt; <span class="number">50</span>) &#123;</span><br><span class="line">        <span class="comment">// If we are taking more than 50ms, log about it.</span></span><br><span class="line">        Slog.w(TAG, <span class="string">&quot;Slow operation: &quot;</span> + (now-startTime) + <span class="string">&quot;ms so far, now at &quot;</span> + where);</span><br><span class="line">    &#125;</span><br><span class="line">&#125;</span><br></pre></td></tr></table></figure><p>The corresponding Log is as follows. If such Logs are printed frequently in the system, it means that the system is currently in a relatively stuck state, and system factors must be considered during analysis.</p><figure class="highlight java"><table><tr><td class="gutter"><pre><span class="line">1</span><br><span class="line">2</span><br><span class="line">3</span><br></pre></td><td class="code"><pre><span class="line">ActivityManager: Slow operation: 138ms so far, now at startProcess: done updating battery stats</span><br><span class="line">ActivityManager: Slow operation: 138ms so far, now at startProcess: building log message</span><br><span class="line">ActivityManager: Slow operation: 138ms so far, now at startProcess: starting to update pids map</span><br></pre></td></tr></table></figure><h2 id="Looper-Slow-dispatch"><a href="#Looper-Slow-dispatch" class="headerlink" title="Looper : Slow dispatch"></a>Looper : Slow dispatch</h2><figure class="highlight java"><table><tr><td class="gutter"><pre><span class="line">1</span><br></pre></td><td class="code"><pre><span class="line">Looper  : Slow dispatch took 418ms main h=android.app.ActivityThread$H c=android.app.-$$Lambda$LoadedApk$ReceiverDispatcher$Args$_BumDX2UKsnxLVrE6UJsJZkotuA<span class="meta">@e68bdc4</span> m=<span class="number">0</span></span><br></pre></td></tr></table></figure><h2 id="Looper-Slow-delivery"><a href="#Looper-Slow-delivery" class="headerlink" title="Looper : Slow delivery"></a>Looper : Slow delivery</h2><figure class="highlight java"><table><tr><td class="gutter"><pre><span class="line">1</span><br></pre></td><td class="code"><pre><span class="line">Looper  : Slow delivery took 361ms android.ui h=com.android.server.am.ActivityManagerService$UiHandler c=<span class="literal">null</span> m=<span class="number">53</span></span><br></pre></td></tr></table></figure><h2 id="Looper：Slow-Looper"><a href="#Looper：Slow-Looper" class="headerlink" title="Looper：Slow Looper"></a>Looper：Slow Looper</h2><figure class="highlight java"><table><tr><td class="gutter"><pre><span class="line">1</span><br></pre></td><td class="code"><pre><span class="line">W/Looper: Slow Looper main: Activity com.androidperformance.memoryfix/.MainActivity is 439ms <span class="title function_">late</span> <span class="params">(wall=0ms running=0ms ClientTransaction&#123; callbacks=[android.app.servertransaction.TopResumedActivityChangeItem] &#125;)</span> because of <span class="number">3</span> msg, msg <span class="number">2</span> took 268ms (seq=<span class="number">2</span> running=207ms runnable=15ms late=1ms h=android.app.ActivityThread$H w=<span class="number">110</span>), msg <span class="number">3</span> took 171ms (seq=<span class="number">3</span> running=140ms runnable=5ms io=1ms late=268ms h=android.app.ActivityThread$H w=<span class="number">159</span>)</span><br></pre></td></tr></table></figure><h2 id="onTrimMemory"><a href="#onTrimMemory" class="headerlink" title="onTrimMemory"></a>onTrimMemory</h2><figure class="highlight java"><table><tr><td class="gutter"><pre><span class="line">1</span><br></pre></td><td class="code"><pre><span class="line">ClockTag AlarmClockApplication: onTrimMemory: <span class="number">80</span></span><br></pre></td></tr></table></figure><h2 id="dvm-lock-sample"><a href="#dvm-lock-sample" class="headerlink" title="dvm_lock_sample"></a>dvm_lock_sample</h2><p>When the blocked time of a thread waiting for a lock exceeds the threshold (for example: 500ms), the current lock holding status is output.</p><figure class="highlight java"><table><tr><td class="gutter"><pre><span class="line">1</span><br></pre></td><td class="code"><pre><span class="line">dvm_lock_sample：[system_server,<span class="number">1</span>,Binder_9,<span class="number">1500</span>,ActivityManagerService.java,<span class="number">6403</span>,-,<span class="number">1448</span>,<span class="number">0</span>]</span><br></pre></td></tr></table></figure><ol><li>system_server: Binder_9 executes to line 6403 of ActivityManagerService.java, and has been waiting for the AMS lock.</li><li>“-“ means that the lock is held by the same file, that is, the lock is held by line 1448 of the same file code, causing the Binder_9 thread to be blocked for 1500ms.</li></ol><h2 id="binder-sample"><a href="#binder-sample" class="headerlink" title="binder_sample"></a>binder_sample</h2><p>binder_sample: Monitors the binder transaction duration of the main thread of each process. When it exceeds the threshold (for example: 500ms), the corresponding target call information is output.</p><figure class="highlight java"><table><tr><td class="gutter"><pre><span class="line">1</span><br></pre></td><td class="code"><pre><span class="line"><span class="number">6628</span>  <span class="number">6628</span> I binder_sample: [android.view.accessibility.IAccessibilityManager,<span class="number">6</span>,<span class="number">2010</span>,com.xxx.community,<span class="number">100</span>]</span><br></pre></td></tr></table></figure><ol><li>The process is 6628, main thread 6628</li><li>Executing <code>android.view.accessibility.IAccessibilityManager</code> interface</li><li>The corresponding method code &#x3D; 6 (i.e., <code>TRANSACTION_addAccessibilityInteractionConnection</code>)</li><li>The time spent is 2010 ms</li><li>The package where the block is located is <code>com.xxx.community</code></li><li>The last parameter is the sample ratio</li></ol><p>Find the corresponding interface function, such as which function corresponds to Code &#x3D; 6 in IAccessibilityManager in the above example. You can search for <code>FIRST_CALL_TRANSACTION</code> in cs.android.com, click call, and then view the corresponding IAccessibilityManager file in the out directory (scroll all the way down until you can search for IAccessibilityManager).</p><p><img src="/en/images/Android-ANR-02-How-to-analysis-ANR/53e8ee44-b1f7-4729-83e8-4ccb4f784a6a.webp"></p><p>Among them, the corresponding <code>static final int TRANSACTION_addAccessibilityInteractionConnection = (android.os.IBinder.FIRST_CALL_TRANSACTION + 5)</code></p><h2 id="Long-monitor-contention"><a href="#Long-monitor-contention" class="headerlink" title="Long monitor contention"></a>Long monitor contention</h2><figure class="highlight java"><table><tr><td class="gutter"><pre><span class="line">1</span><br></pre></td><td class="code"><pre><span class="line"><span class="number">16809</span> <span class="number">14216</span> W system_server: Long monitor contention with owner <span class="title function_">InputDispatcher</span> <span class="params">(<span class="number">17039</span>)</span> at android.content.res.Configuration com.android.server.wm.ActivityTaskManagerService.getGlobalConfigurationForPid(<span class="type">int</span>)(ActivityTaskManagerService.java:<span class="number">1066</span>) waiters=<span class="number">0</span> in <span class="type">boolean</span> com.android.server.wm.WindowProcessController.hasActivities() <span class="keyword">for</span> 141ms</span><br></pre></td></tr></table></figure><p><code>art/runtime/monitor.cc</code></p><figure class="highlight java"><table><tr><td class="gutter"><pre><span class="line">1</span><br><span class="line">2</span><br><span class="line">3</span><br><span class="line">4</span><br><span class="line">5</span><br><span class="line">6</span><br><span class="line">7</span><br><span class="line">8</span><br><span class="line">9</span><br><span class="line">10</span><br><span class="line">11</span><br><span class="line">12</span><br><span class="line">13</span><br><span class="line">14</span><br><span class="line">15</span><br><span class="line">16</span><br><span class="line">17</span><br><span class="line">18</span><br><span class="line">19</span><br><span class="line">20</span><br></pre></td><td class="code"><pre><span class="line">std::string Monitor::PrettyContentionInfo(const std::string&amp; owner_name,</span><br><span class="line">                                          pid_t owner_tid,</span><br><span class="line">                                          ArtMethod* owners_method,</span><br><span class="line">                                          uint32_t owners_dex_pc,</span><br><span class="line">                                          size_t num_waiters) &#123;</span><br><span class="line">  Locks::mutator_lock_-&gt;AssertSharedHeld(Thread::Current());</span><br><span class="line">  const <span class="type">char</span>* owners_filename;</span><br><span class="line">  <span class="type">int32_t</span> <span class="variable">owners_line_number</span> <span class="operator">=</span> <span class="number">0</span>;</span><br><span class="line">  <span class="keyword">if</span> (owners_method != nullptr) &#123;</span><br><span class="line">    TranslateLocation(owners_method, owners_dex_pc, &amp;owners_filename, &amp;owners_line_number);</span><br><span class="line">  &#125;</span><br><span class="line">  std::ostringstream oss;</span><br><span class="line">  oss &lt;&lt; <span class="string">&quot;monitor contention with owner &quot;</span> &lt;&lt; owner_name &lt;&lt; <span class="string">&quot; (&quot;</span> &lt;&lt; owner_tid &lt;&lt; <span class="string">&quot;)&quot;</span>;</span><br><span class="line">  <span class="keyword">if</span> (owners_method != nullptr) &#123;</span><br><span class="line">    oss &lt;&lt; <span class="string">&quot; at &quot;</span> &lt;&lt; owners_method-&gt;PrettyMethod();</span><br><span class="line">    oss &lt;&lt; <span class="string">&quot;(&quot;</span> &lt;&lt; owners_filename &lt;&lt; <span class="string">&quot;:&quot;</span> &lt;&lt; owners_line_number &lt;&lt; <span class="string">&quot;)&quot;</span>;</span><br><span class="line">  &#125;</span><br><span class="line">  oss &lt;&lt; <span class="string">&quot; waiters=&quot;</span> &lt;&lt; num_waiters;</span><br><span class="line">  <span class="keyword">return</span> oss.str();</span><br><span class="line">&#125;</span><br></pre></td></tr></table></figure><h2 id="Binder-Thread"><a href="#Binder-Thread" class="headerlink" title="Binder Thread"></a>Binder Thread</h2><p>When the thread pool of processes such as system_server is used up and there are no idle threads, binder communication is in a starvation state. If the starvation state exceeds a certain threshold, information is output.</p><figure class="highlight java"><table><tr><td class="gutter"><pre><span class="line">1</span><br></pre></td><td class="code"><pre><span class="line">E IPCThreadState: binder thread <span class="title function_">pool</span> <span class="params">(<span class="number">31</span> threads)</span> starved <span class="keyword">for</span> <span class="number">120</span> ms</span><br></pre></td></tr></table></figure><h2 id="am-kill"><a href="#am-kill" class="headerlink" title="am_kill"></a>am_kill</h2><figure class="highlight java"><table><tr><td class="gutter"><pre><span class="line">1</span><br></pre></td><td class="code"><pre><span class="line">am_kill : [<span class="number">0</span>,<span class="number">18555</span>,com.sina.weibo.image,<span class="number">945</span>,remove task]<span class="number">1</span></span><br></pre></td></tr></table></figure><p>In the sentence above, <code>remove task</code> refers to the reason why this application was killed.</p><p>The following are the Reasons corresponding to various killed situations. Sometimes we need to see the reason why the application was killed to judge whether the system is normal or the user’s operation steps:</p><h3 id="force-stop"><a href="#force-stop" class="headerlink" title="force-stop"></a>force-stop</h3><p><img src="/en/images/Android-ANR-02-How-to-analysis-ANR/7cfb4102-f137-426b-84f0-a6a06c58fd47.webp"></p><h3 id="Abnormal-Process-Kill"><a href="#Abnormal-Process-Kill" class="headerlink" title="Abnormal Process Kill"></a>Abnormal Process Kill</h3><p><img src="/en/images/Android-ANR-02-How-to-analysis-ANR/e8f54015-0bf1-494c-8262-9a56e797d04d.webp"></p><h3 id="Active-Process-Kill"><a href="#Active-Process-Kill" class="headerlink" title="Active Process Kill"></a>Active Process Kill</h3><p><img src="/en/images/Android-ANR-02-How-to-analysis-ANR/8d7d8da3-0171-4be5-921c-79eb33e276d7.webp"></p><h3 id="Schedueled-Process-Kill"><a href="#Schedueled-Process-Kill" class="headerlink" title="Schedueled Process Kill"></a>Schedueled Process Kill</h3><p><img src="/en/images/Android-ANR-02-How-to-analysis-ANR/4e5b3f4e-4668-4d92-bb7f-83b90fd0de18.webp"></p><h3 id="Other-Process-Kill"><a href="#Other-Process-Kill" class="headerlink" title="Other Process Kill"></a>Other Process Kill</h3><p><img src="/en/images/Android-ANR-02-How-to-analysis-ANR/933942df-43e8-4b74-8e12-768198a17667.webp"></p><p>All the process kills introduced above call the <code>ProcessRecord.kill()</code> method, which inevitably outputs the corresponding EventLog. So what other scenarios of killing processes will not output log?</p><ol><li><code>Process.killProcess(int pid)</code> &#x2F;&#x2F; Can kill any specified process, or send signal directly</li><li><code>adb shell kill -9 pid</code> &#x2F;&#x2F; Can kill any specified process</li><li>Killed by <code>lmk</code> directly</li></ol><p>That is to say, if a process is killed without log output, it may be killed by directly calling kill or sending a signal, or perhaps killed by lmk.</p><h2 id="am-proc-died"><a href="#am-proc-died" class="headerlink" title="am_proc_died"></a>am_proc_died</h2><figure class="highlight java"><table><tr><td class="gutter"><pre><span class="line">1</span><br></pre></td><td class="code"><pre><span class="line">am_proc_died: [<span class="number">0</span>,<span class="number">13210</span>,com.xxx.gallery3d,<span class="number">935</span>,<span class="number">19</span>]</span><br></pre></td></tr></table></figure><h2 id="am-anr"><a href="#am-anr" class="headerlink" title="am_anr"></a>am_anr</h2><figure class="highlight java"><table><tr><td class="gutter"><pre><span class="line">1</span><br></pre></td><td class="code"><pre><span class="line">am_anr : [<span class="number">0</span>,<span class="number">8769</span>,com.android.updater,<span class="number">952680005</span>,Broadcast of Intent &#123; act=android.intent.action.BOOT_COMPLETED flg=<span class="number">0x9000010</span> cmp=com.android.updater/.BootCompletedReceiver (has extras) &#125;]</span><br></pre></td></tr></table></figure><ol><li>Process pid: 8769</li><li>Process name: <code>com.android.updater</code></li><li>The type of ANR occurred is: Specific class or reason for BroadcastTimeout: <code>&#123; act=android.intent.action.BOOT_COMPLETED flg=0x9000010 cmp=com.android.updater/.BootCompletedReceiver (has extras) &#125;</code></li></ol><h2 id="Lowmemorykiller"><a href="#Lowmemorykiller" class="headerlink" title="Lowmemorykiller"></a>Lowmemorykiller</h2><p>The log of <code>lowmemorykiller</code> is in the kernel log.</p><figure class="highlight java"><table><tr><td class="gutter"><pre><span class="line">1</span><br><span class="line">2</span><br></pre></td><td class="code"><pre><span class="line">lowmemorykiller: Kill <span class="string">&#x27;com.heytap.themestore&#x27;</span> (<span class="number">15545</span>), uid <span class="number">10136</span>, oom_adj <span class="number">995</span> to free 105068kB</span><br><span class="line">lowmemorykiller: Reclaimed 105068kB at oom_adj <span class="number">606</span></span><br></pre></td></tr></table></figure><p>Killing applications through the <code>lowmemorykiller</code> mechanism:</p><ol><li><code>com.heytap.themestore</code> process name</li><li>15545: PID</li><li>10136: UID</li><li>995: <code>oom_adj</code></li><li>105068kB: released memory</li><li>606: <code>min_adj</code></li></ol><h2 id="Blocked-msg"><a href="#Blocked-msg" class="headerlink" title="Blocked msg"></a>Blocked msg</h2><p>Internally added Log, when the execution time of Message exceeds 1.5s, the following Log will be printed. From the following Log, we can see:</p><ol><li>The Message that timed out, and the execution time of this Message</li><li>The Message blocked by this Message</li></ol><p>From this Log, you can observe whether your Message execution blocked other Messages or your Message was blocked by other Messages.</p><figure class="highlight plaintext"><table><tr><td class="gutter"><pre><span class="line">1</span><br><span class="line">2</span><br><span class="line">3</span><br><span class="line">4</span><br><span class="line">5</span><br><span class="line">6</span><br><span class="line">7</span><br><span class="line">8</span><br><span class="line">9</span><br><span class="line">10</span><br><span class="line">11</span><br><span class="line">12</span><br><span class="line">13</span><br><span class="line">14</span><br></pre></td><td class="code"><pre><span class="line">E ANR_LOG : &gt;&gt;&gt; msg&#x27;s executing time is too long</span><br><span class="line">E ANR_LOG : Blocked msg = &#123; when=-32s683ms what=110 target=android.app.ActivityThread$H obj=AppBindData&#123;appInfo=ApplicationInfo&#123;bd8d51e com.android.contacts&#125;&#125; &#125; , cost  = 32436 ms</span><br><span class="line">E ANR_LOG : &gt;&gt;&gt;Current msg List is:</span><br><span class="line">E ANR_LOG : Current msg &lt;1&gt;  = &#123; when=-32s672ms what=140 target=android.app.ActivityThread$H arg1=5 &#125;</span><br><span class="line">E ANR_LOG : Current msg &lt;2&gt;  = &#123; when=-32s671ms what=114 target=android.app.ActivityThread$H obj=CreateServiceData&#123;token=android.os.BinderProxy@f7611ff className=com.android.contacts.xxxAppServicesManagerClient packageName=com.android.contacts intent=null&#125; &#125;</span><br><span class="line">E ANR_LOG : Current msg &lt;3&gt;  = &#123; when=-32s671ms what=121 target=android.app.ActivityThread$H obj=BindServiceData&#123;token=android.os.BinderProxy@f7611ff intent=Intent &#123; cmp=com.android.contacts/.xxxAppServicesManagerClient &#125;&#125; &#125;</span><br><span class="line">E ANR_LOG : Current msg &lt;4&gt;  = &#123; when=-31s658ms what=1 target=android.os.AsyncTask$InternalHandler obj=android.os.AsyncTask$AsyncTaskResult@75e517c &#125;</span><br><span class="line">E ANR_LOG : Current msg &lt;5&gt;  = &#123; when=-29s750ms what=140 target=android.app.ActivityThread$H arg1=10 &#125;</span><br><span class="line">E ANR_LOG : Current msg &lt;6&gt;  = &#123; when=-29s103ms what=118 target=android.app.ActivityThread$H obj=&#123;1.0 460mcc3mnc [zh_CN] ldltr sw360dp w360dp h622dp 480dpi nrml long port finger -keyb/v/h -nav/h appBounds=Rect(0, 0 - 1080, 1920) s.10mThemeChanged = 0mThemeChangedFlags = 0mFlipFont = 0&#125;</span><br><span class="line">E ANR_LOG : Current msg &lt;7&gt;  = &#123; when=-28s370ms what=118 target=android.app.ActivityThread$H obj=&#123;1.0 460mcc11mnc [zh_CN] ldltr sw360dp w360dp h622dp 480dpi nrml long port finger -keyb/v/h -nav/h appBounds=Rect(0, 0 - 1080, 1920) s.11mThemeChanged = 0mThemeChangedFlags = 0mFlipFont = 0&#125; &#125;</span><br><span class="line">E ANR_LOG : Current msg &lt;8&gt;  = &#123; when=-27s821ms what=122 target=android.app.ActivityThread$H obj=BindServiceData&#123;token=android.os.BinderProxy@f7611ff intent=Intent &#123; cmp=com.android.contacts/.xxxAppServicesManagerClient &#125;&#125; &#125;</span><br><span class="line">E ANR_LOG : Current msg &lt;9&gt;  = &#123; when=-27s821ms what=116 target=android.app.ActivityThread$H obj=android.os.BinderProxy@f7611ff &#125;</span><br><span class="line">E ANR_LOG : Current msg &lt;10&gt;  = &#123; when=-27s654ms what=114 target=android.app.ActivityThread$H obj=CreateServiceData&#123;token=android.os.BinderProxy@e23cf1b className=com.android.contacts.xxxAppServicesManagerClient packageName=com.android.contacts intent=null&#125; &#125;</span><br><span class="line">E ANR_LOG : &gt;&gt;&gt;CURRENT MSG DUMP OVER&lt;&lt;&lt;</span><br></pre></td></tr></table></figure><h1 id="Common-Scenario-Logs-Introduction"><a href="#Common-Scenario-Logs-Introduction" class="headerlink" title="Common Scenario Logs Introduction"></a>Common Scenario Logs Introduction</h1><h2 id="Screen-Off-Log"><a href="#Screen-Off-Log" class="headerlink" title="Screen Off Log"></a>Screen Off Log</h2><p>The key is <code>power_screen_broadcast_done</code>, <code>screen_toggled</code> and <code>power_screen_state</code>.</p><figure class="highlight java"><table><tr><td class="gutter"><pre><span class="line">1</span><br><span class="line">2</span><br><span class="line">3</span><br><span class="line">4</span><br><span class="line">5</span><br><span class="line">6</span><br><span class="line">7</span><br><span class="line">8</span><br><span class="line">9</span><br><span class="line">10</span><br><span class="line">11</span><br><span class="line">12</span><br></pre></td><td class="code"><pre><span class="line"><span class="number">1810</span>  <span class="number">2470</span> I intercept_power: [ACTION_DOWN,<span class="number">1</span>,<span class="number">0</span>]</span><br><span class="line"><span class="number">1810</span>  <span class="number">2470</span> I intercept_power: [ACTION_UP,<span class="number">0</span>,<span class="number">0</span>]</span><br><span class="line"><span class="number">1810</span>  <span class="number">2470</span> I power_sleep_requested: <span class="number">0</span></span><br><span class="line"></span><br><span class="line"><span class="number">1810</span>  <span class="number">1810</span> I power_screen_state: [<span class="number">0</span>,<span class="number">2</span>,<span class="number">0</span>,<span class="number">0</span>,<span class="number">1254</span>]</span><br><span class="line"><span class="number">1810</span>  <span class="number">1810</span> I screen_toggled: <span class="number">0</span> <span class="comment">// 0 means screen off, 1 means screen on</span></span><br><span class="line"><span class="number">1810</span>  <span class="number">1810</span> I power_screen_broadcast_send: <span class="number">1</span></span><br><span class="line"><span class="number">1810</span>  <span class="number">1825</span> I wm_set_keyguard_shown: [<span class="number">1</span>,<span class="number">0</span>,<span class="number">0</span>,setKeyguardShown] <span class="comment">// (keyguardShowing|1),(aodShowing|1),(keyguardGoingAway|1),(Reason|3)</span></span><br><span class="line"></span><br><span class="line"><span class="number">2768</span>  <span class="number">2768</span> I sysui_status_bar_state: [<span class="number">1</span>,<span class="number">1</span>,<span class="number">0</span>,<span class="number">0</span>,<span class="number">0</span>,<span class="number">1</span>]</span><br><span class="line"></span><br><span class="line"><span class="number">1810</span>  <span class="number">1810</span> I power_screen_broadcast_done: [<span class="number">0</span>,<span class="number">611</span>,<span class="number">1</span>] <span class="comment">// 0 means screen off, 611 is screen off time</span></span><br></pre></td></tr></table></figure><h2 id="Screen-On-Log"><a href="#Screen-On-Log" class="headerlink" title="Screen On Log"></a>Screen On Log</h2><p>The key is <code>power_screen_broadcast_done</code>, <code>screen_toggled</code> and <code>power_screen_state</code>.</p><p>Where <code>power_screen_state</code>:</p><ol><li>offOrOn|1|5</li><li>becauseOfUser|1|5</li><li>totalTouchDownTime|2|3</li><li>touchCycles|1|1</li><li>latency|1|3</li></ol><figure class="highlight java"><table><tr><td class="gutter"><pre><span class="line">1</span><br><span class="line">2</span><br><span class="line">3</span><br><span class="line">4</span><br><span class="line">5</span><br><span class="line">6</span><br></pre></td><td class="code"><pre><span class="line"><span class="number">1810</span>  <span class="number">2470</span> I intercept_power: [ACTION_DOWN,<span class="number">1</span>,<span class="number">0</span>]</span><br><span class="line"><span class="number">1810</span>  <span class="number">2470</span> I intercept_power: [ACTION_UP,<span class="number">1</span>,<span class="number">0</span>]</span><br><span class="line"><span class="number">1810</span>  <span class="number">1810</span> I screen_toggled: <span class="number">1</span> <span class="comment">// 1 means screen on</span></span><br><span class="line"><span class="number">1810</span>  <span class="number">1810</span> I power_screen_broadcast_send: <span class="number">1</span></span><br><span class="line"><span class="number">1810</span>  <span class="number">1810</span> I power_screen_state: [<span class="number">1</span>,<span class="number">0</span>,<span class="number">0</span>,<span class="number">0</span>,<span class="number">319</span>]</span><br><span class="line"><span class="number">1810</span>  <span class="number">1810</span> I power_screen_broadcast_done: [<span class="number">1</span>,<span class="number">633</span>,<span class="number">1</span>] <span class="comment">// 1 means screen on, 633 is screen on time</span></span><br></pre></td></tr></table></figure><h2 id="Unlock-Complete-Log"><a href="#Unlock-Complete-Log" class="headerlink" title="Unlock Complete Log"></a>Unlock Complete Log</h2><p>Values of <code>wm_set_keyguard_shown</code>:</p><ol><li>(keyguardShowing|1): Whether Keyguard is showing</li><li>(aodShowing|1): Whether aodShowing is showing</li><li>(keyguardGoingAway|1): Keyguard disappearing</li><li>(Reason|3): Reason</li></ol><figure class="highlight java"><table><tr><td class="gutter"><pre><span class="line">1</span><br><span class="line">2</span><br><span class="line">3</span><br><span class="line">4</span><br><span class="line">5</span><br><span class="line">6</span><br><span class="line">7</span><br><span class="line">8</span><br><span class="line">9</span><br><span class="line">10</span><br></pre></td><td class="code"><pre><span class="line"> <span class="number">1810</span>  <span class="number">5711</span> I wm_set_keyguard_shown: [<span class="number">1</span>,<span class="number">0</span>,<span class="number">1</span>,keyguardGoingAway]</span><br><span class="line"><span class="comment">// Launcher Resume</span></span><br><span class="line"> <span class="number">1810</span>  <span class="number">5711</span> I wm_set_resumed_activity: [<span class="number">0</span>,com.xxx.launcher/.Launcher,resumeTopActivityInnerLocked]</span><br><span class="line"> <span class="number">1810</span>  <span class="number">5711</span> I wm_resume_activity: [<span class="number">0</span>,<span class="number">93093883</span>,<span class="number">63</span>,com.xxx.launcher/.Launcher]</span><br><span class="line"><span class="number">20615</span> <span class="number">20615</span> I wm_on_restart_called: [<span class="number">93093883</span>,com.xxx.launcher.Launcher,performRestartActivity]</span><br><span class="line"><span class="number">20615</span> <span class="number">20615</span> I wm_on_start_called: [<span class="number">93093883</span>,com.xxx.launcher.Launcher,handleStartActivity]</span><br><span class="line"><span class="number">20615</span> <span class="number">20615</span> I wm_on_resume_called: [<span class="number">93093883</span>,com.xxx.launcher.Launcher,RESUME_ACTIVITY]</span><br><span class="line"><span class="number">20615</span> <span class="number">20615</span> I wm_on_top_resumed_gained_called: [<span class="number">93093883</span>,com.xxx.launcher.Launcher,topWhenResuming]</span><br><span class="line"></span><br><span class="line"> <span class="number">1810</span>  <span class="number">5711</span> I wm_set_keyguard_shown: [<span class="number">0</span>,<span class="number">0</span>,<span class="number">1</span>,setKeyguardShown] <span class="comment">// keyguard not showing, aod not showing, keyguardGoingAway, reason is called setKeyguardShown to show desktop</span></span><br></pre></td></tr></table></figure><h2 id="Notification-Panel-Pull-Down-Log"><a href="#Notification-Panel-Pull-Down-Log" class="headerlink" title="Notification Panel Pull Down Log"></a>Notification Panel Pull Down Log</h2><figure class="highlight java"><table><tr><td class="gutter"><pre><span class="line">1</span><br><span class="line">2</span><br><span class="line">3</span><br><span class="line">4</span><br><span class="line">5</span><br><span class="line">6</span><br></pre></td><td class="code"><pre><span class="line"><span class="number">2768</span>  <span class="number">2768</span> I sysui_multi_action: [<span class="number">757</span>,<span class="number">803</span>,<span class="number">799</span>,panel_open,<span class="number">802</span>,<span class="number">1</span>]</span><br><span class="line"><span class="number">2768</span>  <span class="number">2768</span> I sysui_multi_action: [<span class="number">757</span>,<span class="number">1328</span>,<span class="number">758</span>,<span class="number">4</span>,<span class="number">1326</span>,<span class="number">29</span>,<span class="number">1327</span>,<span class="number">0</span>,<span class="number">1329</span>,<span class="number">0</span>]</span><br><span class="line"><span class="number">1810</span>  <span class="number">3004</span> I notification_visibility: [-<span class="number">1</span>|android|<span class="number">55</span>|<span class="literal">null</span>|<span class="number">1000</span>,<span class="number">1</span>,<span class="number">457483196</span>,<span class="number">457483196</span>,<span class="number">0</span>,<span class="number">4</span>]</span><br><span class="line"><span class="number">1810</span>  <span class="number">3004</span> I notification_visibility: [<span class="number">0</span>|com.android.systemui|<span class="number">10005</span>|<span class="literal">null</span>|<span class="number">10132</span>,<span class="number">1</span>,<span class="number">97168545</span>,<span class="number">97168545</span>,<span class="number">0</span>,<span class="number">2</span>]</span><br><span class="line"><span class="number">1810</span>  <span class="number">3004</span> I notification_visibility: [<span class="number">0</span>|com.android.systemui|<span class="number">2147483647</span>|ranker_group|<span class="number">10132</span>|ranker_group,<span class="number">1</span>,<span class="number">97168236</span>,<span class="number">97168236</span>,<span class="number">0</span>,<span class="number">1</span>]</span><br><span class="line"><span class="number">1810</span>  <span class="number">3004</span> I notification_visibility: [-<span class="number">1</span>|com.android.systemui|<span class="number">10006</span>|<span class="literal">null</span>|<span class="number">10132</span>,<span class="number">1</span>,<span class="number">82586063</span>,<span class="number">82586063</span>,<span class="number">0</span>,<span class="number">0</span>]</span><br></pre></td></tr></table></figure><h2 id="Notification-Panel-Collapse-Log"><a href="#Notification-Panel-Collapse-Log" class="headerlink" title="Notification Panel Collapse Log"></a>Notification Panel Collapse Log</h2><figure class="highlight java"><table><tr><td class="gutter"><pre><span class="line">1</span><br><span class="line">2</span><br><span class="line">3</span><br><span class="line">4</span><br><span class="line">5</span><br></pre></td><td class="code"><pre><span class="line"><span class="number">2768</span>  <span class="number">2768</span> I sysui_multi_action: [<span class="number">757</span>,<span class="number">111</span>,<span class="number">758</span>,<span class="number">2</span>]</span><br><span class="line"><span class="number">1810</span>  <span class="number">5473</span> I notification_visibility: [-<span class="number">1</span>|android|<span class="number">55</span>|<span class="literal">null</span>|<span class="number">1000</span>,<span class="number">0</span>,<span class="number">457546516</span>,<span class="number">457546516</span>,<span class="number">0</span>,<span class="number">4</span>]</span><br><span class="line"><span class="number">1810</span>  <span class="number">5473</span> I notification_visibility: [<span class="number">0</span>|com.android.systemui|<span class="number">10005</span>|<span class="literal">null</span>|<span class="number">10132</span>,<span class="number">0</span>,<span class="number">97231865</span>,<span class="number">97231865</span>,<span class="number">0</span>,<span class="number">2</span>]</span><br><span class="line"><span class="number">1810</span>  <span class="number">5473</span> I notification_visibility: [<span class="number">0</span>|com.android.systemui|<span class="number">2147483647</span>|ranker_group|<span class="number">10132</span>|ranker_group,<span class="number">0</span>,<span class="number">97231557</span>,<span class="number">97231557</span>,<span class="number">0</span>,<span class="number">1</span>]</span><br><span class="line"><span class="number">1810</span>  <span class="number">5473</span> I notification_visibility: [-<span class="number">1</span>|com.android.systemui|<span class="number">10006</span>|<span class="literal">null</span>|<span class="number">10132</span>,<span class="number">0</span>,<span class="number">82649384</span>,<span class="number">82649384</span>,<span class="number">0</span>,<span class="number">0</span>]</span><br></pre></td></tr></table></figure><h2 id="App-Launch-Log"><a href="#App-Launch-Log" class="headerlink" title="App Launch Log"></a>App Launch Log</h2><figure class="highlight java"><table><tr><td class="gutter"><pre><span class="line">1</span><br><span class="line">2</span><br><span class="line">3</span><br><span class="line">4</span><br><span class="line">5</span><br><span class="line">6</span><br><span class="line">7</span><br><span class="line">8</span><br><span class="line">9</span><br><span class="line">10</span><br><span class="line">11</span><br><span class="line">12</span><br><span class="line">13</span><br><span class="line">14</span><br><span class="line">15</span><br><span class="line">16</span><br><span class="line">17</span><br><span class="line">18</span><br><span class="line">19</span><br><span class="line">20</span><br><span class="line">21</span><br><span class="line">22</span><br><span class="line">23</span><br><span class="line">24</span><br><span class="line">25</span><br><span class="line">26</span><br><span class="line">27</span><br><span class="line">28</span><br></pre></td><td class="code"><pre><span class="line"><span class="comment">// Create Task</span></span><br><span class="line"><span class="number">1810</span>  <span class="number">5473</span> I wm_task_created: [<span class="number">100</span>,-<span class="number">1</span>]</span><br><span class="line"><span class="number">1810</span>  <span class="number">5473</span> I wm_stack_created: <span class="number">100</span></span><br><span class="line"><span class="number">1810</span>  <span class="number">5473</span> I wm_create_task: [<span class="number">0</span>,<span class="number">100</span>]</span><br><span class="line"></span><br><span class="line"><span class="comment">// Create Activity</span></span><br><span class="line"><span class="number">1810</span>  <span class="number">5473</span> I wm_create_activity: [<span class="number">0</span>,<span class="number">231348670</span>,<span class="number">100</span>,com.androidperformance.memoryfix/.MainActivity,android.intent.action.MAIN,NULL,NULL,<span class="number">270532608</span>]</span><br><span class="line"></span><br><span class="line"><span class="comment">// Launcher goes through pause flow</span></span><br><span class="line"><span class="number">1810</span>  <span class="number">5473</span> I wm_pause_activity: [<span class="number">0</span>,<span class="number">93093883</span>,com.xxx.launcher/.Launcher,userLeaving=<span class="literal">true</span>]</span><br><span class="line"><span class="number">0615</span> <span class="number">20615</span> I wm_on_top_resumed_lost_called: [<span class="number">93093883</span>,com.xxx.launcher.Launcher,topStateChangedWhenResumed]</span><br><span class="line"><span class="number">0615</span> <span class="number">20615</span> I wm_on_paused_called: [<span class="number">93093883</span>,com.xxx.launcher.Launcher,performPause]</span><br><span class="line"><span class="number">1810</span>  <span class="number">3720</span> I wm_add_to_stopping: [<span class="number">0</span>,<span class="number">93093883</span>,com.xxx.launcher/.Launcher,makeInvisible]</span><br><span class="line"></span><br><span class="line"><span class="comment">// Start Activity</span></span><br><span class="line"><span class="number">1810</span>  <span class="number">2045</span> I am_proc_start: [<span class="number">0</span>,<span class="number">18803</span>,<span class="number">10263</span>,com.androidperformance.memoryfix,pre-top-activity,&#123;com.androidperformance.memoryfix/com.androidperformance.memoryfix.MainActivity&#125;]</span><br><span class="line"><span class="number">1810</span>  <span class="number">3428</span> I am_proc_bound: [<span class="number">0</span>,<span class="number">18803</span>,com.androidperformance.memoryfix]</span><br><span class="line"><span class="number">1810</span>  <span class="number">3428</span> I wm_restart_activity: [<span class="number">0</span>,<span class="number">231348670</span>,<span class="number">100</span>,com.androidperformance.memoryfix/.MainActivity]</span><br><span class="line"><span class="number">1810</span>  <span class="number">3428</span> I wm_set_resumed_activity: [<span class="number">0</span>,com.androidperformance.memoryfix/.MainActivity,minimalResumeActivityLocked]</span><br><span class="line"><span class="number">8803</span> <span class="number">18803</span> I wm_on_create_called: [<span class="number">231348670</span>,com.androidperformance.memoryfix.MainActivity,performCreate]</span><br><span class="line"><span class="number">8803</span> <span class="number">18803</span> I wm_on_start_called: [<span class="number">231348670</span>,com.androidperformance.memoryfix.MainActivity,handleStartActivity]</span><br><span class="line"><span class="number">8803</span> <span class="number">18803</span> I wm_on_resume_called: [<span class="number">231348670</span>,com.androidperformance.memoryfix.MainActivity,RESUME_ACTIVITY]</span><br><span class="line"><span class="number">8803</span> <span class="number">18803</span> I wm_on_top_resumed_gained_called: [<span class="number">231348670</span>,com.androidperformance.memoryfix.MainActivity,topStateChangedWhenResumed]</span><br><span class="line"><span class="number">1810</span>  <span class="number">2034</span> I wm_activity_launch_time: [<span class="number">0</span>,<span class="number">231348670</span>,com.androidperformance.memoryfix/.MainActivity,<span class="number">471</span>]</span><br><span class="line"></span><br><span class="line"><span class="comment">// Launcher goes through stop flow</span></span><br><span class="line"><span class="number">1810</span>  <span class="number">1978</span> I wm_stop_activity: [<span class="number">0</span>,<span class="number">93093883</span>,com.xxx.launcher/.Launcher]</span><br><span class="line"><span class="number">0615</span> <span class="number">20615</span> I wm_on_stop_called: [<span class="number">93093883</span>,com.xxx.launcher.Launcher,STOP_ACTIVITY_ITEM]</span><br></pre></td></tr></table></figure><h2 id="Window-Focus-Related-Flows"><a href="#Window-Focus-Related-Flows" class="headerlink" title="Window Focus Related Flows"></a>Window Focus Related Flows</h2><figure class="highlight java"><table><tr><td class="gutter"><pre><span class="line">1</span><br><span class="line">2</span><br><span class="line">3</span><br><span class="line">4</span><br><span class="line">5</span><br><span class="line">6</span><br><span class="line">7</span><br><span class="line">8</span><br><span class="line">9</span><br><span class="line">10</span><br><span class="line">11</span><br><span class="line">12</span><br><span class="line">13</span><br><span class="line">14</span><br></pre></td><td class="code"><pre><span class="line"><span class="comment">// App launch from Launcher, focus change: Launcher =&gt; null =&gt; App</span></span><br><span class="line">WindowManager: Changing focus from Window&#123;b0416d7 u0 com.xxx.launcher/com.xxx.launcher.Launcher&#125; to <span class="literal">null</span>,diplayid=<span class="number">0</span></span><br><span class="line">WindowManager: Changing focus from <span class="literal">null</span> to Window&#123;10f5145 u0 com.android.settings/com.android.settings.Settings&#125;,diplayid=<span class="number">0</span></span><br><span class="line"></span><br><span class="line"><span class="comment">// Return to Launcher from App, focus change: App =&gt; null =&gt; Launcher</span></span><br><span class="line">WindowManager: Changing focus from Window&#123;10f5145 u0 com.android.settings/com.android.settings.Settings&#125; to <span class="literal">null</span>,diplayid=<span class="number">0</span></span><br><span class="line">WindowManager: Changing focus from <span class="literal">null</span> to Window&#123;b0416d7 u0 com.xxx.launcher/com.xxx.launcher.Launcher&#125;,diplayid=<span class="number">0</span></span><br><span class="line"></span><br><span class="line"><span class="comment">// Enter Lockscreen from App interface: focus change: App =&gt; null =&gt; Lockscreen</span></span><br><span class="line">WindowManager: Changing focus from Window&#123;10f5145 u0 com.android.settings/com.android.settings.Settings&#125; to <span class="literal">null</span>,diplayid=<span class="number">0</span></span><br><span class="line">WindowManager: Changing focus from <span class="literal">null</span> to Window&#123;82e5f30 u0 NotificationShade&#125;,diplayid=<span class="number">0</span></span><br><span class="line"></span><br><span class="line"><span class="comment">// Unlock from Lockscreen interface to App, focus change: Lockscreen =&gt; App</span></span><br><span class="line">WindowManager: Changing focus from Window&#123;82e5f30 u0 NotificationShade&#125; to Window&#123;10f5145 u0 com.android.settings/com.android.settings.Settings&#125;,diplayid=<span class="number">0</span></span><br></pre></td></tr></table></figure><h1 id="ANR-Related-Information-Sharing"><a href="#ANR-Related-Information-Sharing" class="headerlink" title="ANR Related Information Sharing"></a>ANR Related Information Sharing</h1><ol><li><a href="https://mp.weixin.qq.com/s?__biz=MzI1MzYzMjE0MQ==&mid=2247487203&idx=1&sn=182584b69910c843ae95f60e74127249&chksm=e9d0c501dea74c178e16f95a2ffc5007c5dbca89a02d56895ed9b05883cf0562da689ac6146b&token=2044639920&lang=zh_CN&scene=21#wechat_redirect">Xigua Video Stability Governance System Construction 1: Tailor Principle and Practice</a></li><li><a href="https://mp.weixin.qq.com/s/RF3m9_v5bYTYbwY-d1RloQ">Xigua Video Stability Governance System Construction 2: Raphael Principle and Practice</a></li><li><a href="https://mp.weixin.qq.com/s?__biz=MzI1MzYzMjE0MQ==&mid=2247489902&idx=1&sn=bfdf9f48dc6dc973722b5dcab9cd5882&chksm=e9d0d28cdea75b9ad255eb5de227240d2e6f0e9d66e562d3f49cf69f8ed4127c9954ef21bb6d&scene=178&cur_album_id=1833937688379310087#rd">Xigua Video Stability Governance System Construction 3: Sliver Principle and Practice</a></li><li><a href="https://mp.weixin.qq.com/s?__biz=MzI1MzYzMjE0MQ==&mid=2247489949&idx=1&sn=01948c047c0ce203956a3cf81dd20e83&chksm=e9d0d27fdea75b697e70a665b4c6912a8081649700766cf007a7b75d420a57089fe06d2e85b0&scene=178&cur_album_id=1833937688379310087#rd">Xigua Freeze &amp; ANR Optimization Governance and Monitoring System Construction</a></li><li><a href="https://mp.weixin.qq.com/s?__biz=MzI1MzYzMjE0MQ==&mid=2247488116&idx=1&sn=fdf80fa52c57a3360ad1999da2a9656b&chksm=e9d0d996dea750807aadc62d7ed442948ad197607afb9409dd5a296b16fb3d5243f9224b5763&scene=178&cur_album_id=1780091311874686979#rd">Toutiao ANR Optimization Practice Series - Design Principle and Influencing Factors</a></li><li><a href="https://mp.weixin.qq.com/s?__biz=MzI1MzYzMjE0MQ==&mid=2247488182&idx=1&sn=6337f1b51d487057b162064c3e24c439&chksm=e9d0d954dea75042193ed09f30eb8ba0acd93870227c5d33b33361b739a03562afb685df9215&scene=178&cur_album_id=1780091311874686979#rd">Toutiao ANR Optimization Practice Series - Monitoring Tools and Analysis Ideas</a></li><li><a href="https://mp.weixin.qq.com/s?__biz=MzI1MzYzMjE0MQ==&mid=2247488243&idx=1&sn=1f948e0ef616c6dfe54513a2a94357be&chksm=e9d0d911dea75007f36b3701b51842b9fa40969fe8175c2cb4aecf96793504602c574945d636&scene=178&cur_album_id=1780091311874686979#rd">Toutiao ANR Optimization Practice Series - Example Analysis Collection</a></li><li><a href="https://mp.weixin.qq.com/s?__biz=MzI1MzYzMjE0MQ==&mid=2247488314&idx=1&sn=559e52288ae2730a580fcd550f22d895&chksm=e9d0d8d8dea751ceecb715d472796f0c678a9358abf91eb279cdb0576329595e87531e221438&scene=178&cur_album_id=1780091311874686979#rd">Toutiao ANR Optimization Practice Series - Barrier Causes Main Thread Deadlock</a></li><li><a href="https://mp.weixin.qq.com/s?__biz=MzI1MzYzMjE0MQ==&mid=2247488558&idx=1&sn=27dda3c3630116d37ab56a8c7bdf1382&chksm=e9d0dfccdea756daed46b340fb8021b57ea8cc300e58bdb59f0305f8290704984308a089bf2d&scene=178&cur_album_id=1780091311874686979#rd">Toutiao ANR Optimization Practice Series - Goodbye, SharedPreference Waiting</a></li><li><a href="https://mp.weixin.qq.com/s/40T6ITvJNWR8F42530k4DA">Android ANR | Principle Analysis and Common Cases</a></li></ol><h1 id="Reference"><a href="#Reference" class="headerlink" title="Reference"></a>Reference</h1><ol><li><a href="https://duanqz.github.io/2015-10-12-ANR-Analysis#1-%E6%A6%82%E8%A7%88">https://duanqz.github.io/2015-10-12-ANR-Analysis#1-%E6%A6%82%E8%A7%88</a></li><li><a href="https://duanqz.github.io/2015-10-12-ANR-Analysis">https://duanqz.github.io/2015-10-12-ANR-Analysis</a></li><li><a href="http://gityuan.com/2016/12/02/app-not-response/">http://gityuan.com/2016/12/02/app-not-response/</a></li><li><a href="http://gityuan.com/2017/01/01/input-anr/">http://gityuan.com/2017/01/01/input-anr/</a></li><li><a href="https://xiaozhuanlan.com/topic/5097486132">https://xiaozhuanlan.com/topic/5097486132</a></li></ol><h1 id="About-Me-amp-amp-Blog"><a href="#About-Me-amp-amp-Blog" class="headerlink" title="About Me &amp;&amp; Blog"></a>About Me &amp;&amp; Blog</h1><p>Below is a personal introduction and related links. I look forward to communicating with you all!</p><ol><li><a href="https://www.androidperformance.com/about/">Blogger Personal Introduction</a>: Contains personal WeChat and WeChat group links.</li><li><a href="https://androidperformance.com/2019/12/01/BlogMap/">Blog Content Navigation</a>: A navigation of personal blog content.</li><li><a href="https://androidperformance.com/2018/05/07/Android-performance-optimization-skills-and-tools/">Excellent Blog Articles Collected and Organized by Individuals - Must-Know for Android Performance Optimization</a>: Welcome everyone to recommend yourself and recommend (WeChat private chat is fine)</li><li><a href="https://www.androidperformance.com/2023/12/30/the-performance/">Android Performance Optimization Knowledge Planet</a>: Welcome to join, thanks for support~</li></ol><blockquote><p><strong>One person can go faster, a group of people can go further</strong></p></blockquote>]]></content>
    
    
    <summary type="html">&lt;p&gt;This is the second article in the Android App ANR series, focusing on ANR analysis methodology and key logs. The series includes:&lt;/p&gt;
&lt;ol&gt;
&lt;li&gt;&lt;a href=&quot;https://www.androidperformance.com/en/2025/02/08/Android-ANR-01-ANR-Design/&quot;&gt;Android App ANR Series 1: Understanding Android ANR Design Philosophy&lt;/a&gt;&lt;/li&gt;
&lt;li&gt;&lt;a href=&quot;https://www.androidperformance.com/en/2025/02/08/Android-ANR-02-How-to-analysis-ANR/&quot;&gt;Android App ANR Series 2: ANR Analysis Methodology and Key Logs&lt;/a&gt;&lt;/li&gt;
&lt;li&gt;&lt;a href=&quot;https://www.androidperformance.com/en/2025/02/08/Android-ANR-03-ANR-Case-Share/&quot;&gt;Android App ANR Series 3: ANR Case Studies&lt;/a&gt;&lt;/li&gt;
&lt;/ol&gt;</summary>


    <category term="Java" scheme="https://androidperformance.com/en/categories/Java/"/>
    
    
    <category term="Android" scheme="https://androidperformance.com/en/tags/Android/"/>
    
    <category term="Systrace" scheme="https://androidperformance.com/en/tags/Systrace/"/>
    
    <category term="Startup" scheme="https://androidperformance.com/en/tags/Startup/"/>
    
    <category term="Memory" scheme="https://androidperformance.com/en/tags/Memory/"/>
    
    <category term="ANR" scheme="https://androidperformance.com/en/tags/ANR/"/>
    
  </entry>
  
  <entry>
    <title>Android ANR Series 1: Understanding Android ANR Design Philosophy</title>
    <link href="https://androidperformance.com/en/2025/02/08/Android-ANR-01-ANR-Design/"/>
    <id>https://androidperformance.com/en/2025/02/08/Android-ANR-01-ANR-Design/</id>
    <published>2025-02-08T08:28:17.000Z</published>
    <updated>2026-05-10T23:29:51.053Z</updated>
    
    <content type="html"><![CDATA[<p>This is the first article in the Android App ANR series, mainly analyzing the design philosophy of Android ANR from a system perspective. The series directory is as follows:</p><ol><li><a href="/en/2025/02/08/Android-ANR-01-ANR-Design/">Android App ANR Series 1: Understanding Android ANR Design Philosophy</a></li><li><a href="/en/2025/02/08/Android-ANR-02-How-to-analysis-ANR/">Android App ANR Series 2: ANR Analysis Routines and Key Log Introduction</a></li><li><a href="/en/2025/02/08/Android-ANR-03-ANR-Case-Share/">Android App ANR Series 3: ANR Case Sharing</a></li></ol><span id="more"></span><p>First clarify how the ANR evidence entry points have changed. The mechanism is still main-thread, component, or input-event timeout, but the analysis flow should not revolve around the old <code>traces.txt</code> file alone. Start from Android Vitals or field monitoring to understand ANR type and impact. For local reproduction or test devices, collect bugreports, <code>/data/anr/anr_*</code>, EventLog, and system&#x2F;main logs. On Android 11 (API 30)+, use <code>ApplicationExitInfo</code> to query historical exit reasons and ANR information. If CPU scheduling, Binder, lock waits, I&#x2F;O, or rendering are suspected, capture Perfetto&#x2F;System Trace and align the stack snapshot with timeline evidence.</p><h1 id="1-Universality-and-Complexity-of-ANR"><a href="#1-Universality-and-Complexity-of-ANR" class="headerlink" title="1. Universality and Complexity of ANR"></a>1. Universality and Complexity of ANR</h1><p>In the Android ecosystem, Application Not Responding (<code>ANR</code>) is not only a common challenge for developers but also a core embodiment of system design philosophy. Although <code>ANR</code> is often simplified as a synonym for “time-consuming operations on the main thread,” this superficial understanding is far from enough to reveal the essence of the problem. In fact, the root cause of <code>ANR</code> lies in the complex synergy between Android’s multi-process architecture, event distribution, and resource scheduling mechanisms. Its essence is a comprehensive manifestation of strict constraints and monitoring imposed by the system on application behavior.</p><p>Android explicitly characterizes <code>ANR</code> as an application-layer problem, which is in sharp contrast to <code>SNR</code> (System Not Responding). <code>SNR</code> refers to the loss of responsiveness of system processes (such as <code>system_server</code>), usually relying on the Watchdog mechanism to monitor the status of key system threads; while <code>ANR</code> relies on the message scheduling mechanism, where the system process uses a carefully designed timeout model to track the responsiveness of the application’s main thread. This distinction reflects the governance strategies adopted by the system for problems at different levels:</p><ul><li><strong>SNR</strong> focuses on ensuring the survival of core system services, adopting an active polling monitoring method;</li><li><strong>ANR</strong> focuses on the real-time response of application processes, judging through an event-driven asynchronous detection mechanism.</li></ul><p>From the perspective of system architecture, the <code>ANR</code> mechanism is mainly implemented at the system layer (i.e., in the <code>system_server</code> process). Its core lies in building a cross-process event monitoring system. When an application process initiates an operation request (such as starting <code>Activity</code>, processing application broadcasts, etc.) to system services through <code>Binder</code>, the system will synchronize the start of a timeout timer; and for asynchronous operations such as input events, <code>InputDispatcher</code> will establish an event channel with the window through <code>socket</code>, and start timeout detection after the event is dispatched. This layered monitoring design fully reflects the differentiated processing strategies adopted by Android for different task types.</p><p>The deep significance of the <code>ANR</code> mechanism lies in balancing openness and system controllability. As an open platform, Android allows applications to freely apply for hardware resources (such as <code>CPU</code>, <code>IO</code>, <code>memory</code>, etc.), but strict rules must be used to prevent the abnormal behavior of a single application from spreading to the entire system. When a timeout event is detected, the system initiates a multi-dimensional circuit breaker mechanism: first, force-terminate the problematic process to release key system resources (such as preventing it from occupying the <code>Binder</code> thread pool or file descriptors), thereby avoiding cascading failures; at the same time, the system will freeze the process state and collect key information such as <code>CPU</code> usage, thread stacks, and memory snapshots, writing this data to ANR trace files. Older versions commonly used <code>/data/anr/traces.txt</code>, while newer devices and bugreports more often expose event-specific <code>/data/anr/anr_*</code> files. Even more cleverly, the system hands over the final operation right to the user through a user-visible pop-up window, which not only avoids the risk of misjudgment caused by automated processing but also maintains the continuity of human-computer interaction. This design combining “fault isolation - scene protection - user decision” fully demonstrates Android’s wisdom in balancing technical rigor and user experience friendliness.</p><hr><h1 id="2-Core-Design-Philosophy-of-ANR"><a href="#2-Core-Design-Philosophy-of-ANR" class="headerlink" title="2. Core Design Philosophy of ANR"></a>2. Core Design Philosophy of ANR</h1><h2 id="Essence-of-ANR-System-Level-Monitoring-and-Mandatory-Intervention"><a href="#Essence-of-ANR-System-Level-Monitoring-and-Mandatory-Intervention" class="headerlink" title="Essence of ANR: System-Level Monitoring and Mandatory Intervention"></a>Essence of ANR: System-Level Monitoring and Mandatory Intervention</h2><p>The ANR mechanism constitutes a deep-seated stability defense system in the Android system architecture. Its core lies in building a global safety net independent of application status through <strong>cross-layer collaborative monitoring</strong> and <strong>asynchronous decision isolation</strong>. This design is far from simple timeout detection, but is deeply rooted in the organic combination of the Linux process sandbox mechanism and the Android component architecture. System processes (such as <code>system_server</code>) conduct comprehensive monitoring of component lifecycles and input event flows through two core modules: <code>ActivityManagerService</code> (AMS) and <code>InputManagerService</code> (IMS). Due to this layered architecture, monitoring logic is decoupled from business logic. Even if the main thread of the target application is completely blocked, the system can still rely on independent threads for timeout adjudication, fundamentally avoiding the risk of “monitor being dragged down by the monitored object.”</p><p>At the implementation level, ANR fully embodies the essence of <strong>event-driven system design</strong>. For example, in component-type ANR scenarios, when AMS dispatches cross-process tasks to application processes through <code>Binder</code>, the system synchronizes the start of a countdown timer (such as a 20-second threshold for <code>Service</code> startup). This “bomb planting” mechanism essentially transforms asynchronous tasks into synchronous contracts with timeout constraints. After the application process completes the task, it must actively “defuse the bomb” through the <code>Binder</code> callback. Otherwise, the system will intervene to collect scene information (such as main thread stacks) and trigger user interaction. The entire process is dominated by the system process, and the application only exists as an event responder, ensuring the absolute authority of monitoring.</p><p>Task dispatch relies on <code>Binder</code> synchronous calls to ensure atomicity. At the same time, AMS pushes timeout detection messages into the message queue through a dedicated <code>Handler</code>, thereby monitoring the execution of tasks within the specified time. This design not only ensures the integrity of tasks during cross-process communication but also quickly triggers circuit breaker processing after timeouts.</p><hr><h2 id="Component-Class-ANR-Global-Protection-Logic-for-Asynchronous-Tasks"><a href="#Component-Class-ANR-Global-Protection-Logic-for-Asynchronous-Tasks" class="headerlink" title="Component-Class ANR: Global Protection Logic for Asynchronous Tasks"></a>Component-Class ANR: Global Protection Logic for Asynchronous Tasks</h2><p>The monitoring logic of component-class ANR revolves around <code>ActivityManagerService</code> (AMS). Its essence is to realize full-link tracking of the asynchronous task lifecycle through the three-stage model of <strong>task dispatch – callback – circuit breaker</strong>. When the system dispatches a task to an application via <code>Binder</code> cross-process communication (such as starting a <code>Service</code>), AMS synchronizes the start of a timeout detection mechanism: using <code>MainHandler</code> to send delayed messages for precise timing. Taking <code>Service</code> startup as an example, when AMS calls <code>scheduleCreateService()</code> of <code>IApplicationThread</code>, it starts the corresponding timeout monitoring (default 20 seconds). If the application does not notify AMS via the <code>serviceDoneExecuting()</code> callback within the specific time, an ANR determination is triggered.</p><p>Developers need to pay special attention to the <strong>timing trap of cross-process callbacks</strong>: even if the asynchronous task is completed in a sub-thread, if the <code>Binder</code> callback is delayed due to main thread message queue blocking (such as excessive calls to <code>runOnUiThread</code>), the system will still judge it as ANR.</p><p><code>ProcessStateRecord</code> introduced in <strong>Android 14+</strong> has made a finer division of process states. It not only records the status of main thread message processing in detail but also monitors background tasks and suspended states in real-time, thereby reducing the false positive rate and providing developers with richer debugging information.</p><p>The key to this design lies in the <strong>decoupling of synchronous transactions and asynchronous circuit breaking</strong>. Task dispatch relies on <code>Binder</code> synchronous calls to ensure atomicity, while timeout detection executes asynchronously via the <code>Handler</code> message mechanism, avoiding blocking the system main thread.</p><p>When ANR is triggered, the system executes a multi-dimensional circuit breaker strategy:</p><ol><li><p><strong>Scene Collection</strong><br>The system collects key data such as main thread stack information, CPU usage, and process status, and writes it to ANR trace files. Older articles usually mention <code>/data/anr/traces.txt</code>; on newer devices and in bugreports, event-specific <code>/data/anr/anr_*</code> files are more common. At the same time, the system uses <code>ProcessCpuTracker</code> to record detailed CPU usage statistics, providing a basis for subsequent problem analysis.</p></li><li><p><strong>Resource Isolation</strong><br>The system ensures the real-time nature of circuit breaker decisions through the scheduling priority adjustment mechanism of <code>ProcessRecord</code>, ensuring that ANR processing flows can be executed in a timely manner even under high system load.</p></li><li><p><strong>Diagnostic Data Collection</strong><br>The system provides the <code>ApplicationExitInfo</code> API, allowing developers to query historical ANR records, including occurrence time, process status, exception stacks, and other detailed information. These data are extremely important for problem reproduction and root cause analysis.</p></li></ol><p>It is worth sensing that <strong>Android 15</strong> imposes stricter constraints on background services: foreground services must complete initialization and call <code>startForeground()</code> within 3 seconds, otherwise the system will directly trigger ANR. Specifically, the system manages this timeout mechanism via internal attributes (such as <code>persist.sys.fgs_timeout</code>) and API parameters (such as AMS internal parameters controlling foreground service startup timeouts). Developers can refer to the latest API documentation to understand these changes, ensuring that strictly response time limits are met when designing services.</p><p>The system also provides a variety of tools to support the diagnosis and analysis of ANR problems:</p><ul><li><strong>System Log Collection</strong>: Developers can obtain ANR stack information and system reports via <code>adb</code> commands, which contain detailed system status at the time of the problem.</li><li><strong>Performance Analysis Tools</strong>: Android Studio’s CPU Profiler can monitor application performance in real-time, helping developers discover potential performance issues.</li><li><strong>System-Level Analysis</strong>: Perfetto provides powerful system-level performance analysis capabilities to help developers understand complex performance issues.</li></ul><p>Through this multi-level monitoring and protection mechanism, the Android system ensures the reliability of application response performance and provides developers with a complete problem diagnosis toolchain. Developers need to deeply understand these mechanisms, fully consider performance factors in application design, follow system lifecycle contracts, reasonably manage main thread load, and ensure timely response of key callbacks.</p><p>This design philosophy reflects the Android platform’s strict requirements for application quality: promoting developers to build more reliable and responsive applications through clear timeout limits and perfect monitoring mechanisms. At the same time, rich diagnostic tools also provide necessary support for developers, helping them quickly locate and solve problems when they encounter them.</p><hr><h2 id="Input-Class-ANR-Dynamic-Circuit-Breaker-System-for-Event-Distribution"><a href="#Input-Class-ANR-Dynamic-Circuit-Breaker-System-for-Event-Distribution" class="headerlink" title="Input-Class ANR: Dynamic Circuit Breaker System for Event Distribution"></a>Input-Class ANR: Dynamic Circuit Breaker System for Event Distribution</h2><p>The monitoring mechanism for input-class ANR is more complex. Its core challenge lies in balancing <strong>high real-time requirements</strong> and <strong>resource efficiency</strong>. From hardware event generation to application main thread processing, the input system builds an efficient and controllable event distribution link through three major components: <code>EventHub</code>, <code>InputReader</code>, and <code>InputDispatcher</code>.</p><ul><li><p><strong>Event Reading Layer</strong> (<code>EventHub</code>)<br><code>EventHub</code> uses Linux’s <code>epoll</code> mechanism to listen to <code>/dev/input</code> device nodes, supporting concurrent listening of multiple devices, and implementing zero idle CPU consumption through an event-driven model (rather than polling). When a hardware interrupt is triggered, the system receives raw input data via inotify and encapsulates it as a <code>RawEvent</code>.</p></li><li><p><strong>Event Preprocessing</strong> (<code>InputReader</code>)<br><code>InputReader</code> performs device-related preprocessing (such as touch calibration) on raw data through specific <code>InputMappers</code> and converts it into standard input events (such as <code>MotionEvent</code> or <code>KeyEvent</code>). At the same time, necessary event filtering is performed based on device type and configuration to ensure data quality.</p></li><li><p><strong>Event Distribution Layer</strong> (<code>InputDispatcher</code>)<br>The core responsibility of <code>InputDispatcher</code> is to determine the current focus window and push events to the application process through <code>InputChannel</code> based on Unix Domain Socket. It uses a multiplexing mechanism to efficiently manage multiple <code>InputChannels</code> and relies on <code>WindowManagerService</code> to obtain the latest window focus information, ensuring events are accurately delivered to the target window.</p></li></ul><p>The input ANR mechanism relies on continuous tracking and timeout determination of event status. Its core lies in the design of <strong>queue status management</strong> and <strong>cross-thread collaboration capability</strong>:</p><ul><li><code>inboundQueue</code>: Stores events to be distributed received from <code>InputReader</code></li><li><code>outboundQueues</code>: Output queues maintained for each connection, tracking events that have been distributed but have not received completion responses via <code>waitQueue</code></li><li><code>waitQueue</code>: Records events that have been distributed but have not yet received processing confirmation from the application side.</li></ul><p>After an event is distributed, the system tracks its processing status through the <code>MonitoredTimeout</code> mechanism. The default timeout includes 5000 milliseconds (adjustable via system properties). Timeout detection adopts an event-driven mode, triggered when new events arrive, application callbacks complete, or periodic heartbeat checks occur. Once a timeout is detected, the system notifies <code>ActivityManagerService</code> via <code>WindowManagerService</code> and collects diagnostic data including <code>InputDispatcher</code> status and application process information, subsequently potentially triggering ANR pop-ups and process restart flows.</p><p>The entire input system adopts an optimized thread model design:</p><ul><li><code>InputReaderThread</code> focuses on event reading and preprocessing</li><li><code>InputDispatcherThread</code> is responsible for event distribution and timeout monitoring</li></ul><p>The two achieve efficient inter-thread communication through lock-free queues, ensuring that even if the main thread of an application process is blocked, system-level input processing can still operate normally, thereby effectively preventing problem spread.</p><p>For developers, special attention should be paid to the responsiveness of the main thread to avoid performing time-consuming operations in input event processing callbacks. At the same time, understanding the layered design of the input system helps to improve the efficiency of the event processing link from a holistic perspective during performance optimization.</p><hr><h2 id="No-Focused-Window-Class-ANR"><a href="#No-Focused-Window-Class-ANR" class="headerlink" title="No Focused Window Class ANR"></a>No Focused Window Class ANR</h2><p>No Focused Window ANR is another important unresponsive scenario in the input system. Its essence lies in the abnormal window focus state, leading to the correct distribution of input events being impossible. Unlike regular input timeouts, this type of ANR reflects coordination issues between the WindowManager subsystem and the input system.</p><p>In the design of <code>WindowManagerService</code> (WMS), window focus management is an independent and complex subsystem. When the user interface changes (such as Activity switching or dialog popping up), the system triggers a series of window transaction operations: first execute <code>relayoutWindow</code> on the old window to remove the focus flag, then execute <code>addWindow</code> for the new window and grant focus. These state changes are synchronized in real-time via <code>WindowManagerPolicy</code> to <code>InputDispatcher</code>, ensuring input events can be routed to the current focus window.</p><p>Acquisition and loss of focus are triggered by various system behaviors. For example:</p><ul><li><strong>Focus Acquisition</strong>: New Activity finishes starting and displays the first frame, <code>Dialog</code> or <code>PopupWindow</code> pops up, touching window area in split-screen mode, restoring application from background task switcher, foreground application resumes after unlocking.</li><li><strong>Focus Loss</strong>: Activity covered by full-screen Activity, user presses <code>Home</code> key, system pops up key level <code>Dialog</code> such as permission request, application enters background, device lock screen, etc.</li></ul><p>No Focused Window ANR is often related to abnormal window lifecycle management. The most common situation is that during Activity switching, due to the delayed execution of <code>handleResumeActivity</code> of the target Activity, the system cannot determine a legal focus window within a certain period of time. Unlike input timeout ANR, input timeout means the target window exists but fails to process the event in time, while No Focused Window ANR means the system cannot find a suitable event receiver. Based on this difference, the system adopts different protection strategies for these two situations: for input timeout, the system triggers ANR after a default of 5 seconds; for no focus window situations, if the target window cannot be found after consecutive event distributions, the system will start the ANR process faster.</p><p>From the perspective of application development, the code paths affecting focus switching are relatively limited, mainly involving links such as Activity lifecycle callbacks, window addition&#x2F;removal, and input event processing. Even if problems occur in these links (such as main thread blocking), they usually trigger regular ANR rather than No Focused Window ANR. Therefore, when encountering such problems, more attention should be paid to system-level indicators such as overall system resource usage status, CPU load of the <code>system_server</code> process, and <code>Binder</code> call delays between system services, rather than purely focusing on code optimization of a certain application. This is also the fundamental reason why No Focused Window ANR is often regarded as a system performance problem rather than an application quality problem.</p><hr><h2 id="Unifying-Principles-of-System-Design"><a href="#Unifying-Principles-of-System-Design" class="headerlink" title="Unifying Principles of System Design"></a>Unifying Principles of System Design</h2><p>Whether it is component-class ANR or Input-class ANR, their monitoring mechanisms follow the following core principles:</p><ol><li><strong>State Traceability</strong><br>Precisely track task progress through queues (such as <code>waitQueue</code>) and timers (such as <code>Handler</code> in AMS), ensuring the system always grasps the latest status of application behavior.</li><li><strong>Fault Isolation</strong><br>Terminate the problematic process quickly after timeout to prevent local faults from spreading into system-level avalanches.</li><li><strong>User Control Fallback</strong><br>Ensure users always have the final right of operation through pop-up prompts and process termination mechanisms, even if the application internals are completely out of control.</li><li><strong>Developer Constraint</strong><br>Mandate that the main thread remains lightweight and asynchronous in design, promoting application architecture that fits the system design philosophy better.</li></ol><p>From an architectural perspective, the ANR mechanism is the Android system’s final answer to <strong>controllability of an open ecosystem</strong>—it allows developers to innovate freely while defining behavioral boundaries through rigid rules. This balance is not only reflected in technical implementation but also profoundly affects the performance optimization culture of the entire Android application.</p><h1 id="Global-Resolution-and-Active-Defense-of-ANR-Problems"><a href="#Global-Resolution-and-Active-Defense-of-ANR-Problems" class="headerlink" title="Global Resolution and Active Defense of ANR Problems"></a>Global Resolution and Active Defense of ANR Problems</h1><p>The complexity of ANR problems requires us to have both <strong>technical depth</strong> and <strong>system global view</strong> within the analysis framework, and use progressive logic to transform fragmented phenomena into an evolvable cognitive system. This method is not just simple directory layering, but uses cross-validation of multi-dimensional perspectives to establish a complete mapping relationship from microscopic code defects to macroscopic system constraints.</p><hr><h2 id="From-Phenomenon-to-Root-Cause-Dissecting-ANR-Problems-Layer-by-Layer"><a href="#From-Phenomenon-to-Root-Cause-Dissecting-ANR-Problems-Layer-by-Layer" class="headerlink" title="From Phenomenon to Root Cause: Dissecting ANR Problems Layer by Layer"></a>From Phenomenon to Root Cause: Dissecting ANR Problems Layer by Layer</h2><p>Building a vertical analysis path follows the chain logic of <strong>“Phenomenon → Mechanism → Support → Resource”</strong>. Its goal is to clarify the complete chain from the ANR pop-up seen by users to hardware resource problems:</p><ol><li><p><strong>Mechanism Appearance (ANR Pop-up)</strong><br>As the outermost phenomenon visible to users, the ANR pop-up is actually the system’s final judgment on the fault—it does not reveal specific root causes, but only displays results. Developers often stop at the level of viewing stack logs and looking for main thread blocking points, but this is like only observing volcanic eruptions while ignoring the fundamental driving factors of crustal movement.</p></li><li><p><strong>System Implementation (AMS&#x2F;InputDispatcher)</strong><br>Delving into the system service layer, hidden behind the ANR pop-up is AMS’s <code>appNotResponding</code> trigger flow. AMS tracks component lifecycles through the <code>Binder</code> transaction state machine, while <code>InputDispatcher</code> monitors input response using <code>socket</code> event streams. Analysis at this layer reveals the <strong>difference in timeout determination logic</strong>: AMS adopts synchronous blocking detection (e.g., <code>BroadcastQueue</code> timeout calculation), while <code>InputDispatcher</code> utilizes an asynchronous non-blocking model based on <code>epoll</code> to implement event loop monitoring.</p></li><li><p><strong>Underlying Support (Binder&#x2F;Scheduler)</strong><br>Efficient operation of system services relies on core mechanisms of the Linux kernel. The <code>Binder</code> driver implements cross-process communication through memory mapping, and its thread pool scheduling strategy (e.g., <code>BINDER_MAX_POOL_THREADS</code> threshold limit) directly affects transaction processing capability; while the system’s fair scheduling mechanism determines whether the main thread can obtain execution resources in time through dynamic allocation of CPU time slices. The key at this layer is to analyze the contradiction between fairness and real-time performance of resource allocation—for example, to ensure fairness of multi-tasking, the system may allow CPU-intensive tasks of background processes to preempt the response time of foreground applications.</p></li><li><p><strong>Hardware Resources (CPU&#x2F;IO&#x2F;Memory)</strong><br>Ultimately, all software behaviors are limited by physical hardware. The out-of-order execution of the CPU may lead to randomness in lock contention problems; disk I&#x2F;O latency will amplify main thread blocking during <code>SharedPreferences</code> writing; memory bandwidth contention may prevent <code>RenderThread</code> from obtaining texture data in time. This layer requires establishing an <strong>association model between hardware indicators and software behaviors</strong>, such as using the <code>perf</code> tool to analyze the correlation between CPU cache hit rate and ANR trigger frequency.</p></li></ol><p>This vertical deepening is not linear progression, but a process of <strong>cyclic verification</strong>: when hardware layer analysis finds memory bandwidth bottlenecks, it is necessary to backtrack to the <code>Binder</code> driver layer to check if frequent cross-process communication causes memory copy storms, and finally optimize data transmission mechanisms at the system service layer.</p><hr><h2 id="From-Passive-Response-to-Active-Defense-Three-Steps-for-ANR-Governance"><a href="#From-Passive-Response-to-Active-Defense-Three-Steps-for-ANR-Governance" class="headerlink" title="From Passive Response to Active Defense: Three Steps for ANR Governance"></a>From Passive Response to Active Defense: Three Steps for ANR Governance</h2><p>The evolution path of methodology—**”Diagnosis → Tracking → Prediction → Design”** reflects the transition of technical cognitive maturity. Specific steps include:</p><ol><li><p><strong>Stack Analysis</strong><br>Traditional ANR analysis relies on thread stacks in <code>traces.txt</code>, which is essentially a static snapshot when a fault occurs. When a problem is caused by sporadic race conditions (such as instantaneous saturation of the <code>Binder</code> thread pool), the stack may show a normal <code>NativePollOnce</code> state and cannot reveal the true resource contention process. At this time, <strong>multi-time point stack comparison technology</strong> needs to be introduced to identify thread state migration patterns by comparing stack changes within 5 seconds before and after ANR.</p></li><li><p><strong>Dynamic Tracking</strong><br>Using millisecond-level event tracking capabilities provided by tools such as <code>systrace</code> and <code>perfetto</code>, one can monitor the event processing cycle of the main thread <code>Looper</code> and quantify the execution time of <code>dispatchMessage</code>; combined with <code>binder_transaction</code> events in the <code>Binder</code> driver, heat maps of cross-process calls can be drawn. The core value of dynamic tracking lies in <strong>revealing hidden time correlations</strong>, such as discovering that input event delays often follow immediately after <code>SharedPreferences</code> disk write operations.</p></li><li><p><strong>Machine Learning Prediction</strong><br>When the root cause of ANR involves interaction of multiple subsystems (such as coupling effects of CPU scheduling, memory reclamation, and I&#x2F;O load), traditional methods struggle to handle high-dimensional data. By collecting over 20 indicators such as thread status, <code>Binder</code> interaction data, and CPU contention situations, and using machine learning algorithms to build analysis models, ANR types (such as main thread blocking, IPC deadlocks, or resource contention) can be automatically identified. Google has applied similar technology in Android Vitals to achieve cloud-based aggregated analysis of ANR root causes.</p></li><li><p><strong>Architectural Preventive Design</strong><br>The ultimate goal is to internalize system constraints from the code design stage, for example:</p><ul><li><strong>Communication Topology Constraints</strong>: Limit cross-process call levels, avoid chain calls of <code>A → B → C</code>, and use event bus broadcast patterns instead.</li><li><strong>Resource Budget Management</strong>: Allocate <code>Binder</code> transaction quotas for each business module, and automatically downgrade when exceeding thresholds.</li><li><strong>Asynchronous Boundary Reinforcement</strong>: Use <code>HandlerThread</code> and <code>Executor</code> to strictly isolate synchronous and asynchronous operations to prevent thread model confusion.</li></ul></li></ol><p>This evolutionary path from passive response to active defense not only provides effective strategies for preventing ANR from the root cause but also provides developers with rich diagnostic tools and optimization ideas.</p><h1 id="ANR-Related-Material-Sharing"><a href="#ANR-Related-Material-Sharing" class="headerlink" title="ANR Related Material Sharing"></a>ANR Related Material Sharing</h1><ol><li><a href="https://juejin.cn/post/6864555867023343623">Reflection | Design and Implementation of Android Input System &amp; ANR Mechanism</a></li><li><a href="https://mp.weixin.qq.com/s/RF3m9_v5bYTYbwY-d1RloQ">Xigua Video Stability Governance System Construction 1: Tailor Principle and Practice</a> (Note: Links simplified&#x2F;corrected for formatting)</li><li><a href="https://mp.weixin.qq.com/s/RF3m9_v5bYTYbwY-d1RloQ">Xigua Video Stability Governance System Construction 2: Raphael Principle and Practice</a></li><li><a href="https://mp.weixin.qq.com/s/RF3m9_v5bYTYbwY-d1RloQ">Xigua Video Stability Governance System Construction 3: Sliver Principle and Practice</a></li><li><a href="https://mp.weixin.qq.com/s/RF3m9_v5bYTYbwY-d1RloQ">Xigua Stutter &amp; ANR Optimization Governance and Monitoring System Construction</a></li><li><a href="https://mp.weixin.qq.com/s/RF3m9_v5bYTYbwY-d1RloQ">Toutiao ANR Optimization Practice Series - Design Principle and Influencing Factors</a></li><li><a href="https://mp.weixin.qq.com/s/RF3m9_v5bYTYbwY-d1RloQ">Toutiao ANR Optimization Practice Series - Monitoring Tools and Analysis Ideas</a></li><li><a href="https://mp.weixin.qq.com/s/RF3m9_v5bYTYbwY-d1RloQ">Toutiao ANR Optimization Practice Series - Instance Analysis Collection</a></li><li><a href="https://mp.weixin.qq.com/s/RF3m9_v5bYTYbwY-d1RloQ">Toutiao ANR Optimization Practice Series - Barrier Causes Main Thread Deadlock</a></li><li><a href="https://mp.weixin.qq.com/s/RF3m9_v5bYTYbwY-d1RloQ">Toutiao ANR Optimization Practice Series - Farewell to SharedPreference Waiting</a></li><li><a href="https://mp.weixin.qq.com/s/40T6ITvJNWR8F42530k4DA">Android ANR | Principle Analysis and Common Cases</a></li></ol><h1 id="References"><a href="#References" class="headerlink" title="References"></a>References</h1><ol><li><a href="https://duanqz.github.io/2015-10-12-ANR-Analysis#1-%E6%A6%82%E8%A7%88">https://duanqz.github.io/2015-10-12-ANR-Analysis#1-%E6%A6%82%E8%A7%88</a></li><li><a href="https://duanqz.github.io/2015-10-12-ANR-Analysis">https://duanqz.github.io/2015-10-12-ANR-Analysis</a></li><li><a href="http://gityuan.com/2016/12/02/app-not-response/">http://gityuan.com/2016/12/02/app-not-response/</a></li><li><a href="http://gityuan.com/2017/01/01/input-anr/">http://gityuan.com/2017/01/01/input-anr/</a></li><li><a href="https://xiaozhuanlan.com/topic/5097486132">https://xiaozhuanlan.com/topic/5097486132</a></li></ol><h1 id="About-Me-amp-amp-Blog"><a href="#About-Me-amp-amp-Blog" class="headerlink" title="About Me &amp;&amp; Blog"></a>About Me &amp;&amp; Blog</h1><p>Below are personal introduction and related links. I hope to communicate more with everyone in the industry. If three people walk together, there must be one who can be my teacher!</p><ol><li><a href="/en/about/">Blogger Personal Introduction</a>: There are personal WeChat and WeChat group links inside.</li><li><a href="/en/2019/12/01/BlogMap/">This Blog Content Navigation</a>: A navigation of personal blog content.</li><li><a href="/en/2018/05/07/Android-performance-optimization-skills-and-tools/">Excellent blog articles organized and collected by individuals - A must-know for Android efficiency optimization</a>: Everyone is welcome to recommend themselves and recommend others (WeChat private chat is fine)</li><li><a href="/en/2023/12/30/the-performance/">Android Performance Optimization Knowledge Planet</a>: Welcome to join, thanks for your support~</li></ol><blockquote><p><strong>One person can go faster, a group of people can go further</strong></p></blockquote><p><img src="/en/images/WechatIMG581.webp" alt="WeChat Scan"></p>]]></content>
    
    
    <summary type="html">&lt;p&gt;This is the first article in the Android App ANR series, mainly analyzing the design philosophy of Android ANR from a system perspective. The series directory is as follows:&lt;/p&gt;
&lt;ol&gt;
&lt;li&gt;&lt;a href=&quot;/en/2025/02/08/Android-ANR-01-ANR-Design/&quot;&gt;Android App ANR Series 1: Understanding Android ANR Design Philosophy&lt;/a&gt;&lt;/li&gt;
&lt;li&gt;&lt;a href=&quot;/en/2025/02/08/Android-ANR-02-How-to-analysis-ANR/&quot;&gt;Android App ANR Series 2: ANR Analysis Routines and Key Log Introduction&lt;/a&gt;&lt;/li&gt;
&lt;li&gt;&lt;a href=&quot;/en/2025/02/08/Android-ANR-03-ANR-Case-Share/&quot;&gt;Android App ANR Series 3: ANR Case Sharing&lt;/a&gt;&lt;/li&gt;
&lt;/ol&gt;</summary>


    <category term="Android" scheme="https://androidperformance.com/en/categories/Android/"/>
    
    
    <category term="Android" scheme="https://androidperformance.com/en/tags/Android/"/>
    
    <category term="Perfetto" scheme="https://androidperformance.com/en/tags/Perfetto/"/>
    
    <category term="Startup" scheme="https://androidperformance.com/en/tags/Startup/"/>
    
    <category term="Memory" scheme="https://androidperformance.com/en/tags/Memory/"/>
    
    <category term="ANR" scheme="https://androidperformance.com/en/tags/ANR/"/>
    
  </entry>
  
  <entry>
    <title>Android Perfetto Series 3: Familiarizing with the Perfetto View</title>
    <link href="https://androidperformance.com/en/2024/05/21/Android-Perfetto-03-how-to-analysis-perfetto/"/>
    <id>https://androidperformance.com/en/2024/05/21/Android-Perfetto-03-how-to-analysis-perfetto/</id>
    <published>2024-05-20T23:30:23.000Z</published>
    <updated>2026-05-10T23:29:51.057Z</updated>
    
    <content type="html"><![CDATA[<p>This is the third article in the Perfetto series. The first two articles introduced what Perfetto is and how to capture Perfetto Trace. This article simply introduces how to look at the complex Perfetto information after opening Perfetto Trace on the web side.</p><p>With Google announcing the deprecation of the Systrace tool and the release of Perfetto, Perfetto has basically replaced Systrace in my daily work. At the same time, major manufacturers like OPPO and Vivo have also switched from Systrace to Perfetto. Many friends who are new to Android performance optimization feel a headache when facing the dazzling interface and complex functions of Perfetto. They hope that I can present those previous Systrace articles using Perfetto.</p><span id="more"></span><h2 id="Table-of-Contents"><a href="#Table-of-Contents" class="headerlink" title="Table of Contents"></a>Table of Contents</h2><ul><li><a href="#series">Perfetto Series Catalog</a></li><li><a href="#view">Perfetto View Interface</a></li><li><a href="#trace">Perfetto Trace Interface</a></li><li><a href="#ops">Basic Operations</a></li><li><a href="#tips">Perfetto Usage Tips</a></li><li><a href="#summary">Summary</a></li><li><a href="#about">About Me &amp;&amp; Blog</a></li></ul><p>Paul Graham said: “<strong>Either give a lot of people something they kind of want, or give a small number of people something they really want.</strong>“ Perfetto is actually something that a small number of people really want, so let’s start writing. I welcome everyone to exchange and communicate. If you find errors or inaccurate descriptions, please inform me in time, and I will modify them in time to avoid misleading others.</p><p>This series aims to examine the overall operation of the Android system from a new perspective through the tool Perfetto. In addition, it also aims to provide a different angle to learn key modules such as App, Framework, and Linux. Although you may have read many articles about Android Framework, App, and performance optimization, you may still feel confused because it is difficult to remember the code or understand its running process. Through the graphical tool Perfetto, you may gain a deeper understanding.</p><p><a id="series"></a></p><h1 id="Perfetto-Series-Catalog"><a href="#Perfetto-Series-Catalog" class="headerlink" title="Perfetto Series Catalog"></a>Perfetto Series Catalog</h1><ol><li><a href="https://www.androidperformance.com/en/2024/03/27/Android-Perfetto-101/">Android Perfetto Series Catalog</a></li><li><a href="https://www.androidperformance.com/en/2024/05/21/Android-Perfetto-01-What-is-perfetto/">Android Perfetto Series 1: Introduction to Perfetto</a></li><li><a href="https://www.androidperformance.com/en/2024/05/21/Android-Perfetto-02-how-to-get-perfetto/">Android Perfetto Series 2: Capturing Perfetto Traces</a></li><li><a href="https://www.androidperformance.com/en/2024/05/21/Android-Perfetto-03-how-to-analysis-perfetto/">Android Perfetto Series 3: Familiarizing with the Perfetto View</a></li><li><a href="https://www.androidperformance.com/en/2025/02/08/Android-Perfetto-04-Open-Big-Trace-With-Command-Line/">Android Perfetto Series 4: Opening Large Traces via Command Line</a></li><li><a href="https://www.androidperformance.com/en/2025/03/26/Android-Perfetto-05-Chorergrapher/">Android Perfetto Series 5: Choreographer-based Rendering Flow</a></li><li><a href="https://www.androidperformance.com/en/2025/04/26/Android-Perfetto-06-Why-120Hz/">Android Perfetto Series 6: Why 120Hz? Advantages and Challenges</a></li><li><a href="https://www.androidperformance.com/en/2025/08/02/Android-Perfetto-07-MainThread-And-RenderThread/">Android Perfetto Series 7: MainThread and RenderThread Deep Dive</a></li><li><a href="https://www.androidperformance.com/en/2025/08/05/Android-Perfetto-08-Vsync/">Android Perfetto Series 8: Understanding Vsync and Performance Analysis</a></li><li><a href="https://www.androidperformance.com/en/2025/11/12/Android-Perfetto-09-CPU/">Android Perfetto Series 9: Interpreting CPU Information</a></li><li><a href="https://www.androidperformance.com/2025/11/16/Android-Perfetto-10-Binder/">Android Perfetto Series 10: Binder Scheduling and Lock Contention</a></li><li><a href="https://www.bilibili.com/video/BV1oi82efE4D/">Video (Bilibili) - Android Perfetto Basics and Case Studies</a></li><li><a href="https://www.bilibili.com/video/BV17A6bBLECu/">Video (Bilibili) - Android Perfetto: Trace Graph Types - AOSP, WebView, Flutter + OEM System Optimization</a></li></ol><p>If you haven’t seen the Systrace series yet, here is the portal:</p><ol><li><a href="https://www.androidperformance.com/2019/05/26/Android_Systrace_0/#/%E7%B3%BB%E5%88%97%E6%96%87%E7%AB%A0%E7%9B%AE%E5%BD%95">Systrace Series Catalog</a>: Systematically introduced the use of Systrace, the predecessor of Perfetto, and used Systrace to learn and understand the basic rules of Android performance optimization and Android system operation.</li><li><a href="https://www.androidperformance.com/">Personal Blog</a>: Personal blog, mainly content related to Android, and also put some content related to life and work.</li></ol><p>Welcome everyone to join the WeChat group or Planet on the <a href="https://www.androidperformance.com/about/">About Me</a> page to discuss your problems, the parts about Perfetto you most want to see, and discuss all Android development related content with group friends.</p><p><a id="view"></a></p><h1 id="Perfetto-View-Interface"><a href="#Perfetto-View-Interface" class="headerlink" title="Perfetto View Interface"></a>Perfetto View Interface</h1><p>After capturing the Perfetto Trace, it is generally opened in <a href="https://ui.perfetto.dev/">ui.perfetto.dev</a> (if you use the script provided by the official, it will open automatically on this website after capturing, you can check the source code of the script if you want to see how to implement it). The interface after opening is as follows:</p><p><img src="/en/images/Android-Perfetto-03-how-to-analysis-perfetto/2dceb8bd-7825-42e0-8a6b-4c241684f60e.webp" alt="Perfetto View Interface"></p><p>You can open Trace by Open trace file or dragging Perfetto Trace directly to the white area.</p><p><a id="trace"></a></p><h1 id="Perfetto-Trace-Interface"><a href="#Perfetto-Trace-Interface" class="headerlink" title="Perfetto Trace Interface"></a>Perfetto Trace Interface</h1><p>The interface after opening Perfetto Trace is as follows:</p><p><img src="/en/images/Android-Perfetto-03-how-to-analysis-perfetto/d8549610-92e4-41c1-a3ee-4a2c9258e223.webp" alt="Trace Operation Area"></p><p>Roughly, the Perfetto Trace interface can be divided into four areas:</p><ol><li><strong>The rightmost operation area</strong>: The most important thing here is the few under the Current Trace column that will be used frequently.<ol><li>Show timeline: Display current Trace, after switching to other interfaces, click this again to return to the Trace View interface</li><li>Query: Place to write SQL query statements and view execution results</li><li>Metrics: Some analysis results written by the official by default, you can choose to open directly</li><li>Info and stats: Some information about the current Trace and mobile App</li></ol></li><li><strong>Information and operation area at the top</strong>: The most important thing is to look at the time.</li><li><strong>Trace content area in the middle</strong>: The area with the most operations. Trace content is all in this part. The top few parts are divided into an area from the perspective of function, such as CPU area (can view which core the current Task is running on, what is the frequency, how long it runs, who woke it up), Ftrace event area, etc.; the following part is displayed in units of App Process (including App’s various threads, Input events, Binder Call, Memory, Buffer and other information).</li><li><strong>Information area at the bottom</strong>: This area mainly displays various information. After we select a certain Task segment, the information related to this Task will be displayed here (if you add Log, Log will also be displayed here; ftrace event is similar).</li></ol><p>When viewing the Perfetto interface at first, it will feel very messy and flashy, but after getting used to it, it is really delicious ~</p><p><a id="ops"></a></p><h1 id="Basic-Operations"><a href="#Basic-Operations" class="headerlink" title="Basic Operations"></a>Basic Operations</h1><p>The operation of the Perfetto Trace interface is very smooth, which is a huge advantage compared to Systrace. Systrace will be laggy when opening a slightly larger Trace, but Perfetto Trace is still very smooth when opening a 500Mb Trace.</p><p>The shortcut keys for watching Trace are very similar to Systrace. w&#x2F;s is to zoom in&#x2F;zoom out, a&#x2F;d is to move left&#x2F;right, and mouse click is to select. The official document in the lower left corner has detailed operation instructions. If you forget, you can check it at any time. Practice makes perfect:</p><p><img src="/en/images/Android-Perfetto-03-how-to-analysis-perfetto/8057095a-cd4f-42f4-a52e-6ae82ca3950a.webp" alt="Basic Operations"></p><p><img src="/en/images/Android-Perfetto-03-how-to-analysis-perfetto/c7409a31-f1eb-4fde-a899-f103005f1c0d.webp" alt="SQL Related Operations"></p><p><img src="/en/images/Android-Perfetto-03-how-to-analysis-perfetto/df9f57b7-6303-4c56-9403-a1b51557e1e2.webp" alt="Other Shortcut Keys"></p><p>Among other shortcut keys, the more confusing ones are:</p><ol><li><p><strong>f</strong> is to zoom in on the selection</p></li><li><p><strong>m</strong> is to temporarily Mark an area (same as Systrace), used to look at time up and down, look at other process information, etc. Temporary means that if you press m to mark another area, the Mark area marked by the previous m will disappear. Exit temporary selection: esc, or select other Slice and press m, the selection effect of this currently Slice will disappear</p><p><img src="/en/images/Android-Perfetto-03-how-to-analysis-perfetto/041fc179-fb2f-4518-95ce-3d9fac8f11e4.webp"></p></li><li><p><strong>shift + m</strong> is to continuously Mark an area (if you don’t click, it won’t disappear), mainly used to Mark a piece of information for a long time. For example, if you Mark all the frame drop points in a Trace, you can use shift + m, so that it will not be lost.</p><p><img src="/en/images/Android-Perfetto-03-how-to-analysis-perfetto/31a72b92-36bd-4411-a529-2f7c6cd9e77d.webp"></p><p>Click on the small flag to see the execution information within this interval<br><img src="/en/images/Android-Perfetto-03-how-to-analysis-perfetto/8e36d592-f351-4277-90e2-e0f2bb852a59.webp"></p></li><li><p><strong>Delete continuous Mark</strong></p><ol><li>Click on the triangle at the top of the Slice you selected</li><li>Select Tab below: Current Selection</li><li>Click Remove on the far right, and you can Remove it<br><img src="/en/images/Android-Perfetto-03-how-to-analysis-perfetto/151a3675-e88c-4d26-a6be-1b43d72ca21a.webp"></li></ol></li><li><p><strong>q</strong>: Hide and show the information Tab. Since Perfetto occupies the screen very much, it is very important to use the q key proficiently. Open it quickly when watching, and close it quickly after watching.</p></li><li><p><strong>Flagging</strong>: Perfetto can also use the method of inserting flags to make marks on Trace. Perfetto supports you to put the mouse on the top of Trace, and a flag will appear. Click the left button to insert a flag on it, which is convenient for us to mark the occurrence of an event, or a certain time point</p></li></ol><p><img src="/en/images/Android-Perfetto-03-how-to-analysis-perfetto/2fbd5ce0-743f-4826-aa51-246ff78964ab.webp"></p><ol start="7"><li><strong>Cancel the inserted flag</strong>: Same as exiting continuous selection, click the flag, there is a Remove in the lower right corner, click to kill this flag, I won’t insert the picture.</li></ol><p><a id="tips"></a></p><h1 id="Perfetto-Usage-Tips"><a href="#Perfetto-Usage-Tips" class="headerlink" title="Perfetto Usage Tips"></a>Perfetto Usage Tips</h1><h2 id="Check-Wakeup-Source"><a href="#Check-Wakeup-Source" class="headerlink" title="Check Wakeup Source"></a>Check Wakeup Source</h2><p>We can check the wake-up source of a Task to understand the operation process of App and Framework. Both Systrace and Perfetto can check the wake-up source, but Perfetto is smoother in this regard.</p><p>In the article <a href="https://www.androidperformance.com/2021/09/13/android-systrace-Responsiveness-in-action-3/#/1-1-%E5%A6%82%E4%BD%95%E5%88%86%E6%9E%90-Sleep-%E7%8A%B6%E6%80%81%E7%9A%84-Task">Android Systrace Response Speed Practice 3: Response Speed Extended Knowledge</a>, I talked about how Systrace checks the wake-up source. In fact, it is still a bit troublesome. Checking the wake-up source in Perfetto is very convenient and the operation is very smooth:</p><p>For example, if we want to see who woke up RenderThread in the details below, we can have several methods:</p><h3 id="Click-Runnable-Status"><a href="#Click-Runnable-Status" class="headerlink" title="Click Runnable Status"></a>Click Runnable Status</h3><p>Like the Systrace operation, click Runnable directly in front of Running, and you can see Related thread states in the information area below:</p><ol><li>Waker: Wake-up source</li><li>Previous state: The previous state of this Task</li><li>Next state: The next state of this Task<br><img src="/en/images/Android-Perfetto-03-how-to-analysis-perfetto/d724e03f-6671-4e86-a461-a339b6e02550.webp"></li></ol><h3 id="Click-the-Running-status-above-it-to-view-continuous-wake-up-information"><a href="#Click-the-Running-status-above-it-to-view-continuous-wake-up-information" class="headerlink" title="Click the Running status above it to view continuous wake-up information:"></a>Click the Running status above it to view continuous wake-up information:</h3><p>Or we can click the Running status, click the small arrow to jump directly to the corresponding CPU Info area, where more detailed information can be seen. You can also click Task continuously to trace the wake-up source, and jump back and forth between the CPU Info area and the Task area through the small arrow in the information area.</p><p>Click the Running status above RenderThread to jump to the CPU Info area via the small arrow<br><img src="/en/images/Android-Perfetto-03-how-to-analysis-perfetto/97f05788-72de-4060-8a30-2d575d59b461.webp"></p><p>RenderThread is woken up by MainThread<br><img src="/en/images/Android-Perfetto-03-how-to-analysis-perfetto/89b71ec9-c057-4346-b9b2-eee9a9e44cab.webp"></p><p>Click MainThread again to see that it is woken up by SurfaceFlinger. There is also a corresponding wake-up delay analysis in the information area below.<br><img src="/en/images/Android-Perfetto-03-how-to-analysis-perfetto/f222b9d1-f59e-46d2-bda9-74495982819d.webp"></p><h2 id="Check-Critical-Path-Task"><a href="#Check-Critical-Path-Task" class="headerlink" title="Check Critical Path (Task)"></a>Check Critical Path (Task)</h2><p>Critical Task refers to the Task that has a dependency relationship with the Task currently selected by us. For example, if our Task is e, e can only be executed after d is executed, d has to wait for c, c has to wait for b, and b has to wait for a, then the Critical Task of e is a, b, c, d.</p><p>Perfetto can verify the Critical Task of a certain Task. Given that Critical path lite is a subset of Critical path, we only introduce Critical path here:</p><p>Click Running status, and then click Critical path in the information area below.<br><img src="/en/images/Android-Perfetto-03-how-to-analysis-perfetto/35f1c5bb-44dd-438e-82a9-a82aabaf7c12.webp"></p><p>Wait for a moment to see the Critical path corresponding to the MainThread we selected:</p><p><img src="/en/images/Android-Perfetto-03-how-to-analysis-perfetto/259f60b3-506b-4808-a66d-784d8caed34b.webp"></p><p>Zooming in, checking at the edge of the MainThread we selected, the first Critical Task is the app thread of sf that woke him up<br><img src="/en/images/Android-Perfetto-03-how-to-analysis-perfetto/d045730a-e0a5-42b4-b185-ac3732063049.webp"></p><p>Looking to the left, the app thread of sf is woken up by the TimerDispatch thread of sf, which is not posted here.</p><p>In fact, it can be seen that the Critical Path provided by Perfetto actually gathers consecutive wake-up Tasks together, which is convenient for us to see the relationship between various Tasks.</p><h2 id="Pin-Fix-to-Top"><a href="#Pin-Fix-to-Top" class="headerlink" title="Pin (Fix to Top)"></a>Pin (Fix to Top)</h2><p>On the far left of each Thread, there is a button like a thumbtack. After clicking, this Thread will be fixed to the top, which is convenient for us to put the Threads we are most concerned about together.</p><p><img src="/en/images/Android-Perfetto-03-how-to-analysis-perfetto/e448681b-f759-4a24-beee-d112c9cffc7a.webp"></p><p>For example, the following is the flow chart from App to SF that I Pin. It will be much clearer if put together, and it will be more convenient to watch frame drops.<br><img src="/en/images/Android-Perfetto-03-how-to-analysis-perfetto/e903fd70-8ea0-47d1-8e3d-48e63155ba9b.webp"></p><h2 id="CPU-Info-Area-Task-Highlight"><a href="#CPU-Info-Area-Task-Highlight" class="headerlink" title="CPU Info Area Task Highlight"></a>CPU Info Area Task Highlight</h2><p>In the CPU Info area, if you put the mouse on a certain Task, other Tasks of the Thread corresponding to this Task will be highlighted.</p><p>We often use this method to preliminarily check the core placement information of certain Threads.</p><p><img src="/en/images/Android-Perfetto-03-how-to-analysis-perfetto/70316722-19e9-4148-a099-781bcb9d49fd.webp"></p><h2 id="Check-Buffer-Consumption-Stats"><a href="#Check-Buffer-Consumption-Stats" class="headerlink" title="Check Buffer Consumption Stats"></a>Check Buffer Consumption Stats</h2><p>The Buffer consumer of App is SurfaceFlinger. Through the Actual Timeline line on the App Process side, we can see specifically which frame of SurfaceFlinger consumed the Buffer.</p><p><img src="/en/images/Android-Perfetto-03-how-to-analysis-perfetto/f6e9bc36-2919-4b15-82cd-1672d18e4c55.webp"></p><h2 id="Quickly-Check-App-Execution-Timeout"><a href="#Quickly-Check-App-Execution-Timeout" class="headerlink" title="Quickly Check App Execution Timeout"></a>Quickly Check App Execution Timeout</h2><p>Due to the existence of Android’s multi-Buffer mechanism, App execution timeout does not necessarily cause stuttering, but timeout requires our attention.</p><p>Through the Expected Timeline and Actual Timeline provided by Perfetto, we can clearly see where execution times out.<br><img src="/en/images/Android-Perfetto-03-how-to-analysis-perfetto/99a89fa4-773a-4f18-b8c7-ee852f9c44eb.webp"></p><p>Click the red section of Actial Timeline, and the information bar at the bottom will display the reason for the frame drop:</p><p><img src="/en/images/Android-Perfetto-03-how-to-analysis-perfetto/450afbdb-e902-4b3f-9941-6ba1dc3cc07a.webp"></p><h2 id="View-Log-on-Perfetto"><a href="#View-Log-on-Perfetto" class="headerlink" title="View Log on Perfetto"></a>View Log on Perfetto</h2><p>Switch to the Android Logs Tab on the information bar. If you put the mouse on a certain line, Perfetto will pull a straight line on the corresponding Timeline, and you can see the time corresponding to this Log.</p><p><img src="/en/images/Android-Perfetto-03-how-to-analysis-perfetto/e33520ff-b50f-4f36-a333-2b8063a5f322.webp"></p><p>Similarly, switching to the Ftrace events tab allows you to check corresponding ftrace event and corresponding timeline.</p><p><img src="/en/images/Android-Perfetto-03-how-to-analysis-perfetto/061c9177-7bfa-44ff-860d-6fe75ad2f93e.webp"></p><h2 id="Analyze-Running-Information-of-Thread"><a href="#Analyze-Running-Information-of-Thread" class="headerlink" title="Analyze Running Information of Thread"></a>Analyze Running Information of Thread</h2><p>You can select a section of area for analysis by holding down the left mouse button and sliding. For example, if you select the CPU State column, you can see the proportion of Running, Runnable, Sleep, and Uninterruptible Sleep corresponding to this period of time.</p><p>This is often used when analyzing App startup.</p><p><img src="/en/images/Android-Perfetto-03-how-to-analysis-perfetto/6725a982-4f6b-48a5-b750-6c34aa5f342c.webp"></p><p><a id="summary"></a></p><h1 id="Summary"><a href="#Summary" class="headerlink" title="Summary"></a>Summary</h1><p>The basic interface and operations of Perfetto are shared above, as well as some relatively commonly used Perfetto tips. Google is currently actively promoting and maintaining Perfetto. Many new functions may pop up someday. I will update them if I think they are useful.</p><p>The basic chapter of Perfetto ends here. The follow-up is to understand the basic process of Android system operation through the tool Perfetto, and use Perfetto and Perfetto SQL to analyze the problems encountered such as performance and power consumption.</p><p><a id="about"></a></p><h1 id="About-Me-amp-amp-Blog"><a href="#About-Me-amp-amp-Blog" class="headerlink" title="About Me &amp;&amp; Blog"></a>About Me &amp;&amp; Blog</h1><p>Here is a personal introduction and related links. I hope to communicate more with my peers. When three people walk together, there must be one who can be my teacher!</p><ol><li><a href="https://www.androidperformance.com/about/">Blogger Personal Introduction</a>: Contains personal WeChat and WeChat group links.</li><li><a href="https://androidperformance.com/2019/12/01/BlogMap/">This Blog Content Navigation</a>: A navigation of personal blog content.</li><li><a href="https://androidperformance.com/2018/05/07/Android-performance-optimization-skills-and-tools/">Personal Collection of Excellent Blog Articles - Android Performance Optimization Must-Know</a>: Welcome everyone to recommend themselves and others (WeChat private chat is fine)</li><li><a href="https://www.androidperformance.com/2023/12/30/the-performance/">Android Performance Optimization Knowledge Planet</a>: Welcome to join, thank you for your support~</li></ol><blockquote><p><strong>One person can go faster, a group of people can go further</strong></p></blockquote><p><img src="/en/images/WechatIMG581.webp" alt="Wechat Scan"></p>]]></content>
    
    
    <summary type="html">&lt;p&gt;This is the third article in the Perfetto series. The first two articles introduced what Perfetto is and how to capture Perfetto Trace. This article simply introduces how to look at the complex Perfetto information after opening Perfetto Trace on the web side.&lt;/p&gt;
&lt;p&gt;With Google announcing the deprecation of the Systrace tool and the release of Perfetto, Perfetto has basically replaced Systrace in my daily work. At the same time, major manufacturers like OPPO and Vivo have also switched from Systrace to Perfetto. Many friends who are new to Android performance optimization feel a headache when facing the dazzling interface and complex functions of Perfetto. They hope that I can present those previous Systrace articles using Perfetto.&lt;/p&gt;</summary>


    <category term="Android" scheme="https://androidperformance.com/en/categories/Android/"/>
    
    
    <category term="Android" scheme="https://androidperformance.com/en/tags/Android/"/>
    
    <category term="Perfetto" scheme="https://androidperformance.com/en/tags/Perfetto/"/>
    
    <category term="Systrace" scheme="https://androidperformance.com/en/tags/Systrace/"/>
    
    <category term="Memory" scheme="https://androidperformance.com/en/tags/Memory/"/>
    
    <category term="Performance" scheme="https://androidperformance.com/en/tags/Performance/"/>
    
  </entry>
  
  <entry>
    <title>Android Perfetto Series 2: Capturing Perfetto Traces</title>
    <link href="https://androidperformance.com/en/2024/05/21/Android-Perfetto-02-how-to-get-perfetto/"/>
    <id>https://androidperformance.com/en/2024/05/21/Android-Perfetto-02-how-to-get-perfetto/</id>
    <published>2024-05-20T23:29:41.000Z</published>
    <updated>2026-05-10T23:29:51.057Z</updated>
    
    <content type="html"><![CDATA[<p>The previous article <a href="https://www.androidperformance.com/en/2024/05/21/Android-Perfetto-01-What-is-perfetto/">Android Perfetto Series 1: Introduction to Perfetto</a> introduced what Perfetto is. This article provides a brief introduction to Perfetto capture.</p><p>With Google announcing the deprecation of the Systrace tool and the release of Perfetto, Perfetto has basically replaced Systrace in my daily work. At the same time, major manufacturers like OPPO and Vivo have also switched from Systrace to Perfetto. Many friends who are new to Android performance optimization feel a headache when facing the dazzling interface and complex functions of Perfetto. They hope that I can present those previous Systrace articles using Perfetto.</p><span id="more"></span><h2 id="Table-of-Contents"><a href="#Table-of-Contents" class="headerlink" title="Table of Contents"></a>Table of Contents</h2><ul><li><a href="#series">Perfetto Series Catalog</a></li><li><a href="#content">Main Content</a></li><li><a href="#cli">1. Using Command Line to Capture Perfetto (Recommended)</a></li><li><a href="#script">2. Using Official Script to Capture</a></li><li><a href="#system-tracing">3. Using On-Device Developer Tools to Capture</a></li><li><a href="#web-record">4. Using Web Interface to Capture</a></li><li><a href="#refs">Reference Documents</a></li><li><a href="#about">About Me &amp;&amp; Blog</a></li></ul><p>Paul Graham said: “<strong>Either give a lot of people something they kind of want, or give a small number of people something they really want.</strong>“ Perfetto is actually something that a small number of people really want, so let’s start writing. I welcome everyone to exchange and communicate. If you find errors or inaccurate descriptions, please inform me in time, and I will modify them in time to avoid misleading others.</p><p>This series aims to examine the overall operation of the Android system from a new perspective through the tool Perfetto. In addition, it also aims to provide a different angle to learn key modules such as App, Framework, and Linux. Although you may have read many articles about Android Framework, App, and performance optimization, you may still feel confused because it is difficult to remember the code or understand its running process. Through the graphical tool Perfetto, you may gain a deeper understanding.</p><p><a id="series"></a></p><h1 id="Perfetto-Series-Catalog"><a href="#Perfetto-Series-Catalog" class="headerlink" title="Perfetto Series Catalog"></a>Perfetto Series Catalog</h1><ol><li><a href="https://www.androidperformance.com/en/2024/03/27/Android-Perfetto-101/">Android Perfetto Series Catalog</a></li><li><a href="https://www.androidperformance.com/en/2024/05/21/Android-Perfetto-01-What-is-perfetto/">Android Perfetto Series 1: Introduction to Perfetto</a></li><li><a href="https://www.androidperformance.com/en/2024/05/21/Android-Perfetto-02-how-to-get-perfetto/">Android Perfetto Series 2: Capturing Perfetto Traces</a></li><li><a href="https://www.androidperformance.com/en/2024/05/21/Android-Perfetto-03-how-to-analysis-perfetto/">Android Perfetto Series 3: Familiarizing with the Perfetto View</a></li><li><a href="https://www.androidperformance.com/en/2025/02/08/Android-Perfetto-04-Open-Big-Trace-With-Command-Line/">Android Perfetto Series 4: Opening Large Traces via Command Line</a></li><li><a href="https://www.androidperformance.com/en/2025/03/26/Android-Perfetto-05-Chorergrapher/">Android Perfetto Series 5: Choreographer-based Rendering Flow</a></li><li><a href="https://www.androidperformance.com/en/2025/04/26/Android-Perfetto-06-Why-120Hz/">Android Perfetto Series 6: Why 120Hz? Advantages and Challenges</a></li><li><a href="https://www.androidperformance.com/en/2025/08/02/Android-Perfetto-07-MainThread-And-RenderThread/">Android Perfetto Series 7: MainThread and RenderThread Deep Dive</a></li><li><a href="https://www.androidperformance.com/en/2025/08/05/Android-Perfetto-08-Vsync/">Android Perfetto Series 8: Understanding Vsync and Performance Analysis</a></li><li><a href="https://www.androidperformance.com/en/2025/11/12/Android-Perfetto-09-CPU/">Android Perfetto Series 9: Interpreting CPU Information</a></li><li><a href="https://www.androidperformance.com/2025/11/16/Android-Perfetto-10-Binder/">Android Perfetto Series 10: Binder Scheduling and Lock Contention</a></li><li><a href="https://www.bilibili.com/video/BV1oi82efE4D/">Video (Bilibili) - Android Perfetto Basics and Case Studies</a></li><li><a href="https://www.bilibili.com/video/BV17A6bBLECu/">Video (Bilibili) - Android Perfetto: Trace Graph Types - AOSP, WebView, Flutter + OEM System Optimization</a></li></ol><p>If you haven’t seen the Systrace series yet, here is the portal:</p><ol><li><a href="https://www.androidperformance.com/2019/05/26/Android_Systrace_0/#/%E7%B3%BB%E5%88%97%E6%96%87%E7%AB%A0%E7%9B%AE%E5%BD%95">Systrace Series Catalog</a>: Systematically introduced the use of Systrace, the predecessor of Perfetto, and used Systrace to learn and understand the basic rules of Android performance optimization and Android system operation.</li><li><a href="https://www.androidperformance.com/">Personal Blog</a>: Personal blog, mainly content related to Android, and also put some content related to life and work.</li></ol><p>Welcome everyone to join the WeChat group or Planet on the <a href="https://www.androidperformance.com/about/">About Me</a> page to discuss your problems, the parts about Perfetto you most want to see, and discuss all Android development related content with group friends.</p><p><a id="content"></a></p><h1 id="Main-Content"><a href="#Main-Content" class="headerlink" title="Main Content"></a>Main Content</h1><p>The steps for using Perfetto to analyze problems are the same as using Systrace:</p><ol><li>First you need to capture the Perfetto file</li><li>Open the Trace file in <a href="https://ui.perfetto.dev/">ui.perfetto.dev</a> for analysis or use the command line for analysis</li></ol><p>This article simply introduces the method of using Perfetto to capture Trace files. Personally, I recommend using the command line to capture. Whether it is a command line configured by yourself or an official command line tool, it is very practical.</p><p><a id="cli"></a></p><h1 id="1-Using-Command-Line-to-Capture-Perfetto-Recommended"><a href="#1-Using-Command-Line-to-Capture-Perfetto-Recommended" class="headerlink" title="1. Using Command Line to Capture Perfetto (Recommended)"></a>1. Using Command Line to Capture Perfetto (Recommended)</h1><h2 id="Basic-Command-adb-shell-perfetto"><a href="#Basic-Command-adb-shell-perfetto" class="headerlink" title="Basic Command - adb shell perfetto"></a>Basic Command - adb shell perfetto</h2><p>For friends who have always used the Systrace tool, capturing Trace via command line is very convenient. Similarly, Perfetto also provides a simple command line to capture, and the simplest usage method is basically consistent with Systrace. You can directly connect to your Android device and use the <code>/system/bin/perfetto</code> command to start tracing. For example:</p><figure class="highlight bash"><table><tr><td class="gutter"><pre><span class="line">1</span><br><span class="line">2</span><br><span class="line">3</span><br><span class="line">4</span><br><span class="line">5</span><br><span class="line">6</span><br><span class="line">7</span><br><span class="line">8</span><br></pre></td><td class="code"><pre><span class="line">// 1. First execute the <span class="built_in">command</span></span><br><span class="line">adb shell perfetto -o /data/misc/perfetto-traces/trace_file.perfetto-trace -t 20s \</span><br><span class="line"> <span class="built_in">sched</span> freq idle am wm gfx view binder_driver hal dalvik camera input res memory</span><br><span class="line"></span><br><span class="line">// 2. Operate the phone to reproduce the scene, such as sliding or launching etc.</span><br><span class="line"></span><br><span class="line">// 3. Pull the trace file to the <span class="built_in">local</span></span><br><span class="line">adb pull /data/misc/perfetto-traces/trace_file.perfetto-trace</span><br></pre></td></tr></table></figure><p>This command will start a 20-second trace, collect user-specified data source information, and save the trace file to <code>/data/misc/perfetto-traces/trace_file.perfetto-trace</code>.</p><p>Execute the adb pull command to pull the trace out, and you can open it directly on <a href="https://ui.perfetto.dev/">ui.perfetto.dev</a>.</p><h2 id="Advanced-Command-adb-shell-perfetto-with-config-file"><a href="#Advanced-Command-adb-shell-perfetto-with-config-file" class="headerlink" title="Advanced Command - adb shell perfetto with config file"></a>Advanced Command - adb shell perfetto with config file</h2><p>This is where Perfetto differs from Systrace. Perfetto can capture a lot of information, and its data sources are also very diverse. It is very inconvenient to add a lot of configurations with the command line every time. At this time, we can use a separate <strong>Configuration File (Config)</strong> to store this information. Each time we capture, we can just specify this configuration file.</p><p>For passing Perfetto configuration files on versions before and after Android 12, here are detailed guides and corresponding command line examples.</p><h3 id="On-Android-12-and-later-devices"><a href="#On-Android-12-and-later-devices" class="headerlink" title="On Android 12 and later devices"></a>On Android 12 and later devices</h3><p>Starting from Android 12, you can directly use the <code>/data/misc/perfetto-configs</code> directory to store configuration files, so you don’t need to pass the configuration file through stdin. The specific command is as follows:</p><figure class="highlight bash"><table><tr><td class="gutter"><pre><span class="line">1</span><br><span class="line">2</span><br></pre></td><td class="code"><pre><span class="line">adb push config.pbtx /data/misc/perfetto-configs/config.pbtx</span><br><span class="line">adb shell perfetto --txt -c /data/misc/perfetto-configs/config.pbtx -o /data/misc/perfetto-traces/trace.perfetto-trace</span><br></pre></td></tr></table></figure><p>In this example, first push the configuration file <code>config.pbtx</code> to the <code>/data/misc/perfetto-configs</code> directory. Then, start tracing directly in the Perfetto command by specifying the path of the configuration file via the <code>-c</code> option.</p><h3 id="On-devices-before-Android-12"><a href="#On-devices-before-Android-12" class="headerlink" title="On devices before Android 12"></a>On devices before Android 12</h3><p>Due to strict SELinux rules, passing the configuration file directly through the file path will fail on non-root devices. Therefore, you need to use standard input (stdin) to pass the configuration file. This can be achieved by <code>cat</code>ing the contents of the configuration file to the Perfetto command. The specific command is as follows:</p><figure class="highlight bash"><table><tr><td class="gutter"><pre><span class="line">1</span><br><span class="line">2</span><br></pre></td><td class="code"><pre><span class="line">adb push config.pbtx /data/local/tmp/config.pbtx</span><br><span class="line">adb shell <span class="string">&#x27;cat /data/local/tmp/config.pbtx | perfetto -c - -o /data/misc/perfetto-traces/trace.perfetto-trace&#x27;</span></span><br></pre></td></tr></table></figure><p>Here, <code>config.pbtx</code> is your Perfetto configuration file. First use the <code>adb push</code> command to push it to the temporary directory of the device. Then, use the <code>cat</code> command to pass the contents of the configuration file to the Perfetto command.</p><h3 id="Source-of-Config"><a href="#Source-of-Config" class="headerlink" title="Source of Config"></a>Source of Config</h3><p>For Config, I suggest using <a href="https://ui.perfetto.dev/#!/record"><strong>Record new trace</strong></a> on <a href="https://ui.perfetto.dev/">ui.perfetto.dev</a> to select and customize, and then save it to a local file. Different scenarios just load different Configs. The last part of the article talks about this in detail, you can take a look if you are interested.</p><p>The official also provides a share button. You can share your own config with others, which is very convenient. At the same time, I will also create a Github library for everyone to share (in progress).</p><p>The official code repository also has some configured ones, you can download and use them yourself: <a href="https://cs.android.com/android/platform/superproject/main/+/main:external/perfetto/test/configs/">https://cs.android.com/android/platform/superproject/main/+/main:external/perfetto/test/configs/</a></p><h2 id="Precautions"><a href="#Precautions" class="headerlink" title="Precautions"></a>Precautions</h2><ul><li><strong>Ensure adb is normal</strong>: Before using these commands, please make sure your device has USB debugging enabled and has been correctly connected via the <code>adb devices</code> command.</li><li><strong>Ctrl+C Interrupt:</strong> When using the <code>adb shell perfetto</code> command, if you try to use Ctrl+C to end the trace early, this signal will not be propagated through ADB. If you need to end tracking early, it is recommended to use an interactive PTY-based session to run <code>adb shell</code>.</li><li><strong>SELinux Restrictions:</strong> On non-root devices before Android 12, due to strict SELinux rules, configuration files can only be passed via <code>cat config | adb shell perfetto -c -</code> (where <code>-c -</code> means read configuration from standard input). Starting from Android 12, the <code>/data/misc/perfetto-configs</code> path can be used to store configuration files.</li><li>On versions before Android 10, adb cannot directly pull <code>/data/misc/perfetto-traces</code> out. You can use <code>adb shell cat /data/misc/perfetto-traces/trace &gt; trace</code> instead.</li></ul><p><a id="script"></a></p><h1 id="2-Using-Perfetto-Official-Script-to-Capture-Strongly-Recommended"><a href="#2-Using-Perfetto-Official-Script-to-Capture-Strongly-Recommended" class="headerlink" title="2. Using Perfetto Official Script to Capture (Strongly Recommended)"></a>2. Using Perfetto Official Script to Capture (Strongly Recommended)</h1><p>The Perfetto team also provides a convenient script <code>tools/record_android_trace</code> that simplifies the process of recording traces from the command line. This script automatically handles path issues, pulls the trace file automatically after tracking is completed, and opens it in the browser. Essentially, this script still uses the adb shell perfetto command, but the official helped you encapsulate it. Usage example:</p><p>On Linux and Mac：</p><figure class="highlight bash"><table><tr><td class="gutter"><pre><span class="line">1</span><br><span class="line">2</span><br><span class="line">3</span><br><span class="line">4</span><br></pre></td><td class="code"><pre><span class="line">curl -O https://raw.githubusercontent.com/google/perfetto/master/tools/record_android_trace</span><br><span class="line"><span class="built_in">chmod</span> u+x record_android_trace</span><br><span class="line">./record_android_trace -o trace_file.perfetto-trace -t 10s -b 64mb \</span><br><span class="line"> <span class="built_in">sched</span> freq idle am wm gfx view binder_driver hal dalvik camera input res memory</span><br></pre></td></tr></table></figure><p>On Windows:</p><figure class="highlight plaintext"><table><tr><td class="gutter"><pre><span class="line">1</span><br><span class="line">2</span><br><span class="line">3</span><br></pre></td><td class="code"><pre><span class="line">curl -O https://raw.githubusercontent.com/google/perfetto/master/tools/record_android_trace</span><br><span class="line">python3 record_android_trace -o trace_file.perfetto-trace -t 10s -b 64mb \</span><br><span class="line">sched freq idle am wm gfx view binder_driver hal dalvik camera input res memory</span><br></pre></td></tr></table></figure><p>Similarly, you can also specify the configuration file via -c here, for example:</p><figure class="highlight bash"><table><tr><td class="gutter"><pre><span class="line">1</span><br><span class="line">2</span><br><span class="line">3</span><br><span class="line">4</span><br></pre></td><td class="code"><pre><span class="line">curl -O https://raw.githubusercontent.com/google/perfetto/master/tools/record_android_trace</span><br><span class="line"><span class="built_in">chmod</span> u+x record_android_trace</span><br><span class="line">./record_android_trace -c config.pbtx -o trace_file.perfetto-trace -t 10s -b 64mb \</span><br><span class="line"> <span class="built_in">sched</span> freq idle am wm gfx view binder_driver hal dalvik camera input res memory</span><br></pre></td></tr></table></figure><p>This will record a 10-second trace and save the output file as <code>trace_file.perfetto-trace</code>.</p><p>After execution, it will automatically capture the Trace and automatically open it in the browser, which is very convenient.<br><img src="/en/images/Android-Perfetto-02-how-to-get-perfetto/ba56ef7e-77c4-4780-b975-33350c224275.webp"></p><p>The script content can be viewed directly by visiting: <a href="https://raw.githubusercontent.com/google/perfetto/master/tools/record_android_trace">https://raw.githubusercontent.com/google/perfetto/master/tools/record_android_trace</a></p><p><a id="system-tracing"></a></p><h1 id="3-Using-On-Device-Developer-Tools-to-Capture"><a href="#3-Using-On-Device-Developer-Tools-to-Capture" class="headerlink" title="3. Using On-Device Developer Tools to Capture"></a>3. Using On-Device Developer Tools to Capture</h1><p>Of course, sometimes there is no way to connect to a computer, or the test content cannot correct USB. At this time, you can use the built-in system tracing application (System Tracing App) on Android to capture Trace. This application is built into the developer options and allows you to configure and start performance tracking in a few simple steps.</p><h2 id="Start-System-Tracing-Application"><a href="#Start-System-Tracing-Application" class="headerlink" title="Start System Tracing Application"></a>Start System Tracing Application</h2><ol><li><p><strong>Enable Developer Options</strong>: First, make sure your device has enabled developer options. If there is no developer option in your settings, you need to find the compilation number in About Phone, and then click 7 times continuously to open the developer options.</p></li><li><p><strong>Open Developer Options</strong>: Find and open developer options in the Settings menu.</p></li><li><p><strong>Start System Tracing</strong>: Scroll down in the developer options until you find “System Trace” or similar options. Click it and the system tracking application will open.</p></li></ol><p>It looks roughly like this (each phone may have differences in interface or text, but the function is the same)<br><img src="/en/images/Android-Perfetto-02-how-to-get-perfetto/bd5cd1ae-c00d-4359-b73a-bf8d822374c0.webp"></p><p>The system trace application provides a series of configuration options, including but not limited to:</p><ul><li><strong>Trace Duration</strong>: You can specify the duration of the trace, such as 10 seconds or longer.</li><li><strong>Data Source</strong>: Select the source from which you want to collect data. This may include multiple different data sources such as CPU, memory, network, etc.</li><li><strong>Output File Location</strong>: Specify the location where the trace file is saved.</li></ul><h2 id="Start-and-Stop-Tracing"><a href="#Start-and-Stop-Tracing" class="headerlink" title="Start and Stop Tracing"></a>Start and Stop Tracing</h2><p>After configuring all the required parameters, you can start tracking by clicking the “Record trace” button. Click the “Record trace” button again to end the capture. After the capture is completed, there will usually be a prompt telling you that the capture has been completed and providing options to view or share the trace file. You can export the trace file to a computer and use the Perfetto web UI for deeper analysis.</p><p><a id="web-record"></a></p><h1 id="4-Using-Web-Interface-to-Capture"><a href="#4-Using-Web-Interface-to-Capture" class="headerlink" title="4. Using Web Interface to Capture"></a>4. Using Web Interface to Capture</h1><blockquote><p>The capture function on the web side is relatively confusing. Many times you will fail to capture, for example, adb cannot be connected, or it says you need to execute kill after connecting. So I recommend everyone to use the configured command line to capture. The web side is more suitable for Config configuration.</p></blockquote><p>Perfetto also provides a powerful <a href="https://ui.perfetto.dev/#!/record">Web Tool (ui.perfetto.dev)</a>, allowing developers to configure and start tracking through the browser. You just need to visit the <a href="https://ui.perfetto.dev/#!/record">website</a>, click “Record new trace”, and then select data sources and configuration parameters as needed. Make sure your device is connected to the computer via ADB, and select “Add ADB device” on the web page. After that, click “Start Recording” to start collecting tracking data.</p><p><img src="/en/images/Android-Perfetto-02-how-to-get-perfetto/0255e95d-ca6b-4a59-9ae9-0b96b4f7347b.webp"></p><p>After selecting the information source you want to capture here, you can click Recording command to view it. Here you can see the specific content of the Config you selected. You can share it or save it to a local file for use when capturing with the command line.</p><p><img src="/en/images/Android-Perfetto-02-how-to-get-perfetto/266e0feb-4c10-4a0d-bc8f-0327341931ea.webp"></p><p>When selecting Config, it is recommended to check Atrace userspace annotations, Event log (logcat), and Frame timeline in the Android apps column (command + a)</p><p><img src="/en/images/Android-Perfetto-02-how-to-get-perfetto/945daf30-f2da-4b0e-882f-e7abb7bdae63.webp"></p><p>In addition, if you want to see the call stack, you can check Callstack sampling in Stack Samples (note that the latest version of Android is required, and the debugged process must be debuggable)</p><p><img src="/en/images/Android-Perfetto-02-how-to-get-perfetto/67e26de4-fb68-4dc6-a747-dbdc58b02402.webp"></p><p><img src="/en/images/Android-Perfetto-02-how-to-get-perfetto/11570ba8-d688-462c-9178-a70b41a8fb76.webp"></p><p>As for the use of others, you can explore it yourself. Subsequent Perfetto articles will also introduce each part and its presentation on Trace to help everyone get started with Perfetto faster.</p><h2 id="Extracting-Parameters-from-Web-Interface"><a href="#Extracting-Parameters-from-Web-Interface" class="headerlink" title="Extracting Parameters from Web Interface"></a>Extracting Parameters from Web Interface</h2><p>As mentioned earlier, the graphical selection of Config on the web side is very convenient. After selection, click Recording command, and you can see the selected Config. When saving, remember to remove the following lines:</p><p><img src="/en/images/Android-Perfetto-02-how-to-get-perfetto/9d3bc292-da9e-4bf4-92fe-bfe9f2717c2e.webp"></p><p><a id="refs"></a></p><h1 id="Reference-Documents"><a href="#Reference-Documents" class="headerlink" title="Reference Documents"></a>Reference Documents</h1><ol><li><a href="https://perfetto.dev/docs/quickstart/android-tracing">https://perfetto.dev/docs/quickstart/android-tracing</a></li><li><a href="https://perfetto.dev/docs/concepts/config">https://perfetto.dev/docs/concepts/config</a></li><li><a href="https://developer.android.com/tools/releases/platform-tools?hl=zh-cn">https://developer.android.com/tools/releases/platform-tools?hl=zh-cn</a></li><li><a href="https://mp.weixin.qq.com/s/nsqc51L5T4mrTUVsPgkj6A">https://mp.weixin.qq.com/s/nsqc51L5T4mrTUVsPgkj6A</a></li><li><a href="https://juejin.cn/post/7344983784549400613">https://juejin.cn/post/7344983784549400613</a></li><li><a href="https://cs.android.com/android/platform/superproject/main/+/main:external/perfetto/test/configs/">https://cs.android.com/android/platform/superproject/main/+/main:external/perfetto/test/configs/</a></li></ol><p><a id="about"></a></p><h1 id="About-Me-amp-amp-Blog"><a href="#About-Me-amp-amp-Blog" class="headerlink" title="About Me &amp;&amp; Blog"></a>About Me &amp;&amp; Blog</h1><p>Here is a personal introduction and related links. I hope to communicate more with my peers. When three people walk together, there must be one who can be my teacher!</p><ol><li><a href="https://www.androidperformance.com/about/">Blogger Personal Introduction</a>: Contains personal WeChat and WeChat group links.</li><li><a href="https://androidperformance.com/2019/12/01/BlogMap/">This Blog Content Navigation</a>: A navigation of personal blog content.</li><li><a href="https://androidperformance.com/2018/05/07/Android-performance-optimization-skills-and-tools/">Personal Collection of Excellent Blog Articles - Android Performance Optimization Must-Know</a>: Welcome everyone to recommend themselves and others (WeChat private chat is fine)</li><li><a href="https://www.androidperformance.com/2023/12/30/the-performance/">Android Performance Optimization Knowledge Planet</a>: Welcome to join, thank you for your support~</li></ol><blockquote><p><strong>One person can go faster, a group of people can go further</strong></p></blockquote><p><img src="/en/images/WechatIMG581.webp" alt="Wechat Scan"></p>]]></content>
    
    
    <summary type="html">&lt;p&gt;The previous article &lt;a href=&quot;https://www.androidperformance.com/en/2024/05/21/Android-Perfetto-01-What-is-perfetto/&quot;&gt;Android Perfetto Series 1: Introduction to Perfetto&lt;/a&gt; introduced what Perfetto is. This article provides a brief introduction to Perfetto capture.&lt;/p&gt;
&lt;p&gt;With Google announcing the deprecation of the Systrace tool and the release of Perfetto, Perfetto has basically replaced Systrace in my daily work. At the same time, major manufacturers like OPPO and Vivo have also switched from Systrace to Perfetto. Many friends who are new to Android performance optimization feel a headache when facing the dazzling interface and complex functions of Perfetto. They hope that I can present those previous Systrace articles using Perfetto.&lt;/p&gt;</summary>


    <category term="Android" scheme="https://androidperformance.com/en/categories/Android/"/>
    
    
    <category term="Android" scheme="https://androidperformance.com/en/tags/Android/"/>
    
    <category term="Perfetto" scheme="https://androidperformance.com/en/tags/Perfetto/"/>
    
    <category term="Systrace" scheme="https://androidperformance.com/en/tags/Systrace/"/>
    
    <category term="Memory" scheme="https://androidperformance.com/en/tags/Memory/"/>
    
    <category term="Performance" scheme="https://androidperformance.com/en/tags/Performance/"/>
    
  </entry>
  
  <entry>
    <title>Android Perfetto Series 1: Introduction to Perfetto</title>
    <link href="https://androidperformance.com/en/2024/05/21/Android-Perfetto-01-What-is-perfetto/"/>
    <id>https://androidperformance.com/en/2024/05/21/Android-Perfetto-01-What-is-perfetto/</id>
    <published>2024-05-20T23:29:22.000Z</published>
    <updated>2026-05-10T23:29:51.056Z</updated>
    
    <content type="html"><![CDATA[<p>This is the first article in the Perfetto series. It mainly provides a brief introduction to the Perfetto tool, including its history, development, and what Perfetto can do.</p><p>With Google announcing the deprecation of the Systrace tool and the release of Perfetto, Perfetto has basically replaced Systrace in my daily work. At the same time, major manufacturers like OPPO and Vivo have also switched from Systrace to Perfetto. Many friends who are new to Android performance optimization feel a headache when facing the dazzling interface and complex functions of Perfetto. They hope that I can present those previous Systrace articles using Perfetto.</p><span id="more"></span><h2 id="Table-of-Contents"><a href="#Table-of-Contents" class="headerlink" title="Table of Contents"></a>Table of Contents</h2><ul><li><a href="#series">Perfetto Series Catalog</a></li><li><a href="#content">Main Content</a></li><li><a href="#godview">Why Performance Analysis Needs a God’s View</a></li><li><a href="#perfetto-intro">Introduction to Perfetto</a></li><li><a href="#vs-systrace">Where it’s not as good as Systrace</a></li><li><a href="#refs">Reference Documents</a></li><li><a href="#about">About Me &amp;&amp; Blog</a></li></ul><p>Paul Graham said: “<strong>Either give a lot of people something they kind of want, or give a small number of people something they really want.</strong>“ Perfetto is actually something that a small number of people really want, so let’s start writing. I welcome everyone to exchange and communicate. If you find errors or inaccurate descriptions, please inform me in time, and I will modify them in time to avoid misleading others.</p><p>This series aims to examine the overall operation of the Android system from a new perspective through the tool Perfetto. In addition, it also aims to provide a different angle to learn key modules such as App, Framework, and Linux. Although you may have read many articles about Android Framework, App, and performance optimization, you may still feel confused because it is difficult to remember the code or understand its running process. Through the graphical tool Perfetto, you may gain a deeper understanding.</p><p><a id="series"></a></p><h1 id="Perfetto-Series-Catalog"><a href="#Perfetto-Series-Catalog" class="headerlink" title="Perfetto Series Catalog"></a>Perfetto Series Catalog</h1><ol><li><a href="https://www.androidperformance.com/en/2024/03/27/Android-Perfetto-101/">Android Perfetto Series Catalog</a></li><li><a href="https://www.androidperformance.com/en/2024/05/21/Android-Perfetto-01-What-is-perfetto/">Android Perfetto Series 1: Introduction to Perfetto</a></li><li><a href="https://www.androidperformance.com/en/2024/05/21/Android-Perfetto-02-how-to-get-perfetto/">Android Perfetto Series 2: Capturing Perfetto Traces</a></li><li><a href="https://www.androidperformance.com/en/2024/05/21/Android-Perfetto-03-how-to-analysis-perfetto/">Android Perfetto Series 3: Familiarizing with the Perfetto View</a></li><li><a href="https://www.androidperformance.com/en/2025/02/08/Android-Perfetto-04-Open-Big-Trace-With-Command-Line/">Android Perfetto Series 4: Opening Large Traces via Command Line</a></li><li><a href="https://www.androidperformance.com/en/2025/03/26/Android-Perfetto-05-Chorergrapher/">Android Perfetto Series 5: Choreographer-based Rendering Flow</a></li><li><a href="https://www.androidperformance.com/en/2025/04/26/Android-Perfetto-06-Why-120Hz/">Android Perfetto Series 6: Why 120Hz? Advantages and Challenges</a></li><li><a href="https://www.androidperformance.com/en/2025/08/02/Android-Perfetto-07-MainThread-And-RenderThread/">Android Perfetto Series 7: MainThread and RenderThread Deep Dive</a></li><li><a href="https://www.androidperformance.com/en/2025/08/05/Android-Perfetto-08-Vsync/">Android Perfetto Series 8: Understanding Vsync and Performance Analysis</a></li><li><a href="https://www.androidperformance.com/en/2025/11/12/Android-Perfetto-09-CPU/">Android Perfetto Series 9: Interpreting CPU Information</a></li><li><a href="https://www.androidperformance.com/2025/11/16/Android-Perfetto-10-Binder/">Android Perfetto Series 10: Binder Scheduling and Lock Contention</a></li><li><a href="https://www.bilibili.com/video/BV1oi82efE4D/">Video (Bilibili) - Android Perfetto Basics and Case Studies</a></li><li><a href="https://www.bilibili.com/video/BV17A6bBLECu/">Video (Bilibili) - Android Perfetto: Trace Graph Types - AOSP, WebView, Flutter + OEM System Optimization</a></li></ol><p>If you haven’t seen the Systrace series yet, here is the portal:</p><ol><li><a href="https://www.androidperformance.com/2019/05/26/Android_Systrace_0/#/%E7%B3%BB%E5%88%97%E6%96%87%E7%AB%A0%E7%9B%AE%E5%BD%95">Systrace Series Catalog</a>: Systematically introduced the use of Systrace, the predecessor of Perfetto, and used Systrace to learn and understand the basic rules of Android performance optimization and Android system operation.</li><li><a href="https://www.androidperformance.com/">Personal Blog</a>: Personal blog, mainly content related to Android, and also put some content related to life and work.</li></ol><p>Welcome everyone to join the WeChat group or Planet on the <a href="https://www.androidperformance.com/about/">About Me</a> page to discuss your problems, the parts about Perfetto you most want to see, and discuss all Android development related content with group friends.</p><p><a id="content"></a></p><h1 id="Main-Content"><a href="#Main-Content" class="headerlink" title="Main Content"></a>Main Content</h1><p>I started writing the Systrace series in 2019, and wrote more than 20 articles one after another, from basic usage to the presentation of various modules on Systrace, to practical combat such as startup speed and fluency. It basically met the needs of junior system developers and App developers for the Systrace tool. Through the blog, I also added many like-minded friends, and there are 6 exchange groups just for communication. Thank you all very much for your support.</p><p>With Google announcing the deprecation of the Systrace tool and the release of Perfetto, Perfetto has basically replaced Systrace in my daily work. At the same time, major manufacturers like OPPO and Vivo have also switched from Systrace to Perfetto. Many friends who are new to Android performance optimization feel a headache when facing the dazzling interface and complex functions of Perfetto. They hope that I can present those previous Systrace articles using Perfetto.</p><p>So there is this series, and I also wrote a few reasons in the Planet why I want to update the Perfetto series (I used to think that the Systrace series was enough):</p><ol><li>Currently, mobile phone manufacturers such as OPPO and Vivo have switched to Perfetto internally. Whether it is capturing Trace or viewing Trace, they are using Perfetto. Many newcomers are exposed to Perfetto instead of Systrace. Keeping the previous old Systrace series will lose this part of the readers.</li><li>The Code corresponding to the previous Systrace series is relatively old. The brand new Perfetto series can use Android 14 Code for updates.</li><li>My personal use of Perfetto is not very deep, and some advanced functions are currently only tasted casually. I can strengthen this part of the content by rewriting the Perfetto series.</li><li>Perfetto is a very powerful tool. Behind it is the entire Android + Linux system. So when writing this series, the focus should be on the Android + Linux behind it, rather than just being limited to the Perfetto tool. Tools are just our way of observing Android + Linux. Understanding the laws of the entire Android system operation, thinking about its operating principles, discovering problems through tools, and thinking about the essence through problems are meaningful to developers.</li><li>Perfetto’s official documentation still does not cover many contents related to Android system operation. I can supplement this part; in addition, the official documentation is in English, and Chinese blogs can supplement this aspect.</li><li>Perfetto can be used as a speech content at Google Dev Best ~.</li></ol><p>Paul Graham said: “<strong>Either give a lot of people something they kind of want, or give a small number of people something they really want.</strong>“ Perfetto is actually something that a small number of people really want, so let’s start writing. I welcome everyone to exchange and communicate. If you find errors or inaccurate descriptions, please inform me in time, and I will modify them in time to avoid misleading others.</p><p><img src="/en/images/Android-Perfetto-01-What-is-perfetto/e3e1da35-179a-457b-a9e1-6f6b91db740e.webp" alt="Perfetto"></p><p><a id="godview"></a></p><h1 id="Why-Performance-Analysis-Needs-a-God’s-View"><a href="#Why-Performance-Analysis-Needs-a-God’s-View" class="headerlink" title="Why Performance Analysis Needs a God’s View"></a>Why Performance Analysis Needs a God’s View</h1><p>Before introducing Perfetto, we need to understand why performance analysis needs tools like Systrace and Perfetto: Taking the Android system as an example, there are many factors affecting performance: the quality of the App itself, the performance of various system modules, the performance of Linux, hardware performance, plus the strategies of various manufacturers, customized functions by manufacturers, the load of the system itself, low memory, heating, differences in various Android versions, user usage habits, etc. The reason cannot be known by analyzing a certain App or a certain module. We need a God’s perspective to look at the operation of the Android system from a higher dimension.</p><p>The Perfetto tool provides such a God’s perspective. Through the God’s perspective, we can see various details of the Android system during operation, such as:</p><ol><li>How Input events flow</li><li>How every frame of the App you are using goes from generation to screen display</li><li>Real-time frequency, load, core placement, wake-up of cpu, etc.</li><li>How various Apps in the system are running</li><li>….</li></ol><p>App developers and Android system developers will also add Trace points at important code logic. After turning on some Debug options, very detailed information can be obtained. Even why a Task is placed on a certain cpu will be recorded in detail. Through the info displayed on Perfetto, we can preliminarily analyze the cause of performance problems, and subsequent analysis will be targeted.</p><p>Also, to illustrate the complexity of performance optimization, you can look at the description of performance in the book &lt;**System Performance**&gt;, specifically the methodology, which fits the theme of this article very well. I also strongly recommend that all students engaged in performance optimization keep this book as a frequent reading methodology book: <strong>System performance engineering is a challenging field due to many reasons, including the fact that system performance is subjective, complex, and often multi-problem.</strong></p><h2 id="Performance-is-Subjective"><a href="#Performance-is-Subjective" class="headerlink" title="Performance is Subjective"></a>Performance is Subjective</h2><ol><li>Technical disciplines are often objective; too many people in the industry view problems as black and white. When troubleshooting software, determining whether a bug exists or whether a bug is fixed is like this. The appearance of a bug is always accompanied by an error message. The error message is usually easy to interpret, and then you understand why the error appeared.</li><li>Unlike this, performance is often subjective. When starting to address performance issues, the judgment of whether the problem exists may be vague. The same is true when the problem is fixed. Performance considered “bad” by one user may be considered “good” by another user.</li></ol><h2 id="The-System-is-Complex"><a href="#The-System-is-Complex" class="headerlink" title="The System is Complex"></a>The System is Complex</h2><ol><li>In addition to subjectivity, performance engineering, as a challenging discipline, is not only because of the complexity of the system, but also because we often lack a clear starting point for analysis regarding performance. Sometimes we just start with guessing, for example, blaming the network, and performance analysis must verify whether this is a correct direction.</li><li>Performance problems may arise from complex interconnections between subsystems, even if these subsystems perform well in isolation. It may also be due to cascading failure, which refers to a faulty component causing performance problems in other components. To understand these problems, you must clarify the relationship between components and understand how they cooperate.</li><li>Bottlenecks are often complex and interconnected in unexpected ways. Fixing a problem may just push the bottleneck to other places in the system, resulting in the overall performance of the system not improving as expected.</li><li>In addition to the complexity of the system, the complex nature of the production environment load may also lead to performance problems. It is difficult to reproduce such situations in a laboratory environment, or they can only be reproduced intermittently.</li><li>Solving complex performance problems often requires a holistic approach. The entire system—including its internal and external interactions—may need to be investigated. This work requires a very wide range of skills, which is generally unlikely to be concentrated in one person, which drives performance engineering to become a varied and intellectually challenging job.</li></ol><h2 id="Multiple-Problems-May-Coexist"><a href="#Multiple-Problems-May-Coexist" class="headerlink" title="Multiple Problems May Coexist"></a>Multiple Problems May Coexist</h2><ol><li>Finding a performance problem point is often not the problem itself. In complex software, there are usually multiple problems.</li><li>Another difficulty in performance analysis: the real task is not to find the problem, but to identify the problem or identify which problems are the most important.</li><li>To do this, performance analysis must quantify the importance of the problem. Some performance problems may not apply to your workload or only apply to a very small extent. Ideally, you should not only quantify the problem, but also estimate the speed increase brought by each problem fix. This information is especially useful when management reviews the reasons for engineering or operation and maintenance resource overhead.</li><li>There is an indicator that is very suitable for quantifying performance, that is, latency.</li></ol><p><a id="perfetto-intro"></a></p><h1 id="Introduction-to-Perfetto"><a href="#Introduction-to-Perfetto" class="headerlink" title="Introduction to Perfetto"></a>Introduction to Perfetto</h1><p>Perfetto is an advanced open-source tool designed for performance monitoring and analysis. It is equipped with a complete set of services and libraries capable of capturing and recording system-level and application-level activity data. In addition, Perfetto also provides memory analysis tools, suitable for both native applications and Java environments. One of its powerful features is that it can analyze trace data through a SQL query library, allowing you to deeply understand the details behind performance data. To better handle and understand large-scale datasets, Perfetto also provides a web-based user interface that allows you to intuitively visualize and explore multi-GB trace files. In short, Perfetto is a comprehensive solution designed to help developers and performance engineers analyze and optimize software performance with unprecedented depth and clarity.</p><p>Google started the first submission in 2017. In the following 6 years (as of 2024), a total of more than 100 developers have submitted nearly 37,000 submissions. There are PR and Merge operations almost every day. It is a quite active project. In addition to its powerful functions, its ambition is also very big. The official website claims that it is the next generation of cross-platform Trace&#x2F;Metric data capture and analysis tools. Usually, it is widely used. In addition to the Perfetto website, Windows Performance Tool and Android Studio, as well as Huawei’s GraphicProfiler also support the visualization and analysis of Perfetto data. We believe that Google will continue to invest resources in the Perfetto project. It can be said that it should be the next generation of performance analysis tools and will completely replace Systrace.</p><p>If you are accustomed to using Systrace, switching to Perfetto will be very smooth because Perfetto is fully compatible with Systrace. The Systrace files you captured before can be opened directly in the <a href="https://ui.perfetto.dev/#!/viewer">Perfetto Viewer</a> website. If you have not adapted to Perfetto, you can also open Systrace with one click from <a href="https://ui.perfetto.dev/#!/viewer">Perfetto Viewer</a>.</p><p>The figure below is the architecture diagram of Perfetto. It can be seen that Perfetto contains three major blocks:</p><ol><li><p><strong>Record traces</strong>: The data capture module. It can be seen that the captured content and sources are very rich, involving Java, Native, and Linux, which is much richer than Systrace.</p></li><li><p><strong>Analyze traces</strong>: Mainly the trace analysis module, including Trace parsing, SQL query, Metrics analysis, etc. This part has a dedicated command line tool provided, which is convenient for everyone to call directly or call in the tool chain.</p></li><li><p><strong>Visualize Traces</strong>: Trace presentation, capture, etc.</p><p><img src="/en/images/Android-Perfetto-01-What-is-perfetto/e8dd8f77-bda5-4755-ad47-9c1d5ff3e280.webp" alt="Perfetto Architecture"></p></li></ol><p>These modules will be introduced in detail in subsequent articles in the series.</p><h2 id="Perfetto’s-Core-Advantages-and-Highlights"><a href="#Perfetto’s-Core-Advantages-and-Highlights" class="headerlink" title="Perfetto’s Core Advantages and Highlights:"></a>Perfetto’s Core Advantages and Highlights:</h2><p>Through long-term use and comparison, as well as watching various sharing, here is a summary of Perfetto’s core advantages and functional highlights:</p><ol><li><strong>Support for Long-Term Data Capture</strong>:<ul><li>Perfetto supports long-time data capture through background services, using Protobuf encoding to store data.</li></ul></li><li><strong>Data Sources and Compatibility</strong>:<ul><li>Based on the Linux kernel’s Ftrace mechanism, recording key events in user space and kernel space.</li><li>Compatible with Systrace functions and is expected to eventually replace it.</li></ul></li><li><strong>Comprehensive Data Support</strong>:<ul><li>Support Trace, Metric and Log type data.</li><li>Provide multiple data capture methods, including web pages, command line tools, developer options, and Perfetto Trigger API.</li></ul></li><li><strong>Efficient Data Analysis</strong>:<ul><li>Provide data visualization web pages, support large file rendering, superior to Systrace.</li><li>Trace files can be converted to SQLite database files, supporting SQL query and script execution.</li><li>Provide Python API, allowing data to be exported to DataFrame format, providing convenience for in-depth analysis.</li><li>Support function call stack display.</li><li>Support memory heap stack display.</li><li>Support pinning the rows you are interested in to the top, without having to scroll up and down all the time (can automatically pin upon opening via script).</li><li>Support visualization of Binder calls and jumps.</li><li>Support very convenient query of wake-up sources.</li><li>Support Visual query of Critical Task.</li></ul></li><li><strong>Google’s Continuous Updates</strong>:<ul><li>Google’s tool team is continuously updating Perfetto. Version Release and Bugfix are very timely. You can observe on Github.</li></ul></li></ol><p>Here, I specifically mention SQL. Perfetto can use SQL, which is a huge improvement. When parsing Trace files, many SQL tables and views are built-in, which facilitates querying using SQL statements. For example, the following queries are very practical (Image from <a href="https://blog.csdn.net/feelabclihu/article/details/126672666?ops_request_misc=%257B%2522request%255Fid%2522%253A%2522171017104616800215023623%2522%252C%2522scm%2522%253A%252220140713.130102334.pc%255Fblog.%2522%257D&request_id=171017104616800215023623&biz_id=0&utm_medium=distribute.pc_search_result.none-task-blog-2~blog~first_rank_ecpm_v1~rank_v31_ecpm-1-126672666-null-null.nonecase&utm_term=Perfetto&spm=1018.2226.3001.4450">Kernel Artisan</a>).</p><p><img src="/en/images/Android-Perfetto-01-What-is-perfetto/c86fd19a-cf7b-4fe8-9bef-484c113c69a9.webp" alt="SQL Query"></p><p>In addition, in its official documentation, when introducing the corresponding part, it will also paste the corresponding SQL and query result examples.</p><p><img src="/en/images/Android-Perfetto-01-What-is-perfetto/481450e4-ace6-4b55-9de4-f74f8ef83aac.webp" alt="Official Docs SQL"></p><p>With this, you no longer have to be afraid of your boss saying you have no data. Find it out in minutes with SQL, convert the table to a chart, and a high-quality Report comes out: after optimization, the xxx indicator dropped by xx%, which is really very convenient.</p><p><a id="vs-systrace"></a></p><h2 id="Where-it’s-not-as-good-as-Systrace"><a href="#Where-it’s-not-as-good-as-Systrace" class="headerlink" title="Where it’s not as good as Systrace"></a>Where it’s not as good as Systrace</h2><h3 id="Vsync-App-is-not-so-intuitive"><a href="#Vsync-App-is-not-so-intuitive" class="headerlink" title="Vsync-App is not so intuitive"></a>Vsync-App is not so intuitive</h3><p>Vsync-App is relatively less intuitive in Perfetto. For example, if you are used to the vertical line of Vsync-App running through the entire Trace in Systrace, you will feel weird when you look at Perfetto without this:</p><p>In Perfetto, you can Pin Vsync-App to the top to see Vsync information<br><img src="/en/images/Android-Perfetto-01-What-is-perfetto/c9cc6e73-3f32-40f5-a1fc-7b06b2d6b436.webp" alt="Perfetto Vsync"></p><p>In Systrace, Vsync runs through the entire Trace in the form of a vertical line, which is easy to identify:</p><p><img src="/en/images/Android-Perfetto-01-What-is-perfetto/98a79f53-d52f-49e4-a0a0-f5a07a994038.webp" alt="Systrace Vsync"></p><p><strong>Of course, Perfetto also has reasons for canceling this: Vsync-App actually cannot explain that the App has performance problems. Perfetto uses another way to display it. If you use the Perfetto command to grab the Trace, there will be the following information, recording the Expected Timeline and Actual Timeline of an App frame. Compared with Vsync-App, these two indicators can better explain the problem</strong>: <a href="https://perfetto.dev/docs/data-sources/frametimeline">Original document</a></p><ol><li><strong>Expected Timeline</strong>: Each slice represents the time the application uses to render the frame. To avoid system stuttering, the application needs to complete within this timeframe. The start time is the time when the Choreographer callback is scheduled.</li><li><strong>Actual Timeline</strong>: These slices represent the actual time the application completes the frame (including GPU work) and sends it to SurfaceFlinger for composition. The start time is the time the application starts running. The end time of the slice here represents when the application’s frame is published to SurfaceFlinger.</li></ol><p>By looking at the difference between Expected Timeline and Actual Timeline, we can quickly locate the point of stuttering (the red marked Actual Timeline frame is the stutter)</p><p><img src="/en/images/Android-Perfetto-01-What-is-perfetto/79068cb6-4284-497c-981c-2d1c8082678e.webp" alt="Jank Detection"></p><p><img src="/en/images/Android-Perfetto-01-What-is-perfetto/f7c2d09f-0392-44ae-ad44-6c4e6da1f2c9.webp" alt="Jank Detection 2"></p><p>Its calculation method is as follows. Looking at the picture, you will know why these two are more accurate (including GPU execution time)</p><p><img src="/en/images/Android-Perfetto-01-What-is-perfetto/39da2304-9f14-4db7-a882-9203bcf37683.webp" alt="Calculation Method"></p><p>Correspondingly, SurfaceFlinger also has these two indicators.</p><h3 id="Folding-function-is-relatively-bad-wasteful-of-screen"><a href="#Folding-function-is-relatively-bad-wasteful-of-screen" class="headerlink" title="Folding function is relatively bad, wasteful of screen"></a>Folding function is relatively bad, wasteful of screen</h3><p>If you have a normal widescreen, open Perfetto and randomly Pin a few key threads to the top, the operating space below you is very small. If you encounter a key thread stack that is relatively long, it is even more torturous, and this stack cannot be folded (Systrace can).</p><p>Solution:</p><ol><li>Pin fewer key threads (Then what’s the fun)</li><li>Stand the monitor up (Width is discounted)</li></ol><p>Finally, we found the perfect solution: switch to LG’s “Rubik’s Cube” screen (DualUp), 16:18, watching Perfetto is simply a perfect match (The office has already been recommended 3 units by me)</p><p><img src="/en/images/Android-Perfetto-01-What-is-perfetto/1689331a-b48c-4d4b-8e1a-65d64945ddd5.webp" alt="LG DualUp"></p><ol><li>Not short of money: <a href="https://item.jd.com/67812631556.html">LG 28MQ780 - 3599</a></li><li>Flat replacement: <a href="https://item.jd.com/100058985199.html">Innocn 28C1Q - 2999</a></li></ol><p><a id="refs"></a></p><h1 id="Reference-Documents"><a href="#Reference-Documents" class="headerlink" title="Reference Documents"></a>Reference Documents</h1><ol><li><a href="https://github.com/google/perfetto">Perfetto Github Repository</a></li><li><a href="https://perfetto.dev/docs/">Perfetto Official Documentation</a></li><li><a href="https://blog.csdn.net/feelabclihu/article/details/126672666?ops_request_misc=%257B%2522request%255Fid%2522%253A%2522171017104616800215023623%2522%252C%2522scm%2522%253A%252220140713.130102334.pc%255Fblog.%2522%257D&request_id=171017104616800215023623&biz_id=0&utm_medium=distribute.pc_search_result.none-task-blog-2~blog~first_rank_ecpm_v1~rank_v31_ecpm-1-126672666-null-null.nonecase&utm_term=Perfetto&spm=1018.2226.3001.4450">Kernel Artisan - Perfetto Advanced</a></li></ol><p><a id="about"></a></p><h1 id="About-Me-amp-amp-Blog"><a href="#About-Me-amp-amp-Blog" class="headerlink" title="About Me &amp;&amp; Blog"></a>About Me &amp;&amp; Blog</h1><p>Here is a personal introduction and related links. I hope to communicate more with my peers. When three people walk together, there must be one who can be my teacher!</p><ol><li><a href="https://www.androidperformance.com/about/">Blogger Personal Introduction</a>: Contains personal WeChat and WeChat group links.</li><li><a href="https://androidperformance.com/2019/12/01/BlogMap/">This Blog Content Navigation</a>: A navigation of personal blog content.</li><li><a href="https://androidperformance.com/2018/05/07/Android-performance-optimization-skills-and-tools/">Personal Collection of Excellent Blog Articles - Android Performance Optimization Must-Know</a>: Welcome everyone to recommend themselves and others (WeChat private chat is fine)</li><li><a href="https://www.androidperformance.com/2023/12/30/the-performance/">Android Performance Optimization Knowledge Planet</a>: Welcome to join, thank you for your support~</li></ol><blockquote><p><strong>One person can go faster, a group of people can go further</strong></p></blockquote><p><img src="/en/images/WechatIMG581.webp" alt="Wechat Scan"></p>]]></content>
    
    
    <summary type="html">&lt;p&gt;This is the first article in the Perfetto series. It mainly provides a brief introduction to the Perfetto tool, including its history, development, and what Perfetto can do.&lt;/p&gt;
&lt;p&gt;With Google announcing the deprecation of the Systrace tool and the release of Perfetto, Perfetto has basically replaced Systrace in my daily work. At the same time, major manufacturers like OPPO and Vivo have also switched from Systrace to Perfetto. Many friends who are new to Android performance optimization feel a headache when facing the dazzling interface and complex functions of Perfetto. They hope that I can present those previous Systrace articles using Perfetto.&lt;/p&gt;</summary>


    <category term="Android" scheme="https://androidperformance.com/en/categories/Android/"/>
    
    
    <category term="Android" scheme="https://androidperformance.com/en/tags/Android/"/>
    
    <category term="Perfetto" scheme="https://androidperformance.com/en/tags/Perfetto/"/>
    
    <category term="Systrace" scheme="https://androidperformance.com/en/tags/Systrace/"/>
    
    <category term="Memory" scheme="https://androidperformance.com/en/tags/Memory/"/>
    
    <category term="Performance" scheme="https://androidperformance.com/en/tags/Performance/"/>
    
  </entry>
  
  <entry>
    <title>Android Perfetto Series Catalog</title>
    <link href="https://androidperformance.com/en/2024/03/27/Android-Perfetto-101/"/>
    <id>https://androidperformance.com/en/2024/03/27/Android-Perfetto-101/</id>
    <published>2024-03-27T14:29:31.000Z</published>
    <updated>2026-05-10T23:29:51.058Z</updated>
    
    <content type="html"><![CDATA[<p>With Google announcing the deprecation of Systrace in favor of Perfetto, Perfetto has essentially replaced Systrace in my daily workflow. Major manufacturers like OPPO and vivo have also transitioned to Perfetto. Many developers new to Android performance optimization find Perfetto’s complex interface and features overwhelming, which is why I’ve decided to re-present my previous Systrace articles using Perfetto.</p><span id="more"></span><p>This series was born from a few key reasons I shared in my Knowledge Planet (I previously thought the Systrace series was sufficient):</p><ol><li><strong>Industry Transition</strong>: Manufacturers like OPPO and vivo have already switched to Perfetto for both capturing and analyzing traces. Many new developers are starting with Perfetto, and keeping only the old Systrace series would leave them behind.</li><li><strong>Modern Codebase</strong>: The previous Systrace series was based on older code. This new Perfetto series uses Android 16 (API 36) behavior changes and current AOSP&#x2F;mainline implementation as the new version boundary.</li><li><strong>Personal Growth</strong>: I haven’t fully mastered all of Perfetto’s high-level features myself. Re-writing this series helps me reinforce my own understanding.</li><li><strong>System-Level Focus</strong>: Perfetto is a powerful tool backed by the entire Android and Linux ecosystem. This series focuses on the underlying system principles rather than just the tool itself. Mastery lies in understanding how Android works and using tools to uncover the essence of performance issues.</li><li><strong>Knowledge Gap</strong>: Official Perfetto documentation still misses many nuances of Android system operation. This series aims to fill those gaps and provide high-quality Chinese technical content.</li><li><strong>Community Sharing</strong>: This content will also serve as material for future technical presentations like Google DevFest.</li></ol><p>Paul Graham once said: “<strong>Either provide something most people want a little, or something a few people want a lot.</strong>“ Perfetto is exactly what a dedicated minority “wants a lot.” Let’s begin. Please feel free to share feedback or point out errors so I can keep this as accurate as possible.</p><p>This series aims to provide a fresh perspective on Android system operation through Perfetto. It offers a unique angle to study App, Framework, and Linux internals. Even if you’ve read many articles on performance optimization, you might still feel confused because it’s hard to visualize the flow or remember the code. Through graphical tools like Perfetto, you may gain much deeper insights.</p><h1 id="Perfetto-Series-Catalog"><a href="#Perfetto-Series-Catalog" class="headerlink" title="Perfetto Series Catalog"></a>Perfetto Series Catalog</h1><ol><li><a href="https://www.androidperformance.com/en/2024/03/27/Android-Perfetto-101/">Android Perfetto Series Catalog</a></li><li><a href="https://www.androidperformance.com/en/2024/05/21/Android-Perfetto-01-What-is-perfetto/">Android Perfetto Series 1: Introduction to Perfetto</a></li><li><a href="https://www.androidperformance.com/en/2024/05/21/Android-Perfetto-02-how-to-get-perfetto/">Android Perfetto Series 2: Capturing Perfetto Traces</a></li><li><a href="https://www.androidperformance.com/en/2024/05/21/Android-Perfetto-03-how-to-analysis-perfetto/">Android Perfetto Series 3: Familiarizing with the Perfetto View</a></li><li><a href="https://www.androidperformance.com/en/2025/02/08/Android-Perfetto-04-Open-Big-Trace-With-Command-Line/">Android Perfetto Series 4: Opening Large Traces via Command Line</a></li><li><a href="https://www.androidperformance.com/en/2025/03/26/Android-Perfetto-05-Chorergrapher/">Android Perfetto Series 5: Choreographer-based Rendering Flow</a></li><li><a href="https://www.androidperformance.com/en/2025/04/26/Android-Perfetto-06-Why-120Hz/">Android Perfetto Series 6: Why 120Hz? Advantages and Challenges</a></li><li><a href="https://www.androidperformance.com/en/2025/08/02/Android-Perfetto-07-MainThread-And-RenderThread/">Android Perfetto Series 7: MainThread and RenderThread Deep Dive</a></li><li><a href="https://www.androidperformance.com/en/2025/08/05/Android-Perfetto-08-Vsync/">Android Perfetto Series 8: Understanding Vsync and Performance Analysis</a></li><li><a href="https://www.androidperformance.com/en/2025/11/12/Android-Perfetto-09-CPU/">Android Perfetto Series 9: Interpreting CPU Information</a></li><li><a href="https://www.androidperformance.com/en/2025/11/16/Android-Perfetto-10-Binder/">Android Perfetto Series 10: Binder Scheduling and Lock Contention</a></li><li><a href="https://www.bilibili.com/video/BV1oi82efE4D/">Video (Bilibili) - Android Perfetto Basics and Case Studies</a></li><li><a href="https://www.bilibili.com/video/BV17A6bBLECu/">Video (Bilibili) - Android Perfetto: Trace Graph Types - AOSP, WebView, Flutter + OEM System Optimization</a></li></ol><h1 id="Systrace-Series"><a href="#Systrace-Series" class="headerlink" title="Systrace Series"></a>Systrace Series</h1><p>Although Systrace is no longer updated, the Framework flows covered by the Systrace series still matter: thread states, Binder waits, Vsync, SurfaceFlinger, CPU scheduling, and app rendering did not disappear. What changed is the toolchain and file format. On Android 9 and earlier, the common flow was <code>systrace.py</code>, HTML&#x2F;ctrace output, and Chrome or the legacy UI. On Android 10 (API 29) and later, System Tracing mainly produces <code>.perfetto-trace</code> files, and the default analysis path is Perfetto UI or <code>trace_processor</code>. <code>android.os.Trace</code>, ATrace, and ftrace events are still supported by Perfetto, so the old series is still useful for system concepts while the Perfetto series is the better guide for current capture, viewing, filtering, and SQL analysis workflows.</p><p>If you are coming from the Systrace series, use this mapping:</p><table><thead><tr><th>Systrace topic</th><th>Perfetto content to read first</th></tr></thead><tbody><tr><td>Tool introduction, capture flow, UI operations</td><td><a href="https://www.androidperformance.com/en/2024/05/21/Android-Perfetto-01-What-is-perfetto/">Perfetto 1: Introduction</a>, <a href="https://www.androidperformance.com/en/2024/05/21/Android-Perfetto-02-how-to-get-perfetto/">Perfetto 2: Capturing traces</a>, <a href="https://www.androidperformance.com/en/2024/05/21/Android-Perfetto-03-how-to-analysis-perfetto/">Perfetto 3: Perfetto View</a></td></tr><tr><td>Why 60 fps and high refresh rate</td><td><a href="https://www.androidperformance.com/en/2025/04/26/Android-Perfetto-06-Why-120Hz/">Perfetto 6: Why 120Hz?</a></td></tr><tr><td>Choreographer, main thread, RenderThread, jank analysis</td><td><a href="https://www.androidperformance.com/en/2025/03/26/Android-Perfetto-05-Chorergrapher/">Perfetto 5: Choreographer rendering flow</a>, <a href="https://www.androidperformance.com/en/2025/08/02/Android-Perfetto-07-MainThread-And-RenderThread/">Perfetto 7: MainThread and RenderThread</a></td></tr><tr><td>Vsync, SurfaceFlinger, Triple Buffer</td><td><a href="https://www.androidperformance.com/en/2025/08/05/Android-Perfetto-08-Vsync/">Perfetto 8: Vsync and performance analysis</a></td></tr><tr><td>CPU frequency and Running&#x2F;Runnable&#x2F;Sleep states</td><td><a href="https://www.androidperformance.com/en/2025/11/12/Android-Perfetto-09-CPU/">Perfetto 9: CPU information</a></td></tr><tr><td>Binder, lock contention, and SystemServer waits</td><td><a href="https://www.androidperformance.com/en/2025/11/16/Android-Perfetto-10-Binder/">Perfetto 10: Binder scheduling and lock contention</a></td></tr></tbody></table><ol><li><a href="https://www.androidperformance.com/en/2019/05/28/Android-Systrace-About/">Introduction to Systrace</a></li><li><a href="https://www.androidperformance.com/en/2019/07/23/Android-Systrace-Pre/">Systrace Basics: Prerequisites</a></li><li><a href="https://www.androidperformance.com/en/2019/05/27/why-60-fps/">Systrace Basics: Why 60 fps?</a></li><li><a href="https://www.androidperformance.com/en/2019/06/29/Android-Systrace-SystemServer/">Systrace Basics: Interpreting SystemServer</a></li><li><a href="https://www.androidperformance.com/en/2019/11/04/Android-Systrace-Input/">Systrace Basics: Interpreting Input</a></li><li><a href="https://www.androidperformance.com/en/2019/12/01/Android-Systrace-Vsync/">Systrace Basics: Vsync Generation and Mechanism</a></li><li><a href="https://www.androidperformance.com/en/2019/10/22/Android-Choreographer/">Systrace Basics: Vsync-App - Choreographer Rendering Explained</a></li><li><a href="https://www.androidperformance.com/en/2019/11/06/Android-Systrace-MainThread-And-RenderThread/">Systrace Basics: MainThread and RenderThread</a></li><li><a href="https://www.androidperformance.com/en/2019/12/06/Android-Systrace-Binder/">Systrace Basics: Binder and Lock Contention</a></li><li><a href="https://www.androidperformance.com/en/2019/12/15/Android-Systrace-Triple-Buffer">Systrace Basics: Triple Buffer Explained</a></li><li><a href="https://www.androidperformance.com/en/2019/12/21/Android-Systrace-CPU">Systrace Basics: Interpreting CPU Info</a></li><li><a href="https://www.androidperformance.com/en/2020/02/14/Android-Systrace-SurfaceFlinger/">Systrace Basics: SurfaceFlinger Explained</a></li><li><a href="https://www.androidperformance.com/en/2021/04/24/android-systrace-smooth-in-action-1/">Systrace Smoothness in Practice 1: Understanding Jank</a></li><li><a href="https://www.androidperformance.com/en/2021/04/24/android-systrace-smooth-in-action-2/">Systrace Smoothness in Practice 2: MIUI Desktop Scroll Analysis</a></li><li><a href="https://www.androidperformance.com/en/2021/04/24/android-systrace-smooth-in-action-3/">Systrace Smoothness in Practice 3: Common Questions</a></li><li><a href="https://www.androidperformance.com/en/2021/09/13/android-systrace-Responsiveness-in-action-1/">Systrace Responsiveness in Practice 1: Understanding Principles</a></li><li><a href="https://www.androidperformance.com/en/2021/09/13/android-systrace-Responsiveness-in-action-2/">Systrace Responsiveness in Practice 2: Case Study — App Launch</a></li><li><a href="https://www.androidperformance.com/en/2021/09/13/android-systrace-Responsiveness-in-action-3/">Systrace Responsiveness in Practice 3: Extended Knowledge</a></li><li><a href="https://www.androidperformance.com/en/2022/01/21/android-systrace-cpu-state-runnable/">CPU Thread State Analysis 1: Runnable</a></li><li><a href="https://www.androidperformance.com/en/2022/03/13/android-systrace-cpu-state-running/">CPU Thread State Analysis 2: Running</a></li><li><a href="https://www.androidperformance.com/en/2022/03/13/android-systrace-cpu-state-sleep/">CPU Thread State Analysis 3: Sleep &amp; Uninterruptible Sleep</a></li></ol><h1 id="About-Me-amp-My-Blog"><a href="#About-Me-amp-My-Blog" class="headerlink" title="About Me &amp; My Blog"></a>About Me &amp; My Blog</h1><p>Here is a quick introduction and relevant links. I welcome communication with fellow developers!</p><ol><li><a href="https://www.androidperformance.com/en/about/">Author Introduction</a>: Includes my WeChat and community links.</li><li><a href="https://www.androidperformance.com/en/2019/12/01/BlogMap/">Blog Content Map</a>: A navigation guide to this blog.</li><li><a href="https://www.androidperformance.com/en/2018/05/07/Android-performance-optimization-skills-and-tools/">Android Performance Optimization Skills and Tools</a>: A curated collection of excellent articles.</li><li><a href="https://www.androidperformance.com/en/2023/12/30/the-performance/">Android Performance Knowledge Planet</a>: Join our community for deeper discussions.</li></ol><blockquote><p><strong>“If you want to go fast, go alone. If you want to go far, go together.”</strong></p></blockquote><p><img src="/en/images/WechatIMG581.webp" alt="WeChat QR Code"></p>]]></content>
    
    
    <summary type="html">&lt;p&gt;With Google announcing the deprecation of Systrace in favor of Perfetto, Perfetto has essentially replaced Systrace in my daily workflow. Major manufacturers like OPPO and vivo have also transitioned to Perfetto. Many developers new to Android performance optimization find Perfetto’s complex interface and features overwhelming, which is why I’ve decided to re-present my previous Systrace articles using Perfetto.&lt;/p&gt;</summary>


    <category term="Android" scheme="https://androidperformance.com/en/categories/Android/"/>
    
    
    <category term="Android" scheme="https://androidperformance.com/en/tags/Android/"/>
    
    <category term="Perfetto" scheme="https://androidperformance.com/en/tags/Perfetto/"/>
    
    <category term="Systrace" scheme="https://androidperformance.com/en/tags/Systrace/"/>
    
    <category term="Performance" scheme="https://androidperformance.com/en/tags/Performance/"/>
    
    <category term="RenderThread" scheme="https://androidperformance.com/en/tags/RenderThread/"/>
    
  </entry>
  
  <entry>
    <title>Reflections on 2023: Health, Career, and the Future</title>
    <link href="https://androidperformance.com/en/2024/01/01/2023-review/"/>
    <id>https://androidperformance.com/en/2024/01/01/2023-review/</id>
    <published>2023-12-31T16:08:53.000Z</published>
    <updated>2026-05-10T23:29:51.052Z</updated>
    
    <content type="html"><![CDATA[<p>I’m taking the easy way out this year and using a template to look back at the past year through several lenses: Health&#x2F;Fitness, Work&#x2F;Career, Friendship&#x2F;Social, Personal Life&#x2F;Family, Learning&#x2F;Knowledge Management, Travel&#x2F;Culture, Interests&#x2F;Creativity, Emotions&#x2F;Mental State, and Finances.</p><p>This post is more of a personal record for 2023 than a formal summary, and my writing isn’t anything special. But as I’ve realized, if you don’t record things, they slowly fade away. I hope that whenever I look back at this post, I’ll remember 2023 as a vibrant year—filled with unforgettable moments, low points, visits from distant friends, and journeys through mountains and rivers. I also want to remember the things I did poorly so I can do better next time, and to remind myself to fight the laziness that often prevents me from following through on what I know is right.</p><p>For those reading, just enjoy the ride!</p><span id="more"></span><h2 id="Health-x2F-Fitness"><a href="#Health-x2F-Fitness" class="headerlink" title="Health &#x2F; Fitness"></a>Health &#x2F; Fitness</h2><p>This year was dominated by cycling, thanks to a company-wide competition and the completion of the Chengdu Green Belt last year. I bought a used Merida Reacto 4000 on Xianyu at the start of the year and committed to riding. My goal was to complete one loop (97km) in under 3 hours, with a stretch goal of 2 hours 50 minutes. I’m proud to say I met both (35 loops total, with a personal best of 2h 47min), and even took first place in the company competition. I even managed to get my wife into the sport!</p><p>My chronic issues—asthma and rhinitis—didn’t see much improvement. However, the best news came at the end of the year: after being hospitalized for 4 days due to pneumonia and the flu, the IV treatment actually cured the loss of taste caused by my rhinitis! My blood oxygen also returned to 96% (it was consistently below 94%, which was causing me significant anxiety). Chengdu’s air quality is… challenging, to say the least; even doctors at Huaxi Hospital shook their heads at it. Something to consider if you’re thinking of moving here.</p><p>For the new year, I’m targeting both cycling and running. I’ve signed up for a half-marathon in Dujiangyan and hope to finish. Weight loss remains a priority—watching what I eat and getting moving. Stay hungry before bed!</p><p><img src="/en/images/2023-review/8d4ac346-1fff-4561-bf77-149bb5f483d8.webp" alt="2023 Cycling Stats"></p><h2 id="Work-x2F-Career"><a href="#Work-x2F-Career" class="headerlink" title="Work &#x2F; Career"></a>Work &#x2F; Career</h2><p>Work was a bit rocky this year. I was involved in many disparate things, and several projects didn’t reach a final landing. Looking back, I think it was a lack of planning and execution on my part. Still, I gained a lot of knowledge, researched many technical solutions, and collaborated with customers on several projects. The company is full of “hidden dragons and crouching tigers,” and I need to stay humble and learn from everyone.</p><p>AI was obviously the big story this year. AI has integrated into both company and personal workflows—boosting productivity and creating new tools. While it hasn’t completely disrupted our industry yet, we all know that day is coming fast.</p><blockquote><p>“Once a new technology rolls over you, if you’re not part of the steamroller, you’re part of the road.” —— Stewart Brand</p></blockquote><h2 id="Friendship-x2F-Social"><a href="#Friendship-x2F-Social" class="headerlink" title="Friendship &#x2F; Social"></a>Friendship &#x2F; Social</h2><p>The most significant social event was traveling from Chengdu to Shenzhen for the GDG DevFest. I caught up with old friends, met people from my online groups, and indulged in my favorite claypot porridge and beef hotpot. Hearing the keynote speeches from various GDEs was incredibly rewarding.</p><p><img src="/en/images/2023-review/9d2d5e7b-bd3c-480e-9f6b-4f6d58712e4d.jpg"></p><p>The rest of my social life was mostly cycling with colleagues. Nothing gets you pushing through the Green Belt at midnight on a Friday like the promise of hotpot or spicy skewers afterward. Big shoutout to the cycling crew—let’s keep pushing each other in the new year!</p><p>Congratulations to the new parents in the group, and to those who finally got their new homes (even if they’re still single!).</p><p>Most of my daily communication happens in my WeChat groups, mostly with Android App and System developers. We have about 2,000 members across 5 groups (though 90% are dedicated lurkers). I’ve met many industry experts through these groups. The mobile world is small—every friend is a connection. It’s a reminder that there’s always someone better out there, so I just need to keep learning.</p><p>My biggest takeaway: communicating with people on the same “frequency” saves a lot of effort.</p><h2 id="Personal-Life-x2F-Family"><a href="#Personal-Life-x2F-Family" class="headerlink" title="Personal Life &#x2F; Family"></a>Personal Life &#x2F; Family</h2><p>Little Orange is almost three now, and her mom has moved to a new team doing the same work as me: system performance optimization. My biggest wish is for my family to stay happy, healthy, and safe. Due to various reasons, I didn’t spend as much time with my family as I wanted this year, and several travel plans were shelved. In the new year, I need to be more efficient so I can dedicate more time to them.</p><p>I read a blog post recently that really resonated with me regarding the ultimate goal of life:</p><blockquote><p>I want to enrich my experiences, do things I’ve never done, and see sights I’ve never seen. I hope <strong>one day I can spend my time on myself, not on work, and not on unimportant people or things</strong>. More specifically, I hope my family is healthy and safe, with love and companionship. I hope to travel all of China and the world, eat food I’ve never tasted, and see scenes I’ve never envisioned.</p><p>Thinking about this brings me clarity. I know what I’m pursuing in this life; the rest isn’t that important. So, how do I get there? I need time, and I need money.</p><p>From now on, everything I do revolves around this goal. <strong>As long as something moves me toward my ultimate life goal, no matter how hard it is, I must do it. Yes, must. No room for negotiation.</strong></p></blockquote><h2 id="Learning-x2F-Knowledge-Management"><a href="#Learning-x2F-Knowledge-Management" class="headerlink" title="Learning &#x2F; Knowledge Management"></a>Learning &#x2F; Knowledge Management</h2><p>Learning was a bit of a failure this year. My English studies stalled until I picked them up again this month. Technical learning was mostly passive reading without enough writing or deep reflection. I have many unread books on my shelf. I only posted a few blog articles. I know the Feynman technique—using output to drive input—but I haven’t overcome my procrastination yet.</p><p>I did develop a good habit at work: using Typora to record daily work, technical projects, research, and bugs. As I switch to Microsoft Loop, I plan to be even more detailed in my logs and reflections and share more with my team to foster a better technical atmosphere.</p><p>From my own experience, there are three obstacles to learning:</p><ol><li><strong>Finding High-Quality Input</strong>: In the age of information overload, finding good sources is key. You need to curate a list of great blogs, GitHub repos, newsletters, and tech teams. (My article <a href="https://www.androidperformance.com/en/2018/05/07/Android-performance-optimization-skills-and-tools/">Android Performance Optimization Must-Knows</a> is my attempt at this; feel free to recommend others!)</li><li><strong>Focusing and Diving Deep</strong>: Short-form content is destroying our attention spans. Sitting down to read and think through a deep article or book is becoming harder. We have to train ourselves to step away from social media and regain our focus.</li><li><strong>Overcoming Procrastination</strong>: We often say we know the “how” but aren’t doing it. Procrastination is a major factor. I recently saw a tip on fighting procrastination: <strong>The key is that we procrastinate because something is unfamiliar and we want to avoid it, which creates fear and anxiety. The way to defeat it is to mentally walk through the task first—visualize the steps and details—to get your neurons firing, then act immediately.</strong></li></ol><p>I also want to share a few points from a video I saw early in the year called “Life is a Journey, and I too am a Traveler”:</p><ol><li>Don’t limit yourself; move quickly into industries with more potential.</li><li>Learn aggressively from the best in the field.</li><li>Expand your horizons and perspective.</li><li>Embrace change, or even seek it out.</li><li>Keep doing the work to build a long-term reputation.</li><li>Improve your “fault tolerance.”</li></ol><h2 id="Travel-x2F-Culture"><a href="#Travel-x2F-Culture" class="headerlink" title="Travel &#x2F; Culture"></a>Travel &#x2F; Culture</h2><p>I visited four places this year: Siguniang Mountain, Xiamen, Yantai+Weihai, and Leshan.</p><ol><li><strong>Xiamen</strong>: A team trip. We saw the sea, ate satay noodles, and ginger duck. The weather there is enviable.</li><li><strong>Yantai + Weihai</strong>: Attended a wedding, visited my alma mater, and met with former teachers and classmates. The coastal road is still beautiful, and the sunset at the school beach was stunning.</li><li><strong>Siguniang Mountain</strong>: Drove all day to Western Sichuan. We crossed a pass at 4,800m. My wife and baby had altitude sickness, so we didn’t stay long. But the snow-covered scenery the next morning was breathtaking. I have a video of it here: <a href="https://www.bilibili.com/video/BV1H84y1Q7oM">https://www.bilibili.com/video/BV1H84y1Q7oM</a>. It’s definitely worth another visit.</li><li><strong>Leshan</strong>: Visited the Giant Buddha and enjoyed the local snacks (sweet-skinned duck and fried skewers are amazing).</li></ol><p>Traveling with a baby is a lot of work but so worth it. They see new things, make new friends, and try new foods. We’ll keep doing it in 2024.</p><h2 id="Interests-x2F-Creativity"><a href="#Interests-x2F-Creativity" class="headerlink" title="Interests &#x2F; Creativity"></a>Interests &#x2F; Creativity</h2><p>Finally, something lighthearted! My main interest this year was cycling. I bought a DJI Action 4 to record my rides. I’m no pro—it’s mostly just continuous shots. Creativity is definitely a talent!</p><h2 id="Emotions-x2F-Mental-State"><a href="#Emotions-x2F-Mental-State" class="headerlink" title="Emotions &#x2F; Mental State"></a>Emotions &#x2F; Mental State</h2><p>I’m doing well, though I have some minor anxiety. Much of my well-being comes from my family’s support—having my parents help with the baby and having a spouse who also works in IT and supports my decisions. Chengdu is a great place to live—lots of food, culture, and nature within reach (except for the smog, which is a big negative).</p><p>I’ll keep this mindset in 2024: stay positive and get enough sleep.</p><h2 id="Finances"><a href="#Finances" class="headerlink" title="Finances"></a>Finances</h2><p>We still have a significant mortgage, and most of our salary goes to the bank. We don’t have much income beyond our day jobs, which is a source of anxiety for me—any job loss would create immediate financial pressure. My goal is to manage our money better and control spending. I recently read a breakdown of the financial habits of the poor, the middle class, and the wealthy:</p><ul><li>The poor struggle to make ends meet, with income consumed by basic needs.</li><li>The middle class are stuck in the “rat race,” working for decades to pay off bills and loans.</li><li>The wealthy acquire and hold onto quality assets, creating a “money → asset → money” cycle.</li></ul><p>Ultimately, you need to hold <strong>quality assets</strong>—whether that’s real estate or knowledge. Given my situation, I’ve decided to restart my <strong>Knowledge Planet</strong> (intro here: <a href="https://www.androidperformance.com/en/2023/12/30/the-performance/">The Performance Knowledge Planet Intro</a>). I’m not advertising it; it’s just on the blog. I believe the Feynman and Public Learning techniques are the best ways to learn, and the Knowledge Planet lets me share my daily thoughts, cases, progress, and tools. If that knowledge helps someone else, it’s worth it.</p><p><img src="/en/images/2023-review/43ec5c99-9264-440c-9490-e3cb4082bb26.webp"></p><h1 id="The-Final-Three"><a href="#The-Final-Three" class="headerlink" title="The Final Three"></a>The Final Three</h1><h2 id="Proudest-Achievement"><a href="#Proudest-Achievement" class="headerlink" title="Proudest Achievement"></a>Proudest Achievement</h2><p>Teaching for three days at the University of Electronic Science and Technology of China (UESTC). It was part of a company partnership, but the process was a huge challenge: from getting the assignment to preparing the slides and finally delivering the lectures. It was my first time, and I’m glad it went well.</p><p>I’ll be doing it again this year, and I won’t be as nervous! I need to update the content and optimize the delivery. Explaining Android from top to bottom is never easy.</p><h2 id="Greatest-Challenge"><a href="#Greatest-Challenge" class="headerlink" title="Greatest Challenge"></a>Greatest Challenge</h2><p>Beyond work, my biggest challenge is English speaking. There were several times this year where I struggled, which has motivated me to double down on learning. This is a top priority for 2024.</p><h2 id="Goals-and-Wishes-for-Next-Year"><a href="#Goals-and-Wishes-for-Next-Year" class="headerlink" title="Goals and Wishes for Next Year"></a>Goals and Wishes for Next Year</h2><ol><li>Spend more time with family, do new things, and visit new places.</li><li>Do a public presentation at a Google DevFest-level event.</li><li>Travel abroad once.</li><li>Grow the Knowledge Planet community.</li><li>Keep fit and complete a marathon.</li><li>Read more books.</li><li>Update the blog every 2 weeks and finish the Perfetto series.</li><li>Record more videos.</li></ol><p>My writing is limited, but I’ll close with a quote:</p><blockquote><p>I hope you can figure out “what kind of life you want to live.” Once you have that standard, every decision you make will become incredibly easy.</p></blockquote><h1 id="About-Me-amp-amp-Blog"><a href="#About-Me-amp-amp-Blog" class="headerlink" title="About Me &amp;&amp; Blog"></a>About Me &amp;&amp; Blog</h1><p>Below is my personal intro and related links. I look forward to exchanging ideas with fellow professionals. “When three walk together, one can always be my teacher!”</p><ol><li><a href="https://www.androidperformance.com/en/about/">Blogger Intro</a></li><li><a href="https://www.androidperformance.com/en/2019/12/01/BlogMap/">Blog Content Navigation</a>: A guide for my blog content.</li><li><a href="https://www.androidperformance.com/en/2018/05/07/Android-performance-optimization-skills-and-tools/">Curated Excellent Blog Articles - Android Performance Optimization Must-Knows</a></li><li><a href="https://www.androidperformance.com/en/2023/12/30/the-performance/">Android Performance Optimization Knowledge Planet</a></li></ol><blockquote><p><strong>One walks faster alone, but a group walks further together.</strong></p></blockquote><p><img src="/en/images/WechatIMG581.webp" alt="Scan WeChat QR Code"></p>]]></content>
    
    
    <summary type="html">&lt;p&gt;I’m taking the easy way out this year and using a template to look back at the past year through several lenses: Health&amp;#x2F;Fitness, Work&amp;#x2F;Career, Friendship&amp;#x2F;Social, Personal Life&amp;#x2F;Family, Learning&amp;#x2F;Knowledge Management, Travel&amp;#x2F;Culture, Interests&amp;#x2F;Creativity, Emotions&amp;#x2F;Mental State, and Finances.&lt;/p&gt;
&lt;p&gt;This post is more of a personal record for 2023 than a formal summary, and my writing isn’t anything special. But as I’ve realized, if you don’t record things, they slowly fade away. I hope that whenever I look back at this post, I’ll remember 2023 as a vibrant year—filled with unforgettable moments, low points, visits from distant friends, and journeys through mountains and rivers. I also want to remember the things I did poorly so I can do better next time, and to remind myself to fight the laziness that often prevents me from following through on what I know is right.&lt;/p&gt;
&lt;p&gt;For those reading, just enjoy the ride!&lt;/p&gt;</summary>


    <category term="Android" scheme="https://androidperformance.com/en/categories/Android/"/>
    
    
    <category term="Year in Review" scheme="https://androidperformance.com/en/tags/Year-in-Review/"/>
    
    <category term="Knowledge Planet" scheme="https://androidperformance.com/en/tags/Knowledge-Planet/"/>
    
  </entry>
  
  <entry>
    <title>Introduction to The Android Performance Knowledge Planet</title>
    <link href="https://androidperformance.com/en/2023/12/30/the-performance/"/>
    <id>https://androidperformance.com/en/2023/12/30/the-performance/</id>
    <published>2023-12-30T00:59:18.000Z</published>
    <updated>2026-05-10T23:29:51.068Z</updated>
    
    <content type="html"><![CDATA[<blockquote><p>Currently, the “Knowledge Planet” (ZSXQ) is a paid community. The income mainly goes towards blog server costs and buying cat food for my cat, Douzi. It also serves as my motivation to keep updating the blog. If you find the content helpful, consider joining to support the work! Thank you very much!</p></blockquote><p>The community is named <strong>The Performance</strong>, a circle for sharing Android performance optimization. I am the host—an Android performance developer at a top-tier smartphone manufacturer in China with years of experience in performance, power consumption analysis, and case studies. This community provides a one-stop-shop for performance knowledge, covering fundamentals, methodologies, tools, and valuable real-world case analyses.</p><span id="more"></span><p>As Android evolves, performance optimization has become a top priority for both smartphone manufacturers and app developers. However, performance is a broad topic, involving everything from the Kernel to the Framework and Apps. Each layer requires deep knowledge. Our team established this technical circle to provide high-quality sharing and systematic learning for Android performance optimization.</p><p>All members are welcome to share knowledge and cases, ask or answer questions, and grow together. We focus on the following topics:</p><p>The current content plan (labels marked with ##) is as follows:</p><ul><li><strong>Trace Analysis</strong> — 1v1 Trace teaching and analysis (Systrace, Perfetto, SimplePerf, etc., by appointment) and various real-world case analyses.</li><li><del><strong>#The Performance#</strong> — Early access to chapters of the “<strong>Android Performance Optimization - Systematic Course</strong>“ e-book. While there are many high-quality resources available, we aim to provide a truly complete and systematic guide covering principles, tools, and practices for both App and System developers.</del></li><li><strong>#Performance Tools#</strong> — Sharing performance analysis tools and usage methods used in Android development. Straightforward 1v1 video guidance for Systrace&#x2F;Perfetto is also provided.</li><li><strong>#Case Analysis#</strong> — Summarizing typical case analysis logic and discussing cases provided by community members. Real-world cases are the best path to learning. (Sensitive information will be masked).</li><li><strong>#Classic Interpretation#</strong> — Deep dives into classic solutions, library analyses, and reviews of top-tier courses like “Android Development Master Class.”</li><li><strong>#Knowledge Sharing#</strong> — Curated excellent articles, blogs, and open-source tools from industry experts.</li><li><strong>#Knowledge Accumulation#</strong> — Highlights from WeChat group chats, Q&amp;As, and blog discussions.</li><li><strong>#Performance Interviews#</strong> — Collection and analysis of Android performance-related interview questions.</li><li><strong>#Programming Languages#</strong> — Sharing tips and techniques for relevant programming languages.</li><li><strong>#Efficiency Improvement#</strong> — Methods and tools to improve developer productivity and engineering efficiency.</li><li><strong>#Industry Trends#</strong> — First-hand interpretations of new performance technologies, including:<ul><li>Reports from industry and academic summits.</li><li>New papers, books, and videos.</li><li>Performance updates in major Android versions.</li><li>Performance content related to new Android hardware.</li><li>Deep dives into performance-related open-source projects.</li></ul></li><li><strong>#Expert Sharing#</strong> — Regular experience sharing and case sessions with industry experts.</li><li><strong>#Job Referrals#</strong> — Internal referral opportunities at major tech companies.</li></ul><h1 id="Paid-Planet-QR-Code"><a href="#Paid-Planet-QR-Code" class="headerlink" title="Paid Planet QR Code"></a>Paid Planet QR Code</h1><p>Scan with WeChat to join (iOS users should use WeChat):<br><img src="/en/images/17039900286551.jpg" alt="Paid Knowledge Planet"></p><h1 id="Free-Planet-QR-Code"><a href="#Free-Planet-QR-Code" class="headerlink" title="Free Planet QR Code"></a>Free Planet QR Code</h1><p>We also have a free version focused on general knowledge sharing:</p><p><img src="/en/images/the-performance/image-20231126142045297.webp" alt="image-20231126142045297"></p><h1 id="WeChat-Official-Account"><a href="#WeChat-Official-Account" class="headerlink" title="WeChat Official Account"></a>WeChat Official Account</h1><p>Follow the WeChat account for more updates:</p><p><img src="/en/images/the-performance/WechatIMG581.webp" alt="Scan WeChat QR Code"></p><h1 id="WeChat-Group"><a href="#WeChat-Group" class="headerlink" title="WeChat Group"></a>WeChat Group</h1><p>A new communication group for real-time discussion on Android performance topics (Responsiveness, Smoothness, ANR, Crash, Memory, Power, etc.).</p><p>Please keep discussions relevant to the themes. Avoid off-topic chatter or vendor debates to maintain the group quality.</p><p>We also have groups for casual chat, running, reading, and GPT. You can message me privately to join.</p><p>If the group is full (over 200) or the code expires, add me on WeChat (ID: 553000664).</p><p><img src="/en/images/17039901616259.jpg"></p><h1 id="Other-Information"><a href="#Other-Information" class="headerlink" title="Other Information"></a>Other Information</h1><ol><li>Blog: <a href="https://www.androidperformance.com/en/">https://www.androidperformance.com/en/</a></li><li>Free Knowledge Planet: <a href="https://t.zsxq.com/ZZ337Am">https://t.zsxq.com/ZZ337Am</a></li><li>Paid Knowledge Planet: <a href="https://t.zsxq.com/Fuvvf6y">https://t.zsxq.com/Fuvvf6y</a></li><li>Zhihu: <a href="https://www.zhihu.com/people/gracker">https://www.zhihu.com/people/gracker</a></li><li>Jike: <a href="https://okjk.co/pJbjFa">https://okjk.co/pJbjFa</a></li><li>Android Weekly (CN): <a href="https://androidweekly.zhubai.love/">https://androidweekly.zhubai.love/</a></li><li>WeChat Account: AndroidPerformance</li><li>Juejin: <a href="https://juejin.cn/user/1816846860560749">https://juejin.cn/user/1816846860560749</a></li></ol>]]></content>
    
    
    <summary type="html">&lt;blockquote&gt;
&lt;p&gt;Currently, the “Knowledge Planet” (ZSXQ) is a paid community. The income mainly goes towards blog server costs and buying cat food for my cat, Douzi. It also serves as my motivation to keep updating the blog. If you find the content helpful, consider joining to support the work! Thank you very much!&lt;/p&gt;
&lt;/blockquote&gt;
&lt;p&gt;The community is named &lt;strong&gt;The Performance&lt;/strong&gt;, a circle for sharing Android performance optimization. I am the host—an Android performance developer at a top-tier smartphone manufacturer in China with years of experience in performance, power consumption analysis, and case studies. This community provides a one-stop-shop for performance knowledge, covering fundamentals, methodologies, tools, and valuable real-world case analyses.&lt;/p&gt;</summary>


    <category term="Reading Notes" scheme="https://androidperformance.com/en/categories/Reading-Notes/"/>
    
    
    <category term="Android" scheme="https://androidperformance.com/en/tags/Android/"/>
    
    <category term="Perfetto" scheme="https://androidperformance.com/en/tags/Perfetto/"/>
    
    <category term="Systrace" scheme="https://androidperformance.com/en/tags/Systrace/"/>
    
    <category term="ANR" scheme="https://androidperformance.com/en/tags/ANR/"/>
    
    <category term="Performance" scheme="https://androidperformance.com/en/tags/Performance/"/>
    
  </entry>
  
  <entry>
    <title>Performance Considerations in Operating System Design</title>
    <link href="https://androidperformance.com/en/2023/08/21/the-performance-design-of-os/"/>
    <id>https://androidperformance.com/en/2023/08/21/the-performance-design-of-os/</id>
    <published>2023-08-21T10:30:48.000Z</published>
    <updated>2026-05-10T23:29:51.068Z</updated>
    
    <content type="html"><![CDATA[<blockquote><p>[!NOTE]<br>This article was originally written by <strong>Yingyun</strong> for my Knowledge Planet. Since the Planet has closed, I am publishing this series on OS performance design here.</p><p>Yingyun is a veteran performance optimization expert with deep insights into system-level tuning, having worked at several major smartphone manufacturers. He is currently active in our community. If you have any questions or feedback, feel free to join our WeChat group.</p></blockquote><h1 id="1-The-Genesis"><a href="#1-The-Genesis" class="headerlink" title="1. The Genesis"></a>1. The Genesis</h1><p>This starts a new series exploring the various considerations in OS architectural design. In reality, these principles apply to the design of any large-scale software.</p><p>These views are my own and carry a subjective perspective. I welcome different viewpoints and hope that through their collision, we can all reach a deeper understanding of the field.</p><span id="more"></span><p>From an OS perspective, I believe the core differences between Android and iOS manifest in four areas:</p><ol><li><strong>IPC Mechanisms</strong> between applications and core services.</li><li><strong>Platform Development Environment</strong>: programming languages, IDEs, and developer ecosystems.</li><li><strong>Application Lifecycle Management</strong>: mechanisms and strategies.</li><li><strong>Runtime Organization</strong> of the kernel and core services.</li></ol><p>Why did they make such different strategic decisions? It all boils to the constraints and goals present during their architectural infancy. A software architecture is a collection of decisions made to be the most “correct” for the present and foreseeable future. There is no absolute right or wrong—only choices made under different pressures. If you swapped the contexts of two equally skilled architects, they would likely end up with very similar designs. Architecture is an engineering craft; it follows predictable patterns.</p><p>The challenge lies in accurately understanding the organization’s environment and anticipating which factors—testability, release efficiency, security, reliability, performance, or scalability—must be prioritized. An experienced architect knows when to be rigid and when to compromise. Because of the law of diminishing marginal utility, these trade-offs continue throughout the software’s entire lifecycle.</p><p><strong>Key takeaways:</strong></p><ol><li>Software architecture design varies across different projects based on phase and constraints.</li><li>Design decisions are fluid and happen continuously throughout the product lifecycle.</li></ol><p>Interestingly, optimization goals often conflict. For example, increasing developer efficiency often comes at the cost of runtime performance. What were the priorities for the original designers of Android and iOS? To answer that, we must first define the relationship between the OS, the application, and the kernel.</p><h1 id="2-Mechanism-vs-Strategy"><a href="#2-Mechanism-vs-Strategy" class="headerlink" title="2. Mechanism vs. Strategy"></a>2. Mechanism vs. Strategy</h1><p>An Operating System is part of the software stack built on top of hardware. Together with applications, it forms the complete software environment that leverages hardware to serve the user.</p><p>From the hardware’s perspective, both the OS and the app are just software. The OS just has higher privileges (CPU supervisor mode) to interact directly with hardware or handle interrupts. From a developer’s perspective, however, they are worlds apart. The app uses the OS’s capabilities to fulfill business logic or access hardware (e.g., playing audio, storing data).</p><p>From a user experience (UX) perspective, the hardware, OS, and app are a single entity. If they fail to collaborate, the device feels broken. All three have an obligation to cooperate to satisfy the consumer.</p><p>Most modern OSs consist of a <strong>Kernel</strong> and <strong>System Services</strong>:</p><ul><li><strong>macOS&#x2F;iOS</strong>: The kernel is Darwin (comprising XNU and MACH microkernels). System services are a collection of daemons providing APIs for data management, UI, etc.</li><li><strong>Android</strong>: The kernel is Linux. System services include C++ daemons (like <code>SurfaceFlinger</code>) and Java daemons (like <code>SystemServer</code>), providing APIs for rendering, resource management, etc.</li></ul><p>While many OSs use similar foundations, the way they are deployed matters. Running an OS is not the same as running it <em>well</em>.</p><p>A classic OS design principle is the <strong>separation of Mechanism and Strategy</strong>:</p><ul><li><strong>Mechanism</strong>: Provides the capability (the “How”).</li><li><strong>Strategy</strong>: Decides how to use that capability (the “What”).</li></ul><p>In Linux, memory management, process management, and VFS are <strong>mechanisms</strong>. The specific memory allocator, the process scheduler, and the specific filesystem are <strong>strategies</strong>.</p><p>Furthermore, a system service identifying which processes are user-facing vs. background tasks and syncing that to the scheduler is a <strong>strategy</strong> built on top of the process management <strong>mechanism</strong>. Similarly, Dynamic Voltage and Frequency Scaling (DVFS) is a strategy for hardware power management mechanisms.</p><p>Mechanisms might be similar across OSs, but strategies vary wildly. This depends on the designer’s understanding of the target service. Early Android followed a desktop-like architecture. Over years of “aggressive” modification by Chinese manufacturers, it has become more iOS-like—aligning better with what a mobile device actually needs.</p><h1 id="3-Perspective-Decisions"><a href="#3-Perspective-Decisions" class="headerlink" title="3. Perspective Decisions"></a>3. Perspective Decisions</h1><p>Apple’s OSs (macOS, iOS, watchOS, etc.) share underlying mechanisms but have radically different strategies. iOS uses a “restricted multitasking” strategy for power&#x2F;performance reasons, while macOS is true multitasking. This wasn’t a technical limitation for iOS; it was a deliberate design choice.</p><p><strong>Android</strong> is an open-source project (AOSP). Manufacturers take AOSP, add hardware-specific code and their own services. Since manufacturers have different business models and user bases, they modify AOSP differently. The market ultimately judges which modification is superior.</p><p>Technically, AOSP provides many mechanisms but lacks cohesive “consumer” strategies. Google implements those strategies in its proprietary GMS (Google Mobile Services). Manufacturers (especially in China) have filled this “strategy gap” by tailoring AOSP to local consumer needs.</p><h3 id="The-Origin-Story"><a href="#The-Origin-Story" class="headerlink" title="The Origin Story"></a>The Origin Story</h3><p>In <em>Becoming Steve Jobs</em>, it’s noted that Jobs initially opposed third-party apps on the iPhone due to power and security concerns. He wanted a device with a “perfect” user experience. He preferred a closed system where Apple controlled every variable to ensure elegance. Because the iPhone used a macOS kernel (XNU), which is resource-heavy, letting third-party code run freely on 2007 hardware was unthinkable.</p><p>Eventually, the VP team convinced him that the success of the iTunes + App Store model was too great to ignore. Even then, Apple built its own OS, its own IDE (Xcode), and its own store to define what a “best app” should look like.</p><p>Contrast this with <strong>Android</strong>. Andy Rubin’s goal was a truly open system to balance the interests of developers, manufacturers, and carriers. This required using off-the-shelf components to deploy quickly. There was no time for the same level of polishing because they were in a race for survival.</p><p>Android chose <strong>Java</strong> because it was the most popular language at the time. While Java’s overhead was high for 2007 mobile hardware, it offered portability and a massive developer pool. To make it work, they built a specialized VM (Dalvik&#x2F;ART). Luckily, Android hit the “golden decade” of exploding mobile CPU performance, which helped it hide its architectural weight compared to iOS.</p><h3 id="The-Power-of-the-IDE"><a href="#The-Power-of-the-IDE" class="headerlink" title="The Power of the IDE"></a>The Power of the IDE</h3><p>Apple’s dominance in its ecosystem is largely due to <strong>Xcode</strong>. It integrates performance analysis, debugging, and distribution so seamlessly that developers can find bottlenecks with minimal learning. LLVM, Swift, and SwiftUI are all tools designed to help developers write software that fits the system’s needs perfectly.</p><p>Designing an OS is a means to an end (profit). To achieve that, you must help developers write good code. Many OSs provide the capability but leave the quality to the developer. Apple’s approach is: “I’ll give you limits, but I’ll also give you the solution to work within them.”</p><h1 id="4-Strategy-Overload-Protection"><a href="#4-Strategy-Overload-Protection" class="headerlink" title="4. Strategy: Overload Protection"></a>4. Strategy: Overload Protection</h1><p>The biggest constraint of mobile devices is the battery and passive cooling. As transistor density nears physical limits and we pack more features into chips, heat is the enemy.</p><p>Mobile OS design naturally necessitates resource limits. Unlike servers, you cannot just let an app run wild. The more constrained the device (like a smartwatch), the stricter the limits.</p><ul><li><strong>Android</strong>: Primarily uses OOM (Out of Memory) management. It has some basic CPU detection for Java threads, but it’s relatively primitive.</li><li><strong>iOS</strong>: Has a massive suite of protections. An app is terminated if:<ul><li>The device overheats.</li><li>VoIP apps wake the CPU too often.</li><li><code>BackgroundTask</code> time&#x2F;CPU usage exceeds thresholds.</li><li>Disk I&#x2F;O writes exceed limits.</li><li>Memory usage spikes.</li><li>The system suffers from “PageCache Thrashing.”</li></ul></li></ul><p>Google’s “looser” design left room for manufacturers to innovate. However, because these manufacturer-specific “kill” strategies aren’t always documented, developers often resort to “black magic” (keep-alive tricks) to stay running. This leads to a cat-and-mouse game where the user loses.</p><h1 id="5-Strategy-Lifecycle-Management"><a href="#5-Strategy-Lifecycle-Management" class="headerlink" title="5. Strategy: Lifecycle Management"></a>5. Strategy: Lifecycle Management</h1><p>In desktop OSs, an app’s lifecycle is controlled by the app itself. The OS tries to give it as much power as possible.</p><p>On mobile, the OS decides who lives and dies. Android’s design was initially “loose” (desktop-like). iOS was “strict”—apps entering the background have about 5 seconds to finish work before being suspended.</p><p>Manufacturers have implemented “suspension” or “freezing” mechanisms in AOSP, but because they aren’t native core mechanisms, they are often inconsistent. If an app is suspended in iOS, how does it do background work? It uses <strong>BackgroundTask</strong> APIs. The OS controls <em>when</em> the work happens based on system load and power levels.</p><p>This requires a centralized control point, which for Apple is the <strong>App Store</strong>. It validates that an app’s requested background permissions match its functionality. Without a unified store or GMS in some regions, the Android ecosystem has become “disfigured,” with apps using aggressive tactics to stay alive just to receive notifications.</p><h1 id="6-Designing-for-the-Future"><a href="#6-Designing-for-the-Future" class="headerlink" title="6. Designing for the Future"></a>6. Designing for the Future</h1><p>The history of electronics is a move toward specialized hardware replacing general CPU tasks (DSA - Domain Specific Architecture). As we hit the end of the “CPU performance dividend,” the next decade belongs to specialized silicon, compilers, and architectures.</p><p>Apple’s <strong>M1</strong> is the perfect example. It’s not just a faster CPU; it’s a collection of specialized engines (video, media, neural) that outperform general-purpose chips by a massive margin in specific scenarios.</p><p>To provide a premium experience, you need an <strong>Optimization Matrix</strong>: the OS, the IDE, cloud coordination, and specialized hardware working together. It’s no longer just about the code; it’s about the entire loop.</p><hr><h1 id="About-Me-amp-amp-Blog"><a href="#About-Me-amp-amp-Blog" class="headerlink" title="About Me &amp;&amp; Blog"></a>About Me &amp;&amp; Blog</h1><p>(Links and introduction)</p>]]></content>
    
    
    <summary type="html">&lt;blockquote&gt;
&lt;p&gt;[!NOTE]&lt;br&gt;This article was originally written by &lt;strong&gt;Yingyun&lt;/strong&gt; for my Knowledge Planet. Since the Planet has closed, I am publishing this series on OS performance design here.&lt;/p&gt;
&lt;p&gt;Yingyun is a veteran performance optimization expert with deep insights into system-level tuning, having worked at several major smartphone manufacturers. He is currently active in our community. If you have any questions or feedback, feel free to join our WeChat group.&lt;/p&gt;
&lt;/blockquote&gt;
&lt;h1 id=&quot;1-The-Genesis&quot;&gt;&lt;a href=&quot;#1-The-Genesis&quot; class=&quot;headerlink&quot; title=&quot;1. The Genesis&quot;&gt;&lt;/a&gt;1. The Genesis&lt;/h1&gt;&lt;p&gt;This starts a new series exploring the various considerations in OS architectural design. In reality, these principles apply to the design of any large-scale software.&lt;/p&gt;
&lt;p&gt;These views are my own and carry a subjective perspective. I welcome different viewpoints and hope that through their collision, we can all reach a deeper understanding of the field.&lt;/p&gt;</summary>


    <category term="Android" scheme="https://androidperformance.com/en/categories/Android/"/>
    
    
    <category term="Android" scheme="https://androidperformance.com/en/tags/Android/"/>
    
    <category term="Memory" scheme="https://androidperformance.com/en/tags/Memory/"/>
    
    <category term="Performance" scheme="https://androidperformance.com/en/tags/Performance/"/>
    
    <category term="RenderThread" scheme="https://androidperformance.com/en/tags/RenderThread/"/>
    
    <category term="Java" scheme="https://androidperformance.com/en/tags/Java/"/>
    
  </entry>
  
  <entry>
    <title>Can an App Really Do Whatever It Wants With System Permissions?</title>
    <link href="https://androidperformance.com/en/2023/05/14/bad-android-app-with-system-permissions/"/>
    <id>https://androidperformance.com/en/2023/05/14/bad-android-app-with-system-permissions/</id>
    <published>2023-05-14T12:15:17.000Z</published>
    <updated>2026-05-10T23:29:51.066Z</updated>
    
    <content type="html"><![CDATA[<p>A while ago, a certain App became very popular because it exploited Android system vulnerabilities to gain system permissions and did a lot of things. I wanted to see what these Apps did after gaining system permissions by exploiting system vulnerabilities, hence this article. Due to hasty preparation, some Code was not looked at carefully. Interested students can research it themselves and discuss more. The corresponding articles and Code links are below:</p><ol><li><a href="https://mp.weixin.qq.com/s/P_EYQxOEupqdU0BJMRqWsw">Deep Blue Insight: The Most “Unpardonable” Vulnerabilities of 2022</a></li><li><a href="https://github.com/davinci1010/pinduoduo_backdoor">XXX apk embedded privilege escalation code and dynamic delivery dex analysis</a></li><li><a href="https://mp.weixin.qq.com/s/x6BSQZ3sE7vDcM0qvsC1EQ">History of Android Deserialization Vulnerability Attack and Defense</a></li></ol><p>Regarding how this App obtained these system permissions, <a href="https://mp.weixin.qq.com/s/x6BSQZ3sE7vDcM0qvsC1EQ">History of Android Deserialization Vulnerability Attack and Defense</a> explains it very clearly, so I won’t repeat it here. I am not a security expert either, but I suggest everyone read this article a few times.</p><span id="more"></span><blockquote><p>Serialization and deserialization refer to the process of converting memory data structures into byte streams for network transmission or saving to disk, and then restoring the byte streams to memory objects. In the field of Web security, there have been many deserialization vulnerabilities, such as PHP deserialization, Java deserialization, etc. Because unexpected program logic is triggered during the deserialization process, attackers can use carefully constructed byte streams to trigger and exploit vulnerabilities to ultimately achieve goals such as arbitrary code execution.</p></blockquote><p>This article mainly looks at the Dex provided in the <a href="https://github.com/davinci1010/pinduoduo_backdoor">XXX apk embedded privilege escalation code and dynamic delivery dex analysis</a> repository to see what information the App actually wants to know about the user? generally speaking, after the App obtains system permissions, it mainly does the following things (things that normal Apps cannot or are hard to do), treating users with no respect.</p><ol><li>Modifications related to auto-start and associated start, secretly opening or opening by default: Wits and courage battle with mobile phone manufacturers.</li><li>Enable notification permissions.</li><li>Listen to notification content.</li><li>Obtain user’s mobile phone usage information, including installed Apps, usage duration, user ID, user name, etc.</li><li>Modify system settings.</li><li>Make some system permission tools for its own use.</li></ol><p>In addition, it can also be seen that this App has quite deep research on various mobile phone manufacturers, and has specialized processing for terminal manufacturers such as Huawei, Oppo, Vivo, Xiaomi, etc. This is also worth reverse research and defense by mobile phone manufacturers.</p><p>Finally, I also added user comments after this article was published on the WeChat official account, as well as the comment section of the Zhihu answer (the question has been deleted, but I can see it: How to evaluate Pinduoduo suspected of using vulnerabilities to attack user mobile phones, steal competitor software data, and prevent itself from being uninstalled? - Gracker’s answer - Zhihu <a href="https://www.zhihu.com/question/587624599/answer/2927765317">https://www.zhihu.com/question/587624599/answer/2927765317</a>, 2471 likes so far) which can be said to be mind-opening (regarding how Apps can do evil).</p><h1 id="0-Dex-File-Information"><a href="#0-Dex-File-Information" class="headerlink" title="0. Dex File Information"></a>0. Dex File Information</h1><p>The dex files studied in this article were obtained from the <a href="https://github.com/davinci1010/pinduoduo_backdoor">XXX apk embedded privilege escalation code and dynamic delivery dex analysis</a> repository. There are a total of 37 Dex files, not many, and not large, let’s look at them slowly. These files are dynamically delivered through the backend server and then dynamically loaded when the App starts. It can be said to be very hidden. However, after all, Android is open source software. It is still very simple to capture the behavior of an App. These Dex files were captured by packet capture, so it can be said that the stolen goods are all there.</p><p><img src="/en/images/bad-android-app-with-system-permissions/5c11aaf4-2f7e-4927-ad35-63da2b24d06e.webp"></p><p>Since they are dex files, just use the decompilation tool of the <a href="https://github.com/tp7309/TTDeDroid">https://github.com/tp7309/TTDeDroid</a> library to open them directly. For example, after I configure it, use the showjar command directly.</p><blockquote><p>showjar 95cd95ab4d694ad8bdf49f07e3599fb3.dex</p></blockquote><p>It is opened with jadx by default, and you can see the decompiled content. We just need to focus on the code logic inside the Executor.</p><p><img src="/en/images/bad-android-app-with-system-permissions/aa2e2237-e69f-40dc-94e9-ac459d5e1255.webp"></p><p>After opening, you can see the specific functional logic. You can see that a dex generally only does one thing, so we just need to focus on the core implementation part of this thing.</p><h1 id="1-Notification-Listening-and-Notification-Permission-Related"><a href="#1-Notification-Listening-and-Notification-Permission-Related" class="headerlink" title="1. Notification Listening and Notification Permission Related"></a>1. Notification Listening and Notification Permission Related</h1><h2 id="1-1-Obtain-Xiaomi-Mobile-Phone-Notification-Content"><a href="#1-1-Obtain-Xiaomi-Mobile-Phone-Notification-Content" class="headerlink" title="1.1 Obtain Xiaomi Mobile Phone Notification Content"></a>1.1 Obtain Xiaomi Mobile Phone Notification Content</h2><ol><li>File: 95cd95ab4d694ad8bdf49f07e3599fb3.dex</li><li>Function: Get the user’s Active notifications</li><li>Class Name: com.google.android.sd.biz_dynamic_dex.xm_ntf_info.XMGetNtfInfoExecutor</li></ol><h3 id="1-Reflectively-get-ServiceManager"><a href="#1-Reflectively-get-ServiceManager" class="headerlink" title="1. Reflectively get ServiceManager"></a>1. Reflectively get ServiceManager</h3><p>Generally, we get the system Service through the getService method of ServiceManager, and then make a remote call.<br><img src="/en/images/bad-android-app-with-system-permissions/20af4e4c-b61a-4a33-9534-0a080ab64d51.webp"></p><h3 id="2-Get-detailed-content-of-notifications-through-NotificationManagerService"><a href="#2-Get-detailed-content-of-notifications-through-NotificationManagerService" class="headerlink" title="2. Get detailed content of notifications through NotificationManagerService"></a>2. Get detailed content of notifications through NotificationManagerService</h3><p>After getting NotificationManager by passing in NotificationManagerService through getService, you can call the <strong>getActiveNotifications</strong> method, and then specifically get the following fields of the Notification:</p><ol><li>Title of the notification</li><li>Package name of the App that generated the notification</li><li>Notification sending time</li><li>key</li><li>channelID: the id of the channel this notification posts to.</li></ol><p>Maybe some people don’t know what this thing is. The picture below shows a typical notification.</p><p><img src="/en/images/bad-android-app-with-system-permissions/b63015fb-7531-42fc-8caa-3d68051afa31.webp"></p><p>Its code is as follows<br><img src="/en/images/bad-android-app-with-system-permissions/fe63fdbc-a45d-44b6-909f-b393dcf7206a.webp"></p><p>You can see that the getActiveNotifications method is <strong>System-only</strong>. Ordinary Apps cannot read Notifications casually, but this App can obtain them because it has permission.</p><p><img src="/en/images/bad-android-app-with-system-permissions/e19519c3-ee58-4fa4-a3ae-9b29109dbd8b.webp"></p><p>Of course, WeChat’s anti-revoke plugin generally uses another method, such as accessibility services. This thing is compliant, but I still recommend that everyone avoid using it if possible. If it can help you prevent revocation, it can obtain the content of the notification, including what you know and what you don’t know.</p><h2 id="1-2-Open-Notification-Permissions-on-Xiaomi-Phones-Push"><a href="#1-2-Open-Notification-Permissions-on-Xiaomi-Phones-Push" class="headerlink" title="1.2. Open Notification Permissions on Xiaomi Phones (Push)"></a>1.2. Open Notification Permissions on Xiaomi Phones (Push)</h2><ol><li>File: 0fc0e98ac2e54bc29401efaddfc8ad7f.dex</li><li>Function: Sometimes Xiaomi users may turn off App notifications. The App wants to know if the user has turned off notifications. If it is turned off, it will be turned on secretly.</li><li>Class Name: com.google.android.sd.biz_dynamic_dex.xm_permission.XMPermissionExecutor</li></ol><p>It seems that this should be quite practical. You naughty user, I send notifications for your own good, how can you bear to turn me off? Let me turn it on for you secretly.<br><img src="/en/images/bad-android-app-with-system-permissions/b8ab6557-355f-4de8-b0f6-3d0900792f26.webp"></p><p>The App calls setNotificationsEnabledForPackage of NotificationManagerService to set notifications, which can force notifications to open.<br>frameworks&#x2F;base&#x2F;services&#x2F;core&#x2F;java&#x2F;com&#x2F;android&#x2F;server&#x2F;notification&#x2F;NotificationManagerService.java<br><img src="/en/images/bad-android-app-with-system-permissions/b21b6515-6636-4e2e-9dd1-a287d11bd1de.webp"></p><p>Then check the setNotificationsEnabledForPackage method of NotificationManagerService to see if the user has opened it successfully.<br>frameworks&#x2F;base&#x2F;services&#x2F;core&#x2F;java&#x2F;com&#x2F;android&#x2F;server&#x2F;notification&#x2F;NotificationManagerService.java<br><img src="/en/images/bad-android-app-with-system-permissions/af06c302-13d6-4ead-b411-40c4c8c8a252.webp"></p><p>And there is separate processing for leb~ Detailed!</p><h2 id="1-3-Open-Notification-Permissions-on-Vivo-Phones-Push"><a href="#1-3-Open-Notification-Permissions-on-Vivo-Phones-Push" class="headerlink" title="1.3. Open Notification Permissions on Vivo Phones (Push)"></a>1.3. Open Notification Permissions on Vivo Phones (Push)</h2><ol><li>File: 2eb20dc580aaa5186ee4a4ceb2374669.dex</li><li>Function: Vivo users will turn off App notifications, so that the App cannot receive notifications on Vivo photos. That won’t do, it must be turned on secretly.</li><li>Class Name: com.google.android.sd.biz_dynamic_dex.vivo_open_push.VivoOpenPushExecutor</li></ol><p>The core is the same as the one above, except that this one is specifically for vivo phones.</p><p><img src="/en/images/bad-android-app-with-system-permissions/05ac00b1-0ccc-49e4-9365-a2710e3daccc.webp"></p><h2 id="1-4-Open-Notification-Permissions-on-Oppo-Phones"><a href="#1-4-Open-Notification-Permissions-on-Oppo-Phones" class="headerlink" title="1.4 Open Notification Permissions on Oppo Phones"></a>1.4 Open Notification Permissions on Oppo Phones</h2><ol><li>File: 67c9e686004f45158e94002e8e781192.dex</li><li>Class Name: com.google.android.sd.biz_dynamic_dex.oppo_notification_ut.OppoNotificationUTExecutor</li></ol><p>It was not decompiled. Looking at the approximate logic, it should be to open the notification permission of the App on oppo phones.</p><p><img src="/en/images/bad-android-app-with-system-permissions/4f295b86-20be-47ad-b59e-e7f0be7d01c6.webp"></p><h2 id="1-5-Notification-Listener"><a href="#1-5-Notification-Listener" class="headerlink" title="1.5 Notification Listener"></a>1.5 Notification Listener</h2><ol><li>File: ab8ed4c3482c42a1b8baef558ee79deb.dex</li><li>Class Name: com.google.android.sd.biz_dynamic_dex.ud_notification_listener.UdNotificationListenerExecutor</li></ol><p>This is a bit powerful. It is listening to the sending of App Notifications, and then conducting statistics.</p><p><img src="/en/images/bad-android-app-with-system-permissions/7dd432c9-64e7-488a-a150-6a14e38bfd27.webp"></p><p>Core code for listening<br><img src="/en/images/bad-android-app-with-system-permissions/a2715b1c-f524-4a68-9bf2-b52502ff08d0.webp"></p><p>I don’t understand this very well either. It’s time to ask my wife who has been doing SystemUI and Launcher for many years for help…. @ShiGong</p><h2 id="1-6-App-Notification-Listener"><a href="#1-6-App-Notification-Listener" class="headerlink" title="1.6 App Notification Listener"></a>1.6 App Notification Listener</h2><ol><li>File: 4f260398-e9d1-4390-bbb9-eeb49c07bf3c.dex</li><li>Class Name: com.google.android.sd.biz_dynamic_dex.notification_listener.NotificationListenerExecutor</li></ol><p>The one above is UdNotificationListenerExecutor, this one is NotificationListenerExecutor. What is UD?</p><p><img src="/en/images/bad-android-app-with-system-permissions/e7569089-5bf1-4dad-8c7f-9b2b4a962b2d.webp"></p><p>The setNotificationListenerAccessGranted called by reflection is a SystemAPI, gaining the right to use notifications. Sure enough, with permission, you can do whatever you want.</p><p><img src="/en/images/bad-android-app-with-system-permissions/9b302ec0-c210-4454-8c0b-8dc90378a61a.webp"></p><p><img src="/en/images/bad-android-app-with-system-permissions/9cb6feaf-8771-41f3-8b39-fd1f2837523b.webp"></p><h2 id="1-7-Open-Notification-Listener-permissions-on-Huawei-Phones"><a href="#1-7-Open-Notification-Listener-permissions-on-Huawei-Phones" class="headerlink" title="1.7 Open Notification Listener permissions on Huawei Phones"></a>1.7 Open Notification Listener permissions on Huawei Phones</h2><ol><li>File: a3937709-b9cc-48fd-8918-163c9cb7c2df.dex</li><li>Class Name: com.google.android.sd.biz_dynamic_dex.hw_notification_listener.HWNotificationListenerExecutor</li></ol><p>Huawei cannot be spared either, hahaha<br><img src="/en/images/bad-android-app-with-system-permissions/06658085-ffa9-4f1f-b578-75963dc40ce7.webp"></p><h2 id="1-8-Open-Notification-permissions-on-Huawei-Phones"><a href="#1-8-Open-Notification-permissions-on-Huawei-Phones" class="headerlink" title="1.8 Open Notification permissions on Huawei Phones"></a>1.8 Open Notification permissions on Huawei Phones</h2><ol><li>File: 257682c986ab449ab9e7c8ae7682fa61.dex</li><li>Class Name: com.google.android.sd.biz_dynamic_dex.hw_permission.HwPermissionExecutor</li></ol><p><img src="/en/images/bad-android-app-with-system-permissions/984dc753-4004-41a4-b2e9-4d528f54918f.webp"></p><h1 id="2-Backup-Status"><a href="#2-Backup-Status" class="headerlink" title="2. Backup Status"></a>2. Backup Status</h1><h2 id="2-1-App-Backup-Status-Related-on-HarmonyOS-for-keeping-alive"><a href="#2-1-App-Backup-Status-Related-on-HarmonyOS-for-keeping-alive" class="headerlink" title="2.1. App Backup Status Related on HarmonyOS, for keeping alive?"></a>2.1. App Backup Status Related on HarmonyOS, for keeping alive?</h2><ol><li>File: 6932a923-9f13-4624-bfea-1249ddfd5505.dex</li><li>Function: Backup Related</li></ol><p>After watching this for a long time, it should be specifically for Huawei phones. After receiving the IBackupSessionCallback callback, execute the PackageManagerEx.startBackupSession method.</p><p><img src="/en/images/bad-android-app-with-system-permissions/f47e03f2-8412-478c-9b06-07090fe2b191.webp"></p><p><img src="/en/images/bad-android-app-with-system-permissions/ab7364d2-55d8-40a6-a667-3f7c8faadfa9.webp"></p><p>I checked the function of this method, start backup or restore session.</p><p><img src="/en/images/bad-android-app-with-system-permissions/a208a5c1-9900-4c2d-9b82-775125ac8dfb.webp"></p><h2 id="2-2-Backup-Status-Related-on-Vivo-Phones"><a href="#2-2-Backup-Status-Related-on-Vivo-Phones" class="headerlink" title="2.2. Backup Status Related on Vivo Phones"></a>2.2. Backup Status Related on Vivo Phones</h2><ol><li>File: 8c34f5dc-f04c-40ba-98d4-7aa7c364b65c.dex</li><li>Function: Backup Related</li></ol><p><img src="/en/images/bad-android-app-with-system-permissions/d3a472cf-28ea-4b45-b92e-5555926a4924.webp"></p><h1 id="3-File-Related"><a href="#3-File-Related" class="headerlink" title="3. File Related"></a>3. File Related</h1><h2 id="3-1-Obtain-SLog-and-SharedPreferences-Content-on-Huawei-Phones"><a href="#3-1-Obtain-SLog-and-SharedPreferences-Content-on-Huawei-Phones" class="headerlink" title="3.1 Obtain SLog and SharedPreferences Content on Huawei Phones"></a>3.1 Obtain SLog and SharedPreferences Content on Huawei Phones</h2><ol><li>File: da03be2689cc463f901806b5b417c9f5.dex</li><li>Class Name: com.google.android.sd.biz_dynamic_dex.hw_get_input.HwGetInputExecutor</li></ol><p>What do you want this for? Take it for data analysis?</p><p><img src="/en/images/bad-android-app-with-system-permissions/cd29a622-f059-4ff6-bf71-b14179ebc4ec.webp"></p><p>Get SharedPreferences</p><p><img src="/en/images/bad-android-app-with-system-permissions/516bf269-d1fe-4a46-bc75-5612a743e055.webp"></p><p>Get slog</p><p><img src="/en/images/bad-android-app-with-system-permissions/f67ba385-70c2-4968-91a0-0499527fc84f.webp"></p><h2 id="4-User-Data"><a href="#4-User-Data" class="headerlink" title="4. User Data"></a>4. User Data</h2><h2 id="4-1-Obtain-data-of-user-using-mobile-phone"><a href="#4-1-Obtain-data-of-user-using-mobile-phone" class="headerlink" title="4.1 Obtain data of user using mobile phone"></a>4.1 Obtain data of user using mobile phone</h2><ol><li>File: 35604479f8854b5d90bc800e912034fc.dex</li><li>Function: You know it is to get the data of the user using the mobile phone just by looking at the name</li><li>Class Name: com.google.android.sd.biz_dynamic_dex.usage_event_all.UsageEventAllExecutor</li></ol><p>Looking at the core logic, it is the same as the usagestates service to obtain data on users using mobile phones. No wonder they know exactly what Apps I have installed on my phone and how long I have used them.</p><p><img src="/en/images/bad-android-app-with-system-permissions/5268eebe-b3c8-45c7-9153-79a2e57c3437.webp"></p><p>So what data can it get? Everything one could wish for~, including but not limited to App startup, exit, suspension, Service changes, Configuration changes, screen on&#x2F;off, power on&#x2F;off, etc. Interested parties can take a look:</p><figure class="highlight java"><table><tr><td class="gutter"><pre><span class="line">1</span><br><span class="line">2</span><br><span class="line">3</span><br><span class="line">4</span><br><span class="line">5</span><br><span class="line">6</span><br><span class="line">7</span><br><span class="line">8</span><br><span class="line">9</span><br><span class="line">10</span><br><span class="line">11</span><br><span class="line">12</span><br><span class="line">13</span><br><span class="line">14</span><br><span class="line">15</span><br><span class="line">16</span><br><span class="line">17</span><br><span class="line">18</span><br><span class="line">19</span><br><span class="line">20</span><br><span class="line">21</span><br><span class="line">22</span><br><span class="line">23</span><br><span class="line">24</span><br><span class="line">25</span><br><span class="line">26</span><br><span class="line">27</span><br><span class="line">28</span><br><span class="line">29</span><br><span class="line">30</span><br><span class="line">31</span><br><span class="line">32</span><br><span class="line">33</span><br><span class="line">34</span><br><span class="line">35</span><br><span class="line">36</span><br><span class="line">37</span><br><span class="line">38</span><br><span class="line">39</span><br><span class="line">40</span><br><span class="line">41</span><br><span class="line">42</span><br><span class="line">43</span><br><span class="line">44</span><br><span class="line">45</span><br><span class="line">46</span><br><span class="line">47</span><br><span class="line">48</span><br><span class="line">49</span><br><span class="line">50</span><br><span class="line">51</span><br><span class="line">52</span><br><span class="line">53</span><br><span class="line">54</span><br><span class="line">55</span><br><span class="line">56</span><br><span class="line">57</span><br><span class="line">58</span><br><span class="line">59</span><br><span class="line">60</span><br><span class="line">61</span><br><span class="line">62</span><br><span class="line">63</span><br><span class="line">64</span><br><span class="line">65</span><br><span class="line">66</span><br><span class="line">67</span><br></pre></td><td class="code"><pre><span class="line">frameworks/base/core/java/android/app/usage/UsageEvents.java</span><br><span class="line">    <span class="keyword">private</span> <span class="keyword">static</span> String <span class="title function_">eventToString</span><span class="params">(<span class="type">int</span> eventType)</span> &#123;</span><br><span class="line">        <span class="keyword">switch</span> (eventType) &#123;</span><br><span class="line">            <span class="keyword">case</span> Event.NONE:</span><br><span class="line">                <span class="keyword">return</span> <span class="string">&quot;NONE&quot;</span>;</span><br><span class="line">            <span class="keyword">case</span> Event.ACTIVITY_PAUSED:</span><br><span class="line">                <span class="keyword">return</span> <span class="string">&quot;ACTIVITY_PAUSED&quot;</span>;</span><br><span class="line">            <span class="keyword">case</span> Event.ACTIVITY_RESUMED:</span><br><span class="line">                <span class="keyword">return</span> <span class="string">&quot;ACTIVITY_RESUMED&quot;</span>;</span><br><span class="line">            <span class="keyword">case</span> Event.FOREGROUND_SERVICE_START:</span><br><span class="line">                <span class="keyword">return</span> <span class="string">&quot;FOREGROUND_SERVICE_START&quot;</span>;</span><br><span class="line">            <span class="keyword">case</span> Event.FOREGROUND_SERVICE_STOP:</span><br><span class="line">                <span class="keyword">return</span> <span class="string">&quot;FOREGROUND_SERVICE_STOP&quot;</span>;</span><br><span class="line">            <span class="keyword">case</span> Event.ACTIVITY_STOPPED:</span><br><span class="line">                <span class="keyword">return</span> <span class="string">&quot;ACTIVITY_STOPPED&quot;</span>;</span><br><span class="line">            <span class="keyword">case</span> Event.END_OF_DAY:</span><br><span class="line">                <span class="keyword">return</span> <span class="string">&quot;END_OF_DAY&quot;</span>;</span><br><span class="line">            <span class="keyword">case</span> Event.ROLLOVER_FOREGROUND_SERVICE:</span><br><span class="line">                <span class="keyword">return</span> <span class="string">&quot;ROLLOVER_FOREGROUND_SERVICE&quot;</span>;</span><br><span class="line">            <span class="keyword">case</span> Event.CONTINUE_PREVIOUS_DAY:</span><br><span class="line">                <span class="keyword">return</span> <span class="string">&quot;CONTINUE_PREVIOUS_DAY&quot;</span>;</span><br><span class="line">            <span class="keyword">case</span> Event.CONTINUING_FOREGROUND_SERVICE:</span><br><span class="line">                <span class="keyword">return</span> <span class="string">&quot;CONTINUING_FOREGROUND_SERVICE&quot;</span>;</span><br><span class="line">            <span class="keyword">case</span> Event.CONFIGURATION_CHANGE:</span><br><span class="line">                <span class="keyword">return</span> <span class="string">&quot;CONFIGURATION_CHANGE&quot;</span>;</span><br><span class="line">            <span class="keyword">case</span> Event.SYSTEM_INTERACTION:</span><br><span class="line">                <span class="keyword">return</span> <span class="string">&quot;SYSTEM_INTERACTION&quot;</span>;</span><br><span class="line">            <span class="keyword">case</span> Event.USER_INTERACTION:</span><br><span class="line">                <span class="keyword">return</span> <span class="string">&quot;USER_INTERACTION&quot;</span>;</span><br><span class="line">            <span class="keyword">case</span> Event.SHORTCUT_INVOCATION:</span><br><span class="line">                <span class="keyword">return</span> <span class="string">&quot;SHORTCUT_INVOCATION&quot;</span>;</span><br><span class="line">            <span class="keyword">case</span> Event.CHOOSER_ACTION:</span><br><span class="line">                <span class="keyword">return</span> <span class="string">&quot;CHOOSER_ACTION&quot;</span>;</span><br><span class="line">            <span class="keyword">case</span> Event.NOTIFICATION_SEEN:</span><br><span class="line">                <span class="keyword">return</span> <span class="string">&quot;NOTIFICATION_SEEN&quot;</span>;</span><br><span class="line">            <span class="keyword">case</span> Event.STANDBY_BUCKET_CHANGED:</span><br><span class="line">                <span class="keyword">return</span> <span class="string">&quot;STANDBY_BUCKET_CHANGED&quot;</span>;</span><br><span class="line">            <span class="keyword">case</span> Event.NOTIFICATION_INTERRUPTION:</span><br><span class="line">                <span class="keyword">return</span> <span class="string">&quot;NOTIFICATION_INTERRUPTION&quot;</span>;</span><br><span class="line">            <span class="keyword">case</span> Event.SLICE_PINNED:</span><br><span class="line">                <span class="keyword">return</span> <span class="string">&quot;SLICE_PINNED&quot;</span>;</span><br><span class="line">            <span class="keyword">case</span> Event.SLICE_PINNED_PRIV:</span><br><span class="line">                <span class="keyword">return</span> <span class="string">&quot;SLICE_PINNED_PRIV&quot;</span>;</span><br><span class="line">            <span class="keyword">case</span> Event.SCREEN_INTERACTIVE:</span><br><span class="line">                <span class="keyword">return</span> <span class="string">&quot;SCREEN_INTERACTIVE&quot;</span>;</span><br><span class="line">            <span class="keyword">case</span> Event.SCREEN_NON_INTERACTIVE:</span><br><span class="line">                <span class="keyword">return</span> <span class="string">&quot;SCREEN_NON_INTERACTIVE&quot;</span>;</span><br><span class="line">            <span class="keyword">case</span> Event.KEYGUARD_SHOWN:</span><br><span class="line">                <span class="keyword">return</span> <span class="string">&quot;KEYGUARD_SHOWN&quot;</span>;</span><br><span class="line">            <span class="keyword">case</span> Event.KEYGUARD_HIDDEN:</span><br><span class="line">                <span class="keyword">return</span> <span class="string">&quot;KEYGUARD_HIDDEN&quot;</span>;</span><br><span class="line">            <span class="keyword">case</span> Event.DEVICE_SHUTDOWN:</span><br><span class="line">                <span class="keyword">return</span> <span class="string">&quot;DEVICE_SHUTDOWN&quot;</span>;</span><br><span class="line">            <span class="keyword">case</span> Event.DEVICE_STARTUP:</span><br><span class="line">                <span class="keyword">return</span> <span class="string">&quot;DEVICE_STARTUP&quot;</span>;</span><br><span class="line">            <span class="keyword">case</span> Event.USER_UNLOCKED:</span><br><span class="line">                <span class="keyword">return</span> <span class="string">&quot;USER_UNLOCKED&quot;</span>;</span><br><span class="line">            <span class="keyword">case</span> Event.USER_STOPPED:</span><br><span class="line">                <span class="keyword">return</span> <span class="string">&quot;USER_STOPPED&quot;</span>;</span><br><span class="line">            <span class="keyword">case</span> Event.LOCUS_ID_SET:</span><br><span class="line">                <span class="keyword">return</span> <span class="string">&quot;LOCUS_ID_SET&quot;</span>;</span><br><span class="line">            <span class="keyword">case</span> Event.APP_COMPONENT_USED:</span><br><span class="line">                <span class="keyword">return</span> <span class="string">&quot;APP_COMPONENT_USED&quot;</span>;</span><br><span class="line">            <span class="keyword">default</span>:</span><br><span class="line">                <span class="keyword">return</span> <span class="string">&quot;UNKNOWN_TYPE_&quot;</span> + eventType;</span><br><span class="line">        &#125;</span><br><span class="line">    &#125;</span><br></pre></td></tr></table></figure><h2 id="4-2-Obtain-User-Usage-Data"><a href="#4-2-Obtain-User-Usage-Data" class="headerlink" title="4.2 Obtain User Usage Data"></a>4.2 Obtain User Usage Data</h2><ol><li>File: b50477f70bd14479a50e6fa34e18b2a0.dex</li><li>Class Name: com.google.android.sd.biz_dynamic_dex.usage_event.UsageEventExecutor</li></ol><p>The one above is UsageEventAllExecutor, and this one is UsageEventExecutor, which mainly gets data related to user usage of Apps, such as when to open a certain App, when to close a certain App. It is very clever, truly malignant.</p><p><img src="/en/images/bad-android-app-with-system-permissions/9c96abde-38b2-479f-b169-35e94b74058d.webp"></p><h2 id="4-3-Obtain-User-Usage-Data"><a href="#4-3-Obtain-User-Usage-Data" class="headerlink" title="4.3 Obtain User Usage Data"></a>4.3 Obtain User Usage Data</h2><ol><li>File: 1a68d982e02fc22b464693a06f528fac.dex</li><li>Class Name: com.google.android.sd.biz_dynamic_dex.app_usage_observer.AppUsageObserver</li></ol><p>It looks like the permissions for App Usage are registered, but the specific Code has not come out, so it is hard to analyze.</p><p><img src="/en/images/bad-android-app-with-system-permissions/9927ea29-7466-4fa3-9023-64b89eba0c89.webp"></p><h1 id="5-Widget-and-icon-Related"><a href="#5-Widget-and-icon-Related" class="headerlink" title="5. Widget and icon Related"></a>5. Widget and icon Related</h1><p>According to reminders from onlookers, the App can forge an icon through Widget. When the user long-presses the icon to uninstall the App, you think you have uninstalled it, but in fact you have deleted the Widget it forged, and the real App is still there (But I haven’t encountered it. Doing this is really mind-opening, and doesn’t treat Android users as humans).</p><h2 id="5-1-Add-Widget-on-Vivo-Phones"><a href="#5-1-Add-Widget-on-Vivo-Phones" class="headerlink" title="5.1. Add Widget on Vivo Phones"></a>5.1. Add Widget on Vivo Phones</h2><ol><li>File: f9b6b139-4516-4ac2-896d-8bc3eb1f2d03.dex</li><li>Class Name: com.google.android.sd.biz_dynamic_dex.vivo_widget.VivoAddWidgetExecutor</li></ol><p>This is relatively easy to understand, adding a Widget on Vivo phones.</p><p><img src="/en/images/bad-android-app-with-system-permissions/8daee130-2e64-45e9-93ba-f89da87cc06c.webp"></p><h2 id="5-2-Obtain-icon-related-information"><a href="#5-2-Obtain-icon-related-information" class="headerlink" title="5.2 Obtain icon related information"></a>5.2 Obtain icon related information</h2><ol><li>File: da60112a4b2848adba2ac11f412cccc7.dex</li><li>Class Name: com.google.android.sd.biz_dynamic_dex.get_icon_info.GetIconInfoExecutor</li></ol><p>This is easy to understand. Obtain icon related information, such as which row and column on Launcher, whether it is in a folder. The question is what is this for??? Puzzle.</p><p><img src="/en/images/bad-android-app-with-system-permissions/eeb3b34d-520d-4b30-87de-8d4e934cb766.webp"></p><h2 id="5-3-Add-Widget-on-Oppo-Phones"><a href="#5-3-Add-Widget-on-Oppo-Phones" class="headerlink" title="5.3 Add Widget on Oppo Phones"></a>5.3 Add Widget on Oppo Phones</h2><ol><li>File: 75dcc8ea-d0f9-4222-b8dd-2a83444f9cd6.dex</li><li>Class Name: com.google.android.sd.biz_dynamic_dex.oppoaddwidget.OppoAddWidgetExecutor</li></ol><p><img src="/en/images/bad-android-app-with-system-permissions/3456e3f2-2960-42f4-b26f-ce0e83c4975c.webp"></p><h2 id="5-4-Update-icon-on-Xiaomi-Phones"><a href="#5-4-Update-icon-on-Xiaomi-Phones" class="headerlink" title="5.4 Update icon on Xiaomi Phones?"></a>5.4 Update icon on Xiaomi Phones?</h2><ol><li>File: 5d372522-b6a4-4c1b-a0b4-8114d342e6c0.dex</li><li>Class Name: com.google.android.sd.biz_dynamic_dex.xm_akasha.XmAkashaExecutor</li></ol><p>Desktop icon, shortcut related operations on Xiaomi phones. Xiaomi students come to claim.</p><p><img src="/en/images/bad-android-app-with-system-permissions/93161c32-4d8f-43b2-8812-c4ff5c87b081.webp"></p><h1 id="6-Auto-start-Associated-Start-Keep-Alive-Related"><a href="#6-Auto-start-Associated-Start-Keep-Alive-Related" class="headerlink" title="6. Auto-start, Associated Start, Keep Alive Related"></a>6. Auto-start, Associated Start, Keep Alive Related</h1><h2 id="6-1-Open-Auto-start-on-Oppo-Phones"><a href="#6-1-Open-Auto-start-on-Oppo-Phones" class="headerlink" title="6.1 Open Auto-start on Oppo Phones"></a>6.1 Open Auto-start on Oppo Phones</h2><ol><li>File: e723d560-c2ee-461e-b2a1-96f85b614f2b.dex</li><li>Class Name: com.google.android.sd.biz_dynamic_dex.oppo_boot_perm.OppoBootPermExecutor</li></ol><p>Looking at the pile below, you know it is related to auto-start. careful. It seems that auto-start permission is a pain for every App.</p><p><img src="/en/images/bad-android-app-with-system-permissions/70128e44-0cdb-4081-bf79-30009c4846e9.webp"></p><p><img src="/en/images/bad-android-app-with-system-permissions/72ce602f-0f5b-4939-b78f-23b4d3de1c23.webp"></p><h2 id="6-2-Open-Vivo-Associated-Start-Permission"><a href="#6-2-Open-Vivo-Associated-Start-Permission" class="headerlink" title="6.2 Open Vivo Associated Start Permission"></a>6.2 Open Vivo Associated Start Permission</h2><ol><li>File: 8b56d820-cac2-4ca0-8a3a-1083c5cca7ae.dex</li><li>Class Name: com.google.android.sd.biz_dynamic_dex.vivo_association_start.VivoAssociationStartExecutor</li></ol><p>Look at the name and you know it is permission related to associated start. Vivo students come to claim it.<br><img src="/en/images/bad-android-app-with-system-permissions/a0a34e29-2a15-41c8-a172-8bd288766b1b.webp"></p><p>Directly wrote a node into it</p><p><img src="/en/images/bad-android-app-with-system-permissions/d87b6aaf-3d5d-480a-8307-6310f65c0aa8.webp"></p><h2 id="6-3-Turn-off-Huawei-Power-Consumption-Wizard"><a href="#6-3-Turn-off-Huawei-Power-Consumption-Wizard" class="headerlink" title="6.3 Turn off Huawei Power Consumption Wizard"></a>6.3 Turn off Huawei Power Consumption Wizard</h2><ol><li>File: 7c6e6702-e461-4315-8631-eee246aeba95.dex</li><li>Class Name: com.google.android.sd.biz_dynamic_dex.hw_hide_power_window.HidePowerWindowExecutor</li></ol><p>Looking at the name and implementation, it should be related to Huawei’s power consumption wizard. Huawei students can take a look.</p><p><img src="/en/images/bad-android-app-with-system-permissions/a1415c92-cd11-45e6-a490-622f5cceeaee.webp"></p><p><img src="/en/images/bad-android-app-with-system-permissions/3199ec82-4927-4a36-b02b-9600ca1c5657.webp"></p><h2 id="6-4-Vivo-Models-Keep-Alive-Related"><a href="#6-4-Vivo-Models-Keep-Alive-Related" class="headerlink" title="6.4 Vivo Models Keep Alive Related"></a>6.4 Vivo Models Keep Alive Related</h2><ol><li>File: 7877ec6850344e7aad5fdd57f6abf238.dex</li><li>Class Name: com.google.android.sd.biz_dynamic_dex.vivo_get_loc.VivoGetLocExecutor</li></ol><p>Guessing it is related to keep alive. Vivo students can come and claim it.</p><p><img src="/en/images/bad-android-app-with-system-permissions/fdcd9428-0f8e-4057-ae6c-8ac906f70727.webp"></p><p><img src="/en/images/bad-android-app-with-system-permissions/60e1e0bc-5075-4369-8434-90a970bec7b3.webp"></p><h1 id="7-Installation-and-Uninstallation-Related"><a href="#7-Installation-and-Uninstallation-Related" class="headerlink" title="7. Installation and Uninstallation Related"></a>7. Installation and Uninstallation Related</h1><h2 id="7-1-Vivo-Phone-Rollback-Uninstallation"><a href="#7-1-Vivo-Phone-Rollback-Uninstallation" class="headerlink" title="7.1 Vivo Phone Rollback Uninstallation"></a>7.1 Vivo Phone Rollback Uninstallation</h2><ol><li>File: d643e0f9a68342bc8403a69e7ee877a7.dex</li><li>Class Name: com.google.android.sd.biz_dynamic_dex.vivo_rollback_uninstall.VivoRollbackUninstallExecutor</li></ol><p>This looks like rolling back to the preset version after the user uninstalls the App. Well, this is a routine operation.<br><img src="/en/images/bad-android-app-with-system-permissions/ef50f808-3b59-4094-83cc-8a687146dbbf.webp"></p><h2 id="7-2-Vivo-Phone-App-Uninstallation"><a href="#7-2-Vivo-Phone-App-Uninstallation" class="headerlink" title="7.2 Vivo Phone App Uninstallation"></a>7.2 Vivo Phone App Uninstallation</h2><ol><li>File: be7a2b643d7e8543f49994ffeb0ee0b6.dex</li><li>Class Name: com.google.android.sd.biz_dynamic_dex.vivo_official_uninstall.OfficialUntiUninstallV3</li></ol><p>Looking at the name and implementation, it is also related to uninstallation rollback.<br><img src="/en/images/bad-android-app-with-system-permissions/e7309401-dad1-45fa-a8f6-cf36bd6b628f.webp"></p><h2 id="7-3-Vivo-Phone-App-Uninstallation-Related"><a href="#7-3-Vivo-Phone-App-Uninstallation-Related" class="headerlink" title="7.3 Vivo Phone App Uninstallation Related"></a>7.3 Vivo Phone App Uninstallation Related</h2><ol><li>File: 183bb87aa7d744a195741ce524577dd0.dex</li><li>Class Name: com.google.android.sd.biz_dynamic_dex.vivo_official_uninstall.VivoOfficialUninstallExecutor</li></ol><p>Same as above<br><img src="/en/images/bad-android-app-with-system-permissions/ecb189bb-537b-4094-8324-63ff483bc181.webp"></p><h1 id="Others"><a href="#Others" class="headerlink" title="Others"></a>Others</h1><h2 id="SyncExecutor"><a href="#SyncExecutor" class="headerlink" title="SyncExecutor"></a>SyncExecutor</h2><ol><li>File: f4247da0-6274-44eb-859a-b4c35ec0dd71.dex</li><li>Class Name: com.google.android.sd.biz_dynamic_dex.sync.SyncExecutor</li></ol><p>I didn’t understand what it does. The core should be Utils.updateSid, but I didn’t see where it is implemented.</p><p><img src="/en/images/bad-android-app-with-system-permissions/9bcca5a3-11c5-47f2-8afd-3fea659d481d.webp"></p><h2 id="UdParseNotifyMessageExecutor"><a href="#UdParseNotifyMessageExecutor" class="headerlink" title="UdParseNotifyMessageExecutor"></a>UdParseNotifyMessageExecutor</h2><ol><li>File: f35735a5cbf445c785237797138d246a.dex</li><li>Class Name: com.google.android.sd.biz_dynamic_dex.ud_parse_nmessage.UdParseNotifyMessageExecutor</li></ol><p>Looking at the name, it should be parsing Notify Message sent from the remote end. Specific function unknown.<br><img src="/en/images/bad-android-app-with-system-permissions/2399f610-74d0-4a2c-a0f1-6fcc24e93e1c.webp"></p><h2 id="6-3-TDLogcatExecutor"><a href="#6-3-TDLogcatExecutor" class="headerlink" title="6.3 TDLogcatExecutor"></a>6.3 TDLogcatExecutor</h2><ol><li>File<ol><li>8aeb045fad9343acbbd1a26998b6485a.dex</li><li>2aa151e2cfa04acb8fb96e523807ca6b.dex</li></ol></li><li>Class Name<ol><li>com.google.android.sd.biz_dynamic_dex.td.logcat.TDLogcatExecutor</li><li>com.google.android.sd.biz_dynamic_dex.td.logcat.TDLogcatExecutor</li></ol></li></ol><p>I didn’t quite understand what this is for. It looks like keep alive but not like it. I will analyze it slowly when I have time later.<br><img src="/en/images/bad-android-app-with-system-permissions/706197f5-9e65-4d23-9bf5-27ad363066c2.webp"></p><h2 id="6-4-QueryLBSInfoExecutor"><a href="#6-4-QueryLBSInfoExecutor" class="headerlink" title="6.4 QueryLBSInfoExecutor"></a>6.4 QueryLBSInfoExecutor</h2><ol><li>File: 74168acd-14b4-4ff8-842e-f92b794d7abf.dex</li><li>Class Name: com.google.android.sd.biz_dynamic_dex.query_lbs_info.QueryLBSInfoExecutor</li></ol><p>Get LBS Info</p><p><img src="/en/images/bad-android-app-with-system-permissions/25a798bd-2480-4481-b535-e7d398324465.webp"></p><h2 id="6-5-WriteSettingsExecutor"><a href="#6-5-WriteSettingsExecutor" class="headerlink" title="6.5 WriteSettingsExecutor"></a>6.5 WriteSettingsExecutor</h2><ol><li>File: 6afc90e406bf46e4a29956aabcdfe004.dex</li><li>Class Name: com.google.android.sd.biz_dynamic_dex.write_settings.WriteSettingsExecutor</li></ol><p>Looking at the name, it should be a utility class for writing Settings fields. As for what fields to write, it should be dynamically delivered.</p><p><img src="/en/images/bad-android-app-with-system-permissions/c62895d1-9e94-47e1-9440-0b77287e7506.webp"></p><h2 id="6-6-OppoSettingExecutor"><a href="#6-6-OppoSettingExecutor" class="headerlink" title="6.6 OppoSettingExecutor"></a>6.6 OppoSettingExecutor</h2><ol><li>File: 61517b68-7c09-4021-9aaa-cdebeb9549f2.dex</li><li>Class Name: com.google.android.sd.biz_dynamic_dex.opposettingproxy.OppoSettingExecutor</li></ol><p>Setting proxy?? Didn’t understand what it does. Oppo students come to claim. Could it be another form of keep alive?</p><p><img src="/en/images/bad-android-app-with-system-permissions/0e4a2313-9f30-4eac-832c-044853582742.webp"></p><h2 id="6-7-CheckAsterExecutor"><a href="#6-7-CheckAsterExecutor" class="headerlink" title="6.7 CheckAsterExecutor"></a>6.7 CheckAsterExecutor</h2><ol><li>File: 561341f5f7976e13efce7491887f1306.dex</li><li>Class Name: com.google.android.sd.biz_dynamic_dex.check_aster.CheckAsterExecutor</li></ol><p>Check aster? Not very understandable.</p><p><img src="/en/images/bad-android-app-with-system-permissions/a6867dc8-0800-4387-83c1-942dca12ed3c.webp"></p><h2 id="6-8-OppoCommunityIdExecutor"><a href="#6-8-OppoCommunityIdExecutor" class="headerlink" title="6.8 OppoCommunityIdExecutor"></a>6.8 OppoCommunityIdExecutor</h2><ol><li>File: 538278f3-9f68-4fce-be10-12635b9640b2.dex</li><li>Class Name: com.google.android.sd.biz_dynamic_dex.oppo_community_id.OppoCommunityIdExecutor</li></ol><p>Get Oppo user’s ID? What do you want this for?</p><p><img src="/en/images/bad-android-app-with-system-permissions/b4f11ad0-7e6e-4fad-99ce-2ec63a08962e.webp"></p><h2 id="6-9-GetSettingsUsernameExecutor"><a href="#6-9-GetSettingsUsernameExecutor" class="headerlink" title="6.9 GetSettingsUsernameExecutor"></a>6.9 GetSettingsUsernameExecutor</h2><ol><li>File: 4569a29c-b5a8-4dcf-a3a6-0a2f0bfdd493.dex</li><li>Class Name: com.google.android.sd.biz_dynamic_dex.oppo_get_settings_username.GetSettingsUsernameExecutor</li></ol><p>Get the username of the Oppo phone user. Say, what do you need this for?</p><p><img src="/en/images/bad-android-app-with-system-permissions/0341902d-f1ed-4344-a724-9110e3fe22d7.webp"></p><h2 id="6-10-LogcatExecutor"><a href="#6-10-LogcatExecutor" class="headerlink" title="6.10 LogcatExecutor"></a>6.10 LogcatExecutor</h2><ol><li>File: 218a37ea-710d-49cb-b872-2a47a1115c69.dex</li><li>Class Name: com.google.android.sd.biz_dynamic_dex.logcat.LogcatExecutor</li></ol><p>Configure Log parameters<br><img src="/en/images/bad-android-app-with-system-permissions/1e57c31e-533c-40dc-99c4-ddfe261af614.webp"></p><h2 id="6-11-VivoBrowserSettingsExecutor"><a href="#6-11-VivoBrowserSettingsExecutor" class="headerlink" title="6.11 VivoBrowserSettingsExecutor"></a>6.11 VivoBrowserSettingsExecutor</h2><ol><li>File: 136d4651-df47-41b4-bb80-2ec0ab1bc775.dex</li><li>Class Name: com.google.android.sd.biz_dynamic_dex.vivo_browser_settings.VivoBrowserSettingsExecutor</li></ol><p>Vivo browser related settings, don’t quite understand what it wants to do.</p><p><img src="/en/images/bad-android-app-with-system-permissions/a8513806-df24-4ec8-bc3f-930ad0cf6ce4.webp"></p><h1 id="Comments-area-is-more-exciting-than-the-article"><a href="#Comments-area-is-more-exciting-than-the-article" class="headerlink" title="Comments area is more exciting than the article"></a>Comments area is more exciting than the article</h1><h2 id="WeChat-Official-Account-Comment-Area"><a href="#WeChat-Official-Account-Comment-Area" class="headerlink" title="WeChat Official Account Comment Area"></a>WeChat Official Account Comment Area</h2><p><img src="/en/images/bad-android-app-with-system-permissions/image-20230514203931411.webp" alt="image-20230514203931411"></p><p><img src="/en/images/bad-android-app-with-system-permissions/image-20230514203940833.webp" alt="image-20230514203940833"></p><p><img src="/en/images/bad-android-app-with-system-permissions/image-20230514203951666.webp" alt="image-20230514203951666"></p><p><img src="/en/images/bad-android-app-with-system-permissions/image-20230514204055973.webp" alt="image-20230514204055973"></p><p><img src="/en/images/bad-android-app-with-system-permissions/image-20230514204002395.webp" alt="image-20230514204002395"></p><p><img src="/en/images/bad-android-app-with-system-permissions/image-20230514204022808.webp" alt="image-20230514204022808"></p><p><img src="/en/images/bad-android-app-with-system-permissions/image-20230514204042836.webp" alt="image-20230514204042836"></p><p><img src="/en/images/bad-android-app-with-system-permissions/image-20230514204123412.webp" alt="image-20230514204123412"></p><p><img src="/en/images/bad-android-app-with-system-permissions/image-20230514204200492.webp" alt="image-20230514204200492"></p><h2 id="Zhihu-Comment-Area"><a href="#Zhihu-Comment-Area" class="headerlink" title="Zhihu Comment Area"></a>Zhihu Comment Area</h2><p>The Zhihu answer has been deleted. I can see it through the homepage, but clicking in shows it has been deleted: How to evaluate Pinduoduo suspected of using vulnerabilities to attack user mobile phones, steal competitor software data, and prevent itself from being uninstalled? - Gracker’s answer - Zhihu <a href="https://www.zhihu.com/question/587624599/answer/2927765317">https://www.zhihu.com/question/587624599/answer/2927765317</a></p><p><img src="/en/images/bad-android-app-with-system-permissions/image-20230514205638861.webp" alt="image-20230514205638861"></p><p><img src="/en/images/bad-android-app-with-system-permissions/image-20230514205909534.webp" alt="image-20230514205909534"></p><p><img src="/en/images/bad-android-app-with-system-permissions/image-20230514205857945.webp" alt="image-20230514205857945"></p><p><img src="/en/images/bad-android-app-with-system-permissions/image-20230514205937705.webp" alt="image-20230514205937705"></p><p><img src="/en/images/bad-android-app-with-system-permissions/image-20230514205947268.webp" alt="image-20230514205947268"></p><p><img src="/en/images/bad-android-app-with-system-permissions/image-20230514210010062.webp" alt="image-20230514210010062"></p><p><img src="/en/images/bad-android-app-with-system-permissions/image-20230514210020926.webp" alt="image-20230514210020926"></p><p><img src="/en/images/bad-android-app-with-system-permissions/image-20230514210040479.webp" alt="image-20230514210040479"></p><p><img src="/en/images/bad-android-app-with-system-permissions/image-20230514210107839.webp" alt="image-20230514210107839"></p><p><img src="/en/images/bad-android-app-with-system-permissions/image-20230514210122906.webp" alt="image-20230514210122906"></p><p><img src="/en/images/bad-android-app-with-system-permissions/image-20230514210141653.webp" alt="image-20230514210141653"></p><p><img src="/en/images/bad-android-app-with-system-permissions/image-20230514210152755.webp" alt="image-20230514210152755"></p><p><img src="/en/images/bad-android-app-with-system-permissions/image-20230514210226176.webp" alt="image-20230514210226176"></p><p><img src="/en/images/bad-android-app-with-system-permissions/image-20230514210235233.webp" alt="image-20230514210235233"></p><p><img src="/en/images/bad-android-app-with-system-permissions/image-20230514210255912.webp" alt="image-20230514210255912"></p><p><img src="/en/images/bad-android-app-with-system-permissions/image-20230514210344475.webp" alt="image-20230514210344475"></p><h2 id="Which-is-more-secure-iOS-or-Android"><a href="#Which-is-more-secure-iOS-or-Android" class="headerlink" title="Which is more secure, iOS or Android?"></a>Which is more secure, iOS or Android?</h2><p>Here I will paste the comment of security big shot sunwear</p><p><img src="/en/images/bad-android-app-with-system-permissions/v2-87f6eef24742784cc52cd1e0060c103d_1440w.webp" alt="img"></p><h1 id="About-Me-amp-amp-Blog"><a href="#About-Me-amp-amp-Blog" class="headerlink" title="About Me &amp;&amp; Blog"></a>About Me &amp;&amp; Blog</h1><p>Below are personal introduction and related links. I hope to communicate more with everyone in the industry. If three people walk together, there must be one who can be my teacher!</p><ol><li><a href="/en/about/">Blogger Personal Introduction</a>: There are personal WeChat and WeChat group links inside.</li><li><a href="/en/2019/12/01/BlogMap/">This Blog Content Navigation</a>: A navigation of personal blog content.</li><li><a href="/en/2018/05/07/Android-performance-optimization-skills-and-tools/">Excellent blog articles organized and collected by individuals - A must-know for Android efficiency optimization</a>: Everyone is welcome to recommend themselves and recommend others (WeChat private chat is fine)</li><li><a href="/en/2023/12/30/the-performance/">Android Performance Optimization Knowledge Planet</a>: Welcome to join, thanks for your support~</li></ol><blockquote><p><strong>One person can go faster, a group of people can go further</strong></p></blockquote><p><img src="/en/images/WechatIMG581.webp" alt="WeChat Scan"></p>]]></content>
    
    
    <summary type="html">&lt;p&gt;A while ago, a certain App became very popular because it exploited Android system vulnerabilities to gain system permissions and did a lot of things. I wanted to see what these Apps did after gaining system permissions by exploiting system vulnerabilities, hence this article. Due to hasty preparation, some Code was not looked at carefully. Interested students can research it themselves and discuss more. The corresponding articles and Code links are below:&lt;/p&gt;
&lt;ol&gt;
&lt;li&gt;&lt;a href=&quot;https://mp.weixin.qq.com/s/P_EYQxOEupqdU0BJMRqWsw&quot;&gt;Deep Blue Insight: The Most “Unpardonable” Vulnerabilities of 2022&lt;/a&gt;&lt;/li&gt;
&lt;li&gt;&lt;a href=&quot;https://github.com/davinci1010/pinduoduo_backdoor&quot;&gt;XXX apk embedded privilege escalation code and dynamic delivery dex analysis&lt;/a&gt;&lt;/li&gt;
&lt;li&gt;&lt;a href=&quot;https://mp.weixin.qq.com/s/x6BSQZ3sE7vDcM0qvsC1EQ&quot;&gt;History of Android Deserialization Vulnerability Attack and Defense&lt;/a&gt;&lt;/li&gt;
&lt;/ol&gt;
&lt;p&gt;Regarding how this App obtained these system permissions, &lt;a href=&quot;https://mp.weixin.qq.com/s/x6BSQZ3sE7vDcM0qvsC1EQ&quot;&gt;History of Android Deserialization Vulnerability Attack and Defense&lt;/a&gt; explains it very clearly, so I won’t repeat it here. I am not a security expert either, but I suggest everyone read this article a few times.&lt;/p&gt;</summary>


    <category term="Android" scheme="https://androidperformance.com/en/categories/Android/"/>
    
    
    <category term="Android" scheme="https://androidperformance.com/en/tags/Android/"/>
    
    <category term="Systrace" scheme="https://androidperformance.com/en/tags/Systrace/"/>
    
    <category term="Startup" scheme="https://androidperformance.com/en/tags/Startup/"/>
    
    <category term="Memory" scheme="https://androidperformance.com/en/tags/Memory/"/>
    
    <category term="Performance" scheme="https://androidperformance.com/en/tags/Performance/"/>
    
  </entry>
  
  <entry>
    <title>The Performance Community Tea Talk - Episode 1</title>
    <link href="https://androidperformance.com/en/2022/03/27/the-performance-tea-part-01/"/>
    <id>https://androidperformance.com/en/2022/03/27/the-performance-tea-part-01/</id>
    <published>2022-03-27T15:46:37.000Z</published>
    <updated>2026-05-10T23:29:51.068Z</updated>
    
    <content type="html"><![CDATA[<p>On Friday, March 25, 2022, at 9 PM, “The Performance” Knowledge Planet held its first online “Tea Talk.” We were joined by 3 planet hosts, 5 guest experts, and over 50 members. Thank you all for coming!</p><p>While we expected to wrap up in an hour, we ended up chatting for over two and a half hours—our introductions alone took an hour! Our community spans the entire Android ecosystem: from App-tier experts to System-level gurus at major smartphone manufacturers, silicon companies, and EV startups. Each introduction naturally evolved into deep dives into industry trends and company-specific insights.</p><p>We plan to hold these regularly with clearer themes and more guests. To protect the privacy of our members, we did not record the session. The following text is a reconstructed summary of our discussion.</p><span id="more"></span><h1 id="On-Career-Development"><a href="#On-Career-Development" class="headerlink" title="On Career Development"></a>On Career Development</h1><h2 id="“I’m-a-new-grad-and-the-vastness-of-the-performance-field-is-overwhelming-”"><a href="#“I’m-a-new-grad-and-the-vastness-of-the-performance-field-is-overwhelming-”" class="headerlink" title="“I’m a new grad and the vastness of the performance field is overwhelming.”"></a>“I’m a new grad and the vastness of the performance field is overwhelming.”</h2><ol><li><strong>Shift Your Mindset</strong>: University and professional work are different. In school, you have a textbook and a final exam. In the field, the “curriculum” never ends.</li><li><strong>Learn from What’s at Hand</strong>: Master the problems on your desk first. Aim for 100% or even 110% proficiency in your daily tasks while building a foundation for broader knowledge. Doing your current job exceptionally well earns you the reputation and the opportunity to touch new, more complex things. Don’t jump to a new field until you’ve mastered (or explicitly rejected) your current one.</li><li><strong>Problem-Oriented Programming</strong>: Your primary value to an employer is your ability to solve problems. Use an economic lens: maximize your output-to-input ratio (marginal utility).</li><li><strong>Climbing the Mountain</strong>: If you only stare at the peak, you’ll feel defeated. <strong>Keep your head down, take one step at a time, and check your map (and current career path) occasionally.</strong></li></ol><h2 id="“I-just-switched-from-App-development-to-System-Performance-Where-do-I-start-”"><a href="#“I-just-switched-from-App-development-to-System-Performance-Where-do-I-start-”" class="headerlink" title="“I just switched from App development to System Performance. Where do I start?”"></a>“I just switched from App development to System Performance. Where do I start?”</h2><ol><li><strong>Follow Company Projects</strong>: If you have a mentor, follow them closely. This is the fastest way to learn.</li><li><strong>Self-Drive</strong>: The more you learn on your own, the more opportunities you’ll be able to seize. Masters of performance aren’t just given tasks; they identify them.</li><li><strong>Don’t Limit Yourself</strong>: Knowledge is interconnected. Don’t stay in your “one-acre plot.” Performance spans App, Framework, Kernel, and Hardware. Aim for a state of “knowing what you don’t know.” The worst state is “not knowing that you don’t know” and thinking there’s nothing left to optimize.</li><li><strong>Systematize Knowledge</strong>: Performance is a broad field. When analyzing problems, take notes, summarize, and categorize. Don’t expect instant mastery; it’s a marathon of accumulation.</li><li><strong>Leverage Resources</strong>: Use this community, engineering blogs from major tech companies, and technical papers. Ask questions, no matter how “basic” they seem.</li></ol><h1 id="On-Asking-Questions"><a href="#On-Asking-Questions" class="headerlink" title="On Asking Questions"></a>On Asking Questions</h1><ol><li>This community is a powerful platform, but its value depends on your ability to ask precise questions. Asking a good question is a technical skill in itself.</li><li>Recommended Reading: <a href="https://mp.weixin.qq.com/s/l_Iz5pZ5yXhBAoPzNi4m-Q">How to Ask Questions?</a><ul><li>“A well-put question is half the solution.”</li><li>Einstein once said: “If I had an hour to save the world, I would spend 55 minutes defining the problem and 5 minutes solving it.”</li><li>Great questions inspire masters to teach. It is a bridge to the best minds.</li></ul></li><li><strong>Use Google</strong>: The quality difference between Google and local search engines can be vast for niche technical issues. Don’t discriminate between Chinese and English resources—if it solves your problem, it’s a gold mine.</li><li><strong>Log Sharing</strong>:<ul><li>If you need help and your logs contain sensitive info (like package names in a Systrace), use a text editor like VSCode to find-and-replace them.</li><li>Never share trade secrets.</li></ul></li><li><strong>The Perfect Feedback Loop</strong>: Ask a question -&gt; Analyze together -&gt; Try solutions -&gt; Verify with data -&gt; Share the result with the community.</li></ol><h1 id="On-Interviews"><a href="#On-Interviews" class="headerlink" title="On Interviews"></a>On Interviews</h1><p>It’s healthy to interview occasionally with competitors or companies in new industries, even if you aren’t planning to quit. The goal is to gauge your “market value” and understand how the industry is evolving.</p><p>Distinguish between your <strong>profession</strong> and your <strong>job</strong>. “Software Engineer” is your profession; “Working on Module X at Company A” is your job. Recognizing this difference allows you to remain calm during corporate restructuring. Ideally, pursue a profession you find exciting, as you’ll spend most of your life doing it.</p><h1 id="On-Corporate-Environments"><a href="#On-Corporate-Environments" class="headerlink" title="On Corporate Environments"></a>On Corporate Environments</h1><p>Different companies have different strategies based on their industry and competition. Your manager’s style and your colleagues’ expertise define your immediate environment.</p><p>Some organizations reward “top 5% technical excellence,” while others only care that “the bug is fixed” regardless of how. Understand the game you are playing. Either challenge the environment or adapt to it, but don’t fall into the trap of self-doubt.</p><h1 id="On-Learning-New-Tech"><a href="#On-Learning-New-Tech" class="headerlink" title="On Learning New Tech"></a>On Learning New Tech</h1><p>Performance optimization has underlying logic that stays constant regardless of the tech stack. Focus on these “immutable” principles. Once you see the patterns, you can apply them to any new technology.</p><p><strong>If you optimize deep enough, you eventually hit the bottom: Compilers, Hardware features, and Hardware integration. These are the ultimate gatekeepers of speed.</strong></p><h1 id="On-GPU"><a href="#On-GPU" class="headerlink" title="On GPU"></a>On GPU</h1><ul><li><strong>GPU Architectures</strong>: Each generation and manufacturer (Adreno, Mali, PowerVR) differs, but they share fundamental principles.<ol><li><a href="https://drive.google.com/file/d/12ahbqGXNfY3V-1Gj5cvne2AH4BFWZHGD/view">GPU Architectures</a></li><li><a href="http://www.irisa.fr/alf/downloads/collange/cours/ada2020_gpu_1.pdf">Introduction to GPU Architecture</a></li><li><a href="http://download.nvidia.com/developer/cuda/seminar/TDCI_Arch.pdf">Introduction to Modern GPU Architecture</a></li></ol></li><li><strong>Wait, if I’m new to Graphics, should I start with Vulkan?</strong><br>No, start with <strong>OpenGL</strong>. While Vulkan is the future, its API is extremely low-level and difficult for beginners. The underlying GPU mechanisms are the same. Mastering OpenGL makes Vulkan much easier to digest.</li><li><strong>Why Vulkan?</strong><br>Check out Apple’s <a href="https://developer.apple.com/videos/play/wwdc2019/611/">Bringing OpenGL Apps to Metal</a>. (Metal and Vulkan share many design philosophies).</li></ul><p><strong>Final Tip</strong>: Learning graphics and GPU internal counters (via tools like DS5 Streamline or Snapdragon Profiler) is a marathon. Be patient and keep practicing.</p><h1 id="Recommended-Resources"><a href="#Recommended-Resources" class="headerlink" title="Recommended Resources"></a>Recommended Resources</h1><h3 id="Articles"><a href="#Articles" class="headerlink" title="Articles"></a>Articles</h3><ul><li>“Ten-Year Founder Shares Thoughts on Hiring”: categorizes talent into S, A, B, and C tiers. Worth reflecting on which tier you occupy.</li></ul><h3 id="Books"><a href="#Books" class="headerlink" title="Books"></a>Books</h3><ul><li><strong>“The Self-Cultivation of a Programmer” (俞甲子)</strong>: Deep dive into compilation, linking, and runtime mechanics.</li><li><strong>“Software Debugging (2nd Ed)” (张银奎)</strong>: The “Encyclopedia” of debugging.<ul><li>Vol 1: Hardware Foundations (CPU&#x2F;GPU&#x2F;Debug infrastructure).</li><li>Vol 2: Windows Platform.</li><li>Vol 3: (Upcoming) Linux Platform.</li></ul></li></ul><h1 id="About-The-Performance-Community"><a href="#About-The-Performance-Community" class="headerlink" title="About The Performance Community"></a>About The Performance Community</h1><p>“The Performance” is a hub for Android performance experts from major mobile manufacturers. We offer case studies, methodologies, and tool guides. You can find us on Knowledge Planet (The Performance).</p><hr><h1 id="About-Me-amp-amp-Blog"><a href="#About-Me-amp-amp-Blog" class="headerlink" title="About Me &amp;&amp; Blog"></a>About Me &amp;&amp; Blog</h1><p>Below is my personal intro and related links. I look forward to exchanging ideas with fellow professionals. “When three walk together, one can always be my teacher!”</p><ol><li><a href="https://www.androidperformance.com/en/about/">Blogger Intro</a></li><li><a href="https://www.androidperformance.com/en/2019/12/01/BlogMap/">Blog Content Navigation</a>: A guide for my blog content.</li><li><a href="https://www.androidperformance.com/en/2018/05/07/Android-performance-optimization-skills-and-tools/">Curated Excellent Blog Articles - Android Performance Optimization Must-Knows</a></li><li><a href="https://www.androidperformance.com/en/2023/12/30/the-performance/">Android Performance Optimization Knowledge Planet</a></li></ol><blockquote><p><strong>One walks faster alone, but a group walks further together.</strong></p></blockquote><p><img src="/en/images/WechatIMG581.webp" alt="Scan WeChat QR Code"></p>]]></content>
    
    
    <summary type="html">&lt;p&gt;On Friday, March 25, 2022, at 9 PM, “The Performance” Knowledge Planet held its first online “Tea Talk.” We were joined by 3 planet hosts, 5 guest experts, and over 50 members. Thank you all for coming!&lt;/p&gt;
&lt;p&gt;While we expected to wrap up in an hour, we ended up chatting for over two and a half hours—our introductions alone took an hour! Our community spans the entire Android ecosystem: from App-tier experts to System-level gurus at major smartphone manufacturers, silicon companies, and EV startups. Each introduction naturally evolved into deep dives into industry trends and company-specific insights.&lt;/p&gt;
&lt;p&gt;We plan to hold these regularly with clearer themes and more guests. To protect the privacy of our members, we did not record the session. The following text is a reconstructed summary of our discussion.&lt;/p&gt;</summary>


    <category term="Reading Notes" scheme="https://androidperformance.com/en/categories/Reading-Notes/"/>
    
    
    <category term="Android" scheme="https://androidperformance.com/en/tags/Android/"/>
    
    <category term="Systrace" scheme="https://androidperformance.com/en/tags/Systrace/"/>
    
    <category term="Performance" scheme="https://androidperformance.com/en/tags/Performance/"/>
    
    <category term="Linux" scheme="https://androidperformance.com/en/tags/Linux/"/>
    
    <category term="Community" scheme="https://androidperformance.com/en/tags/Community/"/>
    
  </entry>
  
  <entry>
    <title>Systrace Thread CPU State Analysis Tips - Sleep and Uninterruptible Sleep</title>
    <link href="https://androidperformance.com/en/2022/03/13/android-systrace-cpu-state-sleep/"/>
    <id>https://androidperformance.com/en/2022/03/13/android-systrace-cpu-state-sleep/</id>
    <published>2022-03-13T00:38:12.000Z</published>
    <updated>2026-05-10T23:29:51.065Z</updated>
    
    <content type="html"><![CDATA[<p>This is the third article in the “Systrace Thread CPU State Analysis Tips” series. It focuses on the <strong>Sleep</strong> and <strong>Uninterruptible Sleep</strong> states in Systrace—their causes, troubleshooting, and optimization. These states are major performance inhibitors and are often difficult to diagnose without a systematic approach.</p><p>The goal of this series is to use Systrace to view the Android system from a different perspective and to learn the Framework through visualization. While reading Framework source code can be difficult to remember, seeing the flow in Systrace can lead to deeper understanding. You can find the complete <a href="https://www.androidperformance.com/en/2019/12/01/BlogMap/">Systrace Basics and Action Series here</a>.</p><span id="more"></span><h2 id="Table-of-Contents"><a href="#Table-of-Contents" class="headerlink" title="Table of Contents"></a>Table of Contents</h2><ul><li><a href="#sleep-overview">What are Sleep States in Linux?</a></li><li><a href="#sleep-analysis">Analyzing the Sleep State</a></li><li><a href="#usleep-analysis">Analyzing the Uninterruptible Sleep State</a></li><li><a href="#appendix">Appendix</a></li><li><a href="#about">About Me &amp;&amp; Blog</a></li></ul><ol><li><a href="https://www.androidperformance.com/en/2022/01/21/android-systrace-cpu-state-runnable/">Systrace Thread CPU State Analysis Tips - Runnable</a></li><li><a href="https://www.androidperformance.com/en/2022/03/13/android-systrace-cpu-state-running/">Systrace Thread CPU State Analysis Tips - Running</a></li><li><a href="https://www.androidperformance.com/en/2022/03/13/android-systrace-cpu-state-sleep/">Systrace Thread CPU State Analysis Tips - Sleep and Uninterruptible Sleep</a></li></ol><p><a id="sleep-overview"></a></p><h1 id="What-are-Sleep-States-in-Linux"><a href="#What-are-Sleep-States-in-Linux" class="headerlink" title="What are Sleep States in Linux?"></a>What are Sleep States in Linux?</h1><h2 id="TASK-INTERRUPTIBLE-vs-TASK-UNINTERRUPTIBLE"><a href="#TASK-INTERRUPTIBLE-vs-TASK-UNINTERRUPTIBLE" class="headerlink" title="TASK_INTERRUPTIBLE vs. TASK_UNINTERRUPTIBLE"></a>TASK_INTERRUPTIBLE vs. TASK_UNINTERRUPTIBLE</h2><p>If a thread’s state is neither Running nor Runnable, it is in a “Sleep” state (strictly speaking, there are other states like STOP or Trace, but these are rare in performance analysis).</p><p>In Linux, Sleep states are categorized into three:</p><ul><li><strong>TASK_INTERRUPTIBLE</strong></li><li><strong>TASK_UNINTERRUPTIBLE</strong></li><li><strong>TASK_KILLABLE</strong> (equivalent to <code>TASK_WAKEKILL | TASK_UNINTERRUPTIBLE</code>)</li></ul><p><img src="/en/images/android-systrace-cpu-state-sleep/image.webp" alt="Figure 1: CPU Optimization from Systems Performance Book"></p><p>In Systrace&#x2F;Perfetto, “Sleep” refers to <strong>TASK_INTERRUPTIBLE</strong> (visualized in <strong>white</strong>). “Uninterruptible Sleep” refers to <strong>TASK_UNINTERRUPTIBLE</strong> (visualized in <strong>orange</strong>).</p><p>Both indicate a sleeping state where the thread receives no CPU time slices. It only transitions to “Runnable” (blue) and then “Running” (green) when specific conditions are met.</p><p>The core difference: <strong>TASK_INTERRUPTIBLE can process signals, while TASK_UNINTERRUPTIBLE cannot—even <code>Kill</code> signals.</strong> Consequently, uninterruptible threads cannot be woken by any method except the specific resource they are waiting for. <code>TASK_WAKEKILL</code> is a variant that <em>can</em> process Kill signals.</p><p>Android’s <code>Looper</code>, Java&#x2F;Native lock waits, and most app logic reside in <code>TASK_INTERRUPTIBLE</code> (Sleep). Looking at a Systrace, you’ll see vast white segments representing these idle periods.</p><h2 id="The-Purpose-of-TASK-UNINTERRUPTIBLE"><a href="#The-Purpose-of-TASK-UNINTERRUPTIBLE" class="headerlink" title="The Purpose of TASK_UNINTERRUPTIBLE"></a>The Purpose of TASK_UNINTERRUPTIBLE</h2><p>Why do we need an uninterruptible state?</p><p>Interrupts come from hardware (signals to the CPU) or software (signals like <code>softirq</code> or <code>Signal</code>). A process can usually handle these at any time using its own context. However, some critical paths—like hardware driver interactions, IO waits, or networking—must not be disturbed.</p><p>Tasking a thread as uninterruptible ensures logic doesn’t enter an <strong>uncontrollable state</strong>. Similarly, the Linux kernel temporarily disables the interrupt controller during hardware scheduling or disables preemption during core scheduling to maintain control. While these states are usually brief, they can severely impact performance under system stress.</p><p><a href="https://elixir.bootlin.com/linux/latest/ident/TASK_UNINTERRUPTIBLE">Kernel Reference: TASK_UNINTERRUPTIBLE</a></p><p>Typical scenarios include Swap reads, semaphores, mutex locks, and slow-path memory reclamation.</p><h2 id="Analysis-Philosophy"><a href="#Analysis-Philosophy" class="headerlink" title="Analysis Philosophy"></a>Analysis Philosophy</h2><p><code>TASK_INTERRUPTIBLE</code> and <code>TASK_UNINTERRUPTIBLE</code> are normal. However, if their cumulative percentage is high, especially on a critical path, investigation is required. Master these two points:</p><ol><li><strong>Troubleshooting Methodology</strong></li><li><strong>Optimization Methodology</strong></li></ol><p>You must identify if a sleep is <strong>active</strong> or <strong>passive</strong>. If active, is the logic sound? If passive, what is the source? This requires deep system knowledge and experience.</p><p>Note: I’ll use “Sleep” for <code>TASK_INTERRUPTIBLE</code> and “UninterruptibleSleep” for <code>TASK_UNINTERRUPTIBLE</code> to match Systrace terminology.</p><p>Initial confusion is normal and stems from system complexity. There is no single “magic” tool that explains every logic chain. Even Systrace’s <code>wakeup_from</code> data can be inaccurate. You must combine system theory with Trace tools to pinpoint root causes.</p><p>This article covers common types and cases. Use these diagnostic methods and source code analysis to navigate unique problems.</p><h2 id="Visualization-in-Trace"><a href="#Visualization-in-Trace" class="headerlink" title="Visualization in Trace"></a>Visualization in Trace</h2><p><img src="/en/images/android-systrace-cpu-state-sleep/image_1.webp" alt="States in Perfetto"></p><p><img src="/en/images/android-systrace-cpu-state-sleep/image_2.webp" alt="States in Systrace"></p><p><a id="sleep-analysis"></a></p><h1 id="Analyzing-the-Sleep-State"><a href="#Analyzing-the-Sleep-State" class="headerlink" title="Analyzing the Sleep State"></a>Analyzing the Sleep State</h1><p><img src="/en/images/android-systrace-cpu-state-sleep/image_3.webp" alt="Figure 1: UIThread waiting for RenderThread"></p><p><img src="/en/images/android-systrace-cpu-state-sleep/image_4.webp" alt="Figure 2: Binder Call Wait"></p><h2 id="Diagnostic-Methods"><a href="#Diagnostic-Methods" class="headerlink" title="Diagnostic Methods"></a>Diagnostic Methods</h2><h3 id="Use-wakeup-from-tid-to-Find-Waking-Threads"><a href="#Use-wakeup-from-tid-to-Find-Waking-Threads" class="headerlink" title="Use wakeup from tid: *** to Find Waking Threads"></a>Use <code>wakeup from tid: ***</code> to Find Waking Threads</h3><p>Sleep usually results from a program actively waiting for an event (like a lock), meaning there is a clear “waking source.” Figure 1 shows UIThread waiting for RenderThread. While you can infer this from code, it requires mastery of the Android graphics stack.</p><p>A simpler method is tracing <code>wakeup from tid: ***</code>. As discussed in the <a href="https://www.androidperformance.com/en/2022/01/21/android-systrace-cpu-state-runnable/">Runnable article</a>, any thread must pass through “Runnable” before “Running.”</p><p>There are two ways to enter Runnable:</p><ol><li>A “Running” task is preempted.</li><li>Another thread wakes a “Sleep” task.</li></ol><p>In Systrace, the latter is visualized as <code>wakeup from tid: ***</code>, while preemption is visualized as <code>Running Instead</code>.</p><p><img src="/en/images/android-systrace-cpu-state-sleep/image_5.webp" alt="Wakeup Info Example"></p><p><strong>Warning</strong>: <code>wakeup from</code> data is tied to specific tracepoints and can sometimes be inaccurate. Verify before proceeding.</p><h3 id="Other-Methods"><a href="#Other-Methods" class="headerlink" title="Other Methods"></a>Other Methods</h3><ol><li><strong>Simpleperf</strong>: Reconstruct code execution flow. See <a href="https://www.androidperformance.com/en/2021/11/14/simpleperf-analysis-1/">Simpleperf Analysis 1: Visualizing Data with Firefox Profiler</a>.</li><li><strong>Aligning Timeframes</strong>: Look for simultaneous events across different threads&#x2F;processes in Systrace. This is error-prone but can provide clues.</li></ol><h2 id="Common-Causes-for-Long-Sleep"><a href="#Common-Causes-for-Long-Sleep" class="headerlink" title="Common Causes for Long Sleep"></a>Common Causes for Long Sleep</h2><ul><li><strong>Binder Operations</strong>: Enable Binder tracing to see the remote execution thread. Analyze the remote side—is it lock contention? CPU starvation?</li><li><strong>Java&#x2F;Futex Lock Contention</strong>: Very common, especially under high load in <code>SystemServer</code>. This is a side effect of Binder’s parallel or preemptive resource usage.</li><li><strong>Active Wait</strong>: Thread waiting for another, like a semaphore. Check if the logic is essential.</li><li><strong>GPU Wait</strong>: Waiting for a GPU fence. Caused by heavy rendering, weak GPU, or low GPU frequency. Optimization: Increase GPU frequency, simplify Shaders, reduce resolution&#x2F;texture quality, etc.</li></ul><p><a id="usleep-analysis"></a></p><h1 id="Analyzing-the-Uninterruptible-Sleep-State"><a href="#Analyzing-the-Uninterruptible-Sleep-State" class="headerlink" title="Analyzing the Uninterruptible Sleep State"></a>Analyzing the Uninterruptible Sleep State</h1><h2 id="Diagnostic-Methods-1"><a href="#Diagnostic-Methods-1" class="headerlink" title="Diagnostic Methods"></a>Diagnostic Methods</h2><p>UninterruptibleSleep is a type of sleep, so general methods apply. It has two unique attributes:</p><ol><li><strong>Categorized into IOWait and Non-IOWait</strong></li><li><strong>Provides a Block Reason</strong></li></ol><h3 id="IOWait-vs-Non-IOWait"><a href="#IOWait-vs-Non-IOWait" class="headerlink" title="IOWait vs. Non-IOWait"></a>IOWait vs. Non-IOWait</h3><p><strong>IO Wait</strong> occurs when a program initiates an IO operation (e.g., fetching data not in PageCache). Memory is orders of magnitude faster than disk; frequent disk reads decimate performance.</p><p><strong>Non-IO Wait</strong> typically indicates a kernel-level lock wait or a driver-enforced wait. For example, Binder driver lock contention can become a bottleneck under heavy loads.</p><h3 id="Block-Reason"><a href="#Block-Reason" class="headerlink" title="Block Reason"></a>Block Reason</h3><p>Around 2015, Google’s Riley Andrews added a kernel <code>tracepoint</code> to record IO wait status and calling functions during UninterruptibleSleep. This powers Systrace’s <strong>IOWait</strong> and <strong>BlockReason</strong> fields. (Check your kernel if this patch is missing, as it’s not in the main Linux upstream).</p><figure class="highlight css"><table><tr><td class="gutter"><pre><span class="line">1</span><br><span class="line">2</span><br></pre></td><td class="code"><pre><span class="line"># Sched blocked tracepoint commit snippet</span><br><span class="line">sched: add sched blocked tracepoint which dumps out context of sleep.</span><br></pre></td></tr></table></figure><p>In <code>ftrace</code>, it appears as:</p><figure class="highlight c"><table><tr><td class="gutter"><pre><span class="line">1</span><br></pre></td><td class="code"><pre><span class="line">sched_blocked_reason: pid=<span class="number">30235</span> iowait=<span class="number">0</span> caller=get_user_pages_fast+<span class="number">0x34</span>/<span class="number">0x70</span></span><br></pre></td></tr></table></figure><p>Systrace Visualization:<br><img src="/en/images/android-systrace-cpu-state-sleep/image_6.webp" alt="BlockReason Visualization"></p><p>The <code>get_user_pages_fast</code> reason is a Linux kernel function name. To understand the wait, you must look at its implementation:</p><figure class="highlight c"><table><tr><td class="gutter"><pre><span class="line">1</span><br><span class="line">2</span><br><span class="line">3</span><br><span class="line">4</span><br><span class="line">5</span><br><span class="line">6</span><br><span class="line">7</span><br></pre></td><td class="code"><pre><span class="line"><span class="comment">/* get_user_pages_fast() implementation snippet */</span></span><br><span class="line"><span class="type">int</span> <span class="title function_">get_user_pages_fast</span><span class="params">(...)</span> &#123;</span><br><span class="line">  ...</span><br><span class="line">  <span class="comment">/* Attempt to pin pages without taking mm-&gt;mmap_lock.</span></span><br><span class="line"><span class="comment">   * If not successful, fall back to taking the lock... */</span></span><br><span class="line">  ...</span><br><span class="line">&#125;</span><br></pre></td></tr></table></figure><p>This function tries to pin pages locklessly. If it fails, it must take the lock and follow the “slow path.” If the lock is held elsewhere, it enters UninterruptibleSleep. Use the Sleep diagnosis method to find the locker.</p><p><img src="/en/images/android-systrace-cpu-state-sleep/image_7.webp" alt="Locker Diagnosis Example"></p><p>UninterruptibleSleep is complex because it involves kernel implementation. It could be a kernel bug or improper app usage. You must correlate system-wide behavior.</p><h2 id="Common-Causes-for-IOWait-and-Optimizations"><a href="#Common-Causes-for-IOWait-and-Optimizations" class="headerlink" title="Common Causes for IOWait and Optimizations"></a>Common Causes for IOWait and Optimizations</h2><h3 id="1-Active-IO-Operations"><a href="#1-Active-IO-Operations" class="headerlink" title="1. Active IO Operations"></a>1. Active IO Operations</h3><ul><li>Frequent&#x2F;large read&#x2F;write operations.</li><li>Multiple apps stressing the disk simultaneously.</li><li>Poor hardware IO performance (check with an IO Benchmark). Causes: Fragmentation, aging, low free space (notorious on low-end devices), read&#x2F;write amplification.</li><li>File system internal overhead.</li><li>Swap data reads.</li></ul><p><strong>Optimization Methods</strong>:</p><ul><li>Tune <strong>Readahead</strong> mechanisms.</li><li>Use <strong>PinFile</strong> (pinning files to PageCache).</li><li>Adjust PageCache reclamation policies.</li><li>Optimize junk file cleanup.</li></ul><h3 id="2-High-IO-due-to-Low-Memory"><a href="#2-High-IO-due-to-Low-Memory" class="headerlink" title="2. High IO due to Low Memory"></a>2. High IO due to Low Memory</h3><p>OS design treats memory as a disk cache. If memory is ample, most operations are in RAM. If memory is critically low, almost all IO hit the physical disk, causing severe lag.</p><p>The fix is ensuring enough memory or refining cache eviction algorithms.</p><p><strong>Optimization Methods</strong>:</p><ul><li>Reduce IO operations on critical paths.</li><li>Leverage Readahead.</li><li>Group hot data to increase Readahead hit rates.</li><li>Reduce massive memory allocations and waste.</li></ul><p>Apps that use memory recklessly force the system to suppress them, eventually hurting their own performance.</p><h2 id="Common-Causes-for-Non-IOWait"><a href="#Common-Causes-for-Non-IOWait" class="headerlink" title="Common Causes for Non-IOWait"></a>Common Causes for Non-IOWait</h2><ul><li><strong>Memory Reclamation Wait</strong>: OS reclaiming pages for other apps&#x2F;cache during low memory.</li><li><strong>Binder Wait</strong>: High frequency of Binder operations.</li><li><strong>Various Kernel Locks</strong>: Use the “Diagnostic Methods” above to pinpoint.</li></ul><h2 id="System-Scheduling-and-UninterruptibleSleep-Coupling"><a href="#System-Scheduling-and-UninterruptibleSleep-Coupling" class="headerlink" title="System Scheduling and UninterruptibleSleep Coupling"></a>System Scheduling and UninterruptibleSleep Coupling</h2><p>An interesting phenomenon occurs when a thread is in UninterruptibleSleep (kernel lock), but the <em>holder</em> of that lock is stuck in a “Runnable” state due to CPU scheduling. Even if the wait is for a fast operation, it appears elongated because the dependency isn’t being prioritized by the scheduler.</p><p>Resolving this requires sophisticated scheduler tuning—a true test of a manufacturer’s technical depth.</p><p><a id="appendix"></a></p><h1 id="Appendix"><a href="#Appendix" class="headerlink" title="Appendix"></a>Appendix</h1><h2 id="Linux-Thread-State-Definitions"><a href="#Linux-Thread-State-Definitions" class="headerlink" title="Linux Thread State Definitions"></a>Linux Thread State Definitions</h2><table><thead><tr><th>Thread State</th><th>Description</th></tr></thead><tbody><tr><td>S</td><td>SLEEPING</td></tr><tr><td>R, R+</td><td>RUNNABLE</td></tr><tr><td>D</td><td>UNINTR_SLEEP</td></tr><tr><td>T</td><td>STOPPED</td></tr><tr><td>t</td><td>DEBUG</td></tr><tr><td>Z</td><td>ZOMBIE</td></tr><tr><td>X</td><td>EXIT_DEAD</td></tr><tr><td>x</td><td>TASK_DEAD</td></tr><tr><td>K</td><td>WAKE_KILL</td></tr><tr><td>W</td><td>WAKING</td></tr></tbody></table><h2 id="Case-Waiting-for-Swap-Data"><a href="#Case-Waiting-for-Swap-Data" class="headerlink" title="Case: Waiting for Swap Data"></a>Case: Waiting for Swap Data</h2><p><img src="/en/images/android-systrace-cpu-state-sleep/image_8.webp" alt="Swap Wait Trace"></p><h2 id="Case-mmap-Contention-Across-Multiple-Threads"><a href="#Case-mmap-Contention-Across-Multiple-Threads" class="headerlink" title="Case: mmap Contention Across Multiple Threads"></a>Case: <code>mmap</code> Contention Across Multiple Threads</h2><p><img src="/en/images/android-systrace-cpu-state-sleep/image_9.webp" alt="mmap Contention Trace"></p><p>Threads sharing the same <code>mm_struct</code> compete for the lock during <code>mmap()</code> syscalls.</p><figure class="highlight c"><table><tr><td class="gutter"><pre><span class="line">1</span><br><span class="line">2</span><br><span class="line">3</span><br><span class="line">4</span><br><span class="line">5</span><br></pre></td><td class="code"><pre><span class="line"><span class="comment">/* mmap lock area snippet */</span></span><br><span class="line"><span class="keyword">if</span> (mmap_write_lock_killable(mm))</span><br><span class="line">  <span class="keyword">return</span> -EINTR;</span><br><span class="line">ret = do_mmap(...);</span><br><span class="line">mmap_write_unlock(mm);</span><br></pre></td></tr></table></figure><p><a id="about"></a></p><h1 id="About-Me-amp-amp-Blog"><a href="#About-Me-amp-amp-Blog" class="headerlink" title="About Me &amp;&amp; Blog"></a>About Me &amp;&amp; Blog</h1><p>Below is my personal intro and related links. I look forward to exchanging ideas with fellow professionals. “When three walk together, one can always be my teacher!”</p><ol><li><a href="https://www.androidperformance.com/en/about/">Blogger Intro</a>: Includes personal WeChat and WeChat group links.</li><li><a href="https://www.androidperformance.com/en/2019/12/01/BlogMap/">Blog Content Navigation</a>: A guide for my blog content.</li><li><a href="https://www.androidperformance.com/en/2018/05/07/Android-performance-optimization-skills-and-tools/">Curated Excellent Blog Articles - Android Performance Optimization Must-Knows</a>: Welcome to recommend projects&#x2F;articles.</li><li><a href="https://www.androidperformance.com/en/2023/12/30/the-performance/">Android Performance Optimization Knowledge Planet</a>: Welcome to join and thank you for your support~</li></ol><blockquote><p><strong>One walks faster alone, but a group walks further together.</strong></p></blockquote><p><img src="/en/images/WechatIMG581.webp" alt="Scan WeChat QR Code"></p>]]></content>
    
    
    <summary type="html">&lt;p&gt;This is the third article in the “Systrace Thread CPU State Analysis Tips” series. It focuses on the &lt;strong&gt;Sleep&lt;/strong&gt; and &lt;strong&gt;Uninterruptible Sleep&lt;/strong&gt; states in Systrace—their causes, troubleshooting, and optimization. These states are major performance inhibitors and are often difficult to diagnose without a systematic approach.&lt;/p&gt;
&lt;p&gt;The goal of this series is to use Systrace to view the Android system from a different perspective and to learn the Framework through visualization. While reading Framework source code can be difficult to remember, seeing the flow in Systrace can lead to deeper understanding. You can find the complete &lt;a href=&quot;https://www.androidperformance.com/en/2019/12/01/BlogMap/&quot;&gt;Systrace Basics and Action Series here&lt;/a&gt;.&lt;/p&gt;</summary>


    <category term="Android" scheme="https://androidperformance.com/en/categories/Android/"/>
    
    
    <category term="Android" scheme="https://androidperformance.com/en/tags/Android/"/>
    
    <category term="Perfetto" scheme="https://androidperformance.com/en/tags/Perfetto/"/>
    
    <category term="Systrace" scheme="https://androidperformance.com/en/tags/Systrace/"/>
    
    <category term="Memory" scheme="https://androidperformance.com/en/tags/Memory/"/>
    
    <category term="Performance" scheme="https://androidperformance.com/en/tags/Performance/"/>
    
  </entry>
  
  <entry>
    <title>Systrace Thread CPU State Analysis Tips - Running</title>
    <link href="https://androidperformance.com/en/2022/03/13/android-systrace-cpu-state-running/"/>
    <id>https://androidperformance.com/en/2022/03/13/android-systrace-cpu-state-running/</id>
    <published>2022-03-13T00:38:04.000Z</published>
    <updated>2026-05-10T23:29:51.065Z</updated>
    
    <content type="html"><![CDATA[<p>This is the second article in the “Systrace Thread CPU State Analysis Tips” series. It analyzes the causes of the “Running” state in Systrace and provides optimization strategies for when Running segments are excessively long.</p><p>The goal of this series is to use Systrace to view the Android system from a different perspective and to learn the Framework through visualization. While reading Framework source code can be difficult to remember, seeing the flow in Systrace can lead to deeper understanding. You can find the complete <a href="https://www.androidperformance.com/en/2019/12/01/BlogMap/">Systrace Basics and Action Series here</a>.</p><span id="more"></span><h2 id="Table-of-Contents"><a href="#Table-of-Contents" class="headerlink" title="Table of Contents"></a>Table of Contents</h2><ul><li><a href="#running">Causes for Long Running States</a></li><li><a href="#about">About Me &amp;&amp; Blog</a></li></ul><ol><li><a href="https://www.androidperformance.com/en/2022/01/21/android-systrace-cpu-state-runnable/">Systrace Thread CPU State Analysis Tips - Runnable</a></li><li><a href="https://www.androidperformance.com/en/2022/03/13/android-systrace-cpu-state-running/">Systrace Thread CPU State Analysis Tips - Running</a></li><li><a href="https://www.androidperformance.com/en/2022/03/13/android-systrace-cpu-state-sleep/">Systrace Thread CPU State Analysis Tips - Sleep and Uninterruptible Sleep</a></li></ol><p><a id="running"></a></p><h1 id="Long-Running-Duration"><a href="#Long-Running-Duration" class="headerlink" title="Long Running Duration"></a>Long Running Duration</h1><h2 id="Visualization"><a href="#Visualization" class="headerlink" title="Visualization"></a>Visualization</h2><p>In Trace, a <strong>green</strong> segment indicates the thread is in the Running state.</p><h2 id="Cause-1-High-Code-Complexity-and-Execution-Time"><a href="#Cause-1-High-Code-Complexity-and-Execution-Time" class="headerlink" title="Cause 1: High Code Complexity and Execution Time"></a>Cause 1: High Code Complexity and Execution Time</h2><p>This is the most common cause. While rare, platform bugs can occur if manufacturers add heavy logic to high-frequency core functions in <code>libc</code> or system calls, prolonging execution time.</p><p><strong>Optimization Suggestions</strong>: Optimize logic and algorithms to reduce complexity. To pinpoint which specific function is time-consuming, use the <strong>AS CPU Profiler</strong>, <strong>simpleperf</strong>, or add custom trace points via the <code>Trace.begin/end()</code> API.</p><h2 id="Cause-2-Interpreted-Code-Execution"><a href="#Cause-2-Interpreted-Code-Execution" class="headerlink" title="Cause 2: Interpreted Code Execution"></a>Cause 2: Interpreted Code Execution</h2><p>The keyword “Compiling” in a Trace might indicate interpreted execution. This frequently occurs with newly installed Apps that haven’t undergone <code>odex</code> optimization.</p><p><strong>Optimization Suggestions</strong>: Test with a <code>dex2oat</code> optimized version. Low performance under interpreted execution can only be improved by running <code>dex2oat</code> or optimizing the code itself.</p><p>Additionally, certain language features like frequent JNI calls or repetitive reflection can slow down execution. Beyond experience, use <strong>CPU Profiler</strong> or <strong>simpleperf</strong> for diagnosis.</p><h2 id="Cause-3-Thread-Running-on-Small-Cores"><a href="#Cause-3-Thread-Running-on-Small-Cores" class="headerlink" title="Cause 3: Thread Running on Small Cores"></a>Cause 3: Thread Running on Small Cores</h2><p>For CPU-bound operations, Small Cores may not meet performance needs as they are designed for non-UX-critical threads. However, Android cannot always guarantee optimal scheduling, and tasks may be assigned to Small Cores.</p><p><strong>Optimization Suggestions</strong>: Use <strong>Thread Affinity (Core Binding)</strong> or <strong>SchedBoost</strong> to ensure threads run on cores with higher compute power, like Big Cores. If migrating cores doesn’t help, check if the frequency is being scaled properly (see Cause 4).</p><h2 id="Cause-4-Big-Cores-Running-at-Low-Frequencies"><a href="#Cause-4-Big-Cores-Running-at-Low-Frequencies" class="headerlink" title="Cause 4: Big Cores Running at Low Frequencies"></a>Cause 4: Big Cores Running at Low Frequencies</h2><p><strong>Optimization Suggestions</strong>:</p><ol><li>Optimize code logic to reduce load, allowing smooth execution even at lower frequencies.</li><li>Adjust scheduler frequency-scaling parameters for more aggressive scaling based on load.</li><li>Use platform-provided APIs to lock the CPU at a specific frequency (commonly known as “locking frequency”).</li></ol><h2 id="Cause-5-Thermal-Throttling-Core-Shutdown-and-Frequency-Capping"><a href="#Cause-5-Thermal-Throttling-Core-Shutdown-and-Frequency-Capping" class="headerlink" title="Cause 5: Thermal Throttling: Core Shutdown and Frequency Capping"></a>Cause 5: Thermal Throttling: Core Shutdown and Frequency Capping</h2><p><strong>Optimization Suggestions</strong>:</p><p>Due to structural heat dissipation limits or aggressive thermal parameters, almost all manufacturers will cap CPU frequency or shut down cores to prevent overheating and burns. The first step is identifying the heat trigger.</p><p>Distinguish between external and internal factors. <strong>External factors</strong> include ambient heat (sunlight, heaters), which is worse in summer.</p><p><strong>Internal factors</strong> are primarily driven by the CPU, Modem, camera module, or other power-intensive components. For the CPU, if a background thread is saturating a core, resolve it first. If a foreground app’s high load causes high current draw, reduce that load. For other components, check for unnecessary operation, then optimize business logic.</p><p>If thermal parameters are overly aggressive, compare with competitors to tune the parameters for a better balance.</p><h2 id="Cause-6-Weak-CPU-Compute-Power"><a href="#Cause-6-Weak-CPU-Compute-Power" class="headerlink" title="Cause 6: Weak CPU Compute Power"></a>Cause 6: Weak CPU Compute Power</h2><p><strong>Optimization Suggestions</strong>:</p><p>ARM processors with the same frequency can vary significantly in performance due to microarchitecture configurations. L1&#x2F;L2 Cache capacity also heavily impacts MIPS (<strong>Million Instructions Per Second</strong>).</p><p>Two optimization paths:</p><ol><li><strong>Compiler Parameters</strong>: Difficult for most App developers. System vendors (like Huawei with the Ark Compiler) optimize JNI and code efficiency to boost performance without changing App source code.</li><li><strong>Code Logic Optimization</strong>: Use tools like <code>simpleperf</code> to find hot spots or observe CPU behavior:<ul><li><strong>High Cache Miss Rate</strong>: Optimize memory access patterns.</li><li><strong>Excessive Complex Instructions</strong>: Refactor code to reduce complexity.</li><li><strong>Caching</strong>: Design robust business caches to improve hit rates and avoid “churn” (repeated allocation&#x2F;deallocation).</li></ul></li></ol><p><a id="about"></a></p><h1 id="About-Me-amp-amp-Blog"><a href="#About-Me-amp-amp-Blog" class="headerlink" title="About Me &amp;&amp; Blog"></a>About Me &amp;&amp; Blog</h1><p>Below is my personal intro and related links. I look forward to exchanging ideas with fellow professionals. “When three walk together, one can always be my teacher!”</p><ol><li><a href="https://www.androidperformance.com/en/about/">Blogger Intro</a>: Includes personal WeChat and WeChat group links.</li><li><a href="https://www.androidperformance.com/en/2019/12/01/BlogMap/">Blog Content Navigation</a>: A guide for my blog content.</li><li><a href="https://www.androidperformance.com/en/2018/05/07/Android-performance-optimization-skills-and-tools/">Curated Excellent Blog Articles - Android Performance Optimization Must-Knows</a>: Welcome to recommend projects&#x2F;articles.</li><li><a href="https://www.androidperformance.com/en/2023/12/30/the-performance/">Android Performance Optimization Knowledge Planet</a>: Welcome to join and thank you for your support~</li></ol><blockquote><p><strong>One walks faster alone, but a group walks further together.</strong></p></blockquote><p><img src="/en/images/WechatIMG581.webp" alt="Scan WeChat QR Code"></p>]]></content>
    
    
    <summary type="html">&lt;p&gt;This is the second article in the “Systrace Thread CPU State Analysis Tips” series. It analyzes the causes of the “Running” state in Systrace and provides optimization strategies for when Running segments are excessively long.&lt;/p&gt;
&lt;p&gt;The goal of this series is to use Systrace to view the Android system from a different perspective and to learn the Framework through visualization. While reading Framework source code can be difficult to remember, seeing the flow in Systrace can lead to deeper understanding. You can find the complete &lt;a href=&quot;https://www.androidperformance.com/en/2019/12/01/BlogMap/&quot;&gt;Systrace Basics and Action Series here&lt;/a&gt;.&lt;/p&gt;</summary>


    <category term="Android" scheme="https://androidperformance.com/en/categories/Android/"/>
    
    
    <category term="Android" scheme="https://androidperformance.com/en/tags/Android/"/>
    
    <category term="Systrace" scheme="https://androidperformance.com/en/tags/Systrace/"/>
    
    <category term="Jank" scheme="https://androidperformance.com/en/tags/Jank/"/>
    
    <category term="Memory" scheme="https://androidperformance.com/en/tags/Memory/"/>
    
    <category term="Performance" scheme="https://androidperformance.com/en/tags/Performance/"/>
    
  </entry>
  
  <entry>
    <title>Systrace Thread CPU State Analysis Tips - Runnable</title>
    <link href="https://androidperformance.com/en/2022/01/21/android-systrace-cpu-state-runnable/"/>
    <id>https://androidperformance.com/en/2022/01/21/android-systrace-cpu-state-runnable/</id>
    <published>2022-01-21T02:40:18.000Z</published>
    <updated>2026-05-10T23:29:51.065Z</updated>
    
    <content type="html"><![CDATA[<p>This is the first article in the “Systrace Thread CPU State Analysis Tips” series. It analyzes the causes of the “Runnable” state in Systrace and provides optimization strategies for when Runnable segments are excessively long.</p><p>The goal of this series is to use Systrace to view the Android system from a different perspective and to learn the Framework through visualization. While reading Framework source code can be difficult to remember, seeing the flow in Systrace can lead to deeper understanding. You can find the complete <a href="https://www.androidperformance.com/en/2019/12/01/BlogMap/">Systrace Basics and Action Series here</a>.</p><span id="more"></span><h2 id="Table-of-Contents"><a href="#Table-of-Contents" class="headerlink" title="Table of Contents"></a>Table of Contents</h2><ul><li><a href="#overview">Runnable State Explanation</a></li><li><a href="#reasons">Causes for Long Runnable States and Optimization Strategies</a></li><li><a href="#about">About Me &amp;&amp; Blog</a></li></ul><ol><li><a href="https://www.androidperformance.com/en/2022/01/21/android-systrace-cpu-state-runnable/">Systrace Thread CPU State Analysis Tips - Runnable</a></li><li><a href="https://www.androidperformance.com/en/2022/03/13/android-systrace-cpu-state-running/">Systrace Thread CPU State Analysis Tips - Running</a></li><li><a href="https://www.androidperformance.com/en/2022/03/13/android-systrace-cpu-state-sleep/">Systrace Thread CPU State Analysis Tips - Sleep and Uninterruptible Sleep</a></li></ol><p><a id="overview"></a></p><h1 id="Runnable-State-Explanation"><a href="#Runnable-State-Explanation" class="headerlink" title="Runnable State Explanation"></a>Runnable State Explanation</h1><h2 id="Visualizing-Runnable-in-Trace"><a href="#Visualizing-Runnable-in-Trace" class="headerlink" title="Visualizing Runnable in Trace"></a>Visualizing Runnable in Trace</h2><p>The article <a href="https://www.androidperformance.com/en/2022/03/13/android-systrace-cpu-state-running/">Systrace Thread CPU State Analysis Tips - Running</a> discusses why the “Running” state might take a long time. This section focuses on the principles of the “Runnable” state and corresponding troubleshooting. In Systrace, it appears as a <strong>blue</strong> segment, indicating that the thread is in a Runnable state, waiting to be scheduled by the CPU.</p><p><img src="/en/images/android-systrace-cpu-state-runnable/image.webp" alt="Figure 1: Visualizing Runnable in Systrace"></p><p><img src="/en/images/android-systrace-cpu-state-runnable/image_1.webp" alt="Figure 2: CPU Optimization from Systems Performance Book"></p><p>As shown in Figure 2, a CPU core can only execute one thread at any given moment. Therefore, all tasks waiting for execution are queued in a “runnable queue” (or “run queue”), with one queue per CPU core. A thread in this queue has already acquired all necessary resources (IO, locks, semaphores, etc.) except for the CPU itself. In this state, the thread is marked as RUNNABLE, which appears as the blue segments in Systrace.</p><p>The Linux kernel achieves multitasking by giving threads time slices and rotating them. When a “Running” thread’s time slice (typically in milliseconds) expires, it is set to “Runnable” to wait for its next turn. A special case is “preemption,” where a high-priority thread interrupts a running thread before its time slice expires.</p><p>Multi-core CPUs can execute multiple threads simultaneously, so it’s not always necessary for everyone to wait on the same core. The Linux scheduler manages “load balancing” by migrating threads across cores based on load. It uses “Schedule Classes” to manage priorities:</p><ol><li><strong>SCHED_RR, SCHED_FIFO</strong>: Real-time classes with higher priority than NORMAL.</li><li><strong>SCHED_NORMAL</strong>: Common class, currently using the <strong>CFS</strong> (Completely Fair Scheduler).</li></ol><p>Real-time priorities outrank normal priorities; high-priority tasks can preempt low-priority ones, and low-priority tasks must wait for high-priority ones to finish. Usually, Runnable durations are very short, but anomalies can prevent critical tasks from finishing within deadlines.</p><p><img src="/en/images/android-systrace-cpu-state-runnable/image_2.webp" alt="Figure 3: AOSP Rendering Architecture"></p><p>This often involves multiple threads, especially for UI tasks. In AOSP, a typical frame flows through <strong>UI Thread → Render Thread → SurfaceFlinger → HWC</strong> (Figure 3). If any thread in this chain is blocked in a Runnable state and misses the rendering deadline, jank (frame drop) occurs.</p><p><a id="reasons"></a></p><h1 id="Causes-of-Long-Runnable-States-and-Optimization-Strategies"><a href="#Causes-of-Long-Runnable-States-and-Optimization-Strategies" class="headerlink" title="Causes of Long Runnable States and Optimization Strategies"></a>Causes of Long Runnable States and Optimization Strategies</h1><p>We categorize common causes into 5 major groups. Most are system-level, but App logic can also cause long Runnable states.</p><h2 id="Cause-1-Incorrect-Priority-Settings"><a href="#Cause-1-Incorrect-Priority-Settings" class="headerlink" title="Cause 1: Incorrect Priority Settings"></a>Cause 1: Incorrect Priority Settings</h2><ul><li><strong>App priority too high</strong>: Preempts other tasks, making them appear lower priority and causing them to wait.</li><li><strong>App priority too low</strong>: If the thread is on a “critical path,” it has a higher chance of being stuck as Runnable, leading to jank.</li><li><strong>System Bugs</strong>: Framework incorrectly assigning very high or low priorities.</li></ul><p><strong>Optimization Strategies:</strong></p><ol><li>Adjust thread priority based on the scenario; identify which thread is preempting yours in the Trace.</li><li>System-level: Set critical threads to the <code>FIFO</code> scheduling policy.</li></ol><p>In practice, many Apps become <em>more</em> laggy after setting custom priorities because their strategy might work on one device but clash with the custom scheduler of another manufacturer. Generally, third-party developers should avoid direct priority APIs to prevent counterproductive results.</p><p>A more reliable long-term approach is designing a proper task model—never put time-sensitive tasks on generic worker threads.</p><h2 id="Cause-2-Improper-CPU-Affinity-Core-Binding"><a href="#Cause-2-Improper-CPU-Affinity-Core-Binding" class="headerlink" title="Cause 2: Improper CPU Affinity (Core Binding)"></a>Cause 2: Improper CPU Affinity (Core Binding)</h2><p>To speed up execution, developers often bind threads to “Big Cores.” While this helps the “Running” phase, it must be done cautiously. Binding a thread to a specific core prevents it from running anywhere else, even if other cores are idle. If too many threads are bound to the same core, that core becomes a bottleneck, leading to long “Runnable” queues.</p><p><strong>Core Binding Tips:</strong></p><ol><li><strong>Don’t bind to a single core</strong>: This has zero fault tolerance. If that core is preempted, the thread must wait. Bind to a “CPU Cluster” (e.g., Big Cores 4-7) instead.</li><li><strong>Avoid cluster overcrowding</strong>: On platforms with only 2 big cores, binding too many threads to them quickly leads to saturation, making binding a “negative optimization.”</li><li><strong>Identify cores correctly</strong>: Core indices vary. 4-7 aren’t always Big Cores; some platforms use 0-3 as Big Cores.</li><li><strong>Respected CPUSETS</strong>: Binding only works within the process’s allowed <code>cpuset</code>. Attempting to bind a thread to cores 4-7 when the process is restricted to 0-3 will fail or cause errors.</li></ol><h2 id="Cause-3-Poor-Software-Architecture-Design"><a href="#Cause-3-Poor-Software-Architecture-Design" class="headerlink" title="Cause 3: Poor Software Architecture Design"></a>Cause 3: Poor Software Architecture Design</h2><p>Runnable represents time spent in a CPU queue. Common sense says the longer the queue or more frequent the queuing, the higher the risk. Complex tasks spanning many threads (e.g., rendering) are more vulnerable because each thread transition adds a potential queuing delay.</p><p>If your programming model requires heavy orchestration between many threads (A hands off to B, A waits for B, B wakes A), any CPU congestion will amplify the “Runnable” wait at every handoff.</p><p><strong>Optimization Strategies:</strong></p><ol><li>Adjust priorities (see Cause 1).</li><li>Optimize architecture to minimize cross-thread handoffs&#x2F;wakes. Use Trace to visualize thread dependencies and CPU Profiler to inspect logic.</li><li>Platform-level: Modify the scheduler to identify “thread groups” with dependency chains and prioritize them together.</li></ol><h2 id="Cause-4-High-Application-or-System-Load"><a href="#Cause-4-High-Application-or-System-Load" class="headerlink" title="Cause 4: High Application or System Load"></a>Cause 4: High Application or System Load</h2><p>If massive numbers of tasks are forced into a single core’s run queue, lower-priority tasks will inevitably wait longer.</p><p>In Perfetto&#x2F;Systrace, check the CPU core view. If you see a dense, gapless sequence of tasks even after zooming in, the system load is likely high (CPU usage $&gt;90%$). Select an interval and sort tasks by duration to see what is consuming the CPU.</p><p>Two main sources of high load:</p><h3 id="1-High-App-Specific-Load"><a href="#1-High-App-Specific-Load" class="headerlink" title="1. High App-Specific Load"></a>1. High App-Specific Load</h3><p>The App itself saturates the CPU by spawning dozens of threads simultaneously.</p><p><strong>Optimization Suggestions:</strong></p><ol><li>Identify high-usage threads and check for abnormal behavior.</li><li>Optimize the load of the thread itself using <code>simpleperf</code>.</li><li>Use a higher-priority scheduler (e.g., <code>RT</code>), but use caution as this introduces new risks.</li><li>Separate critical and non-critical threads. Bind non-critical threads to Small Cores or set low priorities; set high priorities for rendering threads. Assume a harsh environment—Android doesn’t guarantee your App exclusive resources.</li></ol><h3 id="2-High-System-Service-Load"><a href="#2-High-System-Service-Load" class="headerlink" title="2. High System Service Load"></a>2. High System Service Load</h3><p>Some manufacturer ROMs have inefficient background services that consume excessive resources. Additionally, poor management might allow “rogue apps” to stay active in the background for sync&#x2F;keep-alive operations.</p><h3 id="3-Manufacturer-“Magic”-Technologies"><a href="#3-Manufacturer-“Magic”-Technologies" class="headerlink" title="3. Manufacturer “Magic” Technologies"></a>3. Manufacturer “Magic” Technologies</h3><p>Manufacturers can optimize resource allocation to favor foreground Apps:</p><ol><li><strong>CPUSETS</strong>: Group threads by priority and restrict them to specific clusters. AOSP has this but with flaws:<ul><li>Many background tasks can still saturate all cores.</li><li>Doesn’t always respect process states (Music, Navigation, etc.).</li><li>Doesn’t manage sub-processes forked from Java processes well.</li></ul></li><li><strong>CPUCTL</strong>: Set resource quotas (e.g., cap CPU usage for rogue or background processes).</li><li><strong>Freezing Technology</strong>: Freeze background processes to deny them CPU entirely (similar to iOS). Challenges include handling IPC, process relations, and compatibility.</li><li><strong>On-demand Startup</strong>: Tight control over system and background auto-starts.</li></ol><h2 id="Cause-5-CPU-Capacity-Limits-Throttling-and-State-Anomalies"><a href="#Cause-5-CPU-Capacity-Limits-Throttling-and-State-Anomalies" class="headerlink" title="Cause 5: CPU Capacity Limits, Throttling, and State Anomalies"></a>Cause 5: CPU Capacity Limits, Throttling, and State Anomalies</h2><p>Just like a queue at a clinic—fewer windows mean longer waits. Weak CPU power, core shutdowns, or frequency capping increase Runnable probability.</p><ol><li><strong>Scenario-Based Control</strong><ul><li>Different frequency&#x2F;core policies for different modes.</li><li>Locking frequencies&#x2F;cores due to high temperature.</li></ul></li><li><strong>Low Power Mode</strong>: e.g., Qualcomm’s LPM.</li><li><strong>C-State Transitions</strong>: Latency when switching from deep sleep (C2&#x2F;C1) to active (C0).</li><li><strong>Hardware Failure</strong>: Rare but possible.</li><li><strong>Low-End Devices</strong>: Cheap CPUs with low compute power.</li></ol><p><strong>Observations:</strong></p><ul><li><strong>Scenario Control</strong>: This tests a manufacturer’s tuning. Apps should aim for lower load to avoid triggering platform restrictions. Manufacturers must balance power and performance per scenario.</li><li><strong>Thermal Throttling</strong>: See “Cause 5: Thermal Throttling” in <a href="https://www.androidperformance.com/en/2022/03/13/android-systrace-cpu-state-running/">Systrace Thread CPU State Analysis Tips - Running</a>.</li><li><strong>Low-End Devices</strong>: Truly weak CPUs simply can’t process tasks as fast as flagship chips, leading to more queuing.</li></ul><h2 id="Cause-6-Scheduler-Anomalies"><a href="#Cause-6-Scheduler-Anomalies" class="headerlink" title="Cause 6: Scheduler Anomalies"></a>Cause 6: Scheduler Anomalies</h2><p>While rare, scheduler bugs or misconfigured “governors” can cause tasks to pile up on a few cores while others are idle.</p><p>System developers should build robust “observability” to diagnose these fleeting issues that are difficult to reproduce.</p><h2 id="Cause-7-32-bit-vs-64-bit-Process-Handling"><a href="#Cause-7-32-bit-vs-64-bit-Process-Handling" class="headerlink" title="Cause 7: 32-bit vs. 64-bit Process Handling"></a>Cause 7: 32-bit vs. 64-bit Process Handling</h2><p>Transitionary chips (like Snapdragon 8 Gen 1 or Dimensity 9000) have strange restrictions. 32-bit Apps might be restricted to specific microarchitectures, while 64-bit Apps run freely. If your App is still 32-bit, its tasks might be forced onto a subset of cores, increasing Runnable congestion.</p><ol><li><strong>App Developers</strong>: Upgrade to 64-bit immediately.</li><li><strong>System Developers</strong>: Identify legacy Apps and optimize background management to reduce their load.</li></ol><p><a id="about"></a></p><h1 id="About-Me-amp-amp-Blog"><a href="#About-Me-amp-amp-Blog" class="headerlink" title="About Me &amp;&amp; Blog"></a>About Me &amp;&amp; Blog</h1><p>Below is my personal intro and related links. I look forward to exchanging ideas with fellow professionals. “When three walk together, one can always be my teacher!”</p><ol><li><a href="https://www.androidperformance.com/en/about/">Blogger Intro</a></li><li><a href="https://www.androidperformance.com/en/2019/12/01/BlogMap/">Blog Content Navigation</a>: A guide for my blog content.</li><li><a href="https://www.androidperformance.com/en/2018/05/07/Android-performance-optimization-skills-and-tools/">Curated Excellent Blog Articles - Android Performance Optimization Must-Knows</a></li><li><a href="https://www.androidperformance.com/en/2023/12/30/the-performance/">Android Performance Optimization Knowledge Planet</a></li></ol><blockquote><p><strong>One walks faster alone, but a group walks further together.</strong></p></blockquote><p><img src="/en/images/WechatIMG581.webp" alt="Scan WeChat QR Code"></p>]]></content>
    
    
    <summary type="html">&lt;p&gt;This is the first article in the “Systrace Thread CPU State Analysis Tips” series. It analyzes the causes of the “Runnable” state in Systrace and provides optimization strategies for when Runnable segments are excessively long.&lt;/p&gt;
&lt;p&gt;The goal of this series is to use Systrace to view the Android system from a different perspective and to learn the Framework through visualization. While reading Framework source code can be difficult to remember, seeing the flow in Systrace can lead to deeper understanding. You can find the complete &lt;a href=&quot;https://www.androidperformance.com/en/2019/12/01/BlogMap/&quot;&gt;Systrace Basics and Action Series here&lt;/a&gt;.&lt;/p&gt;</summary>


    <category term="Android" scheme="https://androidperformance.com/en/categories/Android/"/>
    
    
    <category term="Android" scheme="https://androidperformance.com/en/tags/Android/"/>
    
    <category term="Perfetto" scheme="https://androidperformance.com/en/tags/Perfetto/"/>
    
    <category term="Systrace" scheme="https://androidperformance.com/en/tags/Systrace/"/>
    
    <category term="Jank" scheme="https://androidperformance.com/en/tags/Jank/"/>
    
    <category term="Performance" scheme="https://androidperformance.com/en/tags/Performance/"/>
    
  </entry>
  
  <entry>
    <title>Android Performance Optimization: Techniques, Methods, and Tools</title>
    <link href="https://androidperformance.com/en/2022/01/07/The-Performace-1-Performance-Tools/"/>
    <id>https://androidperformance.com/en/2022/01/07/The-Performace-1-Performance-Tools/</id>
    <published>2022-01-06T16:42:03.000Z</published>
    <updated>2026-05-10T23:29:51.063Z</updated>
    
    <content type="html"><![CDATA[<p><img src="/en/images/The-Performace-1-Performance-Tools/cc4162d9-7c2b-43b1-b9a1-f14d5c8e8605.jpg" alt="Hackers and Painters"></p><blockquote><p>In his book <Hackers and Painters>, Paul Graham states: “The execution efficiency gap between different programming languages is becoming increasingly large, so profilers are becoming more important. Currently, performance profiling is not receiving enough attention. Many people still believe that the key to improving program running speed is developing compilers that can generate faster code. The gap between code efficiency and machine performance is continuously increasing, and we will increasingly clearly see that the key to improving application software running speed is having a good performance profiler to guide program development.”</p></blockquote><blockquote><p>By Paul Graham — Hackers and Painters</p></blockquote><p>If you Google search “Android optimization tools,” you’ll find many related contents. Their problem is that content is highly repetitive, or they directly explain usage methods. They rarely introduce overall architecture, which can easily make you form the erroneous cognition of “one tool handles everything.” Based on my team’s years of experience, in the performance profiling field, such a silver bullet-level tool does not exist. Tools are evolving, old problems will appear in new forms. If you don’t master the core logic, you’ll always float on the surface of technology.</p><p>This article will systematically organize observable technologies in performance profiling, covering three parts of content: data types, capture methods, and analysis methods. After that, we’ll introduce Google’s traditional “Big Three” analysis tools. The goal is to let you understand immutable theoretical knowledge and corresponding tools available in the Android environment, so you can take fewer detours and directly reuse predecessors’ experience.</p><span id="more"></span><p>It’s important to note that for performance optimization, there are certainly more than just these three tools available, but these three are the “first-tier tools” we usually use. Before conducting further analysis, you’ll need to rely on these three tools for bottleneck positioning, and then choose corresponding tools for deep-dive analysis based on different domain characteristics.</p><p>In today’s Android performance workflow, that sentence should be expanded from “Systrace, Perfetto, and Android Studio Profiler” into a combination of repeatable measurement, system tracing, and field quality signals:</p><table><thead><tr><th>Scenario</th><th>Older workflow</th><th>Current fuller workflow</th></tr></thead><tbody><tr><td>Investigate one local jank or startup issue</td><td>Capture Systrace HTML and inspect the main thread, RenderThread, and CPU scheduling in Chrome</td><td>Capture Perfetto&#x2F;System Trace, inspect Frame Timeline, CPU, Binder, and I&#x2F;O in Perfetto UI, then use <code>trace_processor</code> SQL for bulk analysis</td></tr><tr><td>Decide whether an optimization worked</td><td>Run manually several times, read <code>am start -W</code>, or eyeball dropped frames</td><td>Encode the scenario in Macrobenchmark, use <code>StartupTimingMetric</code> and <code>FrameTimingMetric</code> for regression checks, and pair startup work with Baseline Profiles&#x2F;Startup Profiles</td></tr><tr><td>Find field issues</td><td>Custom telemetry, APM, user reports</td><td>Start from Android Vitals for startup, ANR, slow&#x2F;frozen frames, LMK, and other core signals, then add business-specific telemetry</td></tr><tr><td>Drill into code paths</td><td>TraceView, Method Trace</td><td>Android Studio CPU Profiler, method tracing, sampled call stacks, and Perfetto custom trace sections</td></tr></tbody></table><p>The first half of this article, which discusses Log&#x2F;Metric&#x2F;Trace, capture strategies, and analysis methods, still holds. The tool sections that mention Systrace, TraceView, and Android Device Monitor should be read as older entry points whose current counterparts are Perfetto, Android Studio Profiler, and Layout Inspector.</p><hr><h1 id="1-Observable-Technologies-in-Performance-Profiling"><a href="#1-Observable-Technologies-in-Performance-Profiling" class="headerlink" title="1 Observable Technologies in Performance Profiling"></a>1 Observable Technologies in Performance Profiling</h1><ul><li>Was this operation actually executed? How long did execution take?</li><li>Why is there such a huge difference between two versions?</li><li>What operations is the system executing when CPU usage becomes high?</li><li>Why did startup speed become slower?</li><li>Why does this page always stutter for a moment?</li></ul><p>I believe everyone has been asked similar questions by colleagues or bosses. The most primitive thought should be to first get relevant logs and analyze them line by line. Based on past experience, find clues by searching for keywords. If you can’t find the information you want, then add logs and try to reproduce locally. This is time-consuming to say the least, and also consumes R&amp;D resources. But have you ever thought whether there’s a more efficient method in the industry? One that can improve your efficiency by a magnitude, letting you spend your time on problem-solving rather than boring repetitive physical labor?</p><p>The answer of course is yes (otherwise there wouldn’t be this article). We call it <strong>Observable Technologies</strong>.</p><hr><p>Computer industry development to date, predecessors of the field have捣鼓 out what are called “observable technologies.” It studies how to use tools to observe detailed execution of complex systems. The more detailed the content, the better. Before mobile operating systems, there were embedded systems. Current high-end Android phones’ computational power can catch up to the computational power of a main computer from twenty years ago. On this computational foundation, the software complexity brought by mobile phones is also very huge.</p><p>If your program deploys a well-designed and good-performing observable technology, it can greatly accelerate R&amp;D software efficiency. Because even if we use various upfront static code checking and manual code reviews, we can’t 100% intercept software problems. Only after running in real environment do you know whether problems actually occurred. Even if this environment might be an automated test case of yours. Even so, you still need to read through your logs and reread code to find problems. For these reasons, every engineering team needs to have a functionally complete observable technology as one of their infrastructure.</p><p>Observable technology is a systematic engineering project that allows you to more deeply understand what’s happening inside the software system. It can be used to understand the internal execution process of software systems (especially for business logic or systems with complex interaction relationships), troubleshoot problems or even find bottleneck points to optimize the program itself. For complex systems, understanding the entire execution process through reading code is actually quite difficult. A more efficient method is to use such tools to obtain the software system’s running state in the most intuitive way.</p><p>The following will help you understand observable technologies from three themes: data types, data acquisition methods, and analysis methods.</p><h2 id="1-1-Data-Types"><a href="#1-1-Data-Types" class="headerlink" title="1.1 Data Types"></a>1.1 Data Types</h2><p>Log forms might be key-value pairs (key&#x3D;Value), JSON, CSV, relational databases, or any other format. Secondly, we restore the system’s entire running state at that time through logs, with the goal being to solve a certain problem, observe the running mode of a certain module, or even characterize system user behavior patterns. In observable technology, we classify log types into Log types, Metric types, and Trace types.</p><p><img src="/en/images/The-Performace-1-Performance-Tools/d9548a10-cc3d-497d-9d4c-5efa92de1a43-20220707058401.webp" alt="Data Types"></p><h3 id="Log-Type"><a href="#Log-Type" class="headerlink" title="Log Type"></a>Log Type</h3><p>Log is the most primitive data recording method. It generally records what module did what thing at what time, and whether log level is warning or error. The vast majority of systems, whether embedded devices or computers in cars, the log form they use is almost always of this type. This is the simplest, most direct, and also best-implemented method. Almost all Log types are stored through string type. Data presentation format is a single text data line. Log is the most basic type. Therefore, through transformation, Log type can be converted to Metric or Trace types. Of course, the cost is the transformation process. When data volume is very large, this might become a bottleneck.</p><p>To identify different log type levels, error, warning, and debug levels are commonly used to categorize log levels. Obviously, error-type is the primary log level you need to focus on. However, in practice, people won’t strictly categorize according to this method. This might be related to their engineering development environments not doing good categorized analysis on different log levels. In summary, you can categorize Log types by level based on your purpose. It’s like an index, which can further improve the efficiency of analyzing problems and locating target information.</p><h3 id="Metric-Type"><a href="#Metric-Type" class="headerlink" title="Metric Type"></a>Metric Type</h3><p>Metric type is more focused in purpose compared to Log type. It records the numerical changes of a certain dimension. The knowledge point is “dimension” vs. “numerical value.” A dimension might be CPU usage rate, CPU Cluster scheduling frequency, or context switch count. Numerical value changes can be instantaneous values at sampling time (becoming snapshot-type), or difference from previous sampling (increment or decrement), or statistical aggregated values over a certain time period. In practice, aggregated values are often used, for example, if I want to see the average CPU usage in the 5 minutes before a problem occurred. At this time, I need to calculate a simple average or weighted average of all values within these five minutes (for example, samples closer to the occurrence point get higher weight). Log type can of course achieve Metric type effects, but the operation is quite troublesome and its performance loss might not be small.</p><p>Aggregation is a very useful tool because it’s impossible for humans to analyze all Metric values one by one. Therefore, using aggregation to determine whether there’s a problem before conducting detailed analysis is a more cost-effective method.</p><p>Another benefit of Metric type is that its content format is relatively fixed, so it can use pre-encoding for data storage. Space utilization is more compact, and thus disk space occupied is also less. The simplest application is storing in data format. If you use Log type, it’s generally ASCII encoding. While Metric type uses integers or floating point and other fixed byte array data. When storing larger numerical values, obviously ASCII encoding requires more byte count than numerical-type data. And during data processing, you can directly use Metric data without needing to convert Log’s ASCII to numerical format before conversion.</p><p>Besides specific numerical values, it can also store enumeration values (essentially, their essence is also numerical). Different enumeration values represent different meanings. It could be on and off, or different event types.</p><h3 id="Trace-Type"><a href="#Trace-Type" class="headerlink" title="Trace Type"></a>Trace Type</h3><p>Trace type identifies the time, name, and duration of event occurrences. Multiple events identify whether it’s parent-child or sibling relationships through relationships. When analyzing complex calling relationships between multiple threads, Trace type is the most convenient data analysis method.</p><p>Trace type is particularly suitable for Android application and system-level analysis scenarios because it can diagnose:</p><ol><li><strong>Function call chains</strong></li><li><strong>Binder invocation chains</strong></li><li><strong>Cross-process event flow tracking</strong></li></ol><p>In the design of Android application runtime environments, an application cannot complete all functions independently. It needs to interact extensively with SystemServer to complete many of its functions. Communication with SystemServer is completed through Binder. Its communication method will be introduced in detail in later articles. For now, you just need to know that its communication relationship is cross-process calls. This requires combining client-side and server-side data to accurately restore the calling relationship. Trace type is the best way to complete this kind of information recording.</p><p>Trace type can be added with manually set start and end points. Within one function, you can add multiple such intervals. Through pre-compilation technology or programming language features, you can automatically insert Trace intervals at function’s header and end. Ideally, the latter is the best solution because you can know which functions in the system are which, their execution situations, and what the calling relationships are. You can use this information to count which functions have the most call counts (hottest points), and which functions are the most time-consuming. It’s imaginable that this approach brings huge performance loss because the frequency and magnitude of function calls are very large. The more complex the system magnitude, the larger it is.</p><p>Therefore, there’s a workaround method: that’s using sampling to obtain call stack to approximately fit the above effect. The shorter the sampling interval, the better it can fit the real calling relationships and duration. But the interval also shouldn’t be too small because the operation of taking stack itself becomes very high because the number of times increases. This method is called Profiler in the industry. The vast majority of profilers for programming languages you’ve seen are implemented based on this principle.</p><h2 id="1-2-Data-Acquisition-Methods"><a href="#1-2-Data-Acquisition-Methods" class="headerlink" title="1.2 Data Acquisition Methods"></a>1.2 Data Acquisition Methods</h2><p><img src="/en/images/The-Performace-1-Performance-Tools/b0fd0720-1b25-4546-a98e-f25947a52505-20220707058428.webp" alt="Data Acquisition Methods"></p><h3 id="Static-Instrumentation-and-Dynamic-Tracing"><a href="#Static-Instrumentation-and-Dynamic-Tracing" class="headerlink" title="Static Instrumentation and Dynamic Tracing"></a>Static Instrumentation and Dynamic Tracing</h3><p>Static code acquisition methods are the most primitive approach. The advantage is simple implementation, but the disadvantage is that you need to recompile and install programs every time you add new content. When you encounter a problem later, if the information you want to see happens to not have been logged in advance, there’s no way to further locate problems. You can only start over the entire process again.</p><p>A more progressive approach is to pre-add data acquisition points at all possible places you might need, and choose whether to output through dynamic judgment of switches. This can both control performance impact and be able to dynamically turn on logs when needed. However, the cost of this method is very high.</p><p>Dynamic tracing technology has actually always existed, but its learning cost is relatively high. It’s hailed as the dragon-slaying sword in the debugging field. It requires you to understand relatively deep technical knowledge, especially compilation, ELF format, kernels, and being familiar with predefined probes and dynamic language-対応 programming languages in code. To you, if you’re wrong, this kind of technology even has its own set of programming languages for “dynamic” implementation developer requirements. This approach combines performance and flexibility. You can even dynamically view the information you want when encountering exceptions in online versions. It兼具 performance and flexibility, and you can even see what’s happening in your code in a very short time after exceptions occur. It’s very powerful for online troubleshooting and problem reproduction.</p><h3 id="Unconditional-and-Conditional-Capture"><a href="#Unconditional-and-Conditional-Capture" class="headerlink" title="Unconditional and Conditional Capture"></a>Unconditional and Conditional Capture</h3><p>Unconditional capture is relatively easy to understand. After triggering capture, no matter what happens, it will continuously capture data. The disadvantage is that when the data volume generated by observed object is very large, it might cause relatively large impact on the system. In such cases, you can only mitigate by reducing the data volume. You need to achieve meeting requirements while performance loss isn’t too large.</p><p>Conditional capture is often used for scenarios where identifiable anomalies can be detected. For example, when a certain observed value of the system exceeds a preset threshold, at this point, capture is triggered and continues for a period or reaches another threshold before ending capture. This is slightly more progressive than the previous method because it only impacts the system when problems occur, and has no impact points at other times. But it requires you to be able to identify anomalies, and such anomalies shouldn’t require pre-occurrence historical data. Of course, you can make it easier to reach trigger points by lowering the threshold, which can increase the probability of triggering data capture. At this time, you’ll encounter the same problems encountered by unconditional capture above, requiring you to balance performance loss.</p><h3 id="Dumping-Strategy"><a href="#Dumping-Strategy" class="headerlink" title="Dumping Strategy"></a>Dumping Strategy</h3><p>Continuous dumping is storing all data generated during the entire data capture process. The cost is storage pressure. If you can identify the trigger point, for example, being able to detect anomalies, you can then choose to dump selectively. To ensure historical data’s effectiveness, you therefore first temporarily store logs to a RingBuffer, and only proceed to persistent storage after accepting a dump command. This approach balances performance and storage pressure, but the cost is runtime memory loss and trigger’s accuracy.</p><p>From the above discussion, you can know that from the most primitive to the most progressive, there are different advantages and costs. As your program gets more mature, you first need to have probes. Fortunately, in Linux kernels and other frameworks, corresponding probe points are already laid out. But in the Android application layer, there aren’t ready-made ones. So currently, dynamic frameworks available on Android, such as eBPF-based frameworks, are all used by kernel developers. Therefore, you can use dynamic frameworks such as eBPF on Android apps. Only professional and full-time performance analysis personnel might use such tools. It has two key points: probes and dynamic language. During program execution, corresponding probe points need to hand over program execution permissions to dynamic tracing frameworks. Framework execution logic is what developers write using dynamic languages.</p><p>So your program should first have probes. Fortunately, Linux kernel and other frameworks have laid out corresponding probe points. But in the Android application layer, there aren’t ready-made ones. So currently, frameworks you can use on Android, such as eBPF frameworks, are all used by kernel developers. Therefore, you can use dynamic frameworks on Android apps, but only professional and full-time performance analysis personnel might use this category of tools. It has two key points: probes and dynamic language. During program execution, corresponding probe points need to hand over program execution permissions to dynamic tracing frameworks. Framework execution logic is what developers write using dynamic languages.</p><h2 id="1-3-Analysis-Methods"><a href="#1-3-Analysis-Methods" class="headerlink" title="1.3 Analysis Methods"></a>1.3 Analysis Methods</h2><p><img src="/en/images/The-Performace-1-Performance-Tools/0d8c6651-c62f-4f0f-aacc-0ebb56667e23-20220707058419.webp" alt="Analysis Methods"></p><h3 id="Data-Visualization-Analysis"><a href="#Data-Visualization-Analysis" class="headerlink" title="Data Visualization Analysis"></a>Data Visualization Analysis</h3><p>With increasing complexity of problem analysis, there’s a need to address performance issues involving multiple module interactions. In the industry, data visualization analysis methods have emerged that take time as the horizontal axis and put corresponding events in their respective lanes. This can conveniently see when events of concern occur, interaction information with other systems, etc. In Android, we commonly use Systrace&#x2F;Perfetto, as well as earlier KernelShark and other tools—essentially all are tools of this category. The “Trace type” mentioned in “Data Types” often employs this visualization analysis method.</p><p>Systrace’s visualization framework is built based on Catapult, a sub-project of Chrome. <a href="https://docs.google.com/document/d/1CvAClvFfyA5R-PhYUmn5OOQtYMH4h6I0nSsKchNAySU/preview">Trace Event Format</a> describes the data formats supported by Catapult. If you have Trace-type data, you can use this framework to display visualized data. AOSP compilation system, Android application compilation process, also has corresponding Trace file outputs. They all implemented visualization effects based on Catapult.</p><h3 id="Database-Analysis"><a href="#Database-Analysis" class="headerlink" title="Database Analysis"></a>Database Analysis</h3><p>When facing massive data analysis needs, by formatting data and converting them into two-dimensional tables, using SQL language can achieve efficient query operations. In the server field, <a href="https://www.elastic.co/cn/what-is-elk-stack">ELK</a> and similar technology stacks can achieve more flexible formatted search and statistical functions. With the help of databases and Python, you can even implement an automated data diagnosis toolchain.</p><p>From the above discussion, we can know that from text analysis to database analysis, the analysis purposes they face are different. Text analysis is sufficient for just looking at a module’s time consumption with log analysis. For interactions between multiple systems, we need to use visualization tools. For complex database analysis, we need to use SQL tools. Regardless of which analysis method, they’re all essentially data analysis. In practice, we frequently use other tools to transform data to support different analysis methods, for example, converting from text analysis to database analysis.</p><p>Choose the appropriate analysis method according to your purpose, and it will make your work twice as effective.</p><p>For Android developers, Google has provided several very important performance analysis tools to help system and application developers optimize their programs.</p><hr><h1 id="2-Google-Provided-Android-Performance-Analysis-Tools"><a href="#2-Google-Provided-Android-Performance-Analysis-Tools" class="headerlink" title="2 Google-Provided Android Performance Analysis Tools"></a>2 Google-Provided Android Performance Analysis Tools</h1><p>Based on practical experience, the most commonly used tools are Systrace, Perfetto, and Profiler tools in Android Studio. After positioning main bottlenecks through them, you only need to use other domain-related tools. Therefore, we’ll focus on introduction of these three tools’ application scenarios, their advantages, and basic usage methods. For lateral comparison between tools, please refer to the “Comprehensive Comparison” section content in the next chapter.</p><hr><h2 id="2-1-First-Generation-System-Performance-Analysis-Tool-—-Systrace"><a href="#2-1-First-Generation-System-Performance-Analysis-Tool-—-Systrace" class="headerlink" title="2.1 First-Generation System Performance Analysis Tool — Systrace"></a>2.1 First-Generation System Performance Analysis Tool — Systrace</h2><p>Systrace is a Trace-type visualized analysis tool, a first-generation system-level performance analysis tool. All features supported by Trace type are supported by it. Before Perfetto appeared, it was basically the only performance analysis tool. It displays Android system and app’s running information in a graphical way. Compared to logs, Systrace’s image-based presentation is more intuitive. Compared to TraceView, its performance overhead when capturing Systrace is basically negligible, minimizing the impact on observers to the greatest extent.</p><p><img src="/en/images/The-Performace-1-Performance-Tools/8ea0e7de-1f32-471f-929a-5a37d73e3270.webp" alt="Systrace"></p><h3 id="Systrace’s-Design-Philosophy"><a href="#Systrace’s-Design-Philosophy" class="headerlink" title="Systrace’s Design Philosophy"></a>Systrace’s Design Philosophy</h3><p>At <strong>critical system operations</strong> (such as Touch operations, Power button presses, swipe operations, etc.), <strong>system mechanisms</strong> (input distribution, View hierarchy, inter-process communication, process management mechanisms, etc.), and <strong>hardware&#x2F;software information</strong> (CPU frequency information, CPU scheduler information, disk information, memory information, etc.), we insert log-like information at key processes, which we call TracePoint (essentially ftrace information), and use these TracePoints to display execution time of a core operation process, certain variable values, etc. The Android system then collects these TracePoints scattered in various processes, writes them to a file. After exporting this file, Systrace parses these TracePoints’ information to obtain the entire system’s running information over a period.</p><p><img src="/en/images/The-Performace-1-Performance-Tools/56bebe5b-e5fd-4b69-8e36-3197fe205034.webp"></p><p>In the Android system, some important modules have already inserted some TracePoints by default, classified through TraceTags. The information sources are as follows:</p><ol><li>Framework Java layer’s TracePoints are completed through the android.os.Trace class</li><li>Framework Native layer’s TracePoints are completed through the ATrace class</li><li>App developers can customize TracePoints through the android.os.Trace class</li></ol><p>In this way, Systrace can collect and centrally display all information of the Android upper layer, turning the entire Android system’s running state from a black box to a white box for Android developers and system developers. Global and visualization make Systrace the first choice for Android developers and system developers when analyzing complex performance problems.</p><h3 id="Practical-Application-Scenarios"><a href="#Practical-Application-Scenarios" class="headerlink" title="Practical Application Scenarios"></a>Practical Application Scenarios</h3><p>The parsed Systrace, having massive system information, is naturally suitable for analyzing Android App and Android system performance problems. Android’s app developers, system developers, and kernel developers can all use Systrace to analyze performance problems.</p><p>From a technical perspective, Systrace can cover the <strong>response speed</strong>, <strong>stuttering and dropped frames</strong>, and <strong>ANR</strong> these major categories.</p><p>From a user perspective, Systrace can analyze user-encountered performance problems, including but not limited to:</p><ol><li>Application startup speed issues, including cold startup, hot startup, warm startup</li><li>Screen transition speed slow, screen-to-screen animation stuttering</li><li>Other non-transition click operations slow (toggles, popups, long presses, selections, etc.)</li><li>Screen lock&#x2F;unlock speed slow, phone unlock slow</li><li>Face recognition slow</li><li>List scrolling stuttering</li><li>Screen animation stuttering</li><li>Screen loading stuttering</li><li>Overall stuttering</li><li>App click unresponsive, stuck, crashes</li></ol><p>After encountering the above problems, you can use various methods to capture Systrace, open the parsed file in Chrome for analysis.</p><hr><h2 id="2-2-New-Generation-Performance-Analysis-Tool-Stack-—-Perfetto"><a href="#2-2-New-Generation-Performance-Analysis-Tool-Stack-—-Perfetto" class="headerlink" title="2.2 New-Generation Performance Analysis Tool Stack — Perfetto"></a>2.2 New-Generation Performance Analysis Tool Stack — Perfetto</h2><p>Google made its first commit in 2017, and in the subsequent 4 years (up to December 2021), there were over 100 developers submitting nearly 3.7W commits, almost with PR and Merge operations every day, which is a quite active project. Besides powerful functionality, its ambition is also very large. Officially, it claims to be the next-generation cross-platform Trace&#x2F;Metric data capture and analysis tool. Application is quite widespread. Besides Perfetto website, <a href="https://devblogs.microsoft.com/performance-diagnostics/new-tools-for-analyzing-android-linux-and-chromium-browser-performance/">Windows Performance Tool</a> and <a href="https://developer.android.com/studio">Android Studio</a>, as well as Huawei’s <a href="https://developer.huawei.com/consumer/cn/doc/development/tools-guides/overview-0000001050741459">GraphicProfiler</a> also support Perfetto data’s visualization and analysis. We believe Google will continue investing resources into the Perfetto project, so it should be the next-generation performance analysis tool and will completely replace Systrace.</p><h3 id="Highlighted-Features"><a href="#Highlighted-Features" class="headerlink" title="Highlighted Features"></a>Highlighted Features</h3><p>The biggest improvement of Perfetto compared to Systrace is support for long-duration data capture. This is thanks to having a service that can run in the background, implementing protobuf encoding and storage for incoming data. In terms of data sources, core principle is consistent with Systrace, also based on Linux kernel’s ftrace mechanism implementing user-space and kernel-space key event recording (ATRACE, CPU scheduler, etc.). All features supported by Systrace are also supported by Perfetto. That’s why it’s said Systrace will ultimately be replaced by Perfetto.</p><p><img src="/en/images/The-Performace-1-Performance-Tools/fc328f61-6e2a-4695-b712-c42a7e9ab02b.webp" alt="Perfetto"></p><p>Perfetto supports the data types, acquisition methods, and analysis methods provided by it—unprecedentedly comprehensive. It almost supports all types and methods. In terms of data types, it implements Trace-type support through ATRACE, implements Metric-type support through a configurable node reading mechanism, and implements Log-type support through obtaining logcat data in UserDebug builds.</p><p>You can manually trigger capture and end through the perfetto.dev website, command-line tools, or even dynamically trigger capture through Developer Options in settings. It basically covers all scenarios you can encounter on your projects.</p><p>In terms of data analysis, Perfetto provides data visualization analysis webpages similar to Systrace operations, but the underlying implementation mechanism is completely different. The biggest benefit is it can support rendering of super-large files (exceeding 300M), which is what Systrace can’t do (it might crash when over 300M, or become very sluggish). In this visualization webpage, you can see various secondary processing data, can execute SQL queries, and even see logcat contents. Perfetto trace files can be converted into SQLite-based database files, which can both be executed on-site by writing SQL or execute pre-written SQL files. You can even import them into Jupyter and other data science tool stacks, sharing your analysis ideas with other partners.</p><p>For example, if you want to calculate the total CPU time consumption of SurfaceFlinger thread, or which threads are running in the kernel, etc., you can collaborate with domain experts to translate their experience into SQL commands. If this still doesn’t meet your needs, Perfetto also provides Python APIs to export data in nearly DataFrame format, almost achieving any data analysis effect you want.</p><p>This entire suite of developer-mineable points is quite extensive. From my team’s practical experience, it can cover function development, function testing, CI&#x2F;CD, online monitoring, and expert system aspects and more. The subsequent articles in this star series will also focus on Perfetto’s powerful features and expert systems developed based on it, helping you “one-click answer” performance bottlenecks.</p><h3 id="Practical-Application-Scenarios-1"><a href="#Practical-Application-Scenarios-1" class="headerlink" title="Practical Application Scenarios"></a>Practical Application Scenarios</h3><p>The first tool used in performance analysis should be Perfetto, and scenarios using Systrace are becoming fewer. Therefore, the tool you should primarily master should be Perfetto, learn its usage and the indicators it provides.</p><p>However, Perfetto also has some limitations. First, although it provides relatively high flexibility, it’s essentially still a static data collector, not a dynamic tracing tool. There’s still a fundamental difference from eBPF. Secondly, runtime cost is relatively high because it involves converting Ftrace data to Perfetto data on the phone. Finally, it doesn’t provide text analysis methods, can only conduct additional analysis through webpage visualization or operating SQLite. In summary, Perfetto is functionally powerful, covering almost all aspects of observable technology, but the usage barrier is also relatively high. There are quite a few knowledge points worth digging and learning. Our subsequent articles will also focus on Perfetto’s powerful features and what can be developed based on it.</p><hr><h2 id="2-3-Android-Studio-Profiler-Tools"><a href="#2-3-Android-Studio-Profiler-Tools" class="headerlink" title="2.3 Android Studio Profiler Tools"></a>2.3 Android Studio Profiler Tools</h2><p>Android’s application development integration environment (officially recommended) is Android Studio (previously Eclipse, but it’s been淘汰). It naturally also needs to integrate development and performance tuning together. Very fortunately, with the iteration and evolution of Android Studio, it now has its own performance analysis tool Android Profiler, which is a collection integrating multiple performance analysis tools into one, letting developers complete performance tuning work within Android Studio without needing to download other tools.</p><p>Currently, Android Studio Profiler has integrated 4 types of performance analysis tools: CPU, Memory, Network, Battery, of which CPU-related performance analysis tools are CPU Profiler, also the protagonist of this chapter. It integrates all CPU-related performance analysis tools together, and developers can choose which one to use based on their needs. Many people probably know that Google has already developed some independent CPU performance analysis tools, such as Perfetto, Simpleperf, Java Method Trace, etc. Now there’s another CPU Profiler, it’s obviously impossible to reinvent the wheel. CPU Profiler’s current approach is: obtain data from these known tools, then parse the data into the style you want, and display it through a unified interface.</p><h3 id="Highlighted-Features-1"><a href="#Highlighted-Features-1" class="headerlink" title="Highlighted Features"></a>Highlighted Features</h3><p>CPU Profiler integrates performance analysis tools: Perfetto, Simpleperf, Java Method Trace, naturally possessing all or some of these tools’ functions, as follows:</p><ol><li><p><strong>System Trace Recording</strong>, which uses Perfetto-captured information and can be used to analyze process function duration, scheduling, rendering, etc., but it’s a streamlined version, can only display process-related information and filters out short-duration events. It’s recommended to export Trace to file and analyze it on <a href="https://ui.perfetto.dev/">https://ui.perfetto.dev/</a>.</p></li><li><p><strong>Java Method Trace Recording</strong>, which obtains function call stack information from the virtual machine for analyzing Java function calls and duration.</p></li><li><p><strong>C&#x2F;C++ Function Trace</strong>, which uses Simpleperf-captured information. Simpleperf is a CPU performance monitoring component of the PMU hardware module obtaining data. <strong>C&#x2F;C++ Function Trace</strong> only has partial features of Simpleperf, used for analyzing C&#x2F;C++ function calls and duration.</p></li></ol><p><img src="/en/images/The-Performace-1-Performance-Tools/92246083-124c-4290-a5c4-5b57529741cb.webp" alt="CPU Profiler"></p><h3 id="Practical-Application-Scenarios-2"><a href="#Practical-Application-Scenarios-2" class="headerlink" title="Practical Application Scenarios"></a>Practical Application Scenarios</h3><p>Application performance problems are mainly divided into two categories: slow response and non-smooth.</p><ul><li>Slow response problems often include: slow application startup, slow page transitions, slow list loading, slow button response, etc.</li><li>Non-smooth problems often include: non-smooth list scrolling, non-following finger swipes, animation stuttering, etc.</li></ul><p>How should CPU Profiler be used in these scenarios? The basic approach is: first capture a System Trace, analyze with System Trace first, position the problem. If you can’t position the problem, then further analyze using Java Method Trace or C&#x2F;C++ Function Trace.</p><p>Take a very poor performance application as an example, we inserted a Systrace TracePoint at a key location in the system. If you’re not familiar with the code, how do you find the performance bottleneck? First, let’s run the application, <strong>record a System Trace through CPU Profiler</strong> (later articles will introduce tool usage methods), as follows:</p><p><img src="/en/images/The-Performace-1-Performance-Tools/359770f0-ccf4-4857-9f7d-89db47e44d0b.webp"></p><p>From the above Trace, you can know that it’s the onDrawFrame operation in the egl_core thread that’s time-consuming. If you don’t find a problem, it’s recommended to export to <a href="https://ui.perfetto.dev/">https://ui.perfetto.dev/</a> for further analysis. You can look up source code to see what onDrawFrame is. We found through searching that onDrawFrame is a Java function’s onDrawFrame, and we need to analyze Java function time consumption. <strong>we need to record a Java Method Trace</strong>, as follows:</p><p><img src="/en/images/The-Performace-1-Performance-Tools/ee7e0852-9643-46f1-86b6-23e3975c1e54.webp"></p><p>Through the above Trace, it’s easy to discover it’s a native function called Utils.onDraw that’s time-consuming. Since it involves C&#x2F;C++ code, we need to record a <strong>C&#x2F;C++ Function Trace</strong> to further analyze, as follows:</p><p><img src="/en/images/The-Performace-1-Performance-Tools/25a10f6e-4465-4ea4-addb-624203e99dfd.webp"></p><p>You can discover now that the native function’s java_com_gl_shader_Utils_onDraw executes sleep, which is the culprit causing performance low!</p><p>The biggest advantage of CPU Profiler in AS is integrating various sub-tools. In one place, you can operate everything, which is very convenient for application developers. However, it might not be that lucky for system developers.</p><hr><h2 id="2-4-Comprehensive-Comparison"><a href="#2-4-Comprehensive-Comparison" class="headerlink" title="2.4 Comprehensive Comparison"></a>2.4 Comprehensive Comparison</h2><table><thead><tr><th>Tool Name</th><th>Application Scenarios</th><th>Data Type</th><th>Acquisition Method</th><th>Analysis Method</th></tr></thead><tbody><tr><td>Systrace</td><td>Android system and app performance analysis</td><td>Trace type</td><td>Unconditional capture continuous dumping</td><td>Visualized analysis</td></tr><tr><td>Perfetto</td><td>Android system and app performance analysis</td><td>Metric type Trace type</td><td>Unconditional capture continuous dumping</td><td>Visualized analysis Database analysis</td></tr><tr><td>AS Profiler</td><td>Android system and app performance analysis</td><td>Trace type</td><td>Unconditional capture continuous dumping</td><td>Visualized analysis</td></tr><tr><td>SimplePerf</td><td>Java&#x2F;C++ function execution duration analysis PMU counters</td><td>Trace type</td><td>Unconditional capture continuous dumping</td><td>Visualized analysis Text analysis</td></tr><tr><td>Snapdragon Profiler Tools &amp; Resources</td><td>Mainly Qualcomm GPU performance analyzer</td><td>Trace type Metric type</td><td>Unconditional capture continuous dumping</td><td>Visualized analysis</td></tr><tr><td>Mali Graphics Debugger</td><td>ARM GPU analyzer (MediaTek, Kirin chips)</td><td>Trace type Metric type</td><td>Unconditional capture continuous dumping</td><td>Visualized analysis</td></tr><tr><td>Android Log&#x2F;dumpsys</td><td>Comprehensive analysis</td><td>Log type</td><td>Conditional capture Continuous capture without dumping</td><td>Text analysis</td></tr><tr><td>AGI(Android GPU Inspector)</td><td>Android GPU analyzer</td><td>Trace type Metric type</td><td>Unconditional capture continuous dumping</td><td>Visualized analysis</td></tr><tr><td>eBPF</td><td>Linux kernel behavior dynamic tracking</td><td>Metric type</td><td>Dynamic tracing with conditional capture continuous capture without dumping</td><td>Text analysis</td></tr><tr><td>Ftrace</td><td>Linux kernel instrumentation</td><td>Log type</td><td>Static code with conditional capture continuous capture without dumping</td><td>Text analysis</td></tr></tbody></table><hr><h1 id="3-About-“Techniques-Methods-and-Tools”"><a href="#3-About-“Techniques-Methods-and-Tools”" class="headerlink" title="3 About “Techniques, Methods, and Tools”"></a>3 About “Techniques, Methods, and Tools”</h1><hr><p>Technical changes and improvements are more embodied at the “Tool” level. The development trajectory of Linux communities and Google’s tools development direction is moving toward improving tool integration, making it convenient to find needed information in one place, or toward obtaining more information. In summary, their development trajectory is traceable and development patterns can be summarized. We need to accurately recognize their capabilities and application scenarios during rapid tool iteration. Their purpose is to improve problem-solving efficiency, not to spend time learning new tools.</p><p>The “Methods” level depends on specific business knowledge. Knowing how a frame is rendered, how CPU chooses process scheduling, how IO is dispatched, etc. Only by understanding business knowledge can you correctly choose tools and correctly interpret information provided by tools. As experience enriches, sometimes you don’t even need to see detailed information provided by tools, and you can find clues. This is a kind of ability that forms complex associative information in your brain after your business knowledge becomes rich to a certain extent. Then you navigate above tools—a capability formed when your business knowledge is rich to a certain level.</p><p>The “Tao” (Way) level considers what problem to solve, what’s the essence of the problem? What degree to achieve and what cost to invest to achieve what effect. To solve a problem, what path has the highest “input-output ratio”? What’s the overall strategy? To complete one thing, what do you do first, what do you do next, and what’s the dependency logic between front and back?</p><p>In subsequent articles, we will explain a technique, a feature according to the “Techniques, Methods, and Tools” approach. We don’t just want you to learn a knowledge point, but more want to spark your ability to think comprehensively by three aspects. When encountering similar tools or similar problems, even if they’re completely different systems, you can cope calmly. Firmly grasp the essence, evaluate the “input-output ratio” to choose appropriate tools or information, efficiently solve problems.</p><hr><h1 id="4-About-“The-Performance-Knowledge-Planet”"><a href="#4-About-“The-Performance-Knowledge-Planet”" class="headerlink" title="4 About “The Performance Knowledge Planet”"></a>4 About “The Performance Knowledge Planet”</h1><hr><p>To better communicate and output high-quality articles, we created a knowledge planet named “The Performance”, mainly maintained by three first-tier developers from domestic phone manufacturers in the performance optimization field, with many years of work experience in performance-related domains. It provides Android performance-related one-stop knowledge services, covering basics, methodology, tool usage, and most valuable case analyses.</p><p>Currently, the planet’s content planning is as follows (## between different sections are tags, and related topics will all have corresponding tags, making it convenient for everyone to click interested tags to view corresponding knowledge)</p><ul><li><p><strong>#ThePerformance#</strong> — You can read ahead the electronic book “Android Performance Optimization - Systematic Course” which will be releasing written chapters every week. “Android Performance Optimization - Systematic Course” is an Android performance optimization electronic book we’re planning. Currently, there are quite a few high-quality performance optimization theoretical knowledge articles and practice articles and open source libraries in the developer community, but currently there’s a lack of a complete, systematic book covering performance optimization principles, tools, and practices, oriented toward beginner and intermediate developers, app developers and system developers, and continuously updated. The book’s outline (tentative) is basically ready, and it’s expected to take about a year to complete. In the planet, written chapters will be released, letting everyone see them in advance.</p></li><li><p>Part 1: → <strong>Performance Engineering</strong></p></li><li><p>Part 2: → <strong>Analyzing Android Interaction and Core Systems from a Performance Perspective</strong></p></li><li><p>Part 3: → <strong>Analyzing Linux Kernel Core Subsystem Design and Implementation</strong></p></li><li><p>Part 4: → <strong>Problem Scenario Analysis Approach</strong></p></li><li><p>Part 5: → <strong>Analysis and Debugging Tools</strong></p></li><li><p>Part 6: → <strong>Quality Guardianship — Performance Monitoring Methods and Tools</strong></p></li><li><p><strong>#PerformanceTools#</strong> — Sharing performance analysis tools used in Android development and their usage methods, also providing 1v1 video guidance for Systrace, Perfetto, and other performance tools. Tool usage is better demonstrated through video—it’s more intuitive. Articles are static and many places are hard to explain clearly. 1v1 video conference guidance is also a learning method.</p></li><li><p><strong>#CaseAnalysis#</strong> — Classic case analysis approach summaries, planet friend-provided case analyses and discussions. Case analysis is a very important learning approach. Reading many actual performance cases is very helpful for your own analysis and performance problem solving later. At the same time, everyone is welcome to provide cases and solutions. If you’re worried about leaking information, we’ll mask key information.</p></li><li><p><strong>#ClassicReinterpretation#</strong> — Classic solutions, course re-readings. For example, in-depth analysis of third-party library analysis, Android expert masterclass re-readings, etc. We can conduct in-depth analysis of solutions, lateral comparisons, etc.; for Android expert masterclass re-readings and leak fixing.</p></li><li><p><strong>#KnowledgeShare#</strong> — Excellent articles, blogs, tool sharing. There are many excellent blogs in the industry, source solutions that have stood actual business tests, various performance tools, etc. We’ll look for these excellent contents and share them with everyone.</p></li><li><p><strong>#KnowledgeDeposition#</strong> — WeChat group chat精华, WeChat Q&amp;A, blog comment answers, etc.</p></li><li><p><strong>#PerformanceInterview#</strong> — Collection and answers to Android performance-related interview questions. It’s considered a necessity, right?</p></li><li><p><strong>#ProgrammingLanguage#</strong> — Programming language usage technique sharing.</p></li><li><p><strong>#EfficiencyImprovement#</strong> — Efficiency improvement sharing, including developer efficiency, work efficiency improvement methods, engineering efficiency, tool recommendations, etc. Not misusing a sword to chop firewood.</p></li><li><p><strong>#IndustryDynamics#</strong> — First-time interpretation reports of new performance-related technologies, including but not limited to the following content:</p><ul><li>Industry summits, academic summit new concept interpretation reports</li><li>Papers, industry, books, video introductions</li><li>Android large version performance-related content introduction</li><li>Android new hardware performance-related content introduction</li><li>Android performance-related open source project interpretations</li></ul></li><li><p><strong>#BigNameSharing#</strong> — Monthly invitations to industry experts for experience sharing, case analyses</p></li></ul><p><img src="/en/images/The-Performace-1-Performance-Tools/image-2022080234016600.webp" alt="TeamWork - Paid Knowledge Planet"></p><p><strong>Note:</strong> <strong>iOS phone users should not directly pay in the planet. Long-press the image in WeChat interface to join via QR code scan. Otherwise, Apple will charge expensive subscription fees.</strong></p><hr><h1 id="5-Appendix"><a href="#5-Appendix" class="headerlink" title="5 Appendix"></a>5 Appendix</h1><ul><li><p><strong>Perfetto Project Address</strong></p><ul><li>Official usage documentation: <a href="https://perfetto.dev/docs/">https://perfetto.dev/docs/</a></li><li>Github code library: <a href="https://github.com/google/perfetto">https://github.com/google/perfetto</a>, where you can report bugs or feature requests, and of course can submit PR contributions to contribute your strength.</li></ul></li><li><p><strong>Android GPU Inspector</strong></p><ul><li>Official usage documentation: <a href="https://developer.android.com/agi">https://developer.android.com/agi</a></li></ul></li><li><p><strong>Other Major Manufacturers’ Performance Analysis Tools</strong></p><ul><li><a href="https://docs.microsoft.com/en-us/windows-hardware/test/wpt/">Windows Performance Toolkit</a></li></ul></li></ul><hr><h1 id="About-Me-amp-amp-Blog"><a href="#About-Me-amp-amp-Blog" class="headerlink" title="About Me &amp;&amp; Blog"></a>About Me &amp;&amp; Blog</h1><p>Below is a personal introduction and related links. I look forward to communicating with colleagues in the same field. When three walk together, there must be my teacher!</p><ol><li><a href="https://www.androidperformance.com/about/">Blogger Personal Introduction</a>: Inside are personal WeChat and WeChat group links.</li><li><a href="https://androidperformance.com/2019/12/01/BlogMap/">Blog Content Navigation</a>: A navigation of personal blog content.</li><li><a href="https://androidperformance.com/2018/05/07/Android-performance-optimization-skills-and-tools/">Personally Organized and Collected Excellent Blog Articles - Essential Skills and Tools for Android Performance Optimization</a>: Everyone is welcome to self-recommend and recommend (private WeChat chat is fine).</li><li><a href="https://www.androidperformance.com/2023/12/30/the-performance/">Android Performance Optimization Knowledge Planet</a>: Welcome to join, thank you for your support~</li></ol><hr><blockquote><p><strong>“An individual can move faster, a group can go further.”</strong></p></blockquote><p><img src="/en/images/WechatIMG581.webp" alt="Wechat QR"></p>]]></content>
    
    
    <summary type="html">&lt;p&gt;&lt;img src=&quot;/en/images/The-Performace-1-Performance-Tools/cc4162d9-7c2b-43b1-b9a1-f14d5c8e8605.jpg&quot; alt=&quot;Hackers and Painters&quot;&gt;&lt;/p&gt;
&lt;blockquote&gt;
&lt;p&gt;In his book &lt;Hackers and Painters&gt;, Paul Graham states: “The execution efficiency gap between different programming languages is becoming increasingly large, so profilers are becoming more important. Currently, performance profiling is not receiving enough attention. Many people still believe that the key to improving program running speed is developing compilers that can generate faster code. The gap between code efficiency and machine performance is continuously increasing, and we will increasingly clearly see that the key to improving application software running speed is having a good performance profiler to guide program development.”&lt;/p&gt;
&lt;/blockquote&gt;
&lt;blockquote&gt;
&lt;p&gt;By Paul Graham — Hackers and Painters&lt;/p&gt;
&lt;/blockquote&gt;
&lt;p&gt;If you Google search “Android optimization tools,” you’ll find many related contents. Their problem is that content is highly repetitive, or they directly explain usage methods. They rarely introduce overall architecture, which can easily make you form the erroneous cognition of “one tool handles everything.” Based on my team’s years of experience, in the performance profiling field, such a silver bullet-level tool does not exist. Tools are evolving, old problems will appear in new forms. If you don’t master the core logic, you’ll always float on the surface of technology.&lt;/p&gt;
&lt;p&gt;This article will systematically organize observable technologies in performance profiling, covering three parts of content: data types, capture methods, and analysis methods. After that, we’ll introduce Google’s traditional “Big Three” analysis tools. The goal is to let you understand immutable theoretical knowledge and corresponding tools available in the Android environment, so you can take fewer detours and directly reuse predecessors’ experience.&lt;/p&gt;</summary>


    <category term="Android" scheme="https://androidperformance.com/en/categories/Android/"/>
    
    
    <category term="Android" scheme="https://androidperformance.com/en/tags/Android/"/>
    
    <category term="Startup" scheme="https://androidperformance.com/en/tags/Startup/"/>
    
    <category term="Framework" scheme="https://androidperformance.com/en/tags/Framework/"/>
    
  </entry>
  
  <entry>
    <title>Techniques, Philosophy, and Tools for Android Performance Optimization</title>
    <link href="https://androidperformance.com/en/2022/01/07/Techniques-Philosophy-and-Tools-for-Android-Performance-Optimization/"/>
    <id>https://androidperformance.com/en/2022/01/07/Techniques-Philosophy-and-Tools-for-Android-Performance-Optimization/</id>
    <published>2022-01-06T16:42:03.000Z</published>
    <updated>2026-05-10T23:29:51.063Z</updated>
    
    <content type="html"><![CDATA[<p><img src="/en/images/Techniques-Philosophy-and-Tools-for-Android-Performance-Optimization/cc4162d9-7c2b-43b1-b9a1-f14d5c8e8605.jpg" alt="Hackers &amp; Painters"></p><blockquote><p>In his book <em>Hackers &amp; Painters</em>, Paul Graham asserted, “The disparity in the efficiency of languages is becoming more pronounced, hence the rising importance of profilers. Currently, performance analysis isn’t given the attention it deserves. Many still seem to hold onto the belief that the key to accelerating program execution lies in developing compilers that generate faster code. As the gap between code efficiency and machine performance widens, it will become increasingly apparent that enhancing the execution speed of application software hinges on having a good profiler to guide program development.” by Paul Graham, Hackers &amp; Painters</p></blockquote><p>A Google search for “Android optimization tools” yields an abundance of related content. The issue with these results is that they either contain highly repetitive content or directly explain usage methods. Rarely do they introduce a holistic architecture, inadvertently instilling a misguided belief of “one tool fixes all”. Drawing from the extensive experience of my team, I can assert that in the realm of performance analysis, no such magic bullet tool exists. Tools evolve, old problems re-emerge in new forms, and without mastering core logic, one remains on the technological surface.</p><p>This article first systematically untangles the observability technology in performance analysis, encompassing data types, capture methods, and analysis techniques. Subsequently, we introduce the “big three” analysis tools provided by Google. The aim is to impart immutable theoretical knowledge and corresponding tools available in the Android environment to the reader. This wealth of information can facilitate a more direct application of predecessors’ experiences, circumventing unnecessary detours.</p><span id="more"></span><p>If this article is read with today’s Android tooling, the “big three” should be expanded into a repeatable-measurement and field-monitoring workflow. Systrace maps to Perfetto&#x2F;System Trace and <code>trace_processor</code>; TraceView maps to Android Studio CPU Profiler, sampled call stacks, and custom trace sections; MAT maps to Android Studio Memory Profiler, LeakCanary, <code>dumpsys meminfo</code>, and Perfetto&#x2F;native heap depending on whether the problem is Java heap, leak detection, process memory, or native&#x2F;system memory. Startup and jank comparisons should be encoded with Macrobenchmark metrics, while production impact should be checked through Android Vitals or an APM system.</p><p>It’s crucial to note that there are certainly more than these three tools available for performance optimization. However, these three are our “go-to first-hand tools”. Prior to delving into further analysis, you’ll find yourself dependent on these three tools for bottleneck identification. Subsequent analyses, tailored to distinct domain characteristics, should then leverage corresponding tools.</p><h1 id="1-Observability-Techniques-in-Performance-Analysis"><a href="#1-Observability-Techniques-in-Performance-Analysis" class="headerlink" title="1 Observability Techniques in Performance Analysis"></a>1 Observability Techniques in Performance Analysis</h1><ul><li>Has this operation been executed? How long did it take?</li><li>Why is there a significant difference between two versions?</li><li>What operations is the system executing when CPU usage is high?</li><li>Why has the startup speed slowed down?</li><li>Why does this page always stutter when scrolling?</li></ul><p>You’ve likely been asked similar questions by colleagues or bosses more than once. The most primitive idea might be to obtain the relevant logs and analyze them one by one. Based on past experience, one would search for clues by looking for keywords. If the desired information is not available, the next step is to add logs and attempt to reproduce the issue locally. This approach is not only time-consuming and laborious, but also wastes developmental resources. Have you ever wondered if there is a more efficient method in the industry? A method that can improve efficiency by an order of magnitude, allowing us to spend our time solving problems instead of on mundane, repetitive physical tasks?</p><p>Of course, there is (otherwise this article wouldn’t exist)—we refer to it as observability techniques.</p><p>As the computer industry has evolved, pioneers in computing have devised a category known as “observability techniques.” It involves utilizing tools to observe the intricate details of complex systems’ operations—the more detailed, the better. Mobile operating systems evolved from embedded systems. Nowadays, the computing power of mid-to-high-end Android phones can catch up with a mainframe from two decades ago, and the resulting software complexity is also immense.</p><p>Employing a well-designed and smoothly operating observability technique can significantly accelerate software development efficiency. This is because, despite using a variety of preemptive static code detection and manual code reviews, it is impossible to block software issues 100%. Problems only become apparent after the software is run in a real environment, which might be an automated test case of yours. Even then, you still need to sift through your logs and re-read code to identify the problem. For these reasons, every engineering team needs a fully functional observability tool as one of their fundamental infrastructures.</p><p>Observability is a systematic engineering effort that allows you to delve deeper into occurrences within the software. It can be used to understand the internal operational processes of software systems (especially complex business logic or interactive systems), troubleshoot, and even optimize the program by identifying bottlenecks. For complex systems, understanding the entire operational process through code reading can be challenging. A more efficient approach is to utilize observability tools to obtain the software’s operational status most intuitively.</p><p>We will explore data types, data acquisition methods, and analysis methods to help you understand observability techniques in the sections below.</p><h2 id="1-1-Data-Types"><a href="#1-1-Data-Types" class="headerlink" title="1.1 Data Types"></a>1.1 Data Types</h2><p>Logs can be in the form of key-value pairs, JSON, CSV, relational databases, or any other formats. We recreate the entire state of the system at the time it was running through logs to solve a specific issue, observe the operation of a module, or even depict the behavioral patterns of system users. In observability technology, log types are classified into Log, Metric, and Trace types.</p><h3 id="Log-Type"><a href="#Log-Type" class="headerlink" title="Log Type"></a>Log Type</h3><p>Logs are the most rudimentary form of data recording, typically noting what happened at what time in which module, whether the log level is a warning or an error. Nearly all systems, whether embedded devices or computers in cars, utilize this form of log. It is the simplest, most direct, and easiest to implement. Almost all Log types are stored as strings, presenting data in lines of text. Logs are the most basic type, and through conversion, can be turned into Metric or Trace types, though the conversion process can become a bottleneck when dealing with massive amounts of data.</p><p>Different log types are usually distinguished by error, warning, and debug levels. Naturally, error logs are your primary concern. However, in practice, this classification is not always strict, as many engineers do not differentiate between them, possibly due to a lack of classification analysis for different log levels in their engineering development environment. In summary, you can grade Log types according to your objectives. It acts like an index, enhancing the efficiency of problem analysis and target information location.</p><h3 id="Metric-Type"><a href="#Metric-Type" class="headerlink" title="Metric Type"></a>Metric Type</h3><p>Metric types are more focused compared to Log types, recording numerical changes in a particular dimension. Key points are the “dimension” and “numerical change.” Dimensions could be CPU usage, CPU Cluster operation frequency, or context switch counts. Numerical changes can be instant values at the time of sampling (snapshot type), the difference from the previous sampling, or aggregated statistical values over a period. Statistics are often used in practice, such as when wanting to observe the average CPU usage five minutes before an issue occurred. In this case, an arithmetic mean or weighted average calculation of all values within these five minutes is required.</p><p>Aggregation is a useful tool because it’s not possible for a person to analyze all Metric values individually. Determining the existence of a problem through aggregation before conducting detailed analysis is a more economical and efficient method.</p><p>Another benefit of the Metric type is its fixed content format, allowing data storage through pre-encoding, utilizing space more compactly and occupying less disk space. The most straightforward application is data format storage; Metric types, using integers or floating numbers of fixed byte data, are more space-efficient than Log types, which generally use ASCII encoding.</p><p>In addition to specific values, enumeration values can also be stored (to some extent, their essence is numerical). Different enumeration values represent different meanings, possibly indicating on and off statuses, or different event types.</p><h3 id="Trace-Type"><a href="#Trace-Type" class="headerlink" title="Trace Type"></a>Trace Type</h3><p>Trace types indicate the time, name, and duration of an event. Relationships among multiple events identify parent-child or sibling connections. Trace types are the most convenient data analysis method when dissecting complex call relationships across multiple threads.</p><p>Trace types are particularly suitable for Android application and system-level analysis scenarios because they can diagnose:</p><ol><li>Function call chains</li><li>Binder call chains during invocation</li><li>Cross-process event stream tracing</li></ol><p>In the design of Android’s application running environment, an application can’t perform all functionalities independently; it requires extensive interaction with the SystemServer. Communication with the SystemServer is facilitated through Binder, a communication method detailed later in this article. For now, understand that it involves cross-process calling. Accurate restoration of call relationships requires data from both ends, making Trace the optimal information recording method.</p><p>You can manually add starting and ending points for Trace types and insert multiple intervals within a function. With pre-compilation technology or language features, Trace intervals can automatically be instrumented at the beginning and end of functions. In an ideal scenario, the latter is the best approach as it allows for understanding what functions are running in the system, their execution conditions, and call relationships. This information can identify the most frequently called (hottest) functions and the most time-consuming ones. Understandably, this method incurs a significant performance loss due to the frequency and magnitude of function calls, especially in complex systems.</p><p>An alternative approach involves approximating the above effect by sampling call stacks. Shorter sampling intervals more closely approximate real call relationships and durations, but they can’t be too short, as obtaining stack operations itself becomes a load due to increased frequency. This method, known as a Profiler in the industry, is the basis for most programming language Profiler tools.</p><h2 id="1-2-Data-Acquisition-Methods"><a href="#1-2-Data-Acquisition-Methods" class="headerlink" title="1.2 Data Acquisition Methods"></a>1.2 Data Acquisition Methods</h2><h3 id="Static-Code-and-Dynamic-Tracing"><a href="#Static-Code-and-Dynamic-Tracing" class="headerlink" title="Static Code and Dynamic Tracing"></a>Static Code and Dynamic Tracing</h3><p>Static code collection is the most primitive method. It’s straightforward to implement but requires recompiling and reinstalling the program each time new content is added. If the information you need to diagnose a problem isn’t available, you have no choice but to repeat the entire process. A more advanced approach is to pre-install data collection points at all potential areas of interest, and use dynamic switches to control their output. This technique balances performance impacts and allows dynamic enabling of logs as needed, albeit at a high cost.</p><p>Dynamic tracing technology has always been available but is often considered the “holy grail” in the debugging and tracing field due to its steep learning curve. It demands a deep understanding of low-level technologies, especially in areas like compilation, ELF format, the kernel, and programming languages associated with pre-set probes and dynamic tracing. Indeed, dynamic tracing even has its own set of programming languages to cater to the dynamic implementation needs of developers. This approach balances performance and flexibility and enables dynamic retrieval of desired information even in live versions.</p><p>In Android application development and system-level development, dynamic tracing is rarely used and is occasionally employed in kernel development. Typically, only specialized performance analysts might utilize these tools. Two critical elements of dynamic tracing are probes and dynamic languages. The program’s execution permission must be handed over to the dynamic tracing framework at specific probe points during runtime. The logic executed by the framework is written by developers using dynamic languages.</p><p>Therefore, your program must first have probes. Linux kernel and other frameworks have embedded corresponding probe points, but Android application layers lack these. Currently, dynamic frameworks like eBPF on Android are mainly used by kernel developers.</p><h3 id="Unconditional-and-Conditional-Capture"><a href="#Unconditional-and-Conditional-Capture" class="headerlink" title="Unconditional and Conditional Capture"></a>Unconditional and Conditional Capture</h3><p>Unconditional capture is straightforward: data is continuously captured after triggering, regardless of any conditions. The drawback is that when the observed object generates a large volume of data, it could significantly impact the system. In such cases, reducing the volume of data captured can mitigate the impact, striking a balance between meeting requirements and minimizing performance loss.</p><p>Conditional capture is often employed in scenarios where anomalies can be identified. For instance, capturing logs is triggered when a specific observed value exceeds a pre-set threshold and continues for a certain duration or until another threshold is reached. This method is a slight improvement over unconditional capture as it only impacts the system when an issue arises, leaving it unaffected at other times. However, it requires the capability to identify anomalies, and those anomalies should not necessitate historical data preceding the occurrence. Lowering the threshold can increase the probability of triggering data capture, leading to the same issues faced with unconditional capture, and requiring a balance of performance loss.</p><h3 id="Disk-Write-Strategy"><a href="#Disk-Write-Strategy" class="headerlink" title="Disk Write Strategy"></a>Disk Write Strategy</h3><p>Continuous disk writing involves storing all data captured during the entire data capture process, which can strain storage resources. If the trigger point, such as an anomaly, can be identified, selective disk writing becomes an option. To ensure the validity of historical data, logs are temporarily stored in a RingBuffer and only written to disk upon receiving a disk write command. This method balances performance and storage pressure but at the cost of runtime memory consumption and the accuracy of the trigger.</p><h2 id="1-3-Analysis-Methods"><a href="#1-3-Analysis-Methods" class="headerlink" title="1.3 Analysis Methods"></a>1.3 Analysis Methods</h2><h3 id="Data-Visualization-Analysis"><a href="#Data-Visualization-Analysis" class="headerlink" title="Data Visualization Analysis"></a>Data Visualization Analysis</h3><p>As the complexity of problem analysis increases, especially with the need to address performance issues arising from the interactions among multiple modules, data visualization analysis methods have emerged. These methods visualize events on respective lanes with time as the horizontal axis, facilitating a clear understanding of when specific events occur and their interactions with other systems. In Android, tools like Systrace&#x2F;Perfetto and, earlier, KernelShark, are fundamentally of this type. The “Trace Type” mentioned in “Data Types” often employs this kind of visualization.</p><p>Systrace’s visualization framework is built on a Chrome subproject called Catapult. The <a href="https://docs.google.com/document/d/1CvAClvFfyA5R-PhYUmn5OOQtYMH4h6I0nSsKchNAySU/preview">Trace Event Format</a> outlines the data formats supported by Catapult. If you have Trace type data, you can use this framework for data visualization. AOSP build systems and the Android app compilation process also output corresponding Trace files, with visualization effects based on Catapult.</p><h3 id="Database-Analysis"><a href="#Database-Analysis" class="headerlink" title="Database Analysis"></a>Database Analysis</h3><p>For extensive data analysis, formatting data and converting it into two-dimensional data tables enables efficient query operations using SQL. In the server domain, technology stacks like <a href="https://www.elastic.co/cn/what-is/elk-stack">ELK</a> offer flexible formatted search and statistical functions. With databases and Python, you can even create an automated data diagnostic toolchain.</p><p>From the discussion above, it’s evident that text analysis and database analysis serve different analytical purposes. Text analysis is sufficient for evaluating the time consumption of a single module, visualization tools are needed for interactions among multiple systems, and SQL tools are required for complex database analysis. Regardless of the analysis method, the core is data analysis. In practice, we often convert data using other tools to support different analysis methods, such as transitioning from text analysis to database analysis.</p><p>Choosing the right analysis method according to your objectives can make your work highly efficient.</p><p>For Android developers, Google provides several essential performance analysis tools to assist both system and app developers in optimizing their programs.</p><h1 id="2-Google’s-Android-Performance-Analysis-Tools"><a href="#2-Google’s-Android-Performance-Analysis-Tools" class="headerlink" title="2 Google’s Android Performance Analysis Tools"></a>2 Google’s Android Performance Analysis Tools</h1><p>Based on practical experience, the most commonly used tools are Systrace, Perfetto, and the Profiler tool in Android Studio. Only after identifying the main bottlenecks using these tools would you need to resort to other domain-specific tools. Therefore, we will focus on the application scenarios, advantages, and basic usage of these three tools. For a horizontal comparison between the tools, please refer to the content in the next chapter, “Comprehensive Comparison.”</p><h2 id="2-1-First-Generation-System-Performance-Analysis-Tool-Systrace"><a href="#2-1-First-Generation-System-Performance-Analysis-Tool-Systrace" class="headerlink" title="2.1 First Generation System Performance Analysis Tool - Systrace"></a>2.1 First Generation System Performance Analysis Tool - Systrace</h2><p>Systrace is a visualization analysis tool for the Trace type and represents the first generation of system-level performance analysis tools. It supports all the features facilitated by the Trace type. Before the emergence of Perfetto, Systrace was essentially the only performance analysis tool available. It presents the operating information of both the Android system and apps graphically. Compared to logs, Systrace’s graphical representation is more intuitive; and compared to TraceView, the performance overhead of capturing Systrace can be virtually ignored, minimizing the impact of the observer effect to the greatest extent.</p><p><img src="/en/images/Techniques-Philosophy-and-Tools-for-Android-Performance-Optimization/8ea0e7de-1f32-471f-929a-5a37d73e3270.webp" alt="Systrace"></p><h3 id="Systrace-Design-Philosophy"><a href="#Systrace-Design-Philosophy" class="headerlink" title="Systrace Design Philosophy"></a><strong>Systrace Design Philosophy</strong></h3><p>Systrace embeds information similar to logs, known as TracePoints (essentially Ftrace information), at <strong>key system operations</strong> (such as Touch operations, Power button actions, sliding operations, etc.), <strong>system mechanisms</strong> (including input distribution, View drawing, inter-process communication, process management mechanisms, etc.), and <strong>software and hardware information</strong> (covering CPU frequency information, CPU scheduling information, disk information, memory information, etc.). These TracePoints depict the execution time of core operation processes and the values of certain variables. The Android system collects these TracePoints scattered across various processes and writes them into a file. After exporting this file, Systrace analyzes the information from these TracePoints to obtain the system’s operational information over a specific period.</p><p><img src="/en/images/Techniques-Philosophy-and-Tools-for-Android-Performance-Optimization/56bebe5b-e5fd-4b69-8e36-3197fe205034.webp"></p><p>In the Android system, some essential modules have default inserted TracePoints, classified by TraceTag, with information sources as follows:</p><ol><li>TracePoints in the Framework Java layer are implemented through the <code>android.os.Trace</code> class.</li><li>TracePoints in the Framework Native layer are executed using the ATrace macro.</li><li>App developers can customize Trace through the <code>android.os.Trace</code> class.</li></ol><p>Consequently, Systrace can collect and display all information from both upper and lower layers of Android. For Android developers, Systrace’s most significant benefit is turning the entire Android system’s operational status from a black box into a white box. Its global nature and visualization make Systrace the first choice for Android developers when analyzing complex performance issues.</p><h3 id="Practical-Applications"><a href="#Practical-Applications" class="headerlink" title="Practical Applications"></a>Practical Applications</h3><p>The parsed Systrace, rich in system information, is naturally suited for analyzing the performance issues of both Android Apps and the Android system. Android app developers, system developers, and kernel developers can all use Systrace to diagnose performance problems.</p><ol><li><p><strong>From a Technical Perspective:</strong><br>Systrace can cover major categories involved in performance, such as <strong>response speed</strong>, <strong>frame drops or janks</strong>, and <strong>ANR (Application Not Responding)</strong> issues.</p></li><li><p><strong>From a User Perspective:</strong><br>Systrace can analyze various performance issues encountered by users, including but not limited to:</p><ul><li><strong>Application Launch Speed Issues:</strong> Including cold start, warm start, and hot start.</li><li><strong>Slow Interface Transitions:</strong> Including slow transitions and janky animations.</li><li><strong>Slow Non-Transition Click Operations:</strong> Such as toggles, pop-ups, long presses, selections, etc.</li><li><strong>Slow Screen Brightness Adjustment Speed:</strong> Including slow on&#x2F;off speed, slow unlocking, slow face recognition, etc.</li><li><strong>List Scrolling Jankiness:</strong></li><li><strong>Window Animation Lag:</strong></li><li><strong>Interface Loading Jankiness:</strong></li><li><strong>Overall System Lag:</strong></li><li><strong>App Unresponsiveness:</strong> Including freeze and crash issues.</li></ul></li></ol><p>When encountering the above problems, various methods can be employed to capture Systrace. The parsed file can then be opened in Chrome for analysis.</p><p>The ability to trace and visualize these issues makes Systrace an invaluable tool for developers aiming to optimize the performance of Android applications and the system itself. By analyzing the data collected, developers can identify bottlenecks and problematic areas, formulate solutions, and effectively improve the performance and responsiveness of apps and the Android operating system.</p><h2 id="2-2-The-Next-Generation-Performance-Analysis-Full-Stack-Tool-Perfetto"><a href="#2-2-The-Next-Generation-Performance-Analysis-Full-Stack-Tool-Perfetto" class="headerlink" title="2.2 The Next-Generation Performance Analysis Full Stack Tool - Perfetto"></a>2.2 The Next-Generation Performance Analysis Full Stack Tool - Perfetto</h2><p>Google initiated the first submission in 2017, and over the next four years (up until Dec 2021), over 100 developers made close to 37,000 commits. There are PRs and merges almost daily, marking it as an exceptionally active project. Besides its powerful features, its ambition is significant. The official website claims it to be the next-generation cross-platform tool for Trace&#x2F;Metric data capture and analysis. Its application is also quite extensive; apart from the Perfetto website, <a href="https://devblogs.microsoft.com/performance-diagnostics/new-tools-for-analyzing-android-linux-and-chromium-browser-performance/">Windows Performance Tool</a>, <a href="https://developer.android.com/studio">Android Studio</a>, and Huawei’s <a href="https://developer.huawei.com/consumer/cn/doc/development/Tools-Guides/overview-0000001050741459">GraphicProfiler</a> also support the visualization and analysis of Perfetto data. We believe Google will continue investing resources in the Perfetto project. It is poised to be the next-generation performance analysis tool, wholly replacing Systrace.</p><h3 id="Highlighted-Features"><a href="#Highlighted-Features" class="headerlink" title="Highlighted Features"></a>Highlighted Features</h3><p>The most significant improvement of Perfetto over Systrace is its ability to support long-duration data capture. This is made possible by a service that runs in the background, enabling the encoding of collected data using Protobuf and saving it to disk. From the perspective of data sourcing, the core principle is consistent with Systrace, both based on the Linux kernel’s Ftrace mechanism for recording key events in both user and kernel spaces (ATRACE, CPU scheduling). Perfetto supports all functionalities provided by Systrace, hence the anticipation of Systrace being replaced by Perfetto entirely.</p><p><img src="/en/images/Techniques-Philosophy-and-Tools-for-Android-Performance-Optimization/fc328f61-6e2a-4695-b712-c42a7e9ab02b.webp" alt="Perfetto"></p><p>Perfetto’s support for data types, acquisition methods, and analysis approaches is unprecedentedly comprehensive. It supports virtually all types and methods. ATRACE enables the support for Trace type, a customizable node reading mechanism supports Metric type, and in UserDebug versions, Log type support is realized by obtaining Logd data.</p><p>You can manually trigger capture and termination via the Perfetto.dev webpage or command-line tools, initiate long-duration capture via the developer options in the settings, or dynamically start data capture via the Perfetto Trigger API integrated within the framework. This covers all scenarios one might encounter in a project.</p><p>In terms of data analysis, Perfetto offers a data visualization analysis webpage similar to Systrace, but with an entirely different underlying implementation. The biggest advantage is its ability to render ultra-large files, a feat Systrace cannot achieve (it might crash or become extremely laggy with files over 300M). On this visualization webpage, one can view various processed data, execute SQL query commands, and even view logcat content. Perfetto Trace files can be converted into SQLite-based database files, enabling on-the-spot SQL execution or running pre-written SQL scripts. You can even import it into data science tool stacks like Jupyter to share your analysis strategies with colleagues.</p><p>For example, if you want to calculate the total CPU consumption of the SurfaceFlinger thread, or identify which threads are running on large cores, etc., you can collaborate with domain experts to translate their experiences into SQL commands. If that still does not meet your requirements, Perfetto also offers a Python API, converting data into DataFrame format, enabling virtually any desired data analysis effect.</p><p>With all these offerings, developers have abundant aspects to explore. From our team’s practical experience, it can almost cover every aspect from feature development, function testing, CI&#x2F;CD, to online monitoring and expert systems. In the subsequent series of articles on our planet, we will focus on Perfetto’s powerful features and the expert systems developed based on it, aiding you in pinpointing performance bottlenecks with a single click.</p><h3 id="Practical-Application"><a href="#Practical-Application" class="headerlink" title="Practical Application"></a>Practical Application</h3><p>Perfetto has become the primary tool used in performance analysis, with Systrace’s usage dwindling. Hence, the tool you should master first is Perfetto, learning its usage and the metrics it provides.</p><p>However, Perfetto has its boundaries. Although it offers high flexibility, it essentially remains a static data collector and not a dynamic tracing tool, fundamentally different from eBPF. The runtime cost is relatively high because it involves converting Ftrace data to Perfetto data on the mobile device. Lastly, it doesn’t offer text analysis methods; additional analyses can only be performed via webpage visualization or operating SQLite. In summary, Perfetto is powerful, covering almost every aspect of observability technology, but also has a relatively high learning curve. The knowledge points worth exploring and learning are plentiful, and we will focus on this part in our upcoming articles.</p><h2 id="2-3-Android-Studio-Profiler-Tool"><a href="#2-3-Android-Studio-Profiler-Tool" class="headerlink" title="2.3 Android Studio Profiler Tool"></a>2.3 Android Studio Profiler Tool</h2><p>The integrated development environment for Android application development (officially recommended) is Android Studio (previously it was Eclipse, but that has been phased out). It naturally needs to integrate development and performance optimization. Fortunately, with the iterations and evolution of Android Studio, it now has its own performance analysis tool, Android Profiler. This is a collective tool integrating several performance analysis utilities, allowing developers to optimize performance without downloading additional tools while developing applications in Android Studio.</p><p>Currently, Android Studio Profiler has integrated four types of performance analysis tools: CPU, Memory, Network, and Battery. The CPU-related performance analysis tool is the CPU Profiler, the star of this chapter. It integrates all CPU-related performance analysis tools, allowing developers to choose based on their needs. Many people might know that Google has developed some independent CPU performance analysis tools, like Perfetto, Simpleperf, and Java Method Trace. CPU Profiler does not reinvent the wheel; it gathers data from these known tools and parses it into a desired style, presenting it through a unified interface.</p><h3 id="Highlighted-Features-1"><a href="#Highlighted-Features-1" class="headerlink" title="Highlighted Features"></a><strong>Highlighted Features</strong></h3><p>CPU Profiler integrates performance analysis tools: Perfetto, Simpleperf, and Java Method Trace. It naturally possesses all or part of the functionalities of these tools, such as:</p><ol><li><strong>System Trace Recording</strong>: Information captured with Perfetto, useful for analyzing process function duration, scheduling, rendering, etc. However, it’s a simplified version, only displaying process-strongly related information and filtering out short-duration events. It’s recommended to export the Trace file for analysis on <a href="https://ui.perfetto.dev/">https://ui.perfetto.dev/</a>.</li><li><strong>Java Method Trace Recording</strong>: It gathers function call stack information from the virtual machine, used for analyzing Java function calls and duration.</li><li><strong>C&#x2F;C++ Function Trace</strong>: Information captured with Simpleperf. Simpleperf gathers data from the CPU’s performance monitoring unit (PMU) hardware component. <strong>C&#x2F;C++ Method Trace</strong> has only partial functionalities of Simpleperf, used for analyzing C&#x2F;C++ function calls and durations.</li></ol><p><img src="/en/images/Techniques-Philosophy-and-Tools-for-Android-Performance-Optimization/92246083-124c-4290-a5c4-5b57529741cb.webp" alt="CPU Profiler"></p><h3 id="Practical-Application-1"><a href="#Practical-Application-1" class="headerlink" title="Practical Application"></a>Practical Application</h3><p>Application performance issues are mainly divided into two categories: slow response and lack of smoothness.</p><ul><li>Slow response issues include slow app startup, slow page transitions, slow list loading, slow button responses, etc.</li><li>Lack of smoothness issues include unsmooth list scrolling, page sliding not following hand movements, animation judders, etc.</li></ul><p>How to use CPU Profiler in these scenarios? The basic approach is to capture a System Trace first, analyze and locate the issue with System Trace. If the issue can’t be pinpointed, further analysis and location should be done with Java Method Trace or C&#x2F;C++ Function Trace.</p><p>Taking an extremely poor-performing application as an example, suppose Systrace TracePoint is inserted at the system’s critical positions and the code is unfamiliar. How do you identify the performance bottleneck? First, run the application and <strong>record a System Trace with CPU Profiler</strong> (the tool usage will be introduced in later articles), as shown below:</p><p><img src="/en/images/Techniques-Philosophy-and-Tools-for-Android-Performance-Optimization/359770f0-ccf4-4857-9f7d-89db47e44d0b.webp"></p><p>From the above Trace, it’s evident that the onDrawFrame operation in the egl_core thread is time-consuming. If the issue isn’t apparent, it’s advised to export it to <a href="https://ui.perfetto.dev/">https://ui.perfetto.dev/</a> for further analysis. By looking into the source code, we find that onDrawFrame is the duration of the Java function onDrawFrame. To analyze the duration of the Java function, <strong>we need to record a Java Method Trace</strong>, as follows:</p><p><img src="/en/images/Techniques-Philosophy-and-Tools-for-Android-Performance-Optimization/ee7e0852-9643-46f1-86b6-23e3975c1e54.webp"></p><p>From the above Trace, it’s easy to see that a native function called Utils.onDraw is time-consuming. Because it involves C&#x2F;C++ code, <strong>another C&#x2F;C++ Function Trace needs to be recorded for further analysis</strong>, as shown below:</p><p><img src="/en/images/Techniques-Philosophy-and-Tools-for-Android-Performance-Optimization/25a10f6e-4465-4ea4-addb-624203e99dfd.webp"></p><p>It becomes clear that the code executed a sleep function within the native Java_com_gl_shader_Utils_onDraw, pinpointing the culprit for the poor performance!</p><p>The greatest advantage of CPU Profiler in AS is the integration of various sub-tools, enabling all operations in one place. It’s incredibly convenient for application developers. However, system developers might not be so lucky.</p><h2 id="2-4-Comparative-Analysis"><a href="#2-4-Comparative-Analysis" class="headerlink" title="2.4 Comparative Analysis"></a>2.4 Comparative Analysis</h2><table><thead><tr><th>Tool Name</th><th>Application Scenario</th><th>Data Type</th><th>Data Acquisition Method</th><th>Analysis Method</th></tr></thead><tbody><tr><td>Systrace</td><td>Android System &amp; App Performance Analysis</td><td>Trace Type</td><td>Unconditional Capture, Continuous Logging</td><td>Visual Analysis</td></tr><tr><td>Perfetto</td><td>Android System &amp; App Performance Analysis</td><td>Metric Type, Trace Type</td><td>Unconditional Capture, Continuous Logging</td><td>Visual Analysis, Database Analysis</td></tr><tr><td>AS Profiler</td><td>Android System &amp; App Performance Analysis</td><td>Trace Type</td><td>Unconditional Capture, Continuous Logging</td><td>Visual Analysis</td></tr><tr><td>SimplePerf</td><td>Java&#x2F;C++ Function Execution Time Analysis, PMU Counters</td><td>Trace Type</td><td>Unconditional Capture, Continuous Logging</td><td>Visual Analysis, Text Analysis</td></tr><tr><td>Snapdragon Profiler Tools &amp; Resources</td><td>Primarily for Qualcomm GPU Performance Analyzer</td><td>Trace Type, Metric Type</td><td>Unconditional Capture, Continuous Logging</td><td>Visual Analysis</td></tr><tr><td>Mali Graphics Debugger</td><td>ARM GPU Analyzer (for MTK, Kirin chips)</td><td>Trace Type, Metric Type</td><td>Unconditional Capture, Continuous Logging</td><td>Visual Analysis</td></tr><tr><td>Android Log&#x2F;dumpsys</td><td>Comprehensive Analysis</td><td>Log Type</td><td>Conditional Capture, Continuous Capture but not Logging</td><td>Text Analysis</td></tr><tr><td>AGI (Android GPU Inspector)</td><td>Android GPU Analyzer</td><td>Trace Type, Metric Type</td><td>Unconditional Capture, Continuous Logging</td><td>Visual Analysis</td></tr><tr><td>eBPF</td><td>Dynamic Tracing of Linux Kernel Behavior</td><td>Metric Type</td><td>Dynamic Tracing, Conditional Capture, Continuous Capture but not Logging</td><td>Text Analysis</td></tr><tr><td>FTrace</td><td>Linux Kernel Tracing</td><td>Log Type</td><td>Static Code, Conditional Capture, Continuous Capture but not Logging</td><td>Text Analysis</td></tr></tbody></table><h1 id="3-On-“Instruments-Techniques-Philosophy”"><a href="#3-On-“Instruments-Techniques-Philosophy”" class="headerlink" title="3 On “Instruments, Techniques, Philosophy”"></a>3 On “Instruments, Techniques, Philosophy”</h1><p>Technical revolutions and improvements are often reflected at the “instruments” level. The development direction of tools by the Linux community and Google is towards enhancing the integration of tools so that necessary information can be easily found in one place, or towards the collection of more information. In summary, the development trajectory at the instruments level is traceable and developmental rules can be summarized. We need to accurately understand their capabilities and application scenarios during rapid iterations of tools, aiming to improve problem-solving efficiency rather than spending time learning new tools.</p><p>The “techniques” level depends on specific business knowledge, understanding how a frame is rendered, how the CPU selects processes for scheduling, how IO is dispatched, etc. Only with an understanding of business knowledge can one choose the right tools and correctly interpret the information provided by these tools. With rich experience, sometimes you can spot clues even without looking at the detailed information provided by tools. This is a capability that arises when your business knowledge is enriched to a certain extent, and your brain forms complex associative information, elevating you above the tools.</p><p>At the “philosophy” level, considerations are about the nature of the problem that needs to be solved. What is the essence of the problem? What extent should be achieved, and what cost should be incurred to achieve what effect? For solving a problem, which path has the highest “input-output ratio”? What is the overall strategy? To accomplish something, what should be done first and what should be done next, and what is the logical dependency relationship?</p><p>In subsequent articles, explanations will be provided in the “instruments, techniques, philosophy” manner for a technology or a feature. We aim not only to let you learn a knowledge point but also to stimulate your ability to extrapolate. When faced with similar tools or problems, or even completely different systems, you can handle them with ease. Firmly grasping the essence, you can choose the appropriate tools or information through evaluating the “input-output ratio” and solve problems efficiently.</p><h1 id="About-Me-amp-amp-Blog"><a href="#About-Me-amp-amp-Blog" class="headerlink" title="About Me &amp;&amp; Blog"></a>About Me &amp;&amp; Blog</h1><ol><li><a href="https://www.androidperformance.com/en/about/">About Me</a>: I am eager to interact and progress together with everyone.</li><li><a href="https://twitter.com/Gracker_Gao">Follow me on Twitter</a></li><li><a href="https://www.androidperformance.com/en/2019/12/01/BlogMap/">Blog Content Navigation</a></li><li><a href="https://www.androidperformance.com/en/2018/05/07/Android-performance-optimization-skills-and-tools/">Record of Excellent Blog Articles - Essential Skills and Tools for Android Performance Optimization</a></li></ol><p><strong>An individual can move faster, a group can go further.</strong></p>]]></content>
    
    
    <summary type="html">&lt;p&gt;&lt;img src=&quot;/en/images/Techniques-Philosophy-and-Tools-for-Android-Performance-Optimization/cc4162d9-7c2b-43b1-b9a1-f14d5c8e8605.jpg&quot; alt=&quot;Hackers &amp;amp; Painters&quot;&gt;&lt;/p&gt;
&lt;blockquote&gt;
&lt;p&gt;In his book &lt;em&gt;Hackers &amp;amp; Painters&lt;/em&gt;, Paul Graham asserted, “The disparity in the efficiency of languages is becoming more pronounced, hence the rising importance of profilers. Currently, performance analysis isn’t given the attention it deserves. Many still seem to hold onto the belief that the key to accelerating program execution lies in developing compilers that generate faster code. As the gap between code efficiency and machine performance widens, it will become increasingly apparent that enhancing the execution speed of application software hinges on having a good profiler to guide program development.” by Paul Graham, Hackers &amp;amp; Painters&lt;/p&gt;
&lt;/blockquote&gt;
&lt;p&gt;A Google search for “Android optimization tools” yields an abundance of related content. The issue with these results is that they either contain highly repetitive content or directly explain usage methods. Rarely do they introduce a holistic architecture, inadvertently instilling a misguided belief of “one tool fixes all”. Drawing from the extensive experience of my team, I can assert that in the realm of performance analysis, no such magic bullet tool exists. Tools evolve, old problems re-emerge in new forms, and without mastering core logic, one remains on the technological surface.&lt;/p&gt;
&lt;p&gt;This article first systematically untangles the observability technology in performance analysis, encompassing data types, capture methods, and analysis techniques. Subsequently, we introduce the “big three” analysis tools provided by Google. The aim is to impart immutable theoretical knowledge and corresponding tools available in the Android environment to the reader. This wealth of information can facilitate a more direct application of predecessors’ experiences, circumventing unnecessary detours.&lt;/p&gt;</summary>


    <category term="Android" scheme="https://androidperformance.com/en/categories/Android/"/>
    
    
    <category term="Android" scheme="https://androidperformance.com/en/tags/Android/"/>
    
    <category term="Framework" scheme="https://androidperformance.com/en/tags/Framework/"/>
    
  </entry>
  
  <entry>
    <title>2021 Year in Review: Baby, Career, and Growth</title>
    <link href="https://androidperformance.com/en/2022/01/03/2021-Review/"/>
    <id>https://androidperformance.com/en/2022/01/03/2021-Review/</id>
    <published>2022-01-03T15:25:35.000Z</published>
    <updated>2026-05-10T23:29:51.052Z</updated>
    
    <content type="html"><![CDATA[<p>2021 has passed. Taking advantage of the New Year holiday, I’d like to look back at the year. This will be a casual review—writing whatever comes to mind. 2021 for me was marked by becoming a father, changing jobs (including a boring period of working from home), and making new friends. Overall, it was a pretty good year.</p><p>However, in terms of personal growth, I feel like I might have stagnated or even regressed, which is a bit alarming. Learning is like rowing upstream; if you don’t move forward, you fall back. 2022 needs to be a year of deep cultivation. I hope to progress together with everyone reading this.</p><p>I’ve also tallied some data related to my technical sharing, shared my income from these platforms, and listed some hardware and software I recommend. Feel free to take a look.</p><span id="more"></span><h1 id="2021’s-Greatest-Achievement-“Little-Orange”"><a href="#2021’s-Greatest-Achievement-“Little-Orange”" class="headerlink" title="2021’s Greatest Achievement: “Little Orange”"></a>2021’s Greatest Achievement: “Little Orange”</h1><p>The highlight of my year was definitely the addition of “Little Orange” to our family. Experiencing fatherhood has been incredible—our duo became a trio. She’s almost ten months old now and is an absolute angel. We don’t ask for much; just that she grows up healthy and happy. Mom and Dad will always be your strongest support.</p><p><img src="/en/images/2021-Review/b97e79e2-8222-45bf-9ff2-a1932e451ea7.jpg" alt="Little Orange"></p><h1 id="Technical-Sharing-Statistics"><a href="#Technical-Sharing-Statistics" class="headerlink" title="Technical Sharing Statistics"></a>Technical Sharing Statistics</h1><h2 id="Blog-Data"><a href="#Blog-Data" class="headerlink" title="Blog Data"></a>Blog Data</h2><p>I added 8 new articles to the blog in 2021. The Systrace series is finally complete with 18 articles total! (Go ahead and read those while I prepare the Perfetto version…)</p><ol><li><a href="https://www.androidperformance.com/en/2021/04/24/android-systrace-smooth-in-action-1/">Systrace Smoothness in Practice 1: Understanding Jank</a></li><li><a href="https://www.androidperformance.com/en/2021/04/24/android-systrace-smooth-in-action-2/">Systrace Smoothness in Practice 2: MIUI Desktop Scroll Analysis</a></li><li><a href="https://www.androidperformance.com/en/2021/04/24/android-systrace-smooth-in-action-3/">Systrace Smoothness in Practice 3: Common Questions</a></li><li><a href="https://www.androidperformance.com/en/2021/09/13/android-systrace-Responsiveness-in-action-1/">Systrace Responsiveness in Practice 1: Understanding Principles</a></li><li><a href="https://www.androidperformance.com/en/2021/09/13/android-systrace-Responsiveness-in-action-2/">Systrace Responsiveness in Practice 2: Case Study — App Launch</a></li><li><a href="https://www.androidperformance.com/en/2021/09/13/android-systrace-Responsiveness-in-action-3/">Systrace Responsiveness in Practice 3: Extended Knowledge</a></li><li><a href="https://www.androidperformance.com/en/2021/10/26/build-android-12/">Android System Development (1): Downloading, Compiling, and Flashing Android 12</a></li><li><a href="https://www.androidperformance.com/en/2021/10/27/if-i-write-a-book-about-performance/">What Should a Book on Android Smoothness Contain?</a></li></ol><p>Writing only 8 articles is a far cry from my initial goal of <strong>one per week</strong>. That was a bit ridiculous in hindsight. I won’t set such a high bar for 2022—perhaps two per month is more realistic.</p><p>I also maintained an Android Weekly column on Zhihu. Feel free to subscribe: <a href="https://www.zhihu.com/column/c_1278963991947780096">https://www.zhihu.com/column/c_1278963991947780096</a></p><p>The blog <a href="https://www.androidperformance.com/en/">AndroidPerformance</a> uses Google Analytics. Comparing 2021 to 2020, the numbers are looking good:</p><p><strong>Active Users</strong> grew by 38.9% compared to 2020. (The obvious dips are the New Year, May Day, and National Day holidays—good to see people aren’t “grinding” during breaks!)</p><p><img src="/en/images/2021-Review/c33ba71e-2d1a-45f6-bc78-bc2558ca29aa.webp"></p><p><strong>Most Visited Pages</strong> are still primarily from the Android Systrace series.<br><img src="/en/images/2021-Review/edd399b3-17b7-421e-b37f-4b2a1bfdf68a.webp"></p><h2 id="WeChat-Official-Account-Data"><a href="#WeChat-Official-Account-Data" class="headerlink" title="WeChat Official Account Data"></a>WeChat Official Account Data</h2><p>Followers for the <strong>AndroidPerformance</strong> account currently stand at <strong>7,364</strong>. Since I don’t post many original articles and have many reposts, growth is slow. Most active users are long-time followers. Data for individual posts doesn’t mean much in the closed WeChat environment, so I won’t list it. I hope to break 10,000 in 2022.</p><p>Writing on WeChat is convenient for readers but unfriendly for creators—mostly because you can’t include external links. It feels like turning the internet into a local area network.</p><p><img src="/en/images/2021-Review/WechatIMG581.webp" alt="Scan to Follow"></p><h2 id="Zhihu"><a href="#Zhihu" class="headerlink" title="Zhihu"></a>Zhihu</h2><p>I have over 20,000 followers on <a href="https://www.zhihu.com/people/gracker">Zhihu</a>, but the platform seems to care less about technical content these days, so I haven’t been very active. Most articles I see are just reposts. I find myself spending more time on Jike and Twitter, where real developer activity is higher.</p><h2 id="Juejin"><a href="#Juejin" class="headerlink" title="Juejin"></a>Juejin</h2><p><a href="https://juejin.cn/user/3051900006837213">Juejin</a> still has a strong technical atmosphere. I browse it often, although it feels like it’s missing “something.” I’ll continue syncing my articles there, otherwise, others will just do it for me (and change the author!).</p><h2 id="Jike"><a href="#Jike" class="headerlink" title="Jike"></a>Jike</h2><p>Fellow “Jiyou” (Jike users) can add me:</p><p><img src="/en/images/2021-Review/image-20220207233253977.webp" alt="Jike"></p><h2 id="Other-Platforms"><a href="#Other-Platforms" class="headerlink" title="Other Platforms"></a>Other Platforms</h2><ol><li><strong>CSDN</strong>: …can be ignored.</li><li><a href="https://weibo.com/u/1315612820">Weibo</a>: …can be ignored.</li><li><a href="https://twitter.com/Gracker_Gao">Twitter</a>: I follow many domestic and international tech gurus. The technical vibe is quite good.</li></ol><h1 id="Making-Money-Just-Making-Friends"><a href="#Making-Money-Just-Making-Friends" class="headerlink" title="Making Money? Just Making Friends"></a>Making Money? Just Making Friends</h1><p>I listened to <a href="https://happyxiao.com/category/podcast/">Happy Xiao’s podcast</a> recently, where he shared that his technical sharing earned him about 2,500 RMB a month. Looking at my own 2021 income in this area… it’s quite humble.</p><ol><li><strong>Blog Income</strong>: 0. Actually negative, if you count domain and server costs.</li><li><strong>WeChat Account</strong>: I don’t use mid-article ads, so ad revenue is negligible. It’s mostly donations from readers, which totaled 1,039 RMB.</li><li><strong>Patreon&#x2F;Columns</strong>: Totaled 560 RMB.</li></ol><p>So, total income was 1,039 + 560 &#x3D; <strong>1,596 RMB</strong>. That’s an average of <strong>133 RMB per month</strong>. Clearly not a gold mine! As the saying goes, “just making friends.” But I truly appreciate the donations—they pay for the extra egg in my breakfast! (If you’d like to support, you can scan the code at the end of any of my original articles.)</p><p>Speaking of friends, I did add many new tech peers this year. We started four WeChat groups. My general feeling there is: “Everyone’s a master except me.” It makes me realize how much I still need to learn. My goal for 2022 is to solidify my foundations and systematize my knowledge to keep up with their discussions.</p><p>If you find my content helpful, you can “buy me a chicken leg” below:</p><p><img src="/en/images/2021-Review/wechat.webp" alt="Donation Code"></p><h1 id="2022-Plans"><a href="#2022-Plans" class="headerlink" title="2022 Plans"></a>2022 Plans</h1><p>New Year goals are a cliché, but here they are anyway. Hopefully, I can break them down into weekly actions:</p><ol><li><strong>Fitness</strong>: Walking to work, basketball, running, rowing machine, and home gym equipment (holding “Little Orange” counts too!).</li><li><strong>Improve English Reading&#x2F;Listening</strong>: Listening to English podcasts, watching tech videos, and reading English books&#x2F;articles. Using iPad split-screen with Youdao Dictionary is a great workflow.</li><li><strong>Systematize Knowledge</strong>: Read and write more code, read more books, and write a <strong>performance-related ebook</strong>.</li><li><strong>Update the <a href="https://www.androidperformance.com/en/">Blog</a> More Frequently</strong>: Goal set above.</li><li><strong>Grow [The Performance Knowledge Planet] with the team</strong>: One person is too small. We’ve started a paid community with a small team to provide better service and put some “pressure” on ourselves.</li><li><strong>Try New Content</strong>: Podcasts, video, Vlogs, photography.</li><li><strong>Efficient Work</strong>: More thinking, summarizing, and sharing. Use tools to boost productivity.</li></ol><p><img src="/en/images/2021-Review/0d2d6300-16d8-4069-b9af-4fff436c58c0.jpg" alt="TeamWork - Knowledge Planet"></p><h1 id="2021-Software-Recommendations"><a href="#2021-Software-Recommendations" class="headerlink" title="2021 Software Recommendations"></a>2021 Software Recommendations</h1><p>The software that brought me the most joy in 2021:</p><ol><li><strong>Notion</strong>: For notes and planning. <a href="https://www.notion.so/">https://www.notion.so/</a></li><li><strong>Typora</strong>: The tool I used to write this very blog. <a href="https://typora.io/">https://typora.io/</a></li><li><strong>GitHub Copilot</strong>: Your AI coding companion. <a href="https://copilot.github.com/">https://copilot.github.com/</a></li><li><strong>flomo</strong>: For recording fleeting thoughts. <a href="https://flomoapp.com/">https://flomoapp.com/</a></li><li><strong>DeepL</strong>: The world’s most accurate translator. <a href="https://www.deepl.com/">https://www.deepl.com/</a></li></ol><p><img src="/en/images/2021-Review/9fd3dfde-906e-4240-b752-6b9c1a157b48.webp" alt="DeepL"></p><h1 id="2021-Hardware-Recommendations"><a href="#2021-Hardware-Recommendations" class="headerlink" title="2021 Hardware Recommendations"></a>2021 Hardware Recommendations</h1><p>Hardware I’ve tinkered with and highly recommend:</p><ol><li><strong>NAS (Personal Cloud)</strong>: Essential for data management.</li><li><strong>Electrostatic Capacity Keyboard</strong>: A godsend for programmers and writers.</li><li><strong>Xiaomi 27-inch 4K Monitor</strong>: Great value for the price.</li><li><strong>Apple TV 4K</strong>: If you have a NAS, 4K TV, and the right network setup, the experience is unbeatable.</li><li><strong>JOY25 Electric Standing Desk</strong>: 1.8m width is amazing. Switching between sitting and standing is a health game-changer.</li></ol><p><img src="/en/images/2021-Review/1f5f8c15-4e79-45b5-9935-1e3906e80caf.jpg" alt="Home Setup"></p><h1 id="What-Do-I-Want-Most-in-2022"><a href="#What-Do-I-Want-Most-in-2022" class="headerlink" title="What Do I Want Most in 2022?"></a>What Do I Want Most in 2022?</h1><p>I feel my M1 Mac Mini is already starting to feel slow compared to the M1 Max MacBook Pro… Cook must be practicing remote magic.</p><p><img src="/en/images/2021-Review/c2b443fb-eefd-49e1-8294-5204f5dc6eeb.webp" alt="Chi&#39;s Weibo"></p><p>Regardless of “wants,” I need to be a rational consumer!</p><p>Also, this chair looks amazing! (<a href="https://item.taobao.com/item.htm?id=614505490996">https://item.taobao.com/item.htm?id=614505490996</a>)<br><img src="/en/images/2021-Review/002606e3-8164-4ae0-8b75-f3f0c07634fd.webp" alt="Lounge Chair"></p><p>And of course, who would say no to the latest iPhone 13 Pro Max?</p><p><img src="/en/images/2021-Review/image-20220104001033091.webp" alt="iPhone 13 Pro Max"></p><h1 id="Conclusion"><a href="#Conclusion" class="headerlink" title="Conclusion"></a>Conclusion</h1><p>2021 was a bit underwhelming professionally, but family life with “Little Orange” brought a lot of joy. Personal growth felt stagnant, which comes down to my own lack of self-discipline.</p><p>I hope 2022 can be a year of breakthrough for me and everyone reading this. Let’s work hard together!</p><h1 id="About-Me-amp-amp-Blog"><a href="#About-Me-amp-amp-Blog" class="headerlink" title="About Me &amp;&amp; Blog"></a>About Me &amp;&amp; Blog</h1><p>Below is my personal intro and related links. I look forward to exchanging ideas with fellow professionals. “When three walk together, one can always be my teacher!”</p><ol><li><a href="https://www.androidperformance.com/en/about/">Blogger Intro</a></li><li><a href="https://www.androidperformance.com/en/2019/12/01/BlogMap/">Blog Content Navigation</a>: A guide for my blog content.</li><li><a href="https://www.androidperformance.com/en/2018/05/07/Android-performance-optimization-skills-and-tools/">Curated Excellent Blog Articles - Android Performance Optimization Must-Knows</a></li><li><a href="https://www.androidperformance.com/en/2023/12/30/the-performance/">Android Performance Optimization Knowledge Planet</a></li></ol><blockquote><p><strong>One walks faster alone, but a group walks further together.</strong></p></blockquote><p><img src="/en/images/WechatIMG581.webp" alt="Scan WeChat QR Code"></p>]]></content>
    
    
    <summary type="html">&lt;p&gt;2021 has passed. Taking advantage of the New Year holiday, I’d like to look back at the year. This will be a casual review—writing whatever comes to mind. 2021 for me was marked by becoming a father, changing jobs (including a boring period of working from home), and making new friends. Overall, it was a pretty good year.&lt;/p&gt;
&lt;p&gt;However, in terms of personal growth, I feel like I might have stagnated or even regressed, which is a bit alarming. Learning is like rowing upstream; if you don’t move forward, you fall back. 2022 needs to be a year of deep cultivation. I hope to progress together with everyone reading this.&lt;/p&gt;
&lt;p&gt;I’ve also tallied some data related to my technical sharing, shared my income from these platforms, and listed some hardware and software I recommend. Feel free to take a look.&lt;/p&gt;</summary>


    <category term="Essays" scheme="https://androidperformance.com/en/categories/Essays/"/>
    
    
    <category term="Android" scheme="https://androidperformance.com/en/tags/Android/"/>
    
    <category term="Perfetto" scheme="https://androidperformance.com/en/tags/Perfetto/"/>
    
    <category term="Systrace" scheme="https://androidperformance.com/en/tags/Systrace/"/>
    
    <category term="Startup" scheme="https://androidperformance.com/en/tags/Startup/"/>
    
    <category term="Jank" scheme="https://androidperformance.com/en/tags/Jank/"/>
    
  </entry>
  
  <entry>
    <title>What Should Be in a Book About Android Smoothness?</title>
    <link href="https://androidperformance.com/en/2021/10/27/if-i-write-a-book-about-performance/"/>
    <id>https://androidperformance.com/en/2021/10/27/if-i-write-a-book-about-performance/</id>
    <published>2021-10-27T07:21:31.000Z</published>
    <updated>2026-05-10T23:29:51.068Z</updated>
    
    <content type="html"><![CDATA[<p>Recently, I read a new book: <em>Building Smooth Android Apps</em> (JD link: <a href="https://item.jd.com/10035215362170.html">https://item.jd.com/10035215362170.html</a>). I bought it because of the title, and after reading it, I felt it was necessary to write an article so that colleagues who haven’t bought it yet can understand what it’s about.</p><p>My personal suggestion is: if you are an experienced developer, I don’t recommend buying it. This book doesn’t go into much depth on principles and doesn’t offer a comprehensive overview of Android smoothness. If you are a beginner, it’s decent for broadening your horizons and identifying gaps in your knowledge, but it’s still a bit lacking for a deep understanding of Android smoothness.</p><p>I say this because the book doesn’t focus much on performance or smoothness. It lacks deep theoretical parts. Instead, a large portion is dedicated to <strong>static code analysis</strong>, <strong>using Android Studio Profiler</strong>, <strong>App architecture</strong>, <strong>app stay-alive techniques</strong>, <strong>network performance optimization</strong>, <strong>APK size optimization</strong>, <strong>app power consumption</strong>, etc. These topics are covered briefly and at a shallow level.</p><span id="more"></span><p><img src="/en/images/16352192103990.webp" alt="Book Cover"></p><h1 id="Content-Overview"><a href="#Content-Overview" class="headerlink" title="Content Overview"></a>Content Overview</h1><p>Here is a brief introduction to the book’s content and chapters:</p><ol><li><strong>Overview</strong>: Briefly introduces why performance optimization is needed and how to configure Android Studio.</li><li><strong>Static Code Analysis</strong>: Covers various static analysis tools in detail, such as Android Lint, CheckStyle, SpotBugs, PMD, etc. Except for Lint, I hadn’t used the others much, so this was a good refresher.</li><li><strong>Performance Optimization with Android Profiler</strong>: Focuses on the CPU, Memory, and Network Profilers within the AS Profiler tool. The emphasis is on tool usage, with high-level introductions.</li><li><strong>High-Quality Apps Start with Architecture</strong>: Discusses architectural principles like MVC, MVP, and MVVM.</li><li><strong>Elegant App Stay-Alive Techniques</strong>: A brief introduction to techniques for keeping apps running in the background.</li><li><strong>Network Performance Optimization</strong>: Covers network interaction, multi-threading, and large-scale data transfer optimization.</li><li><strong>Optimizing APK Size</strong>: The usual topics: multi-channel packaging, resource optimization, and code obfuscation.</li><li><strong>App Power Consumption and Crash Experience Optimization</strong>: A brief overview of these areas.</li></ol><p>As you can see from the chapter titles, there is relatively little content specifically about “smoothness.” The topics are quite diverse. If you’re interested, you can buy a copy to take a look.</p><h1 id="What-Do-I-Think-a-Book-on-Smoothness-Should-Contain"><a href="#What-Do-I-Think-a-Book-on-Smoothness-Should-Contain" class="headerlink" title="What Do I Think a Book on Smoothness Should Contain?"></a>What Do I Think a Book on Smoothness Should Contain?</h1><p>While I couldn’t write such a book myself—I have great respect for technical authors—I can certainly offer my “armchair” opinions. If I were to write this book, I would include the following content to ensure readers gain a deep understanding of Android smoothness principles and become proficient in using various tools to analyze issues.</p><p>In Android performance discussions, <strong>Jank (Smoothness)</strong>, <strong>Responsiveness</strong>, and <strong>ANR</strong> are usually grouped together because their causes are similar. They are essentially categorized by severity: jank, slow response, and ANR. We can define <strong>Smoothness</strong> in a broad sense as encompassing all three. Most user complaints about “lag” or “stuttering” refer to this broad definition.</p><p>Here is my proposed chapter structure:</p><ol><li><strong>Chapter 1: Overview of Android Smoothness</strong>: Concepts from the perspectives of users, developers, testers, AOSP, and hardware. It’s important not to limit your thinking to just one role.</li><li><strong>Chapter 2: Overview of Android Runtime Mechanisms</strong>: Essential knowledge for analyzing smoothness. Once you master these, you’ll have a mental model of how user actions trigger system feedback and where potential bottlenecks lie:<ul><li>App Main Thread Principles (Main Thread vs. Render Thread)</li><li>Message, Handler, MessageQueue, and Looper mechanisms</li><li>Screen Refresh Mechanism and Vsync</li><li>Choreographer mechanism</li><li>Buffer and SurfaceFlinger workflows</li><li>Input handling flow</li><li>Design philosophy of ANRs</li></ul></li><li><strong>Chapter 3: Performance Analysis Tools</strong>: A craftsman is only as good as his tools. This chapter would go beyond simple introductions, explaining regular performance analysis tools in the context of system mechanisms: <strong>Systrace (Perfetto)</strong>, <strong>AS Profiler</strong>, <strong>SimplePerf</strong>, <strong>MAT</strong>, <strong>Log tools</strong> (analysis and principles), <strong>Command-line tools</strong> (dumpsys for meminfo, gfxinfo, cpuinfo, SurfaceFlinger, activity, input, window, etc.), and <strong>Third-party libraries</strong> (Koom, Matrix, Profilo, BlockCanary, LeakCanary, Tailor&#x2F;Raphael, etc.).</li><li><strong>Chapter 4: Deep Dive into Android Jank</strong>: Practical strategies for identifying causes, workflows for analysis, case studies, and coding best practices.</li><li><strong>Chapter 5: Deep Dive into Android Responsiveness</strong>: Similar to the above, but focused on responsiveness issues.</li><li><strong>Chapter 6: Deep Dive into Android ANR</strong>: Understanding the design, types, causes, and analysis workflows for ANRs, along with case studies and best practices. (Likely a very detailed chapter).</li><li><strong>Chapter 7: Deep Dive into Android Memory Issues</strong>: Memory is a critical performance metric. This chapter would cover app memory footprint, analysis tools, memory leaks, and continuous growth analysis.</li><li><strong>Chapter 8: Performance Testing</strong>: Smoothness from a testing perspective: <strong>retrieving metrics (intrusive vs. non-intrusive)</strong>, <strong>setting standards</strong>, <strong>competitor analysis</strong>, <strong>bug reporting flows</strong>, <strong>full-device testing</strong>, <strong>third-party standards (Master Lu, Umeng, Bugly, etc.)</strong>, and <strong>tool development (Matrix, Koom, Fastbot, etc.)</strong>. Also covers soft skills: <strong>distinguishing between system and app issues</strong> and <strong>communicating with PMs and devs</strong>.</li><li><strong>Chapter 9: Online Performance Monitoring</strong>: Unlike offline testing, online monitoring must reflect real user experience with minimal impact while ensuring timely data reporting.</li><li><strong>Chapter 10: Introduction to System Performance Optimization</strong>: How do Android system developers (AOSP, Qualcomm, MTK, OEMs) optimize performance?</li><li><strong>Chapter 11: High-Efficiency Work Guide</strong>:<ul><li>Necessity and process of compiling AOSP code.</li><li>Tips for reading AOSP code (cs.android.com, importing into AS&#x2F;VS Code, flowcharts).</li><li>Recommended dev environments (Windows, Linux, Mac) and command-line configurations.</li><li>Work habits: writing, recording, summarizing, and sharing.</li></ul></li></ol><p><strong>That’s my “armchair” outline. Everything is ready—just waiting for an expert to fill in the content!</strong></p><h1 id="What-Other-Performance-Books-Are-Available"><a href="#What-Other-Performance-Books-Are-Available" class="headerlink" title="What Other Performance Books Are Available?"></a>What Other Performance Books Are Available?</h1><p>Many books on the market are a bit dated. However, the Juejin community has a wealth of articles on Android performance, and many large companies open-source their internal tools. Let’s keep moving forward on the shoulders of giants.</p><p>Here are a few books I’ve read:</p><ol><li><em>Evaluation and Optimization of Mobile App Performance</em> by Tencent TMQ: Published in 2016, very professional and practical. (Available on WeChat Reading).</li><li><em>Understanding Android: Java Virtual Machine ART</em> by Deng Fanheng: A massive tome on the ART VM, helpful for understanding “black tech” involving the VM. (Available on WeChat Reading).</li><li><em>High-Performance Android Apps</em> by Doug Sillars: Published in 2016, an early comprehensive guide.</li><li><em>Best Practices for Android App Performance Optimization</em> by Tencent developers: Published in 2017. (Available on WeChat Reading).</li><li><em>BPF Performance Tools</em> by Brendan Gregg: Chinese edition published in 2020. A fundamental tool for system performance.</li><li><em>Systems Performance: Enterprise and the Cloud</em> by Brendan Gregg: Chinese edition published in 2020. A must-have for anyone doing performance work. (Available on WeChat Reading).</li><li><em>Android Development Master Class</em> by Zhang Shaowen (Geek Time column): A true master’s perspective.</li><li><em>Linux Performance Optimization</em> by Ni Pengfei.</li></ol><h1 id="Final-Thoughts"><a href="#Final-Thoughts" class="headerlink" title="Final Thoughts"></a>Final Thoughts</h1><ol><li>Feel free to share your own recommendations for Android performance books, blogs, videos, or tutorials.</li><li>What do you think should be included in a book about Android smoothness?</li><li>This article is for sharing only, with no promotional links.</li><li>Feedback is welcome on my Zhihu or WeChat accounts.</li></ol><h1 id="About-Me-amp-amp-Blog"><a href="#About-Me-amp-amp-Blog" class="headerlink" title="About Me &amp;&amp; Blog"></a>About Me &amp;&amp; Blog</h1><p>Below is my personal introduction and related links. I look forward to exchanging ideas with fellow professionals. “When three walk together, one can always be my teacher!”</p><ol><li><a href="https://www.androidperformance.com/en/about/">Blogger Intro</a>: Includes personal WeChat and WeChat group links.</li><li><a href="https://www.androidperformance.com/en/2019/12/01/BlogMap/">Blog Content Navigation</a>: A guide for my blog content.</li><li><a href="https://www.androidperformance.com/en/2018/05/07/Android-performance-optimization-skills-and-tools/">Curated Excellent Blog Articles - Android Performance Optimization Must-Knows</a>: Welcome to recommend projects&#x2F;articles.</li><li><a href="https://www.androidperformance.com/en/2023/12/30/the-performance/">Android Performance Optimization Knowledge Planet</a>: Welcome to join and thank you for your support~</li></ol><blockquote><p><strong>One walks faster alone, but a group walks further together.</strong></p></blockquote><p><img src="/en/images/WechatIMG581.webp" alt="Scan WeChat QR Code"></p>]]></content>
    
    
    <summary type="html">&lt;p&gt;Recently, I read a new book: &lt;em&gt;Building Smooth Android Apps&lt;/em&gt; (JD link: &lt;a href=&quot;https://item.jd.com/10035215362170.html&quot;&gt;https://item.jd.com/10035215362170.html&lt;/a&gt;). I bought it because of the title, and after reading it, I felt it was necessary to write an article so that colleagues who haven’t bought it yet can understand what it’s about.&lt;/p&gt;
&lt;p&gt;My personal suggestion is: if you are an experienced developer, I don’t recommend buying it. This book doesn’t go into much depth on principles and doesn’t offer a comprehensive overview of Android smoothness. If you are a beginner, it’s decent for broadening your horizons and identifying gaps in your knowledge, but it’s still a bit lacking for a deep understanding of Android smoothness.&lt;/p&gt;
&lt;p&gt;I say this because the book doesn’t focus much on performance or smoothness. It lacks deep theoretical parts. Instead, a large portion is dedicated to &lt;strong&gt;static code analysis&lt;/strong&gt;, &lt;strong&gt;using Android Studio Profiler&lt;/strong&gt;, &lt;strong&gt;App architecture&lt;/strong&gt;, &lt;strong&gt;app stay-alive techniques&lt;/strong&gt;, &lt;strong&gt;network performance optimization&lt;/strong&gt;, &lt;strong&gt;APK size optimization&lt;/strong&gt;, &lt;strong&gt;app power consumption&lt;/strong&gt;, etc. These topics are covered briefly and at a shallow level.&lt;/p&gt;</summary>


    <category term="Reading Notes" scheme="https://androidperformance.com/en/categories/Reading-Notes/"/>
    
    
    <category term="Android" scheme="https://androidperformance.com/en/tags/Android/"/>
    
    <category term="Perfetto" scheme="https://androidperformance.com/en/tags/Perfetto/"/>
    
    <category term="Systrace" scheme="https://androidperformance.com/en/tags/Systrace/"/>
    
    <category term="Memory" scheme="https://androidperformance.com/en/tags/Memory/"/>
    
    <category term="ANR" scheme="https://androidperformance.com/en/tags/ANR/"/>
    
  </entry>
  
  <entry>
    <title>Android System Development Series (1): Downloading, Compiling, and Flashing Android 12</title>
    <link href="https://androidperformance.com/en/2021/10/26/build-android-12/"/>
    <id>https://androidperformance.com/en/2021/10/26/build-android-12/</id>
    <published>2021-10-26T03:49:33.000Z</published>
    <updated>2026-05-10T23:29:51.066Z</updated>
    
    <content type="html"><![CDATA[<p>Android 12 has been officially released, and the source code is now available on the <a href="https://source.android.google.cn/">AOSP website</a>. This article will guide you through the process of downloading and compiling the latest Android 12 code.</p><p>Compiling the code locally offers several advantages:</p><ol><li><strong>Direct Debugging</strong>: You can flash the build onto a physical device for local debugging and import the code into Android Studio.</li><li><strong>Userdebug Builds</strong>: You can compile a <code>userdebug</code> version, which allows for <code>root</code> and <code>remount</code> access. This is invaluable for debugging both the system and apps, as it reveals information hidden in standard <code>user</code> builds—useful for competitive analysis and behavioral studies.</li><li><strong>Deep Learning</strong>: It facilitates a deeper understanding of Android source code by allowing you to enable system-level debug logs, add your own logs, or even modify system workflows.</li></ol><span id="more"></span><p>This article records the Android 12&#x2F;Pixel 3 era workflow. It is still useful as a version-specific reference for Android 12 branches and older Pixel devices. If you are starting a fresh AOSP build today, follow the current official flow: prefer the <code>android-latest-release</code> manifest branch instead of directly tracking <code>master</code> or <code>aosp-main</code>; initialize with a command such as <code>repo init --partial-clone -b android-latest-release -u https://android.googlesource.com/platform/manifest</code>, then sync with <code>repo sync -c -j8</code>; still run <code>source build/envsetup.sh</code> before building, but use the newer <code>lunch</code> target format <code>product_name-release_config-build_variant</code>, for example <code>lunch aosp_cf_x86_64_only_phone-aosp_current-userdebug</code>, and then build with <code>m</code>. For physical devices, choose the current Pixel target, proprietary binaries, unlock state, and support matrix again instead of applying the Pixel 3&#x2F;Android 12 tags in this article to newer devices.</p><p>If you don’t need to compile or debug and just want to browse the code, I recommend using <a href="https://cs.android.com/">cs.android.com</a>. For those who want to dive deep into the Android system, I suggest the following hardware setup:</p><ol><li>A used, unlocked Google Pixel 3 or newer (Android 12 supports Pixel 3 and up).</li><li>A Linux desktop (preferably Ubuntu) with a large SSD, at least 32GB of RAM (or equivalent swap space), and a decent CPU to minimize compilation time.</li></ol><hr><h2 id="1-Downloading-the-Code"><a href="#1-Downloading-the-Code" class="headerlink" title="1. Downloading the Code"></a>1. Downloading the Code</h2><p>Due to network restrictions in some regions, downloading directly from Google’s official site can be slow. This tutorial uses a domestic mirror as an example. If you have unrestricted internet access, you can follow the <a href="https://source.android.google.cn/source/downloading">Official Google Tutorial</a>.</p><p>USTC AOSP Mirror: <a href="https://mirrors.ustc.edu.cn/help/aosp.html">https://mirrors.ustc.edu.cn/help/aosp.html</a></p><p>The following steps can be run on Ubuntu, WSL, WSL2, or macOS. However, since the actual compilation requires Linux, I strongly recommend using a Linux system like Ubuntu for the entire process.</p><h3 id="1-1-Step-1-Download-the-Repo-Tool"><a href="#1-1-Step-1-Download-the-Repo-Tool" class="headerlink" title="1.1 Step 1: Download the Repo Tool"></a>1.1 Step 1: Download the Repo Tool</h3><figure class="highlight bash"><table><tr><td class="gutter"><pre><span class="line">1</span><br><span class="line">2</span><br><span class="line">3</span><br><span class="line">4</span><br></pre></td><td class="code"><pre><span class="line"><span class="built_in">mkdir</span> ~/bin</span><br><span class="line">PATH=~/bin:<span class="variable">$PATH</span></span><br><span class="line">curl -sSL <span class="string">&#x27;https://gerrit-googlesource.proxy.ustclug.org/git-repo/+/master/repo?format=TEXT&#x27;</span> | <span class="built_in">base64</span> -d &gt; ~/bin/repo</span><br><span class="line"><span class="built_in">chmod</span> a+x ~/bin/repo</span><br></pre></td></tr></table></figure><h3 id="1-2-Step-2-Configure-Personal-Information"><a href="#1-2-Step-2-Configure-Personal-Information" class="headerlink" title="1.2 Step 2: Configure Personal Information"></a>1.2 Step 2: Configure Personal Information</h3><p>If you haven’t installed Git yet, do so first. then configure your identity:</p><figure class="highlight bash"><table><tr><td class="gutter"><pre><span class="line">1</span><br><span class="line">2</span><br></pre></td><td class="code"><pre><span class="line">git config --global user.name <span class="string">&quot;Your Name&quot;</span></span><br><span class="line">git config --global user.email <span class="string">&quot;you@example.com&quot;</span></span><br></pre></td></tr></table></figure><h3 id="1-3-Step-3-Create-a-Working-Directory"><a href="#1-3-Step-3-Create-a-Working-Directory" class="headerlink" title="1.3 Step 3: Create a Working Directory"></a>1.3 Step 3: Create a Working Directory</h3><figure class="highlight bash"><table><tr><td class="gutter"><pre><span class="line">1</span><br><span class="line">2</span><br></pre></td><td class="code"><pre><span class="line"><span class="built_in">mkdir</span> Android_12_AOSP</span><br><span class="line"><span class="built_in">cd</span> Android_12_AOSP</span><br></pre></td></tr></table></figure><h3 id="1-4-Step-4-Initialize-the-Repository"><a href="#1-4-Step-4-Initialize-the-Repository" class="headerlink" title="1.4 Step 4: Initialize the Repository"></a>1.4 Step 4: Initialize the Repository</h3><p>There are two ways to initialize: downloading everything (the master branch) or targeting a specific Tag. <strong>Note: Your choice here will affect which driver you need to download later.</strong></p><h4 id="1-4-1-Option-A-Download-All-Recommended"><a href="#1-4-1-Option-A-Download-All-Recommended" class="headerlink" title="1.4.1 Option A: Download All (Recommended)"></a>1.4.1 Option A: Download All (Recommended)</h4><p>This downloads the entire source tree, defaulting to the <code>master</code> branch. Use this if disk space is not a major concern.</p><figure class="highlight bash"><table><tr><td class="gutter"><pre><span class="line">1</span><br></pre></td><td class="code"><pre><span class="line">repo init -u git://mirrors.ustc.edu.cn/aosp/platform/manifest</span><br></pre></td></tr></table></figure><p>If you encounter connection issues with <code>gerrit.googlesource.com</code>, edit <code>~/bin/repo</code> or your shell configuration (<code>.bashrc</code> or <code>.zshrc</code>) to set:<br><code>REPO_URL=&quot;https://gerrit-googlesource.proxy.ustclug.org/git-repo&quot;</code></p><h4 id="1-4-2-Option-B-Download-a-Specific-Tag"><a href="#1-4-2-Option-B-Download-a-Specific-Tag" class="headerlink" title="1.4.2 Option B: Download a Specific Tag"></a>1.4.2 Option B: Download a Specific Tag</h4><p>This is faster as it only downloads code for a single Tag. You can find a list of <a href="https://source.android.google.cn/setup/start/build-numbers">Build Numbers and Tags here</a>. For example, for my Pixel 3 XL, the relevant Android 12 Tags are <code>android-12.0.0_r3</code> and <code>android-12.0.0_r1</code>.</p><figure class="highlight bash"><table><tr><td class="gutter"><pre><span class="line">1</span><br></pre></td><td class="code"><pre><span class="line">repo init -u git://mirrors.ustc.edu.cn/aosp/platform/manifest -b android-12.0.0_r3</span><br></pre></td></tr></table></figure><h3 id="1-5-Step-5-Sync-the-Code"><a href="#1-5-Step-5-Sync-the-Code" class="headerlink" title="1.5 Step 5: Sync the Code"></a>1.5 Step 5: Sync the Code</h3><p>After initialization, download the actual files. It’s recommended to use <code>-j4</code> to avoid overwhelming mirror connections.</p><figure class="highlight bash"><table><tr><td class="gutter"><pre><span class="line">1</span><br></pre></td><td class="code"><pre><span class="line">repo <span class="built_in">sync</span> -j4</span><br></pre></td></tr></table></figure><p>Since syncing can fail due to network hiccups, you can use a simple loop script:</p><figure class="highlight bash"><table><tr><td class="gutter"><pre><span class="line">1</span><br><span class="line">2</span><br><span class="line">3</span><br><span class="line">4</span><br><span class="line">5</span><br><span class="line">6</span><br><span class="line">7</span><br><span class="line">8</span><br></pre></td><td class="code"><pre><span class="line"><span class="meta">#!/bin/bash</span></span><br><span class="line">repo <span class="built_in">sync</span> -j4</span><br><span class="line"><span class="keyword">while</span> [ $? -ne 0 ]</span><br><span class="line"><span class="keyword">do</span></span><br><span class="line">    <span class="built_in">echo</span> <span class="string">&quot;====== sync failed, retrying ======&quot;</span></span><br><span class="line">    <span class="built_in">sleep</span> 3</span><br><span class="line">    repo <span class="built_in">sync</span> -j4</span><br><span class="line"><span class="keyword">done</span></span><br></pre></td></tr></table></figure><hr><h2 id="2-Downloading-Drivers-Proprietary-Binaries"><a href="#2-Downloading-Drivers-Proprietary-Binaries" class="headerlink" title="2. Downloading Drivers (Proprietary Binaries)"></a>2. Downloading Drivers (Proprietary Binaries)</h2><p>Before compiling for a physical device, you must download proprietary driver files. Refer to the <a href="https://source.android.google.cn/setup/build/downloading#obtaining-proprietary-binaries">Official Documentation</a>.</p><p><strong>The driver you need depends on whether you synced the <code>master</code> branch or a specific <code>Tag</code>.</strong></p><h3 id="2-1-Drivers-for-the-Master-Branch"><a href="#2-1-Drivers-for-the-Master-Branch" class="headerlink" title="2.1 Drivers for the Master Branch"></a>2.1 Drivers for the Master Branch</h3><p>If you synced from <code>master</code>, download drivers from the <a href="https://developers.google.cn/android/blobs-preview">AOSP Preview Page</a>.</p><h3 id="2-2-Drivers-for-a-Specific-Tag"><a href="#2-2-Drivers-for-a-Specific-Tag" class="headerlink" title="2.2 Drivers for a Specific Tag"></a>2.2 Drivers for a Specific Tag</h3><p>If you used the <code>-b</code> flag with a Tag like <code>android-12.0.0_r3</code>, you must find the driver matching that Tag’s Build ID (e.g., <code>SP1A.210812.016.A1</code>). Download them from the <a href="https://developers.google.cn/android/drivers">Full Driver Page</a>.</p><h3 id="2-3-Extracting-Drivers"><a href="#2-3-Extracting-Drivers" class="headerlink" title="2.3 Extracting Drivers"></a>2.3 Extracting Drivers</h3><p>Extract the downloaded files into your source root. You will get two <code>.sh</code> scripts. Run them, scroll through the license (using <code>D</code>), and type <code>I ACCEPT</code>.</p><figure class="highlight bash"><table><tr><td class="gutter"><pre><span class="line">1</span><br><span class="line">2</span><br><span class="line">3</span><br></pre></td><td class="code"><pre><span class="line"><span class="comment"># Example for Pixel 3 XL</span></span><br><span class="line">./extract-google_devices-crosshatch.sh</span><br><span class="line">./extract-qcom-crosshatch.sh</span><br></pre></td></tr></table></figure><hr><h2 id="3-Compiling-the-Code"><a href="#3-Compiling-the-Code" class="headerlink" title="3. Compiling the Code"></a>3. Compiling the Code</h2><p>Now that the source and drivers are ready, let’s start the build. As a reminder, macOS is no longer supported for building newer Android versions; use Ubuntu.</p><h3 id="3-1-Initializing-the-Build-Environment"><a href="#3-1-Initializing-the-Build-Environment" class="headerlink" title="3.1 Initializing the Build Environment"></a>3.1 Initializing the Build Environment</h3><p>Run this on Ubuntu 18.04+:</p><figure class="highlight bash"><table><tr><td class="gutter"><pre><span class="line">1</span><br></pre></td><td class="code"><pre><span class="line">sudo apt-get install git-core gnupg flex bison build-essential zip curl zlib1g-dev gcc-multilib g++-multilib libc6-dev-i386 libncurses5 lib32ncurses5-dev x11proto-core-dev libx11-dev lib32z1-dev libgl1-mesa-dev libxml2-utils xsltproc unzip fontconfig</span><br></pre></td></tr></table></figure><h3 id="3-2-Setting-Up-the-Shell-Environment"><a href="#3-2-Setting-Up-the-Shell-Environment" class="headerlink" title="3.2 Setting Up the Shell Environment"></a>3.2 Setting Up the Shell Environment</h3><p>Every time you open a new terminal, you must run:</p><figure class="highlight bash"><table><tr><td class="gutter"><pre><span class="line">1</span><br></pre></td><td class="code"><pre><span class="line"><span class="built_in">source</span> build/envsetup.sh</span><br></pre></td></tr></table></figure><h3 id="3-3-Selecting-a-Target"><a href="#3-3-Selecting-a-Target" class="headerlink" title="3.3 Selecting a Target"></a>3.3 Selecting a Target</h3><figure class="highlight bash"><table><tr><td class="gutter"><pre><span class="line">1</span><br></pre></td><td class="code"><pre><span class="line">lunch</span><br></pre></td></tr></table></figure><p>Select the target corresponding to your device. For Pixel 3 XL, the codename is <strong>crosshatch</strong>. Choose <code>aosp_crosshatch-userdebug</code>.</p><h3 id="3-4-Starting-the-Build"><a href="#3-4-Starting-the-Build" class="headerlink" title="3.4 Starting the Build"></a>3.4 Starting the Build</h3><p>Use <code>m</code> to build the entire system. It automatically handles parallel tasks, though you can specify them with <code>-jN</code>.</p><figure class="highlight bash"><table><tr><td class="gutter"><pre><span class="line">1</span><br></pre></td><td class="code"><pre><span class="line">m</span><br></pre></td></tr></table></figure><ul><li><code>m droid</code>: Standard build.</li><li><code>m all</code>: Builds everything, including modules not marked for the device image.</li><li><code>m clean</code>: Deletes all output and intermediate files (same as <code>rm -rf out/</code>).</li></ul><p>Wait for the build to finish. Total time depends on your CPU and RAM (32GB+ is highly recommended). Once completed, you’ll see a success message.</p><hr><h2 id="4-Flashing-the-Device"><a href="#4-Flashing-the-Device" class="headerlink" title="4. Flashing the Device"></a>4. Flashing the Device</h2><p>A local <code>userdebug</code> build is perfect for debugging the Framework or apps. To flash your device (using Pixel 3 XL as an example):</p><figure class="highlight bash"><table><tr><td class="gutter"><pre><span class="line">1</span><br><span class="line">2</span><br><span class="line">3</span><br><span class="line">4</span><br><span class="line">5</span><br><span class="line">6</span><br><span class="line">7</span><br></pre></td><td class="code"><pre><span class="line">adb reboot fastboot</span><br><span class="line"></span><br><span class="line"><span class="comment"># Once in fastboot mode</span></span><br><span class="line">fastboot flashall -w</span><br><span class="line"></span><br><span class="line"><span class="comment"># After flashing</span></span><br><span class="line">fastboot reboot</span><br></pre></td></tr></table></figure><p>The device will reboot into your custom Android 12 build. Note that the AOSP Launcher is quite basic compared to the official Pixel Launcher because it lacks Google’s proprietary enhancements.</p><p>If you encounter issues during flashing, you can always restore your device using <a href="https://developers.google.cn/android/images">Official Google Factory Images</a>.</p><hr><h2 id="5-What’s-Next"><a href="#5-What’s-Next" class="headerlink" title="5. What’s Next?"></a>5. What’s Next?</h2><p>This guide focused on downloading, compiling, and flashing. I will cover how to import code into an IDE, modify modules, and debug in a follow-up article.</p><hr><h1 id="About-Me-amp-amp-Blog"><a href="#About-Me-amp-amp-Blog" class="headerlink" title="About Me &amp;&amp; Blog"></a>About Me &amp;&amp; Blog</h1><p>Below are my personal details and links. I look forward to connecting and sharing knowledge with fellow developers!</p><ol><li><a href="https://www.androidperformance.com/en/about/">About Me</a>: Includes my WeChat and WeChat group links.</li><li><a href="https://www.androidperformance.com/en/2019/12/01/BlogMap/">Blog Navigation</a>: A guide to the content on this blog.</li><li><a href="https://www.androidperformance.com/en/2018/05/07/Android-performance-optimization-skills-and-tools/">Curated Android Performance Articles</a>: A collection of must-read performance optimization articles. Self-nominations&#x2F;recommendations are welcome!</li><li><a href="https://www.androidperformance.com/en/2023/12/30/the-performance/">Android Performance Knowledge Planet</a>: Join our community for more insights.</li></ol><blockquote><p><strong>“If you want to go fast, go alone. If you want to go far, go together.”</strong></p></blockquote><p><img src="/en/images/WechatIMG581.webp" alt="WeChat QR Code"></p>]]></content>
    
    
    <summary type="html">&lt;p&gt;Android 12 has been officially released, and the source code is now available on the &lt;a href=&quot;https://source.android.google.cn/&quot;&gt;AOSP website&lt;/a&gt;. This article will guide you through the process of downloading and compiling the latest Android 12 code.&lt;/p&gt;
&lt;p&gt;Compiling the code locally offers several advantages:&lt;/p&gt;
&lt;ol&gt;
&lt;li&gt;&lt;strong&gt;Direct Debugging&lt;/strong&gt;: You can flash the build onto a physical device for local debugging and import the code into Android Studio.&lt;/li&gt;
&lt;li&gt;&lt;strong&gt;Userdebug Builds&lt;/strong&gt;: You can compile a &lt;code&gt;userdebug&lt;/code&gt; version, which allows for &lt;code&gt;root&lt;/code&gt; and &lt;code&gt;remount&lt;/code&gt; access. This is invaluable for debugging both the system and apps, as it reveals information hidden in standard &lt;code&gt;user&lt;/code&gt; builds—useful for competitive analysis and behavioral studies.&lt;/li&gt;
&lt;li&gt;&lt;strong&gt;Deep Learning&lt;/strong&gt;: It facilitates a deeper understanding of Android source code by allowing you to enable system-level debug logs, add your own logs, or even modify system workflows.&lt;/li&gt;
&lt;/ol&gt;</summary>


    <category term="Android" scheme="https://androidperformance.com/en/categories/Android/"/>
    
    
    <category term="Android" scheme="https://androidperformance.com/en/tags/Android/"/>
    
    <category term="Memory" scheme="https://androidperformance.com/en/tags/Memory/"/>
    
    <category term="Linux" scheme="https://androidperformance.com/en/tags/Linux/"/>
    
  </entry>
  
  <entry>
    <title>Android Systrace Responsiveness in Action 3 - Extended Knowledge on Responsiveness</title>
    <link href="https://androidperformance.com/en/2021/09/13/android-systrace-Responsiveness-in-action-3/"/>
    <id>https://androidperformance.com/en/2021/09/13/android-systrace-Responsiveness-in-action-3/</id>
    <published>2021-09-13T02:46:47.000Z</published>
    <updated>2026-05-10T23:29:51.065Z</updated>
    
    <content type="html"><![CDATA[<p>When discussing Android performance, <strong>Jank</strong>, <strong>Responsiveness</strong>, and <strong>ANR</strong> are usually grouped together because their causes are similar. They are simply categorized based on severity: Jank, Slow Response, and ANR. We can define “Broad Jank” to include all three. If a user reports that a phone or App is “stuttering,” they are likely referring to Broad Jank, and we must identify which specific issue is occurring.</p><p>If it’s stuttering during animation or list scrolling, we define it as <strong>Narrow Jank</strong> (referred to as <strong>Jank</strong>). If it’s slow app startup, slow screen wake-up, or slow scene switching, we define it as <strong>Slow Responsiveness</strong> (referred to as <strong>Slow</strong>). If it’s an ANR, it’s an <strong>Application Not Responding</strong> issue. Each situation requires different analysis and resolution methods.</p><p>Furthermore, within Apps or manufacturers, <strong>Jank</strong>, <strong>Responsiveness</strong>, and <strong>ANR</strong> have individual metrics like <strong>Frame Drop Rate</strong>, <strong>Startup Speed</strong>, and <strong>ANR Rate</strong>. Mastering the analysis and optimization of these issues is crucial for developers.</p><p><strong>This is the third article in the Responsiveness series, focusing on extended knowledge when using Systrace to analyze app responsiveness, including startup speed testing, log interpretation, state analysis, and third-party startup libraries.</strong></p> <span id="more"></span><h2 id="Table-of-Contents"><a href="#Table-of-Contents" class="headerlink" title="Table of Contents"></a>Table of Contents</h2><ul><li><a href="#states">1. Interpretation of the Three Process States in Systrace</a></li><li><a href="#traceview">2. Using TraceView for Responsiveness Analysis</a></li><li><a href="#simpleperf">3. Using SimplePerf for Startup Speed Analysis</a></li><li><a href="#components">4. Locating Other Component Startups in Systrace</a></li><li><a href="#appstartup">5. Can AppStartup Optimize Startup Speed?</a></li><li><a href="#idlehandler">6. Using IdleHandler in App Startup Scenarios</a></li><li><a href="#series">Series Articles</a></li><li><a href="#refs">References</a></li><li><a href="#about">About Me &amp;&amp; Blog</a></li></ul><p>If you are not familiar with the basic use of Systrace (Perfetto), please catch up on the <a href="https://www.androidperformance.com/en/2019/05/26/Android_Systrace_0/">Systrace Basics Series</a> first. This article assumes you are already familiar with using Systrace (Perfetto).</p><p><strong>Systrace Series Articles:</strong></p><ol><li><a href="https://www.androidperformance.com/en/2019/05/28/Android-Systrace-About/">Introduction to Systrace</a></li><li><a href="https://www.androidperformance.com/en/2019/07/23/Android-Systrace-Pre/">Systrace Basics - Prerequisites for Systrace</a></li><li><a href="https://www.androidperformance.com/en/2019/05/27/why-60-fps/">Systrace Basics - Why 60 fps?</a></li><li><a href="https://www.androidperformance.com/en/2019/06/29/Android-Systrace-SystemServer/">Android Systrace Basics - SystemServer Explained</a></li><li><a href="https://www.androidperformance.com/en/2020/02/14/Android-Systrace-SurfaceFlinger/">Systrace Basics - SurfaceFlinger Explained</a></li><li><a href="https://www.androidperformance.com/en/2019/11/04/Android-Systrace-Input/">Systrace Basics - Input Explained</a></li><li><a href="https://www.androidperformance.com/en/2019/12/01/Android-Systrace-Vsync/">Systrace Basics - Vsync Explained</a></li><li><a href="https://www.androidperformance.com/en/2019/10/22/Android-Choreographer/">Systrace Basics - Vsync-App: Detailed Explanation of Choreographer-Based Rendering Mechanism</a></li><li><a href="https://www.androidperformance.com/en/2019/11/06/Android-Systrace-MainThread-And-RenderThread/">Systrace Basics - MainThread and RenderThread Explained</a></li><li><a href="https://www.androidperformance.com/en/2019/12/06/Android-Systrace-Binder/">Systrace Basics - Binder and Lock Contention Explained</a></li><li><a href="https://www.androidperformance.com/en/2019/12/15/Android-Systrace-Triple-Buffer">Systrace Basics - Triple Buffer Explained</a></li><li><a href="https://www.androidperformance.com/en/2019/12/21/Android-Systrace-CPU">Systrace Basics - CPU Info Explained</a></li><li><a href="https://www.androidperformance.com/en/2021/04/24/android-systrace-smooth-in-action-1/">Systrace Smoothness in Action 1: Understanding Jank Principles</a></li><li><a href="https://www.androidperformance.com/en/2021/04/24/android-systrace-smooth-in-action-2/">Systrace Smoothness in Action 2: Case Analysis - MIUI Launcher Scroll Jank Analysis</a></li><li><a href="https://www.androidperformance.com/en/2021/04/24/android-systrace-smooth-in-action-3/">Systrace Smoothness in Action 3: FAQs During Jank Analysis</a></li><li><a href="https://www.androidperformance.com/en/2021/09/13/android-systrace-Responsiveness-in-action-1/">Systrace Responsiveness in Action 1: Understanding Responsiveness Principles</a></li><li><a href="https://www.androidperformance.com/en/2021/09/13/android-systrace-Responsiveness-in-action-2/">Systrace Responsiveness in Action 2: Responsiveness Analysis - Using App Startup as an Example</a></li><li><a href="https://www.androidperformance.com/en/2021/09/13/android-systrace-Responsiveness-in-action-3/">Systrace Responsiveness in Action 3: Extended Knowledge on Responsiveness</a></li><li><a href="https://www.androidperformance.com/en/2022/01/21/android-systrace-cpu-state-runnable/">Systrace Thread CPU State Analysis Tips - Runnable</a></li><li><a href="https://www.androidperformance.com/en/2022/03/13/android-systrace-cpu-state-running/">Systrace Thread CPU State Analysis Tips - Running</a></li><li><a href="https://www.androidperformance.com/en/2022/03/13/android-systrace-cpu-state-sleep/">Systrace Thread CPU State Analysis Tips - Sleep and Uninterruptible Sleep</a></li></ol><p><a id="states"></a></p><h1 id="1-Interpretation-of-the-Three-Process-States-in-Systrace"><a href="#1-Interpretation-of-the-Three-Process-States-in-Systrace" class="headerlink" title="1. Interpretation of the Three Process States in Systrace"></a>1. Interpretation of the Three Process States in Systrace</h1><p>In Systrace, a process task typically exhibits three states: <strong>Sleep</strong>, <strong>Running</strong>, and <strong>Runnable</strong>. These are color-coded at the top of the task trace:</p><ol><li><strong>Green</strong>: Running</li><li><strong>Blue</strong>: Runnable</li><li><strong>White</strong>: Sleep</li></ol><h2 id="1-1-Analyzing-the-Sleep-State"><a href="#1-1-Analyzing-the-Sleep-State" class="headerlink" title="1.1 Analyzing the Sleep State"></a>1.1 Analyzing the Sleep State</h2><p>White (Sleep) segments are either <strong>active</strong> or <strong>passive</strong>.</p><ol><li><strong>Active Sleep</strong> (e.g., <code>nativePoll</code>): The app has no more messages to process and is sleeping while waiting for a new Message. This is normal and usually ignored (e.g., segments between frames).</li><li><strong>Passive Sleep</strong>: Triggered by user code <code>sleep()</code> or Binder communication with other processes. This is common and critical for performance analysis.</li></ol><p>As shown below, long sleep periods during startup often correlate with Binder communication. Frequent Binder calls prolong response times.</p><p><img src="/en/images/QBslSMaNhoheCWfY.webp" alt="Binder Sleep Trace"></p><p>You can click the <code>binder transaction</code> marker at the bottom of the task to view details:</p><p><img src="/en/images/FqqYKpVnNGUuivrq.webp" alt="Binder Transaction Detail"></p><p>If Binder info is missing but the task is woken by another thread, check the <strong>Wakeup</strong> info to find the dependency.</p><p><img src="/en/images/zPFoHiQJvTWMmUuF.webp" alt="Wakeup Info Trace"></p><p>Zooming into the Runnable marker from the previous image:</p><p><img src="/en/images/YJH0UWMlVDuJjSro.webp" alt="Waking Thread Detail"></p><h2 id="1-2-Analyzing-the-Running-State"><a href="#1-2-Analyzing-the-Running-State" class="headerlink" title="1.2 Analyzing the Running State"></a>1.2 Analyzing the Running State</h2><p>The Running state indicates the task is currently executing on a CPU core. If a Running segment is unexpectedly long, consider:</p><ol><li>Increased App logic&#x2F;complexity.</li><li>Core scheduling anomalies (e.g., running on the wrong core).</li></ol><p><img src="/en/images/NDvF1X4GFiUpC6vN.webp" alt="Running State Trace"></p><p><img src="/en/images/K49yBsgPUrHkYyw6.webp" alt="Core Scheduling Map"></p><p>On some Android devices, UI and Render threads are prioritized for Big Cores when the app is in the foreground.</p><h2 id="1-3-Analyzing-the-Runnable-State"><a href="#1-3-Analyzing-the-Runnable-State" class="headerlink" title="1.3 Analyzing the Runnable State"></a>1.3 Analyzing the Runnable State</h2><p>A task must transition from Sleep to Runnable before entering the Running state:</p><p><img src="/en/images/3gilFNQA8lh1A7l0.webp" alt="State Transition Diagram"></p><p>Systrace representation:</p><p><img src="/en/images/GR7crsOwDOy4X8qL.webp" alt="Runnable Transition Trace"></p><p>Normally, a task enters Running almost immediately after becoming Runnable. In a congested system with saturated CPUs, tasks must wait in Runnable for an available core.</p><p>If startup shows heavy Runnable segments, check the overall system load.</p><p><a id="traceview"></a></p><h1 id="2-Using-TraceView-for-Responsiveness-Analysis"><a href="#2-Using-TraceView-for-Responsiveness-Analysis" class="headerlink" title="2. Using TraceView for Responsiveness Analysis"></a>2. Using TraceView for Responsiveness Analysis</h1><p>“TraceView” refers to the CPU profiling visualization within the Android Studio Profiler.</p><p><img src="/en/images/image-20211028011509615.webp" alt="AS CPU Profiler"></p><h2 id="2-1-Capturing-TraceView-During-Startup"><a href="#2-1-Capturing-TraceView-During-Startup" class="headerlink" title="2.1 Capturing TraceView During Startup"></a>2.1 Capturing TraceView During Startup</h2><p>Use the following command to profile a cold start (replace package&#x2F;activity names with your own):</p><figure class="highlight shell"><table><tr><td class="gutter"><pre><span class="line">1</span><br></pre></td><td class="code"><pre><span class="line">adb shell am start -n com.aboback.wanandroidjetpack/.splash.SplashActivity --start-profiler /data/local/tmp/traceview.trace --sampling 1 &amp;&amp; sleep 10 &amp;&amp; adb shell am profile stop com.aboback.wanandroidjetpack &amp;&amp; adb pull /data/local/tmp/traceview.trace .</span><br></pre></td></tr></table></figure><p>Or execute steps individually:</p><figure class="highlight shell"><table><tr><td class="gutter"><pre><span class="line">1</span><br><span class="line">2</span><br><span class="line">3</span><br><span class="line">4</span><br><span class="line">5</span><br><span class="line">6</span><br><span class="line">7</span><br><span class="line">8</span><br><span class="line">9</span><br><span class="line">10</span><br></pre></td><td class="code"><pre><span class="line"><span class="meta prompt_"># </span><span class="language-bash">1. Start App with 1ms sampling</span></span><br><span class="line">adb shell am start -n com.aboback.wanandroidjetpack/.splash.SplashActivity --start-profiler /data/local/tmp/traceview.trace --sampling 1</span><br><span class="line"><span class="meta prompt_"></span></span><br><span class="line"><span class="meta prompt_"># </span><span class="language-bash">2. End profiling after full load</span></span><br><span class="line">adb shell am profile stop com.aboback.wanandroidjetpack</span><br><span class="line"><span class="meta prompt_"></span></span><br><span class="line"><span class="meta prompt_"># </span><span class="language-bash">3. Pull the trace</span></span><br><span class="line">adb pull /data/local/tmp/traceview.trace .</span><br><span class="line"><span class="meta prompt_"></span></span><br><span class="line"><span class="meta prompt_"># </span><span class="language-bash">4. Open <span class="keyword">in</span> Android Studio</span></span><br></pre></td></tr></table></figure><h2 id="2-2-Interpreting-TraceView"><a href="#2-2-Interpreting-TraceView" class="headerlink" title="2.2 Interpreting TraceView"></a>2.2 Interpreting TraceView</h2><p>Green markers denote App functions; yellow markers denote System functions.</p><p><strong>Application.onCreate</strong><br><img src="/en/images/vRpdMHl8CTzCGcxS.webp" alt="Application onCreate TraceView"></p><p><strong>Activity.onCreate</strong><br><img src="/en/images/Jl9s7vZbMQTTrWIT.webp" alt="Activity onCreate TraceView"></p><p><strong>doFrame</strong><br><img src="/en/images/X4f8vX27JS5x4TyF.webp" alt="doFrame TraceView"></p><p><strong>WebView Initialization</strong><br><img src="/en/images/jxmFl0K9M8cpNCWy.webp" alt="WebView Init TraceView"></p><h2 id="2-3-Pros-and-Cons"><a href="#2-3-Pros-and-Cons" class="headerlink" title="2.3 Pros and Cons"></a>2.3 Pros and Cons</h2><p>TraceView uses high-frequency sampling, introducing significant performance overhead. Consequently, <strong>the execution times of individual methods are NOT accurate</strong> and should not be used as a real-time reference. Use it exclusively to visualize call stacks and pair it with Systrace for timing data.</p><p><a id="simpleperf"></a></p><h1 id="3-Using-SimplePerf-for-Startup-Speed-Analysis"><a href="#3-Using-SimplePerf-for-Startup-Speed-Analysis" class="headerlink" title="3. Using SimplePerf for Startup Speed Analysis"></a>3. Using SimplePerf for Startup Speed Analysis</h1><p>SimplePerf captures both Java and Native stack traces.</p><p>To profile <code>com.aboback.wanandroidjetpack</code> (refer to <a href="https://android.googlesource.com/platform/system/extras/+/master/simpleperf/doc/android_application_profiling.md">SimplePerf Documentation</a>):</p><figure class="highlight shell"><table><tr><td class="gutter"><pre><span class="line">1</span><br></pre></td><td class="code"><pre><span class="line">python app_profiler.py -p com.aboback.wanandroidjetpack</span><br></pre></td></tr></table></figure><p>Manually launch and then terminate the app:</p><figure class="highlight shell"><table><tr><td class="gutter"><pre><span class="line">1</span><br><span class="line">2</span><br><span class="line">3</span><br><span class="line">4</span><br><span class="line">5</span><br><span class="line">6</span><br></pre></td><td class="code"><pre><span class="line"><span class="meta prompt_">$ </span><span class="language-bash">python app_profiler.py -p com.aboback.wanandroidjetpack</span></span><br><span class="line">INFO:root:prepare profiling</span><br><span class="line">INFO:root:start profiling1</span><br><span class="line">INFO:root:run adb cmd: [&#x27;adb&#x27;, &#x27;shell&#x27;, &#x27;/data/local/tmp/simpleperf&#x27;, &#x27;record&#x27;, &#x27;-o&#x27;, &#x27;/data/local/tmp/perf.data&#x27;, &#x27;-e task-clock:u -f 1000 -g --duration 10&#x27;, &#x27;--log&#x27;, &#x27;info&#x27;, &#x27;--app&#x27;, &#x27;com.aboback.wanandroidjetpack&#x27;]</span><br><span class="line">simpleperf I environment.cpp:601] Waiting for process of app com.aboback.wanandroidjetpack</span><br><span class="line">simpleperf I environment.cpp:593] Got process 32112 for package com.aboback.wanandroidjetpack</span><br></pre></td></tr></table></figure><p>Generate the HTML report:</p><figure class="highlight shell"><table><tr><td class="gutter"><pre><span class="line">1</span><br></pre></td><td class="code"><pre><span class="line">python report_html.py</span><br></pre></td></tr></table></figure><p>Result:<br><img src="/en/images/itcLtktb5xxv5gp0.webp" alt="SimplePerf Report Example"></p><p>SimplePerf captures both Java and Native stacks. For advanced usage, see:</p><ul><li><a href="https://android.googlesource.com/platform/system/extras/+/master/simpleperf/doc/README.md">SimplePerf README</a></li><li><a href="https://android.googlesource.com/platform/system/extras/+/master/simpleperf/doc/android_application_profiling.md">Android Application Profiling</a></li><li><a href="https://android.googlesource.com/platform/system/extras/+/master/simpleperf/doc/android_platform_profiling.md">Android Platform Profiling</a></li></ul><p><a id="components"></a></p><h1 id="4-Locating-Other-Component-Startups-in-Systrace"><a href="#4-Locating-Other-Component-Startups-in-Systrace" class="headerlink" title="4. Locating Other Component Startups in Systrace"></a>4. Locating Other Component Startups in Systrace</h1><h2 id="4-1-Service-Startup"><a href="#4-1-Service-Startup" class="headerlink" title="4.1 Service Startup"></a>4.1 Service Startup</h2><figure class="highlight java"><table><tr><td class="gutter"><pre><span class="line">1</span><br><span class="line">2</span><br><span class="line">3</span><br><span class="line">4</span><br><span class="line">5</span><br><span class="line">6</span><br><span class="line">7</span><br><span class="line">8</span><br><span class="line">9</span><br></pre></td><td class="code"><pre><span class="line"><span class="keyword">public</span> <span class="keyword">final</span> <span class="keyword">void</span> <span class="title function_">scheduleCreateService</span><span class="params">(...)</span> &#123;</span><br><span class="line">    ...</span><br><span class="line">    sendMessage(H.CREATE_SERVICE, s);</span><br><span class="line">&#125;</span><br><span class="line"></span><br><span class="line"><span class="keyword">public</span> <span class="keyword">final</span> <span class="keyword">void</span> <span class="title function_">scheduleBindService</span><span class="params">(...)</span> &#123;</span><br><span class="line">    ...</span><br><span class="line">    sendMessage(H.BIND_SERVICE, s);</span><br><span class="line">&#125;</span><br></pre></td></tr></table></figure><p>Service operations are sent as Messages to the <code>H</code> Handler. They don’t execute immediately but are processed in the order defined by the <code>MessageQueue</code>.</p><p><img src="/en/images/NRY3YuU1Bsgk6wvv.webp" alt="Service Message Trace"></p><p>Execution typically follows the first frame (after the queue catches up). Subsequent messages represent custom App logic, Service starts, and BroadcastReceivers.</p><p><img src="/en/images/r463HjnnO0KgdOFl.webp" alt="Service Process Trace"></p><h2 id="4-2-Custom-Messages"><a href="#4-2-Custom-Messages" class="headerlink" title="4.2 Custom Messages"></a>4.2 Custom Messages</h2><p>Custom App Messages in Systrace:</p><p><img src="/en/images/iUZhyqUStVIyZHtf.webp" alt="Custom Message Trace"></p><h2 id="4-3-Service-Startup-Visualized"><a href="#4-3-Service-Startup-Visualized" class="headerlink" title="4.3 Service Startup Visualized"></a>4.3 Service Startup Visualized</h2><p><img src="/en/images/8RzVxF9ai3r420W0.webp" alt="Service Trace Marker"></p><h2 id="4-4-BroadcastReceiver-Execution"><a href="#4-4-BroadcastReceiver-Execution" class="headerlink" title="4.4 BroadcastReceiver Execution"></a>4.4 BroadcastReceiver Execution</h2><p>Receiver execution in Systrace:</p><p><img src="/en/images/kY3rkAhlqk7klnOL.webp" alt="Receiver Trace Marker"></p><p>Dynamic registration (usually in lifecycle functions) executes where registered.</p><p><img src="/en/images/UR245WLGUvPEcvTz.webp" alt="Receiver Registration Trace"></p><h2 id="4-5-ContentProvider-Startup-Timing"><a href="#4-5-ContentProvider-Startup-Timing" class="headerlink" title="4.5 ContentProvider Startup Timing"></a>4.5 ContentProvider Startup Timing</h2><p><img src="/en/images/6PdzLLkZ7hdA61Tk.webp" alt="Provider Init Trace 1"></p><p><img src="/en/images/019y0cn5kNNGFVnm.webp" alt="Provider Init Trace 2"></p><p><a id="appstartup"></a></p><h1 id="5-Can-AppStartup-Optimize-Startup-Speed"><a href="#5-Can-AppStartup-Optimize-Startup-Speed" class="headerlink" title="5. Can AppStartup Optimize Startup Speed?"></a>5. Can AppStartup Optimize Startup Speed?</h1><h4 id="Third-Party-Library-Initialization"><a href="#Third-Party-Library-Initialization" class="headerlink" title="Third-Party Library Initialization"></a>Third-Party Library Initialization</h4><p>Many libraries require <code>Application</code> context for initialization. Some libraries initialize “stealthily” using a <code>ContentProvider</code>. By defining a provider and calling initialization in its <code>onCreate</code>, the library ensures it’s ready without explicit developer action, as the system calls <code>onCreate</code> for all registered providers during App startup.</p><p>Facebook, Firebase, and WorkManager commonly use this trick.</p><p>Provider initialization timing:</p><p><img src="/en/images/VhpUlBTz1UNteVQz.webp" alt="Provider Init Flow"></p><p>However, this leads to:</p><ol><li>Too many ContentProviders during startup.</li><li>Loss of control over initialization timing for developers.</li><li>Inability to manage library dependencies.</li></ol><h4 id="AppStartup-Library"><a href="#AppStartup-Library" class="headerlink" title="AppStartup Library"></a>AppStartup Library</h4><p>Google introduced <a href="https://developer.android.google.cn/topic/libraries/app-startup">AppStartup</a> to address this:</p><ul><li><strong>Shared ContentProvider</strong>: Consolidates initialization into a single provider.</li><li><strong>Explicit Sequence</strong>: Defines exact initialization order.</li><li><strong>Lazy Loading</strong>: Optionally removes automatic initialization to manually trigger it later, optimizing startup speed.</li></ul><p>Measurements show AppStartup doesn’t significantly speed up startup unless you have many (e.g., 50+) ContentProviders.</p><p>If an SDK’s provider slows you down, consider removing it from the merge and manually initializing it:</p><figure class="highlight xml"><table><tr><td class="gutter"><pre><span class="line">1</span><br><span class="line">2</span><br><span class="line">3</span><br><span class="line">4</span><br><span class="line">5</span><br><span class="line">6</span><br><span class="line">7</span><br><span class="line">8</span><br></pre></td><td class="code"><pre><span class="line"><span class="tag">&lt;<span class="name">provider</span></span></span><br><span class="line"><span class="tag">    <span class="attr">android:name</span>=<span class="string">&quot;androidx.startup.InitializationProvider&quot;</span></span></span><br><span class="line"><span class="tag">    <span class="attr">android:authorities</span>=<span class="string">&quot;$&#123;applicationId&#125;.androidx-startup&quot;</span></span></span><br><span class="line"><span class="tag">    <span class="attr">android:exported</span>=<span class="string">&quot;false&quot;</span></span></span><br><span class="line"><span class="tag">    <span class="attr">tools:node</span>=<span class="string">&quot;merge&quot;</span>&gt;</span></span><br><span class="line">    <span class="tag">&lt;<span class="name">meta-data</span> <span class="attr">android:name</span>=<span class="string">&quot;com.example.ExampleLoggerInitializer&quot;</span></span></span><br><span class="line"><span class="tag">              <span class="attr">tools:node</span>=<span class="string">&quot;remove&quot;</span> /&gt;</span></span><br><span class="line"><span class="tag">&lt;/<span class="name">provider</span>&gt;</span></span><br></pre></td></tr></table></figure><h3 id="Summary"><a href="#Summary" class="headerlink" title="Summary"></a>Summary</h3><ol><li><strong>Purpose</strong>: Solves “ContentProvider Bloat” from multiple libraries.</li><li><strong>Benefit</strong>: Minor. Usually $&lt; 20$ms even with 20-30 libraries.</li><li><strong>Best Use Scenarios</strong>:<ul><li>APK has excessive ContentProviders.</li><li>Individual Providers are heavy but not critical for startup (can be lazy-loaded).</li><li>Deep control over initialization order is required.</li></ul></li></ol><h4 id="Action-Items-for-App-Developers"><a href="#Action-Items-for-App-Developers" class="headerlink" title="Action Items for App Developers:"></a>Action Items for App Developers:</h4><ol><li>Check the merged manifest for ContentProvider count ( AS -&gt; <code>src\main\AndroidManifest.xml</code> -&gt; <strong>Merged Manifest</strong> tab).</li><li>Measure initialization time for each.</li><li>Identify lazy-loading candidates.</li><li>Integrate AppStartup if needed.</li></ol><p><a id="idlehandler"></a></p><h1 id="6-Using-IdleHandler-in-App-Startup-Scenarios"><a href="#6-Using-IdleHandler-in-App-Startup-Scenarios" class="headerlink" title="6. Using IdleHandler in App Startup Scenarios"></a>6. Using IdleHandler in App Startup Scenarios</h1><p><code>IdleHandler</code> executes tasks when the <code>MessageQueue</code> is idle.</p><p><img src="/en/images/XaSQsq3pfgDgCNVe.webp" alt="IdleHandler Timing in Systrace"></p><p>Usage scenarios:</p><ol><li><p><strong>Lazy Loading</strong>: Add an <code>IdleHandler</code> in <code>Activity.onCreate</code> to run non-critical tasks once the queue is clear.</p><p><img src="/en/images/7fLroBfAyXPaUu8W.webp" alt="IdleHandler Lazy Load Example"></p></li><li><p><strong>Accurate Startup Metrics</strong>: Call <code>activity.reportFullyDrawn()</code> once the first page list&#x2F;content is stable.</p><p><img src="/en/images/BN97DrcXfHiqA5DY.webp" alt="reportFullyDrawn Code Example"></p><p>Systrace reflects this:</p><p><img src="/en/images/1xrN3YMzAY71ZAWi.webp" alt="reportFullyDrawn Trace Marker"></p><p>This records a meaningful cold start time:</p><p><img src="/en/images/A5mH2AW4U06l43jk.webp" alt="Accurate Startup Metrics"></p></li></ol><p>Some system features also rely on <code>FullyDrawn</code> reports; they are highly recommended.</p><p><a id="series"></a></p><h1 id="Series-Articles"><a href="#Series-Articles" class="headerlink" title="Series Articles"></a>Series Articles</h1><ol><li><a href="https://www.androidperformance.com/en/2021/09/13/android-systrace-Responsiveness-in-action-1/">Systrace Responsiveness in Action 1: Understanding Responsiveness Principles</a></li><li><a href="https://www.androidperformance.com/en/2021/09/13/android-systrace-Responsiveness-in-action-2/">Systrace Responsiveness in Action 2: Responsiveness Analysis - Using App Startup as an Example</a></li><li><a href="https://www.androidperformance.com/en/2021/09/13/android-systrace-Responsiveness-in-action-3/">Systrace Responsiveness in Action 3: Extended Knowledge on Responsiveness</a></li><li><a href="https://www.androidperformance.com/en/2019/05/26/Android_Systrace_0/">Link to Systrace Basics Series</a></li></ol><p><a id="refs"></a></p><h1 id="References"><a href="#References" class="headerlink" title="References"></a>References</h1><ol><li><a href="https://www.jianshu.com/p/37370c1d17fc">Analysis of Android App Startup Flow</a></li><li><a href="https://juejin.cn/post/6907493155659055111">Investigation: Can App Startup Really Reduce Startup Time?</a></li><li><a href="https://blog.csdn.net/guolin_blog/article/details/108026357">Jetpack App Startup Explained</a></li><li><a href="https://developer.android.google.cn/topic/libraries/app-startup">App Startup Official Guide</a></li><li><a href="https://www.androidperformance.com/en/2019/11/18/Android-App-Lunch-Optimize/">Complete Record of Android App Startup Optimization</a></li><li><a href="https://android.googlesource.com/platform/system/extras/+/master/simpleperf/doc/android_application_profiling.md">Android Application Profiling</a></li></ol><p><a id="about"></a></p><h1 id="About-Me-amp-amp-Blog"><a href="#About-Me-amp-amp-Blog" class="headerlink" title="About Me &amp;&amp; Blog"></a>About Me &amp;&amp; Blog</h1><p>Below is my personal intro and related links. I look forward to exchanging ideas with fellow professionals. “When three walk together, one can always be my teacher!”</p><ol><li><a href="https://www.androidperformance.com/en/about/">Blogger Intro</a>: Includes personal WeChat and WeChat group links.</li><li><a href="https://www.androidperformance.com/en/2019/12/01/BlogMap/">Blog Content Navigation</a>: A guide for my blog content.</li><li><a href="https://www.androidperformance.com/en/2018/05/07/Android-performance-optimization-skills-and-tools/">Curated Excellent Blog Articles - Android Performance Optimization Must-Knows</a>: Welcome to recommend projects&#x2F;articles.</li><li><a href="https://www.androidperformance.com/en/2023/12/30/the-performance/">Android Performance Optimization Knowledge Planet</a>: Welcome to join and thank you for your support~</li></ol><blockquote><p><strong>One walks faster alone, but a group walks further together.</strong></p></blockquote><p><img src="/en/images/WechatIMG581.webp" alt="Scan WeChat QR Code"></p>]]></content>
    
    
    <summary type="html">&lt;p&gt;When discussing Android performance, &lt;strong&gt;Jank&lt;/strong&gt;, &lt;strong&gt;Responsiveness&lt;/strong&gt;, and &lt;strong&gt;ANR&lt;/strong&gt; are usually grouped together because their causes are similar. They are simply categorized based on severity: Jank, Slow Response, and ANR. We can define “Broad Jank” to include all three. If a user reports that a phone or App is “stuttering,” they are likely referring to Broad Jank, and we must identify which specific issue is occurring.&lt;/p&gt;
&lt;p&gt;If it’s stuttering during animation or list scrolling, we define it as &lt;strong&gt;Narrow Jank&lt;/strong&gt; (referred to as &lt;strong&gt;Jank&lt;/strong&gt;). If it’s slow app startup, slow screen wake-up, or slow scene switching, we define it as &lt;strong&gt;Slow Responsiveness&lt;/strong&gt; (referred to as &lt;strong&gt;Slow&lt;/strong&gt;). If it’s an ANR, it’s an &lt;strong&gt;Application Not Responding&lt;/strong&gt; issue. Each situation requires different analysis and resolution methods.&lt;/p&gt;
&lt;p&gt;Furthermore, within Apps or manufacturers, &lt;strong&gt;Jank&lt;/strong&gt;, &lt;strong&gt;Responsiveness&lt;/strong&gt;, and &lt;strong&gt;ANR&lt;/strong&gt; have individual metrics like &lt;strong&gt;Frame Drop Rate&lt;/strong&gt;, &lt;strong&gt;Startup Speed&lt;/strong&gt;, and &lt;strong&gt;ANR Rate&lt;/strong&gt;. Mastering the analysis and optimization of these issues is crucial for developers.&lt;/p&gt;
&lt;p&gt;&lt;strong&gt;This is the third article in the Responsiveness series, focusing on extended knowledge when using Systrace to analyze app responsiveness, including startup speed testing, log interpretation, state analysis, and third-party startup libraries.&lt;/strong&gt;&lt;/p&gt;</summary>


    <category term="Java" scheme="https://androidperformance.com/en/categories/Java/"/>
    
    
    <category term="Android" scheme="https://androidperformance.com/en/tags/Android/"/>
    
    <category term="Perfetto" scheme="https://androidperformance.com/en/tags/Perfetto/"/>
    
    <category term="Systrace" scheme="https://androidperformance.com/en/tags/Systrace/"/>
    
    <category term="Startup" scheme="https://androidperformance.com/en/tags/Startup/"/>
    
    <category term="ANR" scheme="https://androidperformance.com/en/tags/ANR/"/>
    
  </entry>
  
  <entry>
    <title>Android Systrace Responsiveness in Action 2 - Responsiveness Analysis - Using App Startup as an Example</title>
    <link href="https://androidperformance.com/en/2021/09/13/android-systrace-Responsiveness-in-action-2/"/>
    <id>https://androidperformance.com/en/2021/09/13/android-systrace-Responsiveness-in-action-2/</id>
    <published>2021-09-13T02:46:44.000Z</published>
    <updated>2026-05-10T23:29:51.065Z</updated>
    
    <content type="html"><![CDATA[<p>When discussing Android performance, <strong>Jank</strong>, <strong>Responsiveness</strong>, and <strong>ANR</strong> are usually grouped together because their causes are similar. They are simply categorized based on severity: Jank, Slow Response, and ANR. We can define “Broad Jank” to include all three. If a user reports that a phone or App is “stuttering,” they are likely referring to Broad Jank, and we must identify which specific issue is occurring.</p><p>If it’s stuttering during animation or list scrolling, we define it as <strong>Narrow Jank</strong> (referred to as <strong>Jank</strong>). If it’s slow app startup, slow screen wake-up, or slow scene switching, we define it as <strong>Slow Responsiveness</strong> (referred to as <strong>Slow</strong>). If it’s an ANR, it’s an <strong>Application Not Responding</strong> issue. Each situation requires different analysis and resolution methods.</p><p>Furthermore, within Apps or manufacturers, <strong>Jank</strong>, <strong>Responsiveness</strong>, and <strong>ANR</strong> have individual metrics like <strong>Frame Drop Rate</strong>, <strong>Startup Speed</strong>, and <strong>ANR Rate</strong>. Mastering the analysis and optimization of these issues is crucial for developers.</p><p><strong>This is the second article in the Responsiveness series, using Android App Cold Start as an example to explain how to use Systrace for analysis.</strong>  <span id="more"></span></p><h2 id="Table-of-Contents"><a href="#Table-of-Contents" class="headerlink" title="Table of Contents"></a>Table of Contents</h2><ul><li><a href="#prep">1. Preparation</a></li><li><a href="#cold-start">2. Analysis of Android App Cold Start Flow</a></li><li><a href="#end">End</a></li><li><a href="#series">Series Articles</a></li><li><a href="#refs">References</a></li><li><a href="#about">About Me &amp;&amp; Blog</a></li></ul><p>If you are not familiar with the basic use of Systrace (Perfetto), please catch up on the <a href="https://www.androidperformance.com/en/2019/05/26/Android_Systrace_0/">Systrace Basics Series</a> first. This article assumes you are already familiar with using Systrace (Perfetto).</p><p><strong>Systrace Series Articles:</strong></p><ol><li><a href="https://www.androidperformance.com/en/2019/05/28/Android-Systrace-About/">Introduction to Systrace</a></li><li><a href="https://www.androidperformance.com/en/2019/07/23/Android-Systrace-Pre/">Systrace Basics - Prerequisites for Systrace</a></li><li><a href="https://www.androidperformance.com/en/2019/05/27/why-60-fps/">Systrace Basics - Why 60 fps?</a></li><li><a href="https://www.androidperformance.com/en/2019/06/29/Android-Systrace-SystemServer/">Android Systrace Basics - SystemServer Explained</a></li><li><a href="https://www.androidperformance.com/en/2020/02/14/Android-Systrace-SurfaceFlinger/">Systrace Basics - SurfaceFlinger Explained</a></li><li><a href="https://www.androidperformance.com/en/2019/11/04/Android-Systrace-Input/">Systrace Basics - Input Explained</a></li><li><a href="https://www.androidperformance.com/en/2019/12/01/Android-Systrace-Vsync/">Systrace Basics - Vsync Explained</a></li><li><a href="https://www.androidperformance.com/en/2019/10/22/Android-Choreographer/">Systrace Basics - Vsync-App: Detailed Explanation of Choreographer-Based Rendering Mechanism</a></li><li><a href="https://www.androidperformance.com/en/2019/11/06/Android-Systrace-MainThread-And-RenderThread/">Systrace Basics - MainThread and RenderThread Explained</a></li><li><a href="https://www.androidperformance.com/en/2019/12/06/Android-Systrace-Binder/">Systrace Basics - Binder and Lock Contention Explained</a></li><li><a href="https://www.androidperformance.com/en/2019/12/15/Android-Systrace-Triple-Buffer">Systrace Basics - Triple Buffer Explained</a></li><li><a href="https://www.androidperformance.com/en/2019/12/21/Android-Systrace-CPU">Systrace Basics - CPU Info Explained</a></li><li><a href="https://www.androidperformance.com/en/2021/04/24/android-systrace-smooth-in-action-1/">Systrace Smoothness in Action 1: Understanding Jank Principles</a></li><li><a href="https://www.androidperformance.com/en/2021/04/24/android-systrace-smooth-in-action-2/">Systrace Smoothness in Action 2: Case Analysis - MIUI Launcher Scroll Jank Analysis</a></li><li><a href="https://www.androidperformance.com/en/2021/04/24/android-systrace-smooth-in-action-3/">Systrace Smoothness in Action 3: FAQs During Jank Analysis</a></li><li><a href="https://www.androidperformance.com/en/2021/09/13/android-systrace-Responsiveness-in-action-1/">Systrace Responsiveness in Action 1: Understanding Responsiveness Principles</a></li><li><a href="https://www.androidperformance.com/en/2021/09/13/android-systrace-Responsiveness-in-action-2/">Systrace Responsiveness in Action 2: Responsiveness Analysis - Using App Startup as an Example</a></li><li><a href="https://www.androidperformance.com/en/2021/09/13/android-systrace-Responsiveness-in-action-3/">Systrace Responsiveness in Action 3: Extended Knowledge on Responsiveness</a></li><li><a href="https://www.androidperformance.com/en/2022/01/21/android-systrace-cpu-state-runnable/">Systrace Thread CPU State Analysis Tips - Runnable</a></li><li><a href="https://www.androidperformance.com/en/2022/03/13/android-systrace-cpu-state-running/">Systrace Thread CPU State Analysis Tips - Running</a></li><li><a href="https://www.androidperformance.com/en/2022/03/13/android-systrace-cpu-state-sleep/">Systrace Thread CPU State Analysis Tips - Sleep and Uninterruptible Sleep</a></li></ol><p><a id="prep"></a></p><h1 id="1-Preparation"><a href="#1-Preparation" class="headerlink" title="1. Preparation"></a>1. Preparation</h1><p>This case study and the corresponding Systrace are engineering-focused and omit many details, as App startup involves a vast range of knowledge. For an extremely detailed breakdown, I recommend: <a href="https://www.jianshu.com/p/37370c1d17fc">Complete Analysis of Android App Startup Flow</a>.</p><p>We will use Systrace as our main thread to explain the high-level workflow of key modules during startup. After understanding the overview, you can dive into specific areas of interest. Here is a mapping of Systrace segments to phone screenshots (this blog uses Perfetto and Systrace interchangeably):</p><p><img src="/en/images/OIG57AudX193jD3u.webp" alt="Complete App Startup Visualization"></p><p>To more effectively analyze cold starts, perform these preparations:</p><ol><li><strong>Enable Binder Debugging</strong>: This displays Binder function names in Trace (requires <strong>Root</strong>).<ol><li>Start IPC Debug: <code>adb shell am trace-ipc start</code></li><li>Stop and dump: <code>adb shell am trace-ipc stop --dump-file /data/local/tmp/ipc-trace.txt</code></li></ol></li><li><strong>Add the <code>irq</code> Tag</strong>: Default Trace commands don’t include <code>irq</code>. Adding it reveals interrupt details. Example command:<br> <code>python systrace.py gfx input view webview wm am sm rs bionic power pm ss database network adb idle pdx sched irq freq idle disk workq binder_driver binder_lock -a com.xxx.xxx</code> (replace <code>com.xxx.xxx</code> with your package name or omit <code>-a</code> for global).</li><li><strong>Recommended Tool</strong>: If the App is buildable (your own project), integrate the <strong>TraceFix library</strong> (see <a href="https://github.com/Gracker/TraceFix">Gracker&#x2F;TraceFix</a>). It uses code instrumentation to insert Trace points into every function, providing deep visibility into App logic.<ol><li>Without the plugin: You only see Framework-level Trace points.<br> <img src="/en/images/enHoD7QcxOSVg38n.webp"></li><li>With the plugin: Trace data is significantly enriched with App-specific logic (note: only App logic is instrumented, not Framework code).<br> <img src="/en/images/M3t5klCy3VTETYcN.webp"></li></ol></li></ol><p><a id="cold-start"></a></p><h1 id="2-Analysis-of-Android-App-Cold-Start-Flow"><a href="#2-Analysis-of-Android-App-Cold-Start-Flow" class="headerlink" title="2. Analysis of Android App Cold Start Flow"></a>2. Analysis of Android App Cold Start Flow</h1><p>This case covers <strong>cold starting an Android App from the Launcher</strong>. The flow spans from the first screen touch to the final UI display, involving:</p><ol><li>Touchscreen interrupt handling.</li><li><code>InputReader</code> and <code>InputDispatcher</code> event processing.</li><li>Launcher input handling.</li><li><code>SystemServer</code> startup event processing.</li><li>Startup animations.</li><li>App internal startup and logic.</li></ol><p>As noted in Part 1, the <strong>Start</strong> is the input event, and the <strong>End</strong> is the App being fully interactive for the user.</p><p>We’ll trace this through Systrace’s key stages:</p><h2 id="2-1-Touchscreen-Interrupt-Handling"><a href="#2-1-Touchscreen-Interrupt-Handling" class="headerlink" title="2.1 Touchscreen Interrupt Handling"></a>2.1 Touchscreen Interrupt Handling</h2><p>When a finger touches the screen, the touchscreen triggers an interrupt. The earliest trace in Systrace appears here:</p><p><img src="/en/images/qAyHzNpKxVQ7C4EY-5347769.webp" alt="Touch Interrupt"></p><p>Corresponding <code>cpu ss</code> zone and Interrupt zone (visible with <code>irq</code> tag):</p><p><img src="/en/images/BIWDeeCYcmizchTV-5347827.webp" alt="Interrupt Zone Details"></p><p>Typically, a touch triggers several interrupts. The touchscreen driver updates these coordinates into <code>EventHub</code> for <code>InputReader</code> and <code>InputDispatcher</code>. Manufacturers focus on tuning this step.</p><h2 id="2-2-InputReader-and-InputDispatcher-Stage"><a href="#2-2-InputReader-and-InputDispatcher-Stage" class="headerlink" title="2.2 InputReader and InputDispatcher Stage"></a>2.2 InputReader and InputDispatcher Stage</h2><p>These Native threads in <code>SystemServer</code> handle input events. See <a href="https://www.androidperformance.com/en/2019/11/04/Android-Systrace-Input/">Input Explained</a> for details.</p><p><img src="/en/images/CVaK1fF9Ch0vT0qw.webp" alt="InputReader and InputDispatcher"></p><p>For an icon click, the reported events include <strong>Input_Down</strong>, several <strong>Input_Move</strong>, and one <strong>Input_Up</strong>, forming a complete click sequence.</p><p>Since Launcher is in the foreground and visible, it receives these events. Tracing their flow through <code>SystemServer</code> and App is detailed in <a href="https://www.androidperformance.com/en/2019/11/04/Android-Systrace-Input/">Input Explained</a>; here are the core visualizations:</p><h3 id="2-2-1-Event-Flow-in-SystemServer"><a href="#2-2-1-Event-Flow-in-SystemServer" class="headerlink" title="2.2.1 Event Flow in SystemServer"></a>2.2.1 Event Flow in SystemServer</h3><p><img src="/en/images/15728723576583.jpg" alt="SystemServer Flow"></p><h3 id="2-2-2-Event-Flow-in-Launcher"><a href="#2-2-2-Event-Flow-in-Launcher" class="headerlink" title="2.2.2 Event Flow in Launcher"></a>2.2.2 Event Flow in Launcher</h3><p><img src="/en/images/15728723679523.jpg" alt="Launcher Flow"></p><h2 id="2-3-Launcher-Input-Handling-Stage"><a href="#2-3-Launcher-Input-Handling-Stage" class="headerlink" title="2.3 Launcher Input Handling Stage"></a>2.3 Launcher Input Handling Stage</h2><p>Launcher handling is a key segment of response time, involving two metrics:</p><ol><li><strong>Click to Launcher First Frame Response</strong>: Launcher usually dims the App icon upon receiving <code>Down</code> (or plays a shrink animation) to confirm receipt.</li><li><strong>First Frame Response to App Launch</strong>: Time from processing the icon click to receiving <code>Up</code> and deciding to launch.</li></ol><p>Note: <strong>Desktop Swipe Response Time</strong> (from finger movement to desktop’s first frame of movement, measured via high-speed camera) is also a critical system metric targeted for optimization.</p><p>In a cold start, Launcher receives <code>Up</code>, completes its logic, and hands off to <code>AMS</code> (returning to the <code>SystemServer</code> process).</p><p><img src="/en/images/A9Y3FkDNSFlPuho5.webp" alt="Launcher Launch Logic"></p><p>This stage is usually of interest to system engineers. In recent versions, startup animations are collaborated on by Launcher and <code>SystemServer</code> to ensure visual continuity. Icons can now have layers or custom animations and dynamics that were impossible with pure <code>SystemServer</code> animations.</p><h2 id="2-4-SystemServer-StartActivity-Stage"><a href="#2-4-SystemServer-StartActivity-Stage" class="headerlink" title="2.4 SystemServer StartActivity Stage"></a>2.4 SystemServer StartActivity Stage</h2><p><code>SystemServer</code> handles:</p><ol><li>Processing the launch command.</li><li>Notifying Launcher to Pause.</li><li>Forking the new process.</li></ol><h3 id="Processing-the-Launch-Command"><a href="#Processing-the-Launch-Command" class="headerlink" title="Processing the Launch Command"></a>Processing the Launch Command</h3><p>The Binder call in <code>SystemServer</code> is triggered by Launcher via <code>ActivityTaskManager.getService().startActivity</code>.</p><p><img src="/en/images/SL5nD2t2w2V8EQxP.webp" alt="StartActivity Binder Call"></p><p>If the App process isn’t running, <code>SystemServer</code> must first start the process, then the Activity. This is the hallmark of a cold start. It forks from <code>Zygote64</code> (or <code>Zygote32</code> for some Apps).</p><p><img src="/en/images/c8BbgI8xrF6MRY1L.webp" alt="Forking New Process"></p><p><img src="/en/images/AxsjO5P7uaw9cZTj.webp" alt="Forking Code Trace"></p><h3 id="Zygote-64-Executing-Fork"><a href="#Zygote-64-Executing-Fork" class="headerlink" title="Zygote 64 Executing Fork"></a>Zygote 64 Executing Fork</h3><p><img src="/en/images/uJSzBhwP4IncTGWW.webp" alt="Zygote Fork"></p><p><img src="/en/images/hZBir9BCl0hpPbc8.webp" alt="Zygote Fork Finish"></p><h3 id="App-Process-Appearance"><a href="#App-Process-Appearance" class="headerlink" title="App Process Appearance"></a>App Process Appearance</h3><p><img src="/en/images/kyfMkYZfQtmkqQtI.webp" alt="App Process in Systrace"></p><p>Corresponding code: the App now enters its own process logic.</p><p><img src="/en/images/DPeBH7yfegYmmCvp.webp" alt="App Entry Code"></p><p>After startup, <code>SystemServer</code> records the time from <code>startActivity</code> to the first frame display. In Systrace, this is marked as shown below (Note: this ends at the <strong>first frame</strong>. If your App flow is <code>SplashActivity</code> -&gt; <code>MainActivity</code>, this only covers <code>SplashActivity</code>).</p><p><img src="/en/images/ZsfEiexfdJn48C1k.webp" alt="StartActivity Metrics"></p><h2 id="2-5-App-Process-Startup-Stage"><a href="#2-5-App-Process-Startup-Stage" class="headerlink" title="2.5 App Process Startup Stage"></a>2.5 App Process Startup Stage</h2><p>Large-scale Apps typically categorize cold start into three parts. Each step slows down the overall speed. Define your “End” point clearly with testers (usually where the UI is stable).</p><ol><li><strong>Process Start to SplashActivity First Frame</strong> (or directly to MainActivity if no Splash).</li><li><strong>SplashActivity First Frame to MainActivity First Frame</strong>.</li><li><strong>MainActivity First Frame to Fully Loaded</strong>.</li></ol><p>Analysis details for each:</p><h3 id="Process-Start-to-SplashActivity-First-Frame"><a href="#Process-Start-to-SplashActivity-First-Frame" class="headerlink" title="Process Start to SplashActivity First Frame"></a>Process Start to SplashActivity First Frame</h3><p>Post-fork, the App must execute <code>bindApplication</code> (the core differentiator for cold vs hot starts). Once the environment is ready, it starts components (Activities here; Services, Broadcasts, or Providers would pre-empt Activity if they triggered the process).</p><p>Activity lifecycle functions (<code>onStart</code>, <code>onCreate</code>, <code>onResume</code>) execute, followed by one <code>Choreographer#doFrame</code> (measure&#x2F;layout&#x2F;draw), RenderThread initialization, and the final <code>SurfaceFlinger</code> Vsync cycle composition. The first frame then physically displays (at the <code>finishDrawing</code> marker). See <a href="https://www.androidperformance.com/en/2019/11/06/Android-Systrace-MainThread-And-RenderThread/">MainThread and RenderThread Explained</a>.</p><p><img src="/en/images/Nr5HXUKyZ7qJUIBL.webp" alt="App-side Startup Trace"></p><h3 id="SplashActivity-to-MainActivity"><a href="#SplashActivity-to-MainActivity" class="headerlink" title="SplashActivity to MainActivity"></a>SplashActivity to MainActivity</h3><p>Many Apps use a <code>SplashActivity</code> for ads. This involves another Activity creation cycle, business logic, WebView initialization, etc., leading to the <code>MainActivity</code> first frame.</p><p><img src="/en/images/6ahmp1zba89yblyF.webp" alt="Transition Trace"></p><h3 id="MainActivity-First-Frame-to-Fully-Loaded"><a href="#MainActivity-First-Frame-to-Fully-Loaded" class="headerlink" title="MainActivity First Frame to Fully Loaded"></a>MainActivity First Frame to Fully Loaded</h3><p>A <code>MainActivity</code> often takes multiple frames to load fully as resources (like images) are asynchronously fetched. The first frame might just be a wireframe. Systrace alone is hard for defining the “Fully Loaded” point unless you use a custom Systrace Tag (e.g., in a View’s <code>onDraw</code> or when a List finishes and item count $&gt; 0$).</p><p><img src="/en/images/lB2bublumIv584yu.webp" alt="Final Loading Trace"></p><p>Demonstration using a Systrace + Screenshot hybrid (from an open-source WanAndroid client):</p><p><img src="/en/images/OIG57AudX193jD3u.webp" alt="Composite Visualization"></p><p><a id="end"></a></p><h1 id="End"><a href="#End" class="headerlink" title="End"></a>End</h1><p>This article focuses on visualizing the complete cold start flow in Systrace to help you locate bottlenecks and perform competitive analysis.</p><ol><li>For “How to Analyze,” see the routine in <a href="https://www.androidperformance.com/en/2021/09/13/android-systrace-Responsiveness-in-action-1/">Understanding Responsiveness Principles</a>.</li><li>For “How to Optimize,” see <a href="https://www.androidperformance.com/en/2019/11/18/Android-App-Lunch-Optimize/">Complete Record of Android App Startup Optimization</a>. Optimization techniques evolve; I’ll maintain that article. If you find new techniques, leave a comment or contact me via WeChat (553000664).</li></ol><p><a id="series"></a></p><h1 id="Series-Articles"><a href="#Series-Articles" class="headerlink" title="Series Articles"></a>Series Articles</h1><ol><li><a href="https://www.androidperformance.com/en/2021/09/13/android-systrace-Responsiveness-in-action-1/">Systrace Responsiveness in Action 1: Understanding Responsiveness Principles</a></li><li><a href="https://www.androidperformance.com/en/2021/09/13/android-systrace-Responsiveness-in-action-2/">Systrace Responsiveness in Action 2: Responsiveness Analysis - Using App Startup as an Example</a></li><li><a href="https://www.androidperformance.com/en/2021/09/13/android-systrace-Responsiveness-in-action-3/">Systrace Responsiveness in Action 3: Extended Knowledge on Responsiveness</a></li><li><a href="https://www.androidperformance.com/en/2019/05/26/Android_Systrace_0/">Link to Systrace Basics Series</a></li></ol><p><a id="refs"></a></p><h1 id="References"><a href="#References" class="headerlink" title="References"></a>References</h1><ol><li><a href="https://www.jianshu.com/p/37370c1d17fc">Analysis of Android App Startup Flow</a></li><li><a href="https://juejin.cn/post/6907493155659055111">Investigation: Can App Startup Really Reduce Startup Time?</a></li><li><a href="https://blog.csdn.net/guolin_blog/article/details/108026357">Jetpack App Startup Explained</a></li><li><a href="https://developer.android.google.cn/topic/libraries/app-startup">App Startup Official Guide</a></li><li><a href="https://www.androidperformance.com/en/2019/11/18/Android-App-Lunch-Optimize/">Complete Record of Android App Startup Optimization</a></li><li><a href="https://android.googlesource.com/platform/system/extras/+/master/simpleperf/doc/android_application_profiling.md">Android Application Profiling</a></li></ol><p><a id="about"></a></p><h1 id="About-Me-amp-amp-Blog"><a href="#About-Me-amp-amp-Blog" class="headerlink" title="About Me &amp;&amp; Blog"></a>About Me &amp;&amp; Blog</h1><p>Below is my personal intro and related links. I look forward to exchanging ideas with fellow professionals. “When three walk together, one can always be my teacher!”</p><ol><li><a href="https://www.androidperformance.com/en/about/">Blogger Intro</a>: Includes personal WeChat and WeChat group links.</li><li><a href="https://www.androidperformance.com/en/2019/12/01/BlogMap/">Blog Content Navigation</a>: A guide for my blog content.</li><li><a href="https://www.androidperformance.com/en/2018/05/07/Android-performance-optimization-skills-and-tools/">Curated Excellent Blog Articles - Android Performance Optimization Must-Knows</a>: Welcome to recommend projects&#x2F;articles.</li><li><a href="https://www.androidperformance.com/en/2023/12/30/the-performance/">Android Performance Optimization Knowledge Planet</a>: Welcome to join and thank you for your support~</li></ol><blockquote><p><strong>One walks faster alone, but a group walks further together.</strong></p></blockquote><p><img src="/en/images/WechatIMG581.webp" alt="Scan WeChat QR Code"></p>]]></content>
    
    
    <summary type="html">&lt;p&gt;When discussing Android performance, &lt;strong&gt;Jank&lt;/strong&gt;, &lt;strong&gt;Responsiveness&lt;/strong&gt;, and &lt;strong&gt;ANR&lt;/strong&gt; are usually grouped together because their causes are similar. They are simply categorized based on severity: Jank, Slow Response, and ANR. We can define “Broad Jank” to include all three. If a user reports that a phone or App is “stuttering,” they are likely referring to Broad Jank, and we must identify which specific issue is occurring.&lt;/p&gt;
&lt;p&gt;If it’s stuttering during animation or list scrolling, we define it as &lt;strong&gt;Narrow Jank&lt;/strong&gt; (referred to as &lt;strong&gt;Jank&lt;/strong&gt;). If it’s slow app startup, slow screen wake-up, or slow scene switching, we define it as &lt;strong&gt;Slow Responsiveness&lt;/strong&gt; (referred to as &lt;strong&gt;Slow&lt;/strong&gt;). If it’s an ANR, it’s an &lt;strong&gt;Application Not Responding&lt;/strong&gt; issue. Each situation requires different analysis and resolution methods.&lt;/p&gt;
&lt;p&gt;Furthermore, within Apps or manufacturers, &lt;strong&gt;Jank&lt;/strong&gt;, &lt;strong&gt;Responsiveness&lt;/strong&gt;, and &lt;strong&gt;ANR&lt;/strong&gt; have individual metrics like &lt;strong&gt;Frame Drop Rate&lt;/strong&gt;, &lt;strong&gt;Startup Speed&lt;/strong&gt;, and &lt;strong&gt;ANR Rate&lt;/strong&gt;. Mastering the analysis and optimization of these issues is crucial for developers.&lt;/p&gt;
&lt;p&gt;&lt;strong&gt;This is the second article in the Responsiveness series, using Android App Cold Start as an example to explain how to use Systrace for analysis.&lt;/strong&gt;</summary>


    <category term="Android" scheme="https://androidperformance.com/en/categories/Android/"/>
    
    
    <category term="Android" scheme="https://androidperformance.com/en/tags/Android/"/>
    
    <category term="Perfetto" scheme="https://androidperformance.com/en/tags/Perfetto/"/>
    
    <category term="Systrace" scheme="https://androidperformance.com/en/tags/Systrace/"/>
    
    <category term="Startup" scheme="https://androidperformance.com/en/tags/Startup/"/>
    
    <category term="ANR" scheme="https://androidperformance.com/en/tags/ANR/"/>
    
  </entry>
  
  <entry>
    <title>Android Systrace Responsiveness in Action 1 - Understanding Responsiveness Principles</title>
    <link href="https://androidperformance.com/en/2021/09/13/android-systrace-Responsiveness-in-action-1/"/>
    <id>https://androidperformance.com/en/2021/09/13/android-systrace-Responsiveness-in-action-1/</id>
    <published>2021-09-13T02:46:22.000Z</published>
    <updated>2026-05-10T23:29:51.065Z</updated>
    
    <content type="html"><![CDATA[<p>When discussing Android performance, <strong>Jank</strong>, <strong>Responsiveness</strong>, and <strong>ANR</strong> are usually grouped together because their causes are similar. They are simply categorized based on severity: Jank, Slow Response, and ANR. We can define “Broad Jank” to include all three. If a user reports that a phone or App is “stuttering,” they are likely referring to Broad Jank, and we must identify which specific issue is occurring.</p><p>If it’s stuttering during animation or list scrolling, we define it as <strong>Narrow Jank</strong> (referred to as <strong>Jank</strong>). If it’s slow app startup, slow screen wake-up, or slow scene switching, we define it as <strong>Slow Responsiveness</strong> (referred to as <strong>Slow</strong>). If it’s an ANR, it’s an <strong>Application Not Responding</strong> issue. Each situation requires different analysis and resolution methods.</p><p>Furthermore, within Apps or manufacturers, <strong>Jank</strong>, <strong>Responsiveness</strong>, and <strong>ANR</strong> have individual metrics like <strong>Frame Drop Rate</strong>, <strong>Startup Speed</strong>, and <strong>ANR Rate</strong>. Mastering the analysis and optimization of these issues is crucial for developers.</p><p><strong>This is the first article in the Responsiveness series, focusing on theoretical knowledge, including an overview of performance engineering, key responsiveness concepts, and analysis methodologies.</strong> <span id="more"></span></p><h2 id="Table-of-Contents"><a href="#Table-of-Contents" class="headerlink" title="Table of Contents"></a>Table of Contents</h2><ul><li><a href="#perf">Performance Engineering</a></li><li><a href="#overview">Responsiveness Overview</a></li><li><a href="#analysis">Methodology for Analyzing Responsiveness Issues</a></li><li><a href="#series">Series Articles</a></li><li><a href="#refs">References</a></li><li><a href="#about">About Me &amp;&amp; Blog</a></li></ul><p>For articles on Jank, refer to <a href="https://www.androidperformance.com/en/2021/04/24/android-systrace-smooth-in-action-1/">Systrace Smoothness in Action 1: Understanding Jank Principles</a>. ANR articles will follow. This article focuses on the basic principles of responsiveness.</p><p>If you are not familiar with the basic use of Systrace (Perfetto), please catch up on the <a href="https://www.androidperformance.com/en/2019/05/26/Android_Systrace_0/">Systrace Basics Series</a> first. This article assumes you are already familiar with using Systrace (Perfetto).</p><p><a id="perf"></a></p><h1 id="Performance-Engineering"><a href="#Performance-Engineering" class="headerlink" title="Performance Engineering"></a>Performance Engineering</h1><p>Before introducing responsiveness principles, here is a passage from the book <strong>“Systems Performance”</strong> regarding performance. This methodology aligns perfectly with our topic and is highly recommended as a handbook for performance optimization engineers:</p><blockquote><h1 id="Performance-is-Challenging"><a href="#Performance-is-Challenging" class="headerlink" title="Performance is Challenging"></a>Performance is Challenging</h1><p>Systems performance engineering is a challenging field for many reasons, including the facts that system performance is subjective, complex, and often characterized by multiple concurrent issues.</p><h2 id="Performance-is-Subjective"><a href="#Performance-is-Subjective" class="headerlink" title="Performance is Subjective"></a>Performance is Subjective</h2><ol><li>Technical disciplines are often objective; many in the industry view problems as black or white. In software troubleshooting, deciding whether a bug exists or is fixed is usually clear-cut. Bugs are accompanied by error messages that are often easy to interpret, leading you to understand why the error occurred.</li><li>In contrast, performance is often subjective. When starting on a performance issue, judging whether a problem even exists can be ambiguous, and the same applies when it is fixed. What one user considers “poor” performance, another might consider “good.”</li></ol><h2 id="Systems-are-Complex"><a href="#Systems-are-Complex" class="headerlink" title="Systems are Complex"></a>Systems are Complex</h2><ol><li>Besides subjectivity, performance engineering is challenging because systems are complex and often lack a clear starting point for analysis. We often begin with guesses—blaming the network, for example—and performance analysis must determine if that is a correct direction.</li><li>Performance issues can arise from complex interconnections between subsystems, even when those subsystems perform well in isolation. They can also result from <strong>cascading failures</strong>, where one failing component causes performance issues in others. To understand these, you must untangle component relationships and how they collaborate.</li><li>Bottlenecks are often complex and interconnected in unexpected ways. Fixing one issue might simply push the bottleneck elsewhere, resulting in no overall performance gain.</li><li>Additionally, the complexity of production workloads can cause issues that are difficult to reproduce in a lab or occur only intermittently.</li><li>Solving complex performance problems often requires a holistic approach. The entire system—including internal and external interactions—may need investigation. This work demands a broad skill set, rarely found in one person, making performance engineering a dynamic and intellectually challenging endeavor.</li></ol><h2 id="Multiple-Issues-May-Coexist"><a href="#Multiple-Issues-May-Coexist" class="headerlink" title="Multiple Issues May Coexist"></a>Multiple Issues May Coexist</h2><ol><li>Finding a single performance issue is often not the end; complex software usually has multiple problems.</li><li>Another difficulty: the real task isn’t just finding problems, but identifying which ones are the most significant.</li><li>To do this, performance analysis must <strong>quantify</strong> the importance of issues. Some problems may not apply to your workload or only to a small degree. Ideally, you should not only quantify the problem but also estimate the speedup expected after fixing it. This information is especially useful when management reviews engineering or operations resource allocation.</li><li>One metric is particularly well-suited for quantifying performance: <strong>latency</strong>.</li></ol><p>– Excerpts from <strong>“Systems Performance: Enterprise and the Cloud”</strong> (paraphrased)</p></blockquote><p><strong>Systrace Series Articles:</strong></p><ol><li><a href="https://www.androidperformance.com/en/2019/05/28/Android-Systrace-About/">Introduction to Systrace</a></li><li><a href="https://www.androidperformance.com/en/2019/07/23/Android-Systrace-Pre/">Systrace Basics - Prerequisites for Systrace</a></li><li><a href="https://www.androidperformance.com/en/2019/05/27/why-60-fps/">Systrace Basics - Why 60 fps?</a></li><li><a href="https://www.androidperformance.com/en/2019/06/29/Android-Systrace-SystemServer/">Android Systrace Basics - SystemServer Explained</a></li><li><a href="https://www.androidperformance.com/en/2020/02/14/Android-Systrace-SurfaceFlinger/">Systrace Basics - SurfaceFlinger Explained</a></li><li><a href="https://www.androidperformance.com/en/2019/11/04/Android-Systrace-Input/">Systrace Basics - Input Explained</a></li><li><a href="https://www.androidperformance.com/en/2019/12/01/Android-Systrace-Vsync/">Systrace Basics - Vsync Explained</a></li><li><a href="https://www.androidperformance.com/en/2019/10/22/Android-Choreographer/">Systrace Basics - Vsync-App: Detailed Explanation of Choreographer-Based Rendering Mechanism</a></li><li><a href="https://www.androidperformance.com/en/2019/11/06/Android-Systrace-MainThread-And-RenderThread/">Systrace Basics - MainThread and RenderThread Explained</a></li><li><a href="https://www.androidperformance.com/en/2019/12/06/Android-Systrace-Binder/">Systrace Basics - Binder and Lock Contention Explained</a></li><li><a href="https://www.androidperformance.com/en/2019/12/15/Android-Systrace-Triple-Buffer">Systrace Basics - Triple Buffer Explained</a></li><li><a href="https://www.androidperformance.com/en/2019/12/21/Android-Systrace-CPU">Systrace Basics - CPU Info Explained</a></li><li><a href="https://www.androidperformance.com/en/2021/04/24/android-systrace-smooth-in-action-1/">Systrace Smoothness in Action 1: Understanding Jank Principles</a></li><li><a href="https://www.androidperformance.com/en/2021/04/24/android-systrace-smooth-in-action-2/">Systrace Smoothness in Action 2: Case Analysis - MIUI Launcher Scroll Jank Analysis</a></li><li><a href="https://www.androidperformance.com/en/2021/04/24/android-systrace-smooth-in-action-3/">Systrace Smoothness in Action 3: FAQs During Jank Analysis</a></li><li><a href="https://www.androidperformance.com/en/2021/09/13/android-systrace-Responsiveness-in-action-1/">Systrace Responsiveness in Action 1: Understanding Responsiveness Principles</a></li><li><a href="https://www.androidperformance.com/en/2021/09/13/android-systrace-Responsiveness-in-action-2/">Systrace Responsiveness in Action 2: Responsiveness Analysis - Using App Startup as an Example</a></li><li><a href="https://www.androidperformance.com/en/2021/09/13/android-systrace-Responsiveness-in-action-3/">Systrace Responsiveness in Action 3: Extended Knowledge on Responsiveness</a></li></ol><p><a id="overview"></a></p><h1 id="Responsiveness-Overview"><a href="#Responsiveness-Overview" class="headerlink" title="Responsiveness Overview"></a>Responsiveness Overview</h1><p><strong>Responsiveness</strong> is a critical metric for App performance. Poor responsiveness typically manifests as <strong>delayed click effects</strong>, <strong>operation wait times</strong>, or <strong>prolonged white screens</strong>. Primary scenarios include:</p><ul><li><strong>App startup scenarios: Cold start, hot start, warm start, etc.</strong></li><li><strong>Interface transition scenarios: Page jumps within an App, or between different Apps.</strong></li><li><strong>Non-transition click scenarios: Toggles, pop-ups, long presses, control selections, single&#x2F;double clicks, etc.</strong></li><li><strong>Screen wake&#x2F;sleep, power on&#x2F;off, unlocking, facial recognition, camera, video loading, etc.</strong></li></ul><p>Principle-wise, responsiveness scenarios are often triggered by an <code>input</code> event (as a Message to the processing UI thread) and end with the completion of one or more Messages, usually involving critical UI drawing. We measure responsiveness from the trigger event to the completion of processing; this duration is called the <strong>Response Time</strong>.</p><p>As shown below, <strong>responsiveness issues occur when one or more of these Messages take longer than expected (subjective), resulting in a completion time exceeding what the user anticipates.</strong></p><p><img src="/en/images/XyGmCIpqfZxRFCs7.webp" alt="Response Time Diagram"></p><p>Since responsiveness is subjective (unlike jank, which is binary), different roles have different criteria. For example, system developers, app developers, and testers have different view on <strong>App Cold Start</strong> boundaries:</p><ol><li><strong>System Developers</strong>: Observe from the input interrupt, often ending at the app’s first frame (easy to calculate) or complete loading (subjective and harder to measure without standardized tools). They focus on holistic optimization (input delivery, <code>SystemServer</code>, <code>SurfaceFlinger</code>, Kernel, Launcher, etc.).</li><li><strong>App Developers</strong>: Observe from Application <code>onCreate</code> or <code>attachContext</code>, usually ending at a fully loaded or interactive state. They can add custom markers in their code and focus on improving their own app’s logic. Most “startup optimization” tutorials focus here.</li><li><strong>Testers</strong>: Focus on the real user experience. The start is the icon highlight upon clicking the launcher; the end is complete content loading. They usually use <strong>high-speed cameras + automation</strong> with <strong>robotic arms</strong> and <strong>image recognition</strong> to standardize measurements.</li></ol><p><a id="analysis"></a></p><h1 id="Methodology-for-Analyzing-Responsiveness-Issues"><a href="#Methodology-for-Analyzing-Responsiveness-Issues" class="headerlink" title="Methodology for Analyzing Responsiveness Issues"></a>Methodology for Analyzing Responsiveness Issues</h1><h2 id="Define-the-Start-and-End-Points"><a href="#Define-the-Start-and-End-Points" class="headerlink" title="Define the Start and End Points"></a>Define the Start and End Points</h2><p>The most important step is finding the <strong>start</strong> and <strong>end</strong> points. As noted, these vary by role and are subjective. Standardize these boundaries and metrics with all stakeholders using these methods:</p><ol><li><strong>Competitor Analysis</strong>: Use a baseline competitor device or App. Under identical conditions, how long does the competitor take from click to response?</li><li><strong>Regression Analysis</strong>: Compare against previous system or App versions to ensure no regression.</li></ol><p>The start point is usually easy (click or trigger event). The end point is trickier—e.g., when is a complex App like Taobao “fully loaded”? Systrace’s first frame, <code>Displayed</code> log, or <code>onWindowFocusChange</code> are often inaccurate. High-speed cameras with image recognition is the current industry standard.</p><h2 id="Common-Responsiveness-Issues"><a href="#Common-Responsiveness-Issues" class="headerlink" title="Common Responsiveness Issues"></a>Common Responsiveness Issues</h2><h3 id="Android-System-Issues-Causing-Slowness"><a href="#Android-System-Issues-Causing-Slowness" class="headerlink" title="Android System Issues Causing Slowness"></a>Android System Issues Causing Slowness</h3><p>These relate to the device’s hardware performance and system tuning. The weaker the device, the more likely these occur. Key signatures in App-side Systrace:</p><ol><li><strong>Insufficient CPU Frequency</strong><ul><li><strong>App Signature</strong>: UI Thread is “Running,” but execution time is longer.</li></ul></li><li><strong>CPU Core Scheduling: Critical tasks on Small Cores</strong><ul><li><strong>App Signature</strong>: UI Thread is “Running” in Systrace, but execution is slow.</li></ul></li><li><strong>Busy SystemServer, affecting:</strong><ol><li>Binder call processing latency.<ul><li><strong>App Signature</strong>: UI Thread is “Sleep,” waiting for Binder return.</li></ul></li><li>Startup logic processing delay.<ul><li><strong>App Signature</strong>: UI Thread is “Sleep,” waiting for Binder return.</li></ul></li></ol></li><li><strong>Busy SurfaceFlinger, affecting Render Thread <code>dequeueBuffer</code>&#x2F;<code>queueBuffer</code></strong><ul><li><strong>App Signature</strong>: Render Thread is in a Binder wait state during buffer operations.</li></ul></li><li><strong><a href="https://www.androidperformance.com/en/2019/09/18/Android-Jank-Due-To-Low-Memory/">Low Memory</a>, which often triggers these issues affecting both SystemServer and Apps:</strong><ol><li>Frequent app killing and restarting. Startup is a heavy operation that consumes CPU, delaying the foreground App.<ul><li><strong>App Signature</strong>: UI Thread has more “Runnable” states and less “Running,” increasing total function time.</li></ul></li><li>Frequent Garbage Collection (GC). <code>HeapTaskDeamon</code> and <code>kswapd0</code> tasks for memory reclamation are frequent.<ul><li><strong>App Signature</strong>: More “Runnable,” less “Running,” increased function time.</li></ul></li><li>Increased Disk IO. Disk IO is slow; the UI Thread may spend significant time in <strong>Uninterruptible Sleep</strong>.<ul><li><strong>App Signature</strong>: UI Thread has more “Uninterruptible Sleep” and “Uninterruptible Sleep - IO” states.</li></ul></li></ol></li><li><strong>Thermal Throttling: CPU max frequency capped due to heat</strong><ul><li><strong>App Signature</strong>: UI Thread is “Running,” but execution is slow.</li></ul></li><li><strong>Overall System Load: Multiple heavy processes or one 100% CPU process</strong><ul><li><strong>App Signature</strong>: CPU zone is saturated. UI and Render threads are mostly “Runnable” or frequently switching between “Runnable” and “Running.”</li></ul></li></ol><h3 id="App-Specific-Issues"><a href="#App-Specific-Issues" class="headerlink" title="App-Specific Issues"></a>App-Specific Issues</h3><p>Primarily component, View, and data initialization during startup:</p><ol><li><code>Application.onCreate</code>: App logic + Third-party SDK initialization.</li><li>Activity Lifecycle: <code>onStart</code>, <code>onCreate</code>, <code>onResume</code> timeouts.</li><li>Service Lifecycle timeouts.</li><li>Broadcast <code>onReceive</code> timeouts.</li><li>ContentProvider initialization (often abused).</li><li>Layout initialization: <code>measure</code>, <code>layout</code>, <code>draw</code> delays.</li><li>Render Thread initialization: <code>setSurface</code>, <code>queueBuffer</code>, <code>dequeueBuffer</code>, <code>Textureupload</code>, etc.</li><li>Activity Jump: Time from <code>SplashActivity</code> to <code>MainActivity</code>.</li><li>Heavy Messages posted to the UI thread.</li><li>UI&#x2F;Render thread waiting for worker thread data.</li><li>UI&#x2F;Render thread waiting for sub-process data.</li><li>UI&#x2F;Render thread waiting for network data.</li><li>Binder call timeouts.</li><li>WebView initialization.</li><li>First-run JIT (Just-In-Time) compilation.</li></ol><h2 id="Analysis-Routine-Mainly-Systrace"><a href="#Analysis-Routine-Mainly-Systrace" class="headerlink" title="Analysis Routine (Mainly Systrace)"></a>Analysis Routine (Mainly Systrace)</h2><ol><li>Confirm prerequisites (device aging, data volume, downloads), steps, and phenomena. Reproduce locally.</li><li>Define metrics:<ol><li>What is the start time?</li><li>What is the end time?</li></ol></li><li>Capture logs (Systrace, standard logs, etc.).</li><li>Use <strong>Systrace</strong> to pinpoint differences:<ol><li>Compare App bottleneck sections against a baseline device. Segment the startup phase:<ol><li>Application Creation</li><li>Activity Creation</li><li>First <code>doFrame</code></li><li>Subsequent Content Loading</li><li>Custom App Messages</li></ol></li><li>Analyze specific bottlenecks:<ol><li>Function execution is slow (Running) –&gt; <strong>App Issue</strong></li><li>Long “Running” periods without stacks –&gt; <strong>App Issue; add TraceTags or use TraceView</strong></li><li>Long Binder wait (Sleep) –&gt; <strong>Check Binder Server&#x2F;SystemServer</strong></li><li>Waiting for worker thread (Sleep) –&gt; <strong>App Issue; check “Wakeup” info for the thread</strong></li><li>Waiting for sub-process&#x2F;provider (Sleep) –&gt; <strong>App Issue; check “Wakeup” for the process&#x2F;provider</strong></li><li>Excessive “Runnable” –&gt; <strong>System Issue; CPU is saturated</strong></li><li>Excessive IO wait (Uninterruptible Sleep | WakeKill - Block I&#x2F;O) –&gt; <strong>System <a href="https://www.androidperformance.com/en/2019/09/18/Android-Jank-Due-To-Low-Memory/#%E5%BD%B1%E5%93%8D%E4%B8%BB%E7%BA%BF%E7%A8%8B-IO-%E6%93%8D%E4%BD%9C">Low Memory</a></strong></li><li>RenderThread <code>dequeueBuffer</code>&#x2F;<code>queueBuffer</code> delays –&gt; <strong>Check SurfaceFlinger</strong></li></ol></li><li>If it’s a system issue, check relevant system zones (reference common causes above):<ol><li><a href="https://www.androidperformance.com/en/2019/12/21/Android-Systrace-CPU/">Kernel Zone</a><ol><li>Critical tasks on Small Cores (e.g., 0-3).</li><li>Frequencies not capped at max (e.g., 1.8GHz vs 2.8GHz).</li><li>CPU saturation (no gaps between tasks on 8 cores).</li><li><a href="https://www.androidperformance.com/en/2019/09/18/Android-Jank-Due-To-Low-Memory/">Low Memory Indicators</a>: Frequent <code>Uninterruptible Sleep</code>, <code>HeapTaskDeamon</code>, or <code>kswapd0</code>.</li></ol></li><li><a href="https://www.androidperformance.com/en/2019/06/29/Android-Systrace-SystemServer/">SystemServer Zone</a><ol><li>Input reading&#x2F;dispatch anomalies (rare).</li><li>Binder logic timeouts.</li><li>AM&#x2F;WM lock contention (use Wakeup info to trace lockers).</li><li>Frequent process starts&#x2F;kills (check <code>startProcess</code> or Event Log).</li></ol></li><li><a href="https://www.androidperformance.com/en/2020/02/14/Android-Systrace-SurfaceFlinger/">SurfaceFlinger Zone</a><ol><li>Binder processing delays for buffer calls.</li><li>Main thread busy with unrelated tasks.</li></ol></li><li>Launcher Zone (Startup scenarios)<ol><li>Input event handling delay.</li><li><code>onPause</code> delay.</li><li>Startup animation jank.</li></ol></li></ol></li></ol></li><li>Post-initial analysis:<ol><li>If it’s a system issue, can the App avoid it? If not, escalate to the system team.</li><li>If it’s an App issue, use TraceView (Android Studio Profiler), SimplePerf, or the <a href="https://github.com/Gracker/TraceFix">TraceFix Plugin</a> for detailed function traces and comparison.</li></ol></li><li>Address multiple causes:<ol><li>Optimize the major bottlenecks first. Ignore minor ones initially.</li><li>Some require system&#x2F;App co-optimization (e.g., App vendors using phone manufacturer SDKs like those from Oppo, Huawei, Vivo).</li><li>If minor or unsolvable, document and communicate with Test teams.</li><li>Check if it’s a duplicate or platform-specific cross-issue in the Bug database.</li></ol></li></ol><p>This article provides a foundation for responsiveness knowledge. It involves significant system-level details; please review the <a href="https://www.androidperformance.com/en/2019/05/26/Android_Systrace_0/">Systrace Basics Series</a> for depth.</p><p><a id="series"></a></p><h1 id="Series-Articles"><a href="#Series-Articles" class="headerlink" title="Series Articles"></a>Series Articles</h1><ol><li><a href="https://www.androidperformance.com/en/2021/09/13/android-systrace-Responsiveness-in-action-1/">Systrace Responsiveness in Action 1: Understanding Responsiveness Principles</a></li><li><a href="https://www.androidperformance.com/en/2021/09/13/android-systrace-Responsiveness-in-action-2/">Systrace Responsiveness in Action 2: Responsiveness Analysis - Using App Startup as an Example</a></li><li><a href="https://www.androidperformance.com/en/2021/09/13/android-systrace-Responsiveness-in-action-3/">Systrace Responsiveness in Action 3: Extended Knowledge on Responsiveness</a></li><li><a href="https://www.androidperformance.com/en/2019/05/26/Android_Systrace_0/">Link to Systrace Basics Series</a></li></ol><p><a id="refs"></a></p><h1 id="References"><a href="#References" class="headerlink" title="References"></a>References</h1><ol><li><a href="https://www.jianshu.com/p/37370c1d17fc">Analysis of Android App Startup Flow</a></li><li><a href="https://juejin.cn/post/6907493155659055111">Investigation: Can App Startup Really Reduce Startup Time?</a></li><li><a href="https://blog.csdn.net/guolin_blog/article/details/108026357">Jetpack App Startup Explained</a></li><li><a href="https://developer.android.google.cn/topic/libraries/app-startup">App Startup Official Guide</a></li><li><a href="https://www.androidperformance.com/en/2019/11/18/Android-App-Lunch-Optimize/">Complete Record of Android App Startup Optimization</a></li><li><a href="https://android.googlesource.com/platform/system/extras/+/master/simpleperf/doc/android_application_profiling.md">Android Application Profiling</a></li></ol><p><a id="about"></a></p><h1 id="About-Me-amp-amp-Blog"><a href="#About-Me-amp-amp-Blog" class="headerlink" title="About Me &amp;&amp; Blog"></a>About Me &amp;&amp; Blog</h1><p>Below is my personal intro and related links. I look forward to exchanging ideas with fellow professionals. “When three walk together, one can always be my teacher!”</p><ol><li><a href="https://www.androidperformance.com/en/about/">Blogger Intro</a>: Includes personal WeChat and WeChat group links.</li><li><a href="https://www.androidperformance.com/en/2019/12/01/BlogMap/">Blog Content Navigation</a>: A guide for my blog content.</li><li><a href="https://www.androidperformance.com/en/2018/05/07/Android-performance-optimization-skills-and-tools/">Curated Excellent Blog Articles - Android Performance Optimization Must-Knows</a>: Welcome to recommend projects&#x2F;articles.</li><li><a href="https://www.androidperformance.com/en/2023/12/30/the-performance/">Android Performance Optimization Knowledge Planet</a>: Welcome to join and thank you for your support~</li></ol><blockquote><p><strong>One walks faster alone, but a group walks further together.</strong></p></blockquote><p><img src="/en/images/WechatIMG581.webp" alt="Scan WeChat QR Code"></p>]]></content>
    
    
    <summary type="html">&lt;p&gt;When discussing Android performance, &lt;strong&gt;Jank&lt;/strong&gt;, &lt;strong&gt;Responsiveness&lt;/strong&gt;, and &lt;strong&gt;ANR&lt;/strong&gt; are usually grouped together because their causes are similar. They are simply categorized based on severity: Jank, Slow Response, and ANR. We can define “Broad Jank” to include all three. If a user reports that a phone or App is “stuttering,” they are likely referring to Broad Jank, and we must identify which specific issue is occurring.&lt;/p&gt;
&lt;p&gt;If it’s stuttering during animation or list scrolling, we define it as &lt;strong&gt;Narrow Jank&lt;/strong&gt; (referred to as &lt;strong&gt;Jank&lt;/strong&gt;). If it’s slow app startup, slow screen wake-up, or slow scene switching, we define it as &lt;strong&gt;Slow Responsiveness&lt;/strong&gt; (referred to as &lt;strong&gt;Slow&lt;/strong&gt;). If it’s an ANR, it’s an &lt;strong&gt;Application Not Responding&lt;/strong&gt; issue. Each situation requires different analysis and resolution methods.&lt;/p&gt;
&lt;p&gt;Furthermore, within Apps or manufacturers, &lt;strong&gt;Jank&lt;/strong&gt;, &lt;strong&gt;Responsiveness&lt;/strong&gt;, and &lt;strong&gt;ANR&lt;/strong&gt; have individual metrics like &lt;strong&gt;Frame Drop Rate&lt;/strong&gt;, &lt;strong&gt;Startup Speed&lt;/strong&gt;, and &lt;strong&gt;ANR Rate&lt;/strong&gt;. Mastering the analysis and optimization of these issues is crucial for developers.&lt;/p&gt;
&lt;p&gt;&lt;strong&gt;This is the first article in the Responsiveness series, focusing on theoretical knowledge, including an overview of performance engineering, key responsiveness concepts, and analysis methodologies.&lt;/strong&gt;</summary>


    <category term="Android" scheme="https://androidperformance.com/en/categories/Android/"/>
    
    
    <category term="Android" scheme="https://androidperformance.com/en/tags/Android/"/>
    
    <category term="Perfetto" scheme="https://androidperformance.com/en/tags/Perfetto/"/>
    
    <category term="Systrace" scheme="https://androidperformance.com/en/tags/Systrace/"/>
    
    <category term="Startup" scheme="https://androidperformance.com/en/tags/Startup/"/>
    
    <category term="ANR" scheme="https://androidperformance.com/en/tags/ANR/"/>
    
  </entry>
  
  <entry>
    <title>Android Systrace Smoothness in Action 3 - FAQs During Jank Analysis</title>
    <link href="https://androidperformance.com/en/2021/04/24/android-systrace-smooth-in-action-3/"/>
    <id>https://androidperformance.com/en/2021/04/24/android-systrace-smooth-in-action-3/</id>
    <published>2021-04-24T11:55:12.000Z</published>
    <updated>2026-05-10T23:29:51.066Z</updated>
    
    <content type="html"><![CDATA[<p>Different people have different understandings of smoothness (jank&#x2F;dropped frames) and different perceptions of jitter thresholds. Therefore, before starting this series, it is necessary to clarify the content to avoid misunderstandings. Here are some basic explanations:</p><ol><li>For mobile users, jank encompasses many scenarios: <strong>dropped frames when scrolling lists</strong>, <strong>excessive white screen during app startup</strong>, <strong>slow screen wake-up when pressing the power button</strong>, <strong>unresponsive interface followed by a crash</strong>, <strong>no response when clicking an icon</strong>, <strong>incoherent window animations, lagging touch response, or stuttering when entering the desktop after a reboot</strong>. These scenarios differ slightly from what developers understand as “jank.” Developers categorize these more finely, which is a cognitive gap between developers and users that must be noted when handling feedback from users or testers.</li><li>For developers, the above scenarios fall into three major categories: <strong>Smoothness</strong> (dropped frames in lists, incoherent animations, stuttering desktop entry), <strong>Responsiveness</strong> (long startup white screens, slow screen wake-up, lagging touch), and <strong>Stability</strong> (unresponsive interface&#x2F;crashes, no response to icon clicks). This classification is used because each category requires different analysis methods and steps. Quickly identifying the category is crucial.</li><li>Technically, <strong>Smoothness, Responsiveness, and Stability</strong> (ANR) all feel like “jank” to users because their underlying principles are identical: the main thread’s Message exceeds its processing deadline. They are simply categorized by different timeout thresholds. Understanding these problems requires knowledge of basic system operation mechanisms, which this article will introduce.</li><li>This series primarily analyzes smoothness-related issues. Responsiveness and stability will be covered in dedicated articles. Understanding smoothness first will make analyzing responsiveness and stability much easier.</li><li>This series focuses on using Systrace (Perfetto) for analysis. Systrace is our entry point because many factors affect smoothness—some within the app itself and others within the system. Systrace (Perfetto) provides a holistic view of the system’s operation during the problem, helping us initially pinpoint the root cause.<span id="more"></span></li></ol><h2 id="Table-of-Contents"><a href="#Table-of-Contents" class="headerlink" title="Table of Contents"></a>Table of Contents</h2><ul><li><a href="#frame-colors">What Do the Frame Colors in Systrace Mean?</a></li><li><a href="#no-red">No Red Frame Means No Dropped Frame?</a></li><li><a href="#why-wait">Why Does the Main Thread Wait for the Render Thread?</a></li><li><a href="#why-hold">Why Doesn’t It Jank When Swiping Without Releasing?</a></li><li><a href="#metrics">If It Doesn’t Jank, How Do We Measure Performance?</a></li><li><a href="#why-record">Why Can’t I See Jank in Screen Recordings?</a></li><li><a href="#series">Series Articles</a></li><li><a href="#attachments">Attachments</a></li><li><a href="#about">About Me &amp;&amp; Blog</a></li></ul><p><strong>Systrace Series Articles:</strong></p><ol><li><a href="https://www.androidperformance.com/en/2019/05/28/Android-Systrace-About/">Introduction to Systrace</a></li><li><a href="https://www.androidperformance.com/en/2019/07/23/Android-Systrace-Pre/">Systrace Basics - Prerequisites for Systrace</a></li><li><a href="https://www.androidperformance.com/en/2019/05/27/why-60-fps/">Systrace Basics - Why 60 fps?</a></li><li><a href="https://www.androidperformance.com/en/2019/06/29/Android-Systrace-SystemServer/">Android Systrace Basics - SystemServer Explained</a></li><li><a href="https://www.androidperformance.com/en/2020/02/14/Android-Systrace-SurfaceFlinger/">Systrace Basics - SurfaceFlinger Explained</a></li><li><a href="https://www.androidperformance.com/en/2019/11/04/Android-Systrace-Input/">Systrace Basics - Input Explained</a></li><li><a href="https://www.androidperformance.com/en/2019/12/01/Android-Systrace-Vsync/">Systrace Basics - Vsync Explained</a></li><li><a href="https://www.androidperformance.com/en/2019/10/22/Android-Choreographer/">Systrace Basics - Vsync-App: Detailed Explanation of Choreographer-Based Rendering Mechanism</a></li><li><a href="https://www.androidperformance.com/en/2019/11/06/Android-Systrace-MainThread-And-RenderThread/">Systrace Basics - MainThread and RenderThread Explained</a></li><li><a href="https://www.androidperformance.com/en/2019/12/06/Android-Systrace-Binder/">Systrace Basics - Binder and Lock Contention Explained</a></li><li><a href="https://www.androidperformance.com/en/2019/12/15/Android-Systrace-Triple-Buffer">Systrace Basics - Triple Buffer Explained</a></li><li><a href="https://www.androidperformance.com/en/2019/12/21/Android-Systrace-CPU">Systrace Basics - CPU Info Explained</a></li><li><a href="https://www.androidperformance.com/en/2021/04/24/android-systrace-smooth-in-action-1/">Systrace Smoothness in Action 1: Understanding Jank Principles</a></li><li><a href="https://www.androidperformance.com/en/2021/04/24/android-systrace-smooth-in-action-2/">Systrace Smoothness in Action 2: Case Analysis - MIUI Launcher Scroll Jank Analysis</a></li><li><a href="https://www.androidperformance.com/en/2021/04/24/android-systrace-smooth-in-action-3/">Systrace Smoothness in Action 3: FAQs During Jank Analysis</a></li><li><a href="https://www.androidperformance.com/en/2021/09/13/android-systrace-Responsiveness-in-action-1/">Systrace Responsiveness in Action 1: Understanding Responsiveness Principles</a></li><li><a href="https://www.androidperformance.com/en/2021/09/13/android-systrace-Responsiveness-in-action-2/">Systrace Responsiveness in Action 2: Responsiveness Analysis - Using App Startup as an Example</a></li><li><a href="https://www.androidperformance.com/en/2021/09/13/android-systrace-Responsiveness-in-action-3/">Systrace Responsiveness in Action 3: Extended Knowledge on Responsiveness</a></li><li><a href="https://www.androidperformance.com/en/2022/01/21/android-systrace-cpu-state-runnable/">Systrace Thread CPU State Analysis Tips - Runnable</a></li><li><a href="https://www.androidperformance.com/en/2022/03/13/android-systrace-cpu-state-running/">Systrace Thread CPU State Analysis Tips - Running</a></li><li><a href="https://www.androidperformance.com/en/2022/03/13/android-systrace-cpu-state-sleep/">Systrace Thread CPU State Analysis Tips - Sleep and Uninterruptible Sleep</a></li></ol><p>If you are not familiar with the basic use of Systrace (Perfetto), please catch up on the <a href="https://www.androidperformance.com/en/2019/05/26/Android_Systrace_0/">Systrace Basics Series</a> first. This article assumes you are already familiar with using Systrace (Perfetto).</p><p><a id="frame-colors"></a></p><h1 id="What-Do-the-Frame-Colors-in-Systrace-Mean"><a href="#What-Do-the-Frame-Colors-in-Systrace-Mean" class="headerlink" title="What Do the Frame Colors in Systrace Mean?"></a>What Do the Frame Colors in Systrace Mean?</h1><p>Frame markers are the circles found on the app’s UI thread area. There are three colors, each indicating the time spent on that frame.</p><p>Clicking a circle highlights the corresponding UI and Render thread tasks (graying out everything else).</p><h2 id="Green-Frame"><a href="#Green-Frame" class="headerlink" title="Green Frame"></a>Green Frame</h2><p>The most common, indicating the frame finished within a single Vsync cycle.</p><p><img src="/en/images/Systrace-Smooth%20e5d284a979a447ad8b45ff021d6e41cf/Untitled%2022.webp" alt="Green Frame"></p><h2 id="Yellow-Frame"><a href="#Yellow-Frame" class="headerlink" title="Yellow Frame"></a>Yellow Frame</h2><p>Indicates the frame took longer than 1 Vsync cycle but less than 2. Yellow frames suggest potential performance issues that <em>might</em> lead to user-perceived jank.</p><p><img src="/en/images/Systrace-Smooth%20e5d284a979a447ad8b45ff021d6e41cf/Untitled%2023.webp" alt="Yellow Frame"></p><h2 id="Red-Frame"><a href="#Red-Frame" class="headerlink" title="Red Frame"></a>Red Frame</h2><p>Indicates the frame took longer than 2 Vsync cycles. Red frames strongly suggest performance issues that are very likely to cause visible jank.</p><p><img src="/en/images/Systrace-Smooth%20e5d284a979a447ad8b45ff021d6e41cf/Untitled%2024.webp" alt="Red Frame"></p><p><a id="no-red"></a></p><h1 id="No-Red-Frame-Means-No-Dropped-Frame"><a href="#No-Red-Frame-Means-No-Dropped-Frame" class="headerlink" title="No Red Frame Means No Dropped Frame?"></a>No Red Frame Means No Dropped Frame?</h1><p>Not necessarily. Judging actual jank requires looking at <code>SurfaceFlinger</code>, not the App traces. This requires the foundational knowledge from <a href="https://www.androidperformance.com/en/2019/12/15/Android-Systrace-Triple-Buffer/">Triple Buffer Explained</a>.</p><h2 id="Yellow-Frame-Without-Jank"><a href="#Yellow-Frame-Without-Jank" class="headerlink" title="Yellow Frame Without Jank"></a>Yellow Frame Without Jank</h2><p>As noted, yellow frames mean the frame exceeded a cycle. However, thanks to Triple Buffering (and even more buffers on modern high-refresh devices), an App-side delay doesn’t always translate to an SF-side jank.</p><h2 id="Yellow-Frame-With-Jank"><a href="#Yellow-Frame-With-Jank" class="headerlink" title="Yellow Frame With Jank"></a>Yellow Frame With Jank</h2><p>In the Mi Launcher case analyzed in Part 2, there were only yellow frames. Two consecutive yellow frames occurred; the first caused a visible jank, while the second did not.</p><p><img src="/en/images/Systrace-Smooth%20e5d284a979a447ad8b45ff021d6e41cf/Untitled%2025.webp" alt="Yellow Frames Mixed"></p><p><a id="why-wait"></a></p><h1 id="Why-Does-the-Main-Thread-Wait-for-the-Render-Thread"><a href="#Why-Does-the-Main-Thread-Wait-for-the-Render-Thread" class="headerlink" title="Why Does the Main Thread Wait for the Render Thread?"></a>Why Does the Main Thread Wait for the Render Thread?</h1><p>Looking at the two yellow frames from the Mi trace, notice the UI Thread in the <em>second</em> yellow frame spent a lot of time waiting. Don’t mistake this for a UI thread bottleneck; it was in a “Sleep” state.</p><p>As explained in <a href="https://www.androidperformance.com/en/2019/11/06/Android-Systrace-MainThread-And-RenderThread/">MainThread and RenderThread Explained</a>, the UI thread must wait for the Render thread to finish <code>syncFrameState</code> before it is unblocked. In this case, the previous frame’s Render thread timeout caused the current frame’s Render thread task to queue, which in turn kept the UI thread waiting.</p><p><img src="/en/images/Systrace-Smooth%20e5d284a979a447ad8b45ff021d6e41cf/Untitled%2026.webp" alt="Wait Stack"></p><p><a id="why-hold"></a></p><h1 id="Why-Doesn’t-It-Jank-When-Swiping-Without-Releasing"><a href="#Why-Doesn’t-It-Jank-When-Swiping-Without-Releasing" class="headerlink" title="Why Doesn’t It Jank When Swiping Without Releasing?"></a>Why Doesn’t It Jank When Swiping Without Releasing?</h1><p>In the desktop swipe scenario, jank occurred only after the finger was released. Swiping while holding never janked. Why?</p><p>If you don’t release, the CPU maintains a continuous Boost state, and <code>RenderThread</code> tasks are scheduled on Big Cores (CPUs 4-6) rather than Small Cores. Naturally, no jank occurs.</p><p><img src="/en/images/Systrace-Smooth%20e5d284a979a447ad8b45ff021d6e41cf/Untitled%2027.webp" alt="Continuous Boost"></p><p>This <code>PerfLock</code> Boost timeout is typically 120ms (varies by model).</p><p><a id="metrics"></a></p><h1 id="If-It-Doesn’t-Jank-How-Do-We-Measure-Performance"><a href="#If-It-Doesn’t-Jank-How-Do-We-Measure-Performance" class="headerlink" title="If It Doesn’t Jank, How Do We Measure Performance?"></a>If It Doesn’t Jank, How Do We Measure Performance?</h1><p>If a scenario feels smooth on both devices, how do we compare performance?</p><p>Use <code>adb shell dumpsys gfxinfo</code> as follows:</p><ol><li>Identify the package and prepare the app.</li><li>Run <code>adb shell dumpsys gfxinfo &lt;package&gt; framestats reset</code> 2-3 times to clear history.</li><li>Perform the operation (e.g., swiping).</li><li>Run <code>adb shell dumpsys gfxinfo &lt;package&gt; framestats</code>.</li><li>Focus on:<ol><li><strong>Janky frames</strong>: Number of frames exceeding a cycle (not always perceived as jank).</li><li><strong>95th percentile</strong>: Frame time at the 95th percentile.</li><li><strong>HISTOGRAM</strong>: Distribution of frame times.</li><li><strong>PROFILEDATA</strong>: Raw details for every frame.</li></ol></li></ol><p>Comparing Mi 10 Pro vs. Oppo Reno 5 Pro (both at 90 fps target):</p><h2 id="Mi-10-Pro-90-fps"><a href="#Mi-10-Pro-90-fps" class="headerlink" title="Mi 10 Pro - 90 fps"></a>Mi 10 Pro - 90 fps</h2><p><img src="/en/images/16192690407230.jpg" alt="Mi Gfxinfo"></p><h2 id="Oppo-Reno-5-90-fps"><a href="#Oppo-Reno-5-90-fps" class="headerlink" title="Oppo Reno 5 - 90 fps"></a>Oppo Reno 5 - 90 fps</h2><p><img src="/en/images/16192690109378.jpg" alt="Oppo Gfxinfo"></p><p>Comparisons show Mi 10 Pro performance is actually weaker in this specific scenario:</p><ol><li><strong>Janky frames</strong>:<ul><li>Mi: 27 (35.53%)</li><li>Oppo: 1 (1.11%)</li></ul></li><li><strong>95th percentile</strong>:<ul><li>Mi: 18ms</li><li>Oppo: 5ms</li></ul></li></ol><p>Interestingly, while the Mi 10 Pro has a much stronger GPU (Snapdragon 865), its GPU stats are better, confirming the bottleneck in this scenario is CPU, not GPU.</p><p><a id="why-record"></a></p><h1 id="Why-Can’t-I-See-Jank-in-Screen-Recordings"><a href="#Why-Can’t-I-See-Jank-in-Screen-Recordings" class="headerlink" title="Why Can’t I See Jank in Screen Recordings?"></a>Why Can’t I See Jank in Screen Recordings?</h1><p>Several reasons:</p><ol><li>If you record a 90Hz screen at 60Hz, the recording will appear smooth even if 90Hz jank occurs (this applies to external camera recordings too).</li><li>If you record at 90Hz but playback on a 60Hz device (e.g., viewing an Mi recording on a standard PC&#x2F;phone), the player downsamples to 60Hz, hiding the jank.</li></ol><p><a id="series"></a></p><h1 id="Series-Articles"><a href="#Series-Articles" class="headerlink" title="Series Articles"></a>Series Articles</h1><ol><li><a href="https://www.androidperformance.com/en/2021/04/24/android-systrace-smooth-in-action-1/">Systrace Smoothness in Action 1: Understanding Jank Principles</a></li><li><a href="https://www.androidperformance.com/en/2021/04/24/android-systrace-smooth-in-action-2/">Systrace Smoothness in Action 2: Case Analysis - MIUI Launcher Scroll Jank Analysis</a></li><li><a href="https://www.androidperformance.com/en/2021/04/24/android-systrace-smooth-in-action-3/">Systrace Smoothness in Action 3: FAQs During Jank Analysis</a></li></ol><p><a id="attachments"></a></p><h1 id="Attachments"><a href="#Attachments" class="headerlink" title="Attachments"></a>Attachments</h1><p>Attachments are on GitHub: <a href="https://github.com/Gracker/SystraceForBlog/tree/master/Android_Systrace_Smooth_In_Action">https://github.com/Gracker/SystraceForBlog/tree/master/Android_Systrace_Smooth_In_Action</a></p><ol><li><code>xiaomi_launcher.zip</code>: Main analysis trace.</li><li><code>xiaomi_launcher_scroll_all_the_time.zip</code>: Continuous scrolling trace.</li><li><code>oppo_launcher_scroll.zip</code>: Comparison trace.</li></ol><p><a id="about"></a></p><h1 id="About-Me-amp-amp-Blog"><a href="#About-Me-amp-amp-Blog" class="headerlink" title="About Me &amp;&amp; Blog"></a>About Me &amp;&amp; Blog</h1><p>Below is my personal intro and related links. I look forward to exchanging ideas with fellow professionals. “When three walk together, one can always be my teacher!”</p><ol><li><a href="https://www.androidperformance.com/en/about/">Blogger Intro</a>: Includes personal WeChat and WeChat group links.</li><li><a href="https://www.androidperformance.com/en/2019/12/01/BlogMap/">Blog Content Navigation</a>: A guide for my blog content.</li><li><a href="https://www.androidperformance.com/en/2018/05/07/Android-performance-optimization-skills-and-tools/">Curated Excellent Blog Articles - Android Performance Optimization Must-Knows</a>: Welcome to recommend projects&#x2F;articles.</li><li><a href="https://www.androidperformance.com/en/2023/12/30/the-performance/">Android Performance Optimization Knowledge Planet</a>: Welcome to join and thank you for your support~</li></ol><blockquote><p><strong>One walks faster alone, but a group walks further together.</strong></p></blockquote><p><img src="/en/images/WechatIMG581.webp" alt="Scan WeChat QR Code"></p>]]></content>
    
    
    <summary type="html">&lt;p&gt;Different people have different understandings of smoothness (jank&amp;#x2F;dropped frames) and different perceptions of jitter thresholds. Therefore, before starting this series, it is necessary to clarify the content to avoid misunderstandings. Here are some basic explanations:&lt;/p&gt;
&lt;ol&gt;
&lt;li&gt;For mobile users, jank encompasses many scenarios: &lt;strong&gt;dropped frames when scrolling lists&lt;/strong&gt;, &lt;strong&gt;excessive white screen during app startup&lt;/strong&gt;, &lt;strong&gt;slow screen wake-up when pressing the power button&lt;/strong&gt;, &lt;strong&gt;unresponsive interface followed by a crash&lt;/strong&gt;, &lt;strong&gt;no response when clicking an icon&lt;/strong&gt;, &lt;strong&gt;incoherent window animations, lagging touch response, or stuttering when entering the desktop after a reboot&lt;/strong&gt;. These scenarios differ slightly from what developers understand as “jank.” Developers categorize these more finely, which is a cognitive gap between developers and users that must be noted when handling feedback from users or testers.&lt;/li&gt;
&lt;li&gt;For developers, the above scenarios fall into three major categories: &lt;strong&gt;Smoothness&lt;/strong&gt; (dropped frames in lists, incoherent animations, stuttering desktop entry), &lt;strong&gt;Responsiveness&lt;/strong&gt; (long startup white screens, slow screen wake-up, lagging touch), and &lt;strong&gt;Stability&lt;/strong&gt; (unresponsive interface&amp;#x2F;crashes, no response to icon clicks). This classification is used because each category requires different analysis methods and steps. Quickly identifying the category is crucial.&lt;/li&gt;
&lt;li&gt;Technically, &lt;strong&gt;Smoothness, Responsiveness, and Stability&lt;/strong&gt; (ANR) all feel like “jank” to users because their underlying principles are identical: the main thread’s Message exceeds its processing deadline. They are simply categorized by different timeout thresholds. Understanding these problems requires knowledge of basic system operation mechanisms, which this article will introduce.&lt;/li&gt;
&lt;li&gt;This series primarily analyzes smoothness-related issues. Responsiveness and stability will be covered in dedicated articles. Understanding smoothness first will make analyzing responsiveness and stability much easier.&lt;/li&gt;
&lt;li&gt;This series focuses on using Systrace (Perfetto) for analysis. Systrace is our entry point because many factors affect smoothness—some within the app itself and others within the system. Systrace (Perfetto) provides a holistic view of the system’s operation during the problem, helping us initially pinpoint the root cause.</summary>


    <category term="Android" scheme="https://androidperformance.com/en/categories/Android/"/>
    
    
    <category term="Android" scheme="https://androidperformance.com/en/tags/Android/"/>
    
    <category term="Perfetto" scheme="https://androidperformance.com/en/tags/Perfetto/"/>
    
    <category term="Systrace" scheme="https://androidperformance.com/en/tags/Systrace/"/>
    
    <category term="Startup" scheme="https://androidperformance.com/en/tags/Startup/"/>
    
    <category term="ANR" scheme="https://androidperformance.com/en/tags/ANR/"/>
    
  </entry>
  
  <entry>
    <title>Android Systrace Smoothness in Action 2 - Case Analysis - MIUI Launcher Scroll Jank Analysis</title>
    <link href="https://androidperformance.com/en/2021/04/24/android-systrace-smooth-in-action-2/"/>
    <id>https://androidperformance.com/en/2021/04/24/android-systrace-smooth-in-action-2/</id>
    <published>2021-04-24T11:55:07.000Z</published>
    <updated>2026-05-10T23:29:51.066Z</updated>
    
    <content type="html"><![CDATA[<p>Different people have different understandings of smoothness (jank&#x2F;dropped frames) and different perceptions of jitter thresholds. Therefore, before starting this series, it is necessary to clarify the content to avoid misunderstandings. Here are some basic explanations:</p><ol><li>For mobile users, jank encompasses many scenarios: <strong>dropped frames when scrolling lists</strong>, <strong>excessive white screen during app startup</strong>, <strong>slow screen wake-up when pressing the power button</strong>, <strong>unresponsive interface followed by a crash</strong>, <strong>no response when clicking an icon</strong>, <strong>incoherent window animations, lagging touch response, or stuttering when entering the desktop after a reboot</strong>. These scenarios differ slightly from what developers understand as “jank.” Developers categorize these more finely, which is a cognitive gap between developers and users that must be noted when handling feedback from users or testers.</li><li>For developers, the above scenarios fall into three major categories: <strong>Smoothness</strong> (dropped frames in lists, incoherent animations, stuttering desktop entry), <strong>Responsiveness</strong> (long startup white screens, slow screen wake-up, lagging touch), and <strong>Stability</strong> (unresponsive interface&#x2F;crashes, no response to icon clicks). This classification is used because each category requires different analysis methods and steps. Quickly identifying the category is crucial.</li><li>Technically, <strong>Smoothness, Responsiveness, and Stability</strong> (ANR) all feel like “jank” to users because their underlying principles are identical: the main thread’s Message exceeds its processing deadline. They are simply categorized by different timeout thresholds. Understanding these problems requires knowledge of basic system operation mechanisms, which this article will introduce.</li><li>This series primarily analyzes smoothness-related issues. Responsiveness and stability will be covered in dedicated articles. Understanding smoothness first will make analyzing responsiveness and stability much easier.</li><li>This series focuses on using Systrace (Perfetto) for analysis. Systrace is our entry point because many factors affect smoothness—some within the app itself and others within the system. Systrace (Perfetto) provides a holistic view of the system’s operation during the problem, helping us initially pinpoint the root cause.<span id="more"></span></li></ol><h2 id="Table-of-Contents"><a href="#Table-of-Contents" class="headerlink" title="Table of Contents"></a>Table of Contents</h2><ul><li><a href="#steps">The Routine for Analyzing Jank with Systrace</a></li><li><a href="#case">Case Study: Analyzing Jank with Systrace</a></li><li><a href="#case-desc">Case Description</a></li><li><a href="#triple-buffer">What Role Does Triple Buffer Play in This Scenario?</a></li><li><a href="#series">Series Articles</a></li><li><a href="#attachments">Attachments</a></li><li><a href="#about">About Me &amp;&amp; Blog</a></li></ul><p><strong>Systrace Series Articles:</strong></p><ol><li><a href="https://www.androidperformance.com/en/2019/05/28/Android-Systrace-About/">Introduction to Systrace</a></li><li><a href="https://www.androidperformance.com/en/2019/07/23/Android-Systrace-Pre/">Systrace Basics - Prerequisites for Systrace</a></li><li><a href="https://www.androidperformance.com/en/2019/05/27/why-60-fps/">Systrace Basics - Why 60 fps?</a></li><li><a href="https://www.androidperformance.com/en/2019/06/29/Android-Systrace-SystemServer/">Android Systrace Basics - SystemServer Explained</a></li><li><a href="https://www.androidperformance.com/en/2020/02/14/Android-Systrace-SurfaceFlinger/">Systrace Basics - SurfaceFlinger Explained</a></li><li><a href="https://www.androidperformance.com/en/2019/11/04/Android-Systrace-Input/">Systrace Basics - Input Explained</a></li><li><a href="https://www.androidperformance.com/en/2019/12/01/Android-Systrace-Vsync/">Systrace Basics - Vsync Explained</a></li><li><a href="https://www.androidperformance.com/en/2019/10/22/Android-Choreographer/">Systrace Basics - Vsync-App: Detailed Explanation of Choreographer-Based Rendering Mechanism</a></li><li><a href="https://www.androidperformance.com/en/2019/11/06/Android-Systrace-MainThread-And-RenderThread/">Systrace Basics - MainThread and RenderThread Explained</a></li><li><a href="https://www.androidperformance.com/en/2019/12/06/Android-Systrace-Binder/">Systrace Basics - Binder and Lock Contention Explained</a></li><li><a href="https://www.androidperformance.com/en/2019/12/15/Android-Systrace-Triple-Buffer">Systrace Basics - Triple Buffer Explained</a></li><li><a href="https://www.androidperformance.com/en/2019/12/21/Android-Systrace-CPU">Systrace Basics - CPU Info Explained</a></li><li><a href="https://www.androidperformance.com/en/2021/04/24/android-systrace-smooth-in-action-1/">Systrace Smoothness in Action 1: Understanding Jank Principles</a></li><li><a href="https://www.androidperformance.com/en/2021/04/24/android-systrace-smooth-in-action-2/">Systrace Smoothness in Action 2: Case Analysis - MIUI Launcher Scroll Jank Analysis</a></li><li><a href="https://www.androidperformance.com/en/2021/04/24/android-systrace-smooth-in-action-3/">Systrace Smoothness in Action 3: FAQs During Jank Analysis</a></li><li><a href="https://www.androidperformance.com/en/2021/09/13/android-systrace-Responsiveness-in-action-1/">Systrace Responsiveness in Action 1: Understanding Responsiveness Principles</a></li><li><a href="https://www.androidperformance.com/en/2021/09/13/android-systrace-Responsiveness-in-action-2/">Systrace Responsiveness in Action 2: Responsiveness Analysis - Using App Startup as an Example</a></li><li><a href="https://www.androidperformance.com/en/2021/09/13/android-systrace-Responsiveness-in-action-3/">Systrace Responsiveness in Action 3: Extended Knowledge on Responsiveness</a></li><li><a href="https://www.androidperformance.com/en/2022/01/21/android-systrace-cpu-state-runnable/">Systrace Thread CPU State Analysis Tips - Runnable</a></li><li><a href="https://www.androidperformance.com/en/2022/03/13/android-systrace-cpu-state-running/">Systrace Thread CPU State Analysis Tips - Running</a></li><li><a href="https://www.androidperformance.com/en/2022/03/13/android-systrace-cpu-state-sleep/">Systrace Thread CPU State Analysis Tips - Sleep and Uninterruptible Sleep</a></li></ol><p>If you are not familiar with the basic use of Systrace (Perfetto), please catch up on the <a href="https://www.androidperformance.com/en/2019/05/26/Android_Systrace_0/">Systrace Basics Series</a> first. This article assumes you are already familiar with using Systrace (Perfetto).</p><p><a id="steps"></a></p><h1 id="The-Routine-for-Analyzing-Jank-with-Systrace"><a href="#The-Routine-for-Analyzing-Jank-with-Systrace" class="headerlink" title="The Routine for Analyzing Jank with Systrace"></a>The Routine for Analyzing Jank with Systrace</h1><p>The general workflow for using Systrace to analyze jank is as follows:</p><ol><li><p><strong>Reproduce the jank scenario and capture a Systrace using shell or built-in tools.</strong></p></li><li><p><strong>Open the captured <code>trace.html</code> directly in Chrome.</strong></p><ol><li>If it doesn’t open directly, type <code>chrome://tracing/</code> in Chrome and drag the file onto the page.</li><li>Alternatively, use Perfetto View and select “Open With Legacy UI.”</li></ol></li><li><p><strong>Understand the context of the problem to improve analysis efficiency.</strong></p><ol><li>User (or tester) operation steps.</li><li>Reproduction probability.</li><li>Whether competitor devices exhibit the same jank.</li></ol></li><li><p><strong>Before or during analysis, check the Systrace for basic info:</strong></p><ol><li>CPU frequency, architecture, Boost info, etc.</li><li>Thermal throttling: Manifests as suppressed CPU frequencies.</li><li>High load scenarios: Manifests as very dense tasks in CPU zones.</li><li>Low memory scenarios: Manifests as busy <code>lmkd</code>, slow <code>HeapTaskDeamon</code> in the App process, or many Block IOs.</li></ol></li><li><p><strong>Locate the App process in Systrace.</strong></p><ol><li><p><strong>The first thing to look at is the App process, specifically the UI thread and Render thread.</strong> Find time-consuming frames. E.g., the red box below shows a UI Thread taking 110ms—clearly abnormal (from a Bilibili list scroll jank case). <img src="/en/images/android-systrace-smooth-in-action-2/image-20220228231805317.webp" alt="image-20220228231805317"></p></li><li><p>In fact, any <code>doFrame</code> that exceeds a Vsync cycle (Yellow and Red frames) needs checking for actual jank. Even without jank, look for reasons. E.g.:</p><p><img src="/en/images/android-systrace-smooth-in-action-2/image-20220228231830063.webp" alt="image-20220228231830063"></p></li><li><p>Vsync cycle vs. Refresh rate:</p><ol><li>60fps: 16.6ms cycle.</li><li>90fps: 11.1ms cycle.</li><li>120fps: 8.3ms cycle.</li></ol></li></ol></li><li><p><strong>Analyze the SurfaceFlinger process’s Main thread and Binder thread.</strong></p><ol><li><p>Due to multiple buffer mechanisms, the App main&#x2F;render threads might exceed a cycle without causing jank. Check <code>SurfaceFlinger</code>‘s Main thread to confirm. E.g., for the 110ms app frame above, the SF Main thread looks like this:</p><p><img src="/en/images/android-systrace-smooth-in-action-2/image-20220228231855706.webp" alt="image-20220228231855706"></p></li><li><p>The App’s Buffer count in the SF process area is also empty:</p><p><img src="/en/images/android-systrace-smooth-in-action-2/image-20220228231914525.webp" alt="image-20220228231914525"></p></li></ol></li><li><p><strong>System-wide and Binder call analysis (optional).</strong></p><ol><li>In the Bilibili case, the bottleneck is clearly within the App itself. Optimizing the relevant View or logic would suffice.</li><li>Sometimes the App UI thread is slow due to excessive <code>Runnable</code> states or Binder call timeouts, which requires system-wide analysis to find the root cause.</li></ol></li></ol><p>After following this routine, cross-reference data across processes to infer the most likely cause.</p><p>App frame drops have many causes. Refer to these articles; different causes have distinct Systrace signatures:</p><ol><li><a href="https://www.androidperformance.com/en/2019/09/05/Android-Jank-Debug/">Overview of Jank Causes in Android - Methodology</a></li><li><a href="https://www.androidperformance.com/en/2019/09/05/Android-Jank-Due-To-System/">Overview of Jank Causes in Android - System Side</a></li><li><a href="https://www.androidperformance.com/en/2019/09/05/Android-Jank-Due-To-App/">Overview of Jank Causes in Android - App Side</a></li><li><a href="https://www.androidperformance.com/en/2019/09/18/Android-Jank-Due-To-Low-Memory/">Overview of Jank Causes in Android - Low Memory Side</a></li></ol><p><a id="case"></a></p><h1 id="Case-Study-Analyzing-Jank-with-Systrace"><a href="#Case-Study-Analyzing-Jank-with-Systrace" class="headerlink" title="Case Study: Analyzing Jank with Systrace"></a>Case Study: Analyzing Jank with Systrace</h1><p>Systrace is the primary tool for analyzing jank, providing a global view to determine if jank is system-driven or app-specific.</p><p>However, for deeper analysis, Systrace can be limited. It often needs to be paired with TraceView and source code to pinpoint and solve issues, and then verified again with Systrace.</p><p>This article focuses on discovery and analysis. Solutions (like optimizing logic, scheduling, or layout) must be tailored to findings.</p><p><a id="case-desc"></a></p><h1 id="Case-Description"><a href="#Case-Description" class="headerlink" title="Case Description"></a>Case Description</h1><p>On my Mi 10 Pro, I often felt a stutter during the common gesture of swiping the desktop. Since the Mi 10 Pro has a 90Hz screen and 90 FPS target, jank is very noticeable. After upgrading to MIUI 12.5, the issue remained, so I decided to investigate.</p><p>The captured Systrace revealed a perfect case study for smoothness analysis.</p><p>I recommend downloading the attached Systrace and following along with the article.</p><blockquote><ol><li>Because many factors affect jank, I’ll clarify the hardware and software versions first. Findings apply to the attached Systrace even if the scenario is optimized later.</li><li>Hardware: Mi 10 Pro</li><li>Software: MIUI 12.5.3 Stable</li><li>Launcher Version: RELEASE-4.21.11.2922-03151646</li></ol></blockquote><h2 id="Starting-with-Input-events"><a href="#Starting-with-Input-events" class="headerlink" title="Starting with Input events"></a>Starting with Input events</h2><p>In the captured Systrace, I performed only one swipe, making it easy to locate. The input sequence consists of one Input Down, several Input Moves, and one Input Up.</p><p>In Systrace, we see <code>InputDispatcher</code> and <code>InputReader</code> threads in <code>SystemServer</code>, but we primarily focus on the App UI thread.</p><p><img src="/en/images/Systrace-Smooth%20e5d284a979a447ad8b45ff021d6e41cf/Untitled%208.webp" alt="Input in Systrace"></p><p>As shown above, <code>deliverInputEvent</code> on the App UI thread marks input processing. After “Input Up,” the “Fling” phase begins. Basics:</p><ol><li><a href="https://www.androidperformance.com/en/2019/11/04/Android-Systrace-Input/">Input Explained</a></li><li><a href="https://www.androidperformance.com/en/2020/08/20/weibo-imageload-opt-on-huawei/">Weibo Image Loading Optimization Case</a></li></ol><h2 id="Analyzing-the-UI-Thread"><a href="#Analyzing-the-UI-Thread" class="headerlink" title="Analyzing the UI Thread"></a>Analyzing the UI Thread</h2><p>Since this jank mostly occurred after releasing the finger, we focus on the segment after “Input Up.”</p><p><img src="/en/images/Systrace-Smooth%20e5d284a979a447ad8b45ff021d6e41cf/Untitled%209.webp" alt="UI Thread Post-Input-Up"></p><p>UI thread frames are color-coded: Green, Yellow, Red. In this trace, there are no red frames, only green and yellow. Is a yellow frame always a jank? Not necessarily. We can’t confirm jank from the UI thread alone.</p><p>Identifying three suspicious points, we move to the RenderThread.</p><h2 id="Analyzing-the-Render-Thread"><a href="#Analyzing-the-Render-Thread" class="headerlink" title="Analyzing the Render Thread"></a>Analyzing the Render Thread</h2><p>Zooming into the first suspicious point: total frame time is 19ms, with RenderThread taking 16ms. The RenderThread CPU state is “Running” (green). This delay is likely due to:</p><ol><li>RenderThread is busy with heavy tasks.</li><li>RenderThread performance is bottlenecked by the CPU (low frequency or small cores).</li></ol><p><img src="/en/images/Systrace-Smooth%20e5d284a979a447ad8b45ff021d6e41cf/Untitled%2010.webp" alt="RenderThread Suspicious Point"></p><p>Before looking at the CPU, we check <code>SurfaceFlinger</code> to confirm actual jank.</p><h2 id="Analyzing-SurfaceFlinger"><a href="#Analyzing-SurfaceFlinger" class="headerlink" title="Analyzing SurfaceFlinger"></a>Analyzing SurfaceFlinger</h2><p>For basics on SF trace reading, see <a href="https://www.androidperformance.com/en/2020/02/14/Android-Systrace-SurfaceFlinger/">SurfaceFlinger Explained</a>.</p><p>We focus on two points:</p><ol><li>Buffer status in the App’s <code>BufferQueue</code>. Does <code>SurfaceFlinger</code> have a buffer available from the app?</li><li><code>SurfaceFlinger</code> Main thread composition. If SF-vsync arrives and composition occurs, was it for our app?</li></ol><p><strong>Criteria for Judging Jank:</strong></p><ol><li><p>If SF has no composition task and the App worked during that cycle but provided no Buffer to <code>BufferQueue</code>, <strong>jank occurred</strong>.<br>(Matches the first suspicious point).</p><p><img src="/en/images/Systrace-Smooth%20e5d284a979a447ad8b45ff021d6e41cf/Untitled%2011.webp" alt="SF Jank Type 1"></p></li><li><p>If SF performs composition but our App’s <code>BufferQueue</code> is empty, <strong>jank still occurred</strong> for our App. SF likely composited other layers.</p><p><img src="/en/images/Systrace-Smooth%20e5d284a979a447ad8b45ff021d6e41cf/Untitled%2012.webp" alt="SF Jank Type 2"></p></li><li><p>If SF performs composition and our App has a Buffer available, <strong>everything is normal</strong>.<br>(Provided for comparison).</p><p><img src="/en/images/Systrace-Smooth%20e5d284a979a447ad8b45ff021d6e41cf/Untitled%2013.webp" alt="SF Normal"></p></li></ol><p>At the first suspicious point, SF confirms a frame was dropped because the App didn’t provide a Buffer. Why?</p><h2 id="Back-to-the-Render-Thread"><a href="#Back-to-the-Render-Thread" class="headerlink" title="Back to the Render Thread"></a>Back to the Render Thread</h2><p>The 19ms total frame time (16ms in RenderThread) is unusual for a low-load scenario like desktop scrolling, especially since the previous frame was 3x faster. This isn’t a task load issue.</p><p>Check the RenderThread CPU info:</p><p><img src="/en/images/Systrace-Smooth%20e5d284a979a447ad8b45ff021d6e41cf/Untitled%2014.webp" alt="RenderThread CPU State"></p><p>Since it’s “Running,” we check the Kernel area for scheduling details.</p><h2 id="Analyzing-CPU-Info"><a href="#Analyzing-CPU-Info" class="headerlink" title="Analyzing CPU Info"></a>Analyzing CPU Info</h2><p>See <a href="https://www.androidperformance.com/en/2019/12/21/Android-Systrace-CPU">CPU Info Explained</a> and <a href="https://www.androidperformance.com/en/2019/07/23/Android-Systrace-Pre/">Prerequisites for Systrace</a>.</p><p>In this case, the RenderThread is mostly on CPUs 0 and 2—the <strong>Small Cores</strong> of the Snapdragon 865 (which has 4 Small, 3 Big, and 1 Prime core).</p><p><img src="/en/images/Systrace-Smooth%20e5d284a979a447ad8b45ff021d6e41cf/Untitled%2015.webp" alt="Small Core Scheduling"></p><p>The frequency is capped at 1.8GHz (Small core max).</p><p><img src="/en/images/Systrace-Smooth%20e5d284a979a447ad8b45ff021d6e41cf/Untitled%2016.webp" alt="Small Core Frequency Trace"></p><p>And there’s no CPU Boost active.</p><p><img src="/en/images/Systrace-Smooth%20e5d284a979a447ad8b45ff021d6e41cf/Untitled%2017.webp" alt="No CPU Boost"></p><p>Hypothesis: Small cores even at max frequency can’t finish the task in time. Validation steps:</p><ol><li>Are normal frames also on small cores? (If yes without jank, the hypothesis is wrong).</li><li>Are other janky frames also caused by small core scheduling?</li></ol><p>Analysis reveals:</p><ol><li>Normal frames are NOT on small cores. After a jank, the scheduler immediately moves RenderThread back to big cores.</li><li>Every janky frame was caused by <strong>RenderThread being scheduled on small cores which lacked the performance to finish on time</strong>.</li></ol><p>Cause found: <strong>RenderThread being scheduled on Small Cores</strong>.</p><p>Scheduling is controlled by complexity algorithms based on task load. Optimizations:</p><ol><li>Adjust core migration thresholds or scheduler algorithms.</li><li>Compare competitor strategies and scheduling indicators in similar scenarios.</li></ol><p><a id="triple-buffer"></a></p><h1 id="What-Role-Does-Triple-Buffer-Play-in-This-Scenario"><a href="#What-Role-Does-Triple-Buffer-Play-in-This-Scenario" class="headerlink" title="What Role Does Triple Buffer Play in This Scenario?"></a>What Role Does Triple Buffer Play in This Scenario?</h1><p>In <a href="https://www.androidperformance.com/en/2019/12/15/Android-Systrace-Triple-Buffer/#The-Role-of-Triple-Buffer">Triple Buffer Explained</a>, we noted it helps:</p><ol><li>Mitigate jank.</li><li>Reduce wait times.</li><li>Lower bottlenecks.</li></ol><p>However, in this Mi Launcher case, it sometimes had a <strong>negative impact</strong>, worsening the perceived jank:</p><p>See the <strong>Mitigating Jank</strong> principle:</p><p><img src="/en/images/Systrace-Smooth%20e5d284a979a447ad8b45ff021d6e41cf/Untitled%2018.webp" alt="Triple Buffer Principle"></p><p>In the Mi Launcher trace, the <code>BufferQueue</code> sometimes dropped from 2 available buffers to 0, effectively <strong>discarding a buffer</strong>:</p><p><img src="/en/images/Systrace-Smooth%20e5d284a979a447ad8b45ff021d6e41cf/Untitled%2019.webp" alt="Discarding a Buffer"></p><p>If a subsequent RenderThread timeout occurs during a Fling, no spare buffer is left to cushion it, resulting in an immediate jank. Triple buffering’s mitigation effect is lost.</p><p><img src="/en/images/Systrace-Smooth%20e5d284a979a447ad8b45ff021d6e41cf/Untitled%2020.webp" alt="Lost Cushioning"></p><p>Furthermore, since Fling offsets are pre-calculated, discarding a frame buffer causes a visual “jump”:</p><p><img src="/en/images/Systrace-Smooth%20e5d284a979a447ad8b45ff021d6e41cf/Untitled%2021.webp" alt="Visual Jump"></p><p>Example with scrolling offsets:</p><ol><li>Normal: <code>2→4→6→8→10→12</code></li><li>Dropped (cushioned): <code>2→4→6→6→8→10→12</code> (Frame “8” delayed, user sees “6” twice—smooth decay).</li><li>Discarded: <code>2→4→6→6→10→12</code> (Frame “8” discarded, jumps from “6” to “10”—feels like a <strong>jank + a jump</strong>).</li></ol><p><a id="series"></a></p><h1 id="Series-Articles"><a href="#Series-Articles" class="headerlink" title="Series Articles"></a>Series Articles</h1><ol><li><a href="https://www.androidperformance.com/en/2021/04/24/android-systrace-smooth-in-action-1/">Systrace Smoothness in Action 1: Understanding Jank Principles</a></li><li><a href="https://www.androidperformance.com/en/2021/04/24/android-systrace-smooth-in-action-2/">Systrace Smoothness in Action 2: Case Analysis - MIUI Launcher Scroll Jank Analysis</a></li><li><a href="https://www.androidperformance.com/en/2021/04/24/android-systrace-smooth-in-action-3/">Systrace Smoothness in Action 3: FAQs During Jank Analysis</a></li></ol><p><a id="attachments"></a></p><h1 id="Attachments"><a href="#Attachments" class="headerlink" title="Attachments"></a>Attachments</h1><p>Attachments are on GitHub: <a href="https://github.com/Gracker/SystraceForBlog/tree/master/Android_Systrace_Smooth_In_Action">https://github.com/Gracker/SystraceForBlog/tree/master/Android_Systrace_Smooth_In_Action</a></p><ol><li><code>xiaomi_launcher.zip</code>: Main analysis trace.</li><li><code>xiaomi_launcher_scroll_all_the_time.zip</code>: Continuous scrolling trace.</li><li><code>oppo_launcher_scroll.zip</code>: Comparison trace.</li></ol><p><a id="about"></a></p><h1 id="About-Me-amp-amp-Blog"><a href="#About-Me-amp-amp-Blog" class="headerlink" title="About Me &amp;&amp; Blog"></a>About Me &amp;&amp; Blog</h1><p>Below is my personal intro and related links. I look forward to exchanging ideas with fellow professionals. “When three walk together, one can always be my teacher!”</p><ol><li><a href="https://www.androidperformance.com/en/about/">Blogger Intro</a>: Includes personal WeChat and WeChat group links.</li><li><a href="https://www.androidperformance.com/en/2019/12/01/BlogMap/">Blog Content Navigation</a>: A guide for my blog content.</li><li><a href="https://www.androidperformance.com/en/2018/05/07/Android-performance-optimization-skills-and-tools/">Curated Excellent Blog Articles - Android Performance Optimization Must-Knows</a>: Welcome to recommend projects&#x2F;articles.</li><li><a href="https://www.androidperformance.com/en/2023/12/30/the-performance/">Android Performance Optimization Knowledge Planet</a>: Welcome to join and thank you for your support~</li></ol><blockquote><p><strong>One walks faster alone, but a group walks further together.</strong></p></blockquote><p><img src="/en/images/WechatIMG581.webp" alt="Scan WeChat QR Code"></p>]]></content>
    
    
    <summary type="html">&lt;p&gt;Different people have different understandings of smoothness (jank&amp;#x2F;dropped frames) and different perceptions of jitter thresholds. Therefore, before starting this series, it is necessary to clarify the content to avoid misunderstandings. Here are some basic explanations:&lt;/p&gt;
&lt;ol&gt;
&lt;li&gt;For mobile users, jank encompasses many scenarios: &lt;strong&gt;dropped frames when scrolling lists&lt;/strong&gt;, &lt;strong&gt;excessive white screen during app startup&lt;/strong&gt;, &lt;strong&gt;slow screen wake-up when pressing the power button&lt;/strong&gt;, &lt;strong&gt;unresponsive interface followed by a crash&lt;/strong&gt;, &lt;strong&gt;no response when clicking an icon&lt;/strong&gt;, &lt;strong&gt;incoherent window animations, lagging touch response, or stuttering when entering the desktop after a reboot&lt;/strong&gt;. These scenarios differ slightly from what developers understand as “jank.” Developers categorize these more finely, which is a cognitive gap between developers and users that must be noted when handling feedback from users or testers.&lt;/li&gt;
&lt;li&gt;For developers, the above scenarios fall into three major categories: &lt;strong&gt;Smoothness&lt;/strong&gt; (dropped frames in lists, incoherent animations, stuttering desktop entry), &lt;strong&gt;Responsiveness&lt;/strong&gt; (long startup white screens, slow screen wake-up, lagging touch), and &lt;strong&gt;Stability&lt;/strong&gt; (unresponsive interface&amp;#x2F;crashes, no response to icon clicks). This classification is used because each category requires different analysis methods and steps. Quickly identifying the category is crucial.&lt;/li&gt;
&lt;li&gt;Technically, &lt;strong&gt;Smoothness, Responsiveness, and Stability&lt;/strong&gt; (ANR) all feel like “jank” to users because their underlying principles are identical: the main thread’s Message exceeds its processing deadline. They are simply categorized by different timeout thresholds. Understanding these problems requires knowledge of basic system operation mechanisms, which this article will introduce.&lt;/li&gt;
&lt;li&gt;This series primarily analyzes smoothness-related issues. Responsiveness and stability will be covered in dedicated articles. Understanding smoothness first will make analyzing responsiveness and stability much easier.&lt;/li&gt;
&lt;li&gt;This series focuses on using Systrace (Perfetto) for analysis. Systrace is our entry point because many factors affect smoothness—some within the app itself and others within the system. Systrace (Perfetto) provides a holistic view of the system’s operation during the problem, helping us initially pinpoint the root cause.</summary>


    <category term="Android" scheme="https://androidperformance.com/en/categories/Android/"/>
    
    
    <category term="Android" scheme="https://androidperformance.com/en/tags/Android/"/>
    
    <category term="Perfetto" scheme="https://androidperformance.com/en/tags/Perfetto/"/>
    
    <category term="Systrace" scheme="https://androidperformance.com/en/tags/Systrace/"/>
    
    <category term="Startup" scheme="https://androidperformance.com/en/tags/Startup/"/>
    
    <category term="ANR" scheme="https://androidperformance.com/en/tags/ANR/"/>
    
  </entry>
  
  <entry>
    <title>Android Systrace Smoothness in Action 1 - Understanding Jank Principles</title>
    <link href="https://androidperformance.com/en/2021/04/24/android-systrace-smooth-in-action-1/"/>
    <id>https://androidperformance.com/en/2021/04/24/android-systrace-smooth-in-action-1/</id>
    <published>2021-04-24T11:55:02.000Z</published>
    <updated>2026-05-10T23:29:51.065Z</updated>
    
    <content type="html"><![CDATA[<p>Different people have different understandings of smoothness (jank&#x2F;dropped frames) and different perceptions of jitter thresholds. Therefore, before starting this series, it is necessary to clarify the content to avoid misunderstandings and help everyone approach these articles with the right questions. Here are some basic explanations:</p><ol><li>For mobile users, jank encompasses many scenarios: <strong>dropped frames when scrolling lists</strong>, <strong>excessive white screen during app startup</strong>, <strong>slow screen wake-up when pressing the power button</strong>, <strong>unresponsive interface followed by a crash</strong>, <strong>no response when clicking an icon</strong>, <strong>incoherent window animations, lagging touch response, or stuttering when entering the desktop after a reboot</strong>. These scenarios differ slightly from what developers understand as “jank.” Developers categorize these more finely, which is a cognitive gap between developers and users that must be noted when handling feedback from users or testers.</li><li>For developers, the above scenarios fall into three major categories: <strong>Smoothness</strong> (dropped frames in lists, incoherent animations, stuttering desktop entry), <strong>Responsiveness</strong> (long startup white screens, slow screen wake-up, lagging touch), and <strong>Stability</strong> (unresponsive interface&#x2F;crashes, no response to icon clicks). This classification is used because each category requires different analysis methods and steps. Quickly identifying the category is crucial.</li><li>Technically, <strong>Smoothness, Responsiveness, and Stability</strong> (ANR) all feel like “jank” to users because their underlying principles are identical: the main thread’s Message exceeds its processing deadline. They are simply categorized by different timeout thresholds. Understanding these problems requires knowledge of basic system operation mechanisms, which this article will introduce.</li><li>This series primarily analyzes smoothness-related issues. Responsiveness and stability will be covered in dedicated articles. Understanding smoothness first will make analyzing responsiveness and stability much easier.</li><li>This series focuses on using Systrace (Perfetto) for analysis. Systrace is our entry point because many factors affect smoothness—some within the app itself and others within the system. Systrace (Perfetto) provides a holistic view of the system’s operation during the problem, helping us initially pinpoint the root cause.<span id="more"></span></li></ol><h2 id="Table-of-Contents"><a href="#Table-of-Contents" class="headerlink" title="Table of Contents"></a>Table of Contents</h2><ul><li><a href="#intro">Understanding Jank Principles</a></li><li><a href="#system">System Operation Mechanism Overview</a></li><li><a href="#series">Series Articles</a></li><li><a href="#attachments">Attachments</a></li><li><a href="#about">About Me &amp;&amp; Blog</a></li></ul><p><strong>Systrace Series Articles:</strong></p><ol><li><a href="https://www.androidperformance.com/en/2019/05/28/Android-Systrace-About/">Introduction to Systrace</a></li><li><a href="https://www.androidperformance.com/en/2019/07/23/Android-Systrace-Pre/">Systrace Basics - Prerequisites for Systrace</a></li><li><a href="https://www.androidperformance.com/en/2019/05/27/why-60-fps/">Systrace Basics - Why 60 fps?</a></li><li><a href="https://www.androidperformance.com/en/2019/06/29/Android-Systrace-SystemServer/">Android Systrace Basics - SystemServer Explained</a></li><li><a href="https://www.androidperformance.com/en/2020/02/14/Android-Systrace-SurfaceFlinger/">Systrace Basics - SurfaceFlinger Explained</a></li><li><a href="https://www.androidperformance.com/en/2019/11/04/Android-Systrace-Input/">Systrace Basics - Input Explained</a></li><li><a href="https://www.androidperformance.com/en/2019/12/01/Android-Systrace-Vsync/">Systrace Basics - Vsync Explained</a></li><li><a href="https://www.androidperformance.com/en/2019/10/22/Android-Choreographer/">Systrace Basics - Vsync-App: Detailed Explanation of Choreographer-Based Rendering Mechanism</a></li><li><a href="https://www.androidperformance.com/en/2019/11/06/Android-Systrace-MainThread-And-RenderThread/">Systrace Basics - MainThread and RenderThread Explained</a></li><li><a href="https://www.androidperformance.com/en/2019/12/06/Android-Systrace-Binder/">Systrace Basics - Binder and Lock Contention Explained</a></li><li><a href="https://www.androidperformance.com/en/2019/12/15/Android-Systrace-Triple-Buffer">Systrace Basics - Triple Buffer Explained</a></li><li><a href="https://www.androidperformance.com/en/2019/12/21/Android-Systrace-CPU">Systrace Basics - CPU Info Explained</a></li><li><a href="https://www.androidperformance.com/en/2021/04/24/android-systrace-smooth-in-action-1/">Systrace Smoothness in Action 1: Understanding Jank Principles</a></li><li><a href="https://www.androidperformance.com/en/2021/04/24/android-systrace-smooth-in-action-2/">Systrace Smoothness in Action 2: Case Analysis - MIUI Launcher Scroll Jank Analysis</a></li><li><a href="https://www.androidperformance.com/en/2021/04/24/android-systrace-smooth-in-action-3/">Systrace Smoothness in Action 3: FAQs During Jank Analysis</a></li><li><a href="https://www.androidperformance.com/en/2021/09/13/android-systrace-Responsiveness-in-action-1/">Systrace Responsiveness in Action 1: Understanding Responsiveness Principles</a></li><li><a href="https://www.androidperformance.com/en/2021/09/13/android-systrace-Responsiveness-in-action-2/">Systrace Responsiveness in Action 2: Responsiveness Analysis - Using App Startup as an Example</a></li><li><a href="https://www.androidperformance.com/en/2021/09/13/android-systrace-Responsiveness-in-action-3/">Systrace Responsiveness in Action 3: Extended Knowledge on Responsiveness</a></li><li><a href="https://www.androidperformance.com/en/2022/01/21/android-systrace-cpu-state-runnable/">Systrace Thread CPU State Analysis Tips - Runnable</a></li><li><a href="https://www.androidperformance.com/en/2022/03/13/android-systrace-cpu-state-running/">Systrace Thread CPU State Analysis Tips - Running</a></li><li><a href="https://www.androidperformance.com/en/2022/03/13/android-systrace-cpu-state-sleep/">Systrace Thread CPU State Analysis Tips - Sleep and Uninterruptible Sleep</a></li></ol><p>If you are not familiar with the basic use of Systrace (Perfetto), please catch up on the <a href="https://www.androidperformance.com/en/2019/05/26/Android_Systrace_0/">Systrace Basics Series</a> first. This article assumes you are already familiar with using Systrace (Perfetto).</p><p><a id="intro"></a></p><h1 id="Understanding-Jank-Principles"><a href="#Understanding-Jank-Principles" class="headerlink" title="Understanding Jank Principles"></a>Understanding Jank Principles</h1><h2 id="Jank-Phenomena-and-Impact"><a href="#Jank-Phenomena-and-Impact" class="headerlink" title="Jank Phenomena and Impact"></a>Jank Phenomena and Impact</h2><p>As stated at the beginning, this article focuses on smoothness issues. Smoothness is a qualitative definition, but we often use <strong>fps</strong> (Frames Per Second) to quantify it. For example, 60 fps means the screen updates 60 times per second; 120 fps means 120 times. On a 120 fps system, if the screen only updates 110 times in a second (during continuous animation), we call this a <strong>dropped frame</strong>, which manifests as <strong>jank</strong>. The fps drops from 120 to 110, which can be accurately monitored.</p><p>Dropped frames have many causes: app-specific issues, system-driven jank, hardware bottlenecks, or overall system lag. Refer to these four articles:</p><ol><li><a href="https://www.androidperformance.com/en/2019/09/05/Android-Jank-Debug/">Overview of Jank Causes in Android - Methodology</a></li><li><a href="https://www.androidperformance.com/en/2019/09/05/Android-Jank-Due-To-System/">Overview of Jank Causes in Android - System Side</a></li><li><a href="https://www.androidperformance.com/en/2019/09/05/Android-Jank-Due-To-App/">Overview of Jank Causes in Android - App Side</a></li><li><a href="https://www.androidperformance.com/en/2019/09/18/Android-Jank-Due-To-Low-Memory/">Overview of Jank Causes in Android - Low Memory Side</a></li></ol><p>Jank is what users notice first:</p><ol><li>Occasional minor jank degrades user experience, like a stutter when scrolling Weibo or returning to the desktop.</li><li>Severe system-wide jank makes the phone unusable.</li><li>In the high-refresh-rate era, if users are accustomed to 120 fps and the system suddenly switches to 60 fps in an easily perceptible scenario, they will immediately notice and feel it as jank.</li></ol><p>Therefore, both apps and systems should aim to avoid jank. Identified jank issues should be prioritized for resolution.</p><h2 id="Jank-Definition"><a href="#Jank-Definition" class="headerlink" title="Jank Definition"></a>Jank Definition</h2><h3 id="Overall-App-Frame-Rendering-Flow"><a href="#Overall-App-Frame-Rendering-Flow" class="headerlink" title="Overall App Frame Rendering Flow"></a>Overall App Frame Rendering Flow</h3><p>To understand why jank occurs, we must know how the app’s main thread processes a frame.</p><h3 id="From-the-Perspective-of-Execution-Order"><a href="#From-the-Perspective-of-Execution-Order" class="headerlink" title="From the Perspective of Execution Order"></a>From the Perspective of Execution Order</h3><p>The flow starts when <code>Choreographer</code> receives Vsync and ends when <code>SurfaceFlinger</code>&#x2F;<code>HWC</code> composites a frame (followed by physical display hardware, which isn’t listed here).</p><p><img src="/en/images/Systrace-Smooth%20e5d284a979a447ad8b45ff021d6e41cf/Untitled.webp" alt="Overall Flow"></p><h3 id="From-the-Perspective-of-Systrace"><a href="#From-the-Perspective-of-Systrace" class="headerlink" title="From the Perspective of Systrace"></a>From the Perspective of Systrace</h3><p>The flow is more intuitive when visualized in Systrace (Perfetto):</p><p><img src="/en/images/Systrace-Smooth%20e5d284a979a447ad8b45ff021d6e41cf/Untitled%201.webp" alt="Systrace Flow"></p><p>A timeout at any step in this overall flow can lead to jank. Therefore, analyzing jank requires looking at multiple levels: App main thread, Render thread, <code>SystemServer</code> process, <code>SurfaceFlinger</code> process, Linux kernel areas, etc.</p><h2 id="Jank-Definition-1"><a href="#Jank-Definition-1" class="headerlink" title="Jank Definition"></a>Jank Definition</h2><p>My definition of jank is: <strong>One or more frames fail to be drawn during a stable frame rate output.</strong> Corresponding terms: <strong>Smooth</strong> VS <strong>Jank</strong>.</p><p>For instance, in the image below, if an App’s main thread is drawing normally (usually during animation or scrolling) but one frame is not drawn, we consider that frame as potentially causing jank (potentially, because Triple Buffering might prevent actual frame drops).</p><p><img src="/en/images/Systrace-Smooth%20e5d284a979a447ad8b45ff021d6e41cf/Untitled%202.webp" alt="Jank Example"></p><p>We define jank from three perspectives:</p><ol><li><strong>From a Phenomenological perspective</strong>: During continuous app animation or finger scrolling (continuity is key), if the app’s screen content doesn’t change for 2 or more consecutive frames, we consider it jank.</li><li><strong>From the SurfaceFlinger perspective</strong>: During continuous app animation or scrolling, if a Vsync arrives and the App has no Buffer available for composition, <code>SurfaceFlinger</code> will skip composition for that app layer (or composite other layers) during that Vsync cycle. The screen will continue to display the App’s previous frame. We consider this a jank.</li><li><strong>From the App perspective</strong>: If the Render thread fails to <code>queueBuffer</code> to the App’s <code>BufferQueue</code> within <code>SurfaceFlinger</code> during a Vsync cycle, we consider it a jank.</li></ol><p>The App main thread isn’t mentioned directly because its timeouts usually indirectly delay the Render thread, increasing the risk of Render thread execution timeouts and thus causing jank. Most app-driven jank is caused by main thread timeouts.</p><p>It’s also important to distinguish <strong>Logical Jank</strong>. <strong>Logical jank</strong> occurs when the rendering flow itself is fine, and a Buffer is provided to <code>SurfaceFlinger</code> for composition, but the content of that Buffer is identical (or nearly identical and imperceptible) to the previous Buffer. To the user, it appears as identical content for two consecutive frames. This is still considered jank (depending on context) and is <strong>caused by the app’s own code logic</strong>.</p><p><a id="system"></a></p><h1 id="System-Operation-Mechanism-Overview"><a href="#System-Operation-Mechanism-Overview" class="headerlink" title="System Operation Mechanism Overview"></a>System Operation Mechanism Overview</h1><p>Because there are many causes for jank, analyzing it requires an understanding of Android’s system mechanisms. Here is a brief introduction:</p><ol><li>App Main Thread Operation Principles</li><li>Message, Handler, MessageQueue, and Looper Mechanisms</li><li>Screen Refresh Mechanism and Vsync</li><li>Choreographer Mechanism</li><li>Buffer Flow and TripleBuffer</li><li>Input Flow</li></ol><h2 id="System-Mechanism-App-Main-Thread-Operation-Principles"><a href="#System-Mechanism-App-Main-Thread-Operation-Principles" class="headerlink" title="System Mechanism - App Main Thread Operation Principles"></a>System Mechanism - App Main Thread Operation Principles</h2><p>When an App process is created and <code>Fork</code> completes, <code>ActivityThread.main()</code> is called to initialize the main thread.</p><figure class="highlight java"><table><tr><td class="gutter"><pre><span class="line">1</span><br><span class="line">2</span><br><span class="line">3</span><br><span class="line">4</span><br><span class="line">5</span><br><span class="line">6</span><br><span class="line">7</span><br><span class="line">8</span><br><span class="line">9</span><br><span class="line">10</span><br><span class="line">11</span><br><span class="line">12</span><br><span class="line">13</span><br><span class="line">14</span><br><span class="line">15</span><br><span class="line">16</span><br><span class="line">17</span><br><span class="line">18</span><br><span class="line">19</span><br><span class="line">20</span><br><span class="line">21</span><br><span class="line">22</span><br><span class="line">23</span><br><span class="line">24</span><br><span class="line">25</span><br><span class="line">26</span><br><span class="line">27</span><br><span class="line">28</span><br><span class="line">29</span><br><span class="line">30</span><br><span class="line">31</span><br><span class="line">32</span><br><span class="line">33</span><br><span class="line">34</span><br><span class="line">35</span><br><span class="line">36</span><br><span class="line">37</span><br><span class="line">38</span><br><span class="line">39</span><br><span class="line">40</span><br><span class="line">41</span><br></pre></td><td class="code"><pre><span class="line"><span class="comment">// frameworks/base/core/java/android/app/ActivityThread.java</span></span><br><span class="line"><span class="keyword">public</span> <span class="keyword">static</span> <span class="keyword">void</span> <span class="title function_">main</span><span class="params">(String[] args)</span> &#123;</span><br><span class="line">     ......</span><br><span class="line">     <span class="comment">// Create Looper, Handler, MessageQueue</span></span><br><span class="line">     Looper.prepareMainLooper();</span><br><span class="line">     ......</span><br><span class="line">     <span class="type">ActivityThread</span> <span class="variable">thread</span> <span class="operator">=</span> <span class="keyword">new</span> <span class="title class_">ActivityThread</span>();</span><br><span class="line">     thread.attach(<span class="literal">false</span>, startSeq);</span><br><span class="line"></span><br><span class="line">     <span class="keyword">if</span> (sMainThreadHandler == <span class="literal">null</span>) &#123;</span><br><span class="line">         sMainThreadHandler = thread.getHandler();</span><br><span class="line">     &#125;</span><br><span class="line">     ......</span><br><span class="line">     <span class="comment">// Start listening for messages</span></span><br><span class="line">     Looper.loop();</span><br><span class="line">&#125;</span><br><span class="line"></span><br><span class="line"><span class="comment">// frameworks/base/core/java/android/os/Looper.java</span></span><br><span class="line"><span class="keyword">public</span> <span class="keyword">static</span> <span class="keyword">void</span> <span class="title function_">prepareMainLooper</span><span class="params">()</span> &#123;</span><br><span class="line">    prepare(<span class="literal">false</span>);</span><br><span class="line">    <span class="keyword">synchronized</span> (Looper.class) &#123;</span><br><span class="line">        <span class="keyword">if</span> (sMainLooper != <span class="literal">null</span>) &#123;</span><br><span class="line">            <span class="keyword">throw</span> <span class="keyword">new</span> <span class="title class_">IllegalStateException</span>(<span class="string">&quot;The main Looper has already been prepared.&quot;</span>);</span><br><span class="line">        &#125;</span><br><span class="line">        sMainLooper = myLooper();</span><br><span class="line">    &#125;</span><br><span class="line">&#125;</span><br><span class="line"></span><br><span class="line"><span class="comment">// frameworks/base/core/java/android/os/Looper.java</span></span><br><span class="line"><span class="keyword">private</span> <span class="keyword">static</span> <span class="keyword">void</span> <span class="title function_">prepare</span><span class="params">(<span class="type">boolean</span> quitAllowed)</span> &#123;</span><br><span class="line">    <span class="keyword">if</span> (sThreadLocal.get() != <span class="literal">null</span>) &#123;</span><br><span class="line">        <span class="keyword">throw</span> <span class="keyword">new</span> <span class="title class_">RuntimeException</span>(<span class="string">&quot;Only one Looper may be created per thread&quot;</span>);</span><br><span class="line">    &#125;</span><br><span class="line">    sThreadLocal.set(<span class="keyword">new</span> <span class="title class_">Looper</span>(quitAllowed));</span><br><span class="line">&#125;</span><br><span class="line"></span><br><span class="line"><span class="comment">// frameworks/base/core/java/android/os/Looper.java</span></span><br><span class="line"><span class="keyword">private</span> <span class="title function_">Looper</span><span class="params">(<span class="type">boolean</span> quitAllowed)</span> &#123;</span><br><span class="line">    mQueue = <span class="keyword">new</span> <span class="title class_">MessageQueue</span>(quitAllowed);</span><br><span class="line">    mThread = Thread.currentThread();</span><br><span class="line">&#125;</span><br></pre></td></tr></table></figure><p>Once initialized, the main thread has its own <code>Looper</code>, <code>MessageQueue</code>, and <code>Handler</code>. The <code>ActivityThread</code> Handler then processes Messages, including lifecycle functions for Application, Activity, ContentProvider, Service, and Broadcast, which are processed sequentially on the main thread as Messages. Here are some examples:</p><figure class="highlight java"><table><tr><td class="gutter"><pre><span class="line">1</span><br><span class="line">2</span><br><span class="line">3</span><br><span class="line">4</span><br><span class="line">5</span><br><span class="line">6</span><br><span class="line">7</span><br><span class="line">8</span><br><span class="line">9</span><br><span class="line">10</span><br><span class="line">11</span><br><span class="line">12</span><br><span class="line">13</span><br><span class="line">14</span><br><span class="line">15</span><br><span class="line">16</span><br><span class="line">17</span><br><span class="line">18</span><br><span class="line">19</span><br><span class="line">20</span><br></pre></td><td class="code"><pre><span class="line"><span class="comment">// frameworks/base/core/java/android/app/ActivityThread.java</span></span><br><span class="line"><span class="keyword">class</span> <span class="title class_">H</span> <span class="keyword">extends</span> <span class="title class_">Handler</span> &#123;</span><br><span class="line">    <span class="keyword">public</span> <span class="keyword">static</span> <span class="keyword">final</span> <span class="type">int</span> <span class="variable">BIND_APPLICATION</span>        <span class="operator">=</span> <span class="number">110</span>;</span><br><span class="line">    <span class="keyword">public</span> <span class="keyword">static</span> <span class="keyword">final</span> <span class="type">int</span> <span class="variable">EXIT_APPLICATION</span>        <span class="operator">=</span> <span class="number">111</span>;</span><br><span class="line">    <span class="keyword">public</span> <span class="keyword">static</span> <span class="keyword">final</span> <span class="type">int</span> <span class="variable">RECEIVER</span>                <span class="operator">=</span> <span class="number">113</span>;</span><br><span class="line">    <span class="keyword">public</span> <span class="keyword">static</span> <span class="keyword">final</span> <span class="type">int</span> <span class="variable">CREATE_SERVICE</span>          <span class="operator">=</span> <span class="number">114</span>;</span><br><span class="line">    <span class="keyword">public</span> <span class="keyword">static</span> <span class="keyword">final</span> <span class="type">int</span> <span class="variable">SERVICE_ARGS</span>            <span class="operator">=</span> <span class="number">115</span>;</span><br><span class="line">    <span class="keyword">public</span> <span class="keyword">static</span> <span class="keyword">final</span> <span class="type">int</span> <span class="variable">STOP_SERVICE</span>            <span class="operator">=</span> <span class="number">116</span>;</span><br><span class="line"></span><br><span class="line">    <span class="keyword">public</span> <span class="keyword">void</span> <span class="title function_">handleMessage</span><span class="params">(Message msg)</span> &#123;</span><br><span class="line">        <span class="keyword">switch</span> (msg.what) &#123;</span><br><span class="line">            <span class="keyword">case</span> BIND_APPLICATION:</span><br><span class="line">                Trace.traceBegin(Trace.TRACE_TAG_ACTIVITY_MANAGER, <span class="string">&quot;bindApplication&quot;</span>);</span><br><span class="line">                <span class="type">AppBindData</span> <span class="variable">data</span> <span class="operator">=</span> (AppBindData)msg.obj;</span><br><span class="line">                handleBindApplication(data);</span><br><span class="line">                Trace.traceEnd(Trace.TRACE_TAG_ACTIVITY_MANAGER);</span><br><span class="line">                <span class="keyword">break</span>;</span><br><span class="line">        &#125;</span><br><span class="line">    &#125;</span><br><span class="line">&#125;</span><br></pre></td></tr></table></figure><p>For more, see <a href="https://www.androidperformance.com/en/2019/11/06/Android-Systrace-MainThread-And-RenderThread/">Android Systrace Basics - MainThread and RenderThread Explained</a>.</p><h2 id="System-Mechanism-Message-Mechanism"><a href="#System-Mechanism-Message-Mechanism" class="headerlink" title="System Mechanism - Message Mechanism"></a>System Mechanism - Message Mechanism</h2><p>As described above, once the main thread is initialized, it enters a blocked state waiting for Messages. When a Message arrives, it wakes up, processes it, and returns to sleep if no other Messages are pending.</p><p>The core of the Android Message mechanism consists of: <strong>Handler</strong>, <strong>Looper</strong>, <strong>MessageQueue</strong>, and <strong>Message</strong>.</p><p><img src="/en/images/Systrace-Smooth%20e5d284a979a447ad8b45ff021d6e41cf/Untitled%203.webp" alt="Message Mechanism"></p><p>Many code-level analyses exist, so here is a brief overview of the components:</p><ol><li><strong>Handler</strong>: Primarily handles Messages. Apps can create Handlers in any thread by specifying a <code>Looper</code>. If omitted, it defaults to the current thread’s <code>Looper</code>.</li><li><strong>Looper</strong>: An infinite loop. After its <code>loop()</code> method starts, it continuously retrieves Messages from the <code>MessageQueue</code>, delivers&#x2F;dispatches them, and sends them to the corresponding Handler. Apps can insert their own printers before and after message processing, making <code>Looper</code> a common entry point for performance monitoring (e.g., Tencent-Matrix and BlockCanary).</li><li><strong>MessageQueue</strong>: A Message manager. It holds Messages in a queue. When empty, it uses Linux’s <code>nativePoll</code> mechanism to block and wait until a Message enters the queue.</li><li><strong>Message</strong>: The object used to pass information, containing content like <code>what</code>, <code>arg</code>, and <code>callback</code>.</li></ol><p><code>ActivityThread</code> uses this mechanism to handle all App and component lifecycle functions.</p><h2 id="System-Mechanism-Screen-Refresh-and-Vsync"><a href="#System-Mechanism-Screen-Refresh-and-Vsync" class="headerlink" title="System Mechanism - Screen Refresh and Vsync"></a>System Mechanism - Screen Refresh and Vsync</h2><p>First, understand <strong>Screen Refresh Rate</strong>. A hardware concept, it refers to how often the screen hardware refreshes the image. E.g., a 60Hz rate means the screen refreshes its display 60 times per second; 90Hz means 90 times.</p><p>In contrast, <strong>FPS</strong> (Frames Per Second) is a software concept and refers to how many frames the software system produces per second. E.g., 60FPS means the software generates 60 frames per second; 90FPS means 90 frames.</p><p><strong>VSync</strong> (Vertical Synchronization) synchronizes your FPS with the monitor’s refresh rate to prevent “tearing.”</p><ol><li>In a 60 fps system, 60 frames must be generated per second, meaning drawing a frame must take at most 16.67ms (1&#x2F;60) to avoid dropped frames (FrameMiss).</li><li>In a 90 fps system, 90 frames must be generated per second, meaning drawing a frame must take at most 11.11ms (1&#x2F;90) to avoid dropped frames.</li></ol><p>Typically, the screen hardware controls the refresh rate, while Vsync controls the FPS. In practice, they are usually identical. See:</p><ol><li><a href="https://www.androidperformance.com/en/2019/05/15/90hz-on-android/">A New Smooth Experience: A Talk on 90Hz</a></li><li><a href="https://www.androidperformance.com/en/2019/12/01/Android-Systrace-Vsync/">Android Systrace Basics - Vsync Explained</a></li></ol><h2 id="System-Mechanism-Choreographer"><a href="#System-Mechanism-Choreographer" class="headerlink" title="System Mechanism - Choreographer"></a>System Mechanism - Choreographer</h2><p>As mentioned, Vsync controls FPS. It does this through <code>Choreographer</code>.</p><p><code>Choreographer</code> coordinates with Vsync to provide a stable Message processing timing for App-level rendering. When Vsync arrives, the system adjusts the Vsync signal period to control the timing of drawing operations for each frame. Vsync typically uses a 16.6ms (60 fps) period to match 60Hz screens. Every 16.6ms, Vsync wakes <code>Choreographer</code> to perform app drawing. If the app renders within this window every cycle, it achieves 60 fps, appearing very smooth.</p><p><code>Choreographer</code> bridges the rendering pipeline:</p><ol><li><strong>Upper side</strong>: Receives and processes app update messages and callbacks (Input, Animation, Traversal - measure&#x2F;layout&#x2F;draw), handles them collectively when Vsync arrives, detects frame drops, and records callback durations.</li><li><strong>Lower side</strong>: Requests and receives Vsync signals (via <code>FrameDisplayEventReceiver.onVsync</code> and <code>FrameDisplayEventReceiver.scheduleVsync</code>).</li></ol><p>The following image shows <code>Choreographer</code>‘s frame drawing workflow via the Message mechanism when Vsync arrives. Details: <a href="https://www.androidperformance.com/en/2019/10/22/Android-Choreographer/">Detailed Explanation of Android Rendering Mechanism Based on Choreographer</a>.</p><p><img src="/en/images/Systrace-Smooth%20e5d284a979a447ad8b45ff021d6e41cf/Untitled%204.webp" alt="Choreographer Flow"></p><h2 id="System-Mechanism-Buffer-Flow-and-TripleBuffer"><a href="#System-Mechanism-Buffer-Flow-and-TripleBuffer" class="headerlink" title="System Mechanism - Buffer Flow and TripleBuffer"></a>System Mechanism - Buffer Flow and TripleBuffer</h2><p><code>BufferQueue</code> uses a Producer-Consumer model. Typically, the Consumer creates and owns the <code>BufferQueue</code> data structure, while the Producer exists in a separate process.</p><p><img src="/en/images/Systrace-Smooth%20e5d284a979a447ad8b45ff021d6e41cf/Untitled%205.webp" alt="BufferQueue"></p><p>In app rendering, the <strong>App is the Producer</strong> and <strong>SurfaceFlinger is the Consumer</strong>:</p><ol><li><strong>App</strong> calls <code>dequeueBuffer()</code> to request a buffer.</li><li><strong>App</strong> renders (via CPU or GPU) and calls <code>queueBuffer()</code> to return it. (Gpu-rendered buffers aren’t immediately available until GPU work finishes).</li><li><strong>SurfaceFlinger</strong> receives a Vsync signal, calls <code>acquireBuffer()</code> to take the buffer, and performs composition.</li><li><strong>SurfaceFlinger</strong> calls <code>releaseBuffer()</code> to return it after composition.</li></ol><p>Most current systems use three alternating buffers (Triple Buffering) to prevent jank caused by buffer shortages if one step in the flow takes too long.</p><p>Comparison of double vs. triple buffering:</p><p><img src="/en/images/Systrace-Smooth%20e5d284a979a447ad8b45ff021d6e41cf/Untitled%206.webp" alt="Buffering Comparison"></p><p>Benefits of Triple Buffering:</p><ol><li><strong>Mitigating Jank</strong>: Triple buffering helps reduce frame drop frequency during consecutive main thread timeouts (reducing two drops to one). Main thread timeouts don’t always result in user-visible jank because Triple Buffering can cushion GPU-induced delays.</li><li><strong>Reducing Wait Times</strong>: In double buffering, the main thread sometimes waits for SF to release a buffer, delaying its start time since most phones send SF and App Vsync signals simultaneously.</li><li><strong>Lowering GPU and SurfaceFlinger Bottlenecks</strong>: High SF load or GPU timeouts easily prevent double-buffered frames from compositing on time. Triple buffering lets buffers enter the queue for GPU rendering earlier, reducing wait times and bottlenecks.</li></ol><p>The downside is increased memory usage. Details: <a href="https://www.androidperformance.com/en/2019/12/15/Android-Systrace-Triple-Buffer/">Android Systrace Basics - Triple Buffer Explained</a>.</p><h2 id="System-Mechanism-Input-Flow"><a href="#System-Mechanism-Input-Flow" class="headerlink" title="System Mechanism - Input Flow"></a>System Mechanism - Input Flow</h2><p>Android is event-driven, and <code>input</code> events (clicks, scrolls, long presses) are handled via <code>InputReader</code> and <code>InputDispatcher</code>. These are two Native threads in <code>SystemServer</code>.</p><ol><li><strong>InputReader</strong> reads events from <code>EventHub</code> and passes them to <code>InputDispatcher</code>.</li><li><strong>InputDispatcher</strong> wraps and dispatches them to the relevant app connection.</li><li><strong>OutboundQueue</strong> holds events about to be sent to an app.</li><li><strong>WaitQueue</strong> holds events sent to an app but not yet acknowledged.</li><li><strong>PendingInputEventQueue</strong> holds events pending in the app process.</li><li><code>deliverInputEvent</code> marks the App UI Thread being woken by an Input event.</li><li><code>InputResponse</code> marks the processing phase for an Input sequence (Down + Move + Up).</li><li><strong>App Input Response</strong>: E.g., scrolling then releasing (Fling). The desktop updates along with the finger and continues via Fling after release.</li></ol><p>Systrace representation:</p><p><img src="/en/images/Systrace-Smooth%20e5d284a979a447ad8b45ff021d6e41cf/Untitled%207.webp" alt="Input Flow in Systrace"></p><p>Details: <a href="https://www.androidperformance.com/en/2019/11/04/Android-Systrace-Input/">Android Systrace Basics - Input Explained</a>.</p><p><a id="series"></a></p><h1 id="Series-Articles"><a href="#Series-Articles" class="headerlink" title="Series Articles"></a>Series Articles</h1><ol><li><a href="https://www.androidperformance.com/en/2021/04/24/android-systrace-smooth-in-action-1/">Systrace Smoothness in Action 1: Understanding Jank Principles</a></li><li><a href="https://www.androidperformance.com/en/2021/04/24/android-systrace-smooth-in-action-2/">Systrace Smoothness in Action 2: Case Analysis - MIUI Launcher Scroll Jank Analysis</a></li><li><a href="https://www.androidperformance.com/en/2021/04/24/android-systrace-smooth-in-action-3/">Systrace Smoothness in Action 3: FAQs During Jank Analysis</a></li></ol><p><a id="attachments"></a></p><h1 id="Attachments"><a href="#Attachments" class="headerlink" title="Attachments"></a>Attachments</h1><p>Attachments are on GitHub: <a href="https://github.com/Gracker/SystraceForBlog/tree/master/Android_Systrace_Smooth_In_Action">https://github.com/Gracker/SystraceForBlog/tree/master/Android_Systrace_Smooth_In_Action</a></p><ol><li><code>xiaomi_launcher.zip</code>: Systrace for launcher scroll jank (main analysis case).</li><li><code>xiaomi_launcher_scroll_all_the_time.zip</code>: Systrace for continuous launcher scrolling.</li><li><code>oppo_launcher_scroll.zip</code>: Comparison trace.</li></ol><p><a id="about"></a></p><h1 id="About-Me-amp-amp-Blog"><a href="#About-Me-amp-amp-Blog" class="headerlink" title="About Me &amp;&amp; Blog"></a>About Me &amp;&amp; Blog</h1><p>Below is my personal intro and related links. I look forward to exchanging ideas with fellow professionals. “When three walk together, one can always be my teacher!”</p><ol><li><a href="https://www.androidperformance.com/en/about/">Blogger Intro</a>: Includes personal WeChat and WeChat group links.</li><li><a href="https://www.androidperformance.com/en/2019/12/01/BlogMap/">Blog Content Navigation</a>: A guide for my blog content.</li><li><a href="https://www.androidperformance.com/en/2018/05/07/Android-performance-optimization-skills-and-tools/">Curated Excellent Blog Articles - Android Performance Optimization Must-Knows</a>: Welcome to recommend projects&#x2F;articles.</li><li><a href="https://www.androidperformance.com/en/2023/12/30/the-performance/">Android Performance Optimization Knowledge Planet</a>: Welcome to join and thank you for your support~</li></ol><blockquote><p><strong>One walks faster alone, but a group walks further together.</strong></p></blockquote><p><img src="/en/images/WechatIMG581.webp" alt="Scan WeChat QR Code"></p>]]></content>
    
    
    <summary type="html">&lt;p&gt;Different people have different understandings of smoothness (jank&amp;#x2F;dropped frames) and different perceptions of jitter thresholds. Therefore, before starting this series, it is necessary to clarify the content to avoid misunderstandings and help everyone approach these articles with the right questions. Here are some basic explanations:&lt;/p&gt;
&lt;ol&gt;
&lt;li&gt;For mobile users, jank encompasses many scenarios: &lt;strong&gt;dropped frames when scrolling lists&lt;/strong&gt;, &lt;strong&gt;excessive white screen during app startup&lt;/strong&gt;, &lt;strong&gt;slow screen wake-up when pressing the power button&lt;/strong&gt;, &lt;strong&gt;unresponsive interface followed by a crash&lt;/strong&gt;, &lt;strong&gt;no response when clicking an icon&lt;/strong&gt;, &lt;strong&gt;incoherent window animations, lagging touch response, or stuttering when entering the desktop after a reboot&lt;/strong&gt;. These scenarios differ slightly from what developers understand as “jank.” Developers categorize these more finely, which is a cognitive gap between developers and users that must be noted when handling feedback from users or testers.&lt;/li&gt;
&lt;li&gt;For developers, the above scenarios fall into three major categories: &lt;strong&gt;Smoothness&lt;/strong&gt; (dropped frames in lists, incoherent animations, stuttering desktop entry), &lt;strong&gt;Responsiveness&lt;/strong&gt; (long startup white screens, slow screen wake-up, lagging touch), and &lt;strong&gt;Stability&lt;/strong&gt; (unresponsive interface&amp;#x2F;crashes, no response to icon clicks). This classification is used because each category requires different analysis methods and steps. Quickly identifying the category is crucial.&lt;/li&gt;
&lt;li&gt;Technically, &lt;strong&gt;Smoothness, Responsiveness, and Stability&lt;/strong&gt; (ANR) all feel like “jank” to users because their underlying principles are identical: the main thread’s Message exceeds its processing deadline. They are simply categorized by different timeout thresholds. Understanding these problems requires knowledge of basic system operation mechanisms, which this article will introduce.&lt;/li&gt;
&lt;li&gt;This series primarily analyzes smoothness-related issues. Responsiveness and stability will be covered in dedicated articles. Understanding smoothness first will make analyzing responsiveness and stability much easier.&lt;/li&gt;
&lt;li&gt;This series focuses on using Systrace (Perfetto) for analysis. Systrace is our entry point because many factors affect smoothness—some within the app itself and others within the system. Systrace (Perfetto) provides a holistic view of the system’s operation during the problem, helping us initially pinpoint the root cause.</summary>


    <category term="Android" scheme="https://androidperformance.com/en/categories/Android/"/>
    
    
    <category term="Android" scheme="https://androidperformance.com/en/tags/Android/"/>
    
    <category term="Perfetto" scheme="https://androidperformance.com/en/tags/Perfetto/"/>
    
    <category term="Systrace" scheme="https://androidperformance.com/en/tags/Systrace/"/>
    
    <category term="Startup" scheme="https://androidperformance.com/en/tags/Startup/"/>
    
    <category term="ANR" scheme="https://androidperformance.com/en/tags/ANR/"/>
    
  </entry>
  
  <entry>
    <title>Why is the Weibo Experience Better on Huawei? A Technical Analysis and Reflection</title>
    <link href="https://androidperformance.com/en/2020/08/20/weibo-imageload-opt-on-huawei/"/>
    <id>https://androidperformance.com/en/2020/08/20/weibo-imageload-opt-on-huawei/</id>
    <published>2020-08-20T05:17:26.000Z</published>
    <updated>2026-05-10T23:29:51.069Z</updated>
    
    <content type="html"><![CDATA[<p>A fellow developer shared a Weibo post (<a href="https://weibo.com/1808884742/IApbpEVQr">https://weibo.com/1808884742/IApbpEVQr</a>) where blogger @王波粒 noticed a peculiar phenomenon on the Mate 30 Pro. I highly recommend watching the video first.</p><p>The video’s description and some of the comments aren’t quite technically accurate. Here’s a summary of what’s actually happening: <strong>On Huawei phones, the Weibo app continues to load images smoothly while scrolling the main feed. However, the exact same version of the Weibo client on other phones waits until scrolling completely stops before it begins loading images.</strong></p><p>This post looks at this phenomenon from a technical perspective, explores why it happens, and discusses what we can learn from it.</p><span id="more"></span><p><img src="/en/images/15979019506115.jpg"></p><p><strong>What makes this so special?</strong></p><ol><li><strong>Technical Standard</strong>: Waiting for a scroll to finish before loading images is a classic optimization for list performance. Most mainstream apps do this to prevent “scrolling jank.” If an app tries to load every photo or video it encounters mid-scroll, it wastes resources and can delay the loading of content the user actually stops to look at. The fact that the <em>same</em> APK behaves differently on Huawei suggests a deep, device-specific optimization—likely a joint effort between Weibo and Huawei.</li><li><strong>User Experience</strong>: Loading images <em>during</em> the scroll allows users to see content sooner, reducing the time spent looking at blank placeholders even if they are just flicking through.</li><li><strong>The “Fling” Curve</strong>: If you look closely, the deceleration curve (the “fling”) on Huawei phones is different. It’s smoother, gentler, and lacks the abrupt stops common in standard Android implementations. It feels more organic, similar to how iOS handles inertial scrolling.</li></ol><p>This collaboration between Huawei and Weibo is a great case study for head-tier app optimization. It shows a level of attention to detail that is rare in the Android ecosystem.</p><h2 id="Contextual-Notes"><a href="#Contextual-Notes" class="headerlink" title="Contextual Notes"></a>Contextual Notes</h2><ol><li><strong>Server-Side Control</strong>: The “load images during scroll” feature is controlled by Weibo’s server and can be toggled on or off. The observation that other phones “wait for stop” was true when the feature was disabled for non-optimized devices.</li><li><strong>Current State (Aug 2020)</strong>: Weibo has since enabled this feature for more devices. However, Huawei’s <strong>PerfSDK</strong> still provides a superior experience by optimizing the <em>deceleration curve</em> itself, ensuring the phone stays smooth even under the increased load of mid-scroll image fetching.</li><li><strong>Analyzed Version</strong>: Weibo v10.8.1.</li></ol><h2 id="The-Verdict"><a href="#The-Verdict" class="headerlink" title="The Verdict"></a>The Verdict</h2><p>The “smooth image loading during scroll” on Huawei is the result of a joint optimization. The key technical points are:</p><ol><li><strong>Velocity Monitoring</strong>: Huawei provides a lightweight <strong>PerfSDK</strong> to Weibo. This allows the app to listen for the precise velocity of the list in real-time.</li><li><strong>Dynamic Loading Logic</strong>: Weibo uses this velocity data to decide when to fetch images. If the velocity is below a certain threshold (meaning the user is slow-scrolling or the fling is nearing its end), image loading is enabled. If it’s too fast, loading is paused to prioritize UI responsiveness.</li><li><strong>Custom Fling Curves</strong>: When Huawei detects an app using this SDK, it applies a specialized system-level fling curve to the app’s scrollable containers, making the inertial movement look and feel premium.</li></ol><hr><h1 id="How-the-Optimization-Works"><a href="#How-the-Optimization-Works" class="headerlink" title="How the Optimization Works"></a>How the Optimization Works</h1><h2 id="Phenomenon-Analysis"><a href="#Phenomenon-Analysis" class="headerlink" title="Phenomenon Analysis"></a>Phenomenon Analysis</h2><p>A scroll operation generally has three phases:</p><ol><li><strong>SCROLL_STATE_TOUCH_SCROLL</strong>: Finger is on the screen, actively moving the list.</li><li><strong>SCROLL_STATE_FLING</strong>: Finger leaves the screen with speed; the list moves by inertia.</li><li><strong>SCROLL_STATE_IDLE</strong>: The list has come to a complete stop.</li></ol><p>The Huawei&#x2F;Weibo optimization targets <strong>Phase 1</strong> and <strong>Phase 2</strong>.</p><h3 id="Phase-1-Optimization"><a href="#Phase-1-Optimization" class="headerlink" title="Phase 1 Optimization"></a>Phase 1 Optimization</h3><ul><li><strong>Before</strong>: Image loading is paused whenever a finger is on the screen to prevent frame drops during touch interaction.</li><li><strong>After</strong>: Since touch-scrolling is generally slower than a full fling, image loading is kept active, allowing content to appear immediately as it enters the viewport.</li></ul><h3 id="Phase-2-Optimization-Fling"><a href="#Phase-2-Optimization-Fling" class="headerlink" title="Phase 2 Optimization (Fling)"></a>Phase 2 Optimization (Fling)</h3><ol><li><strong>Smart Image Loading</strong>:<ul><li><strong>High Velocity</strong>: Image loading is paused to ensure the GPU&#x2F;CPU can stay at 60Hz (or 90&#x2F;120Hz) while the list renders at high speed.</li><li><strong>Low Velocity</strong>: Once the fling slows down to a manageable speed, image loading resumes <em>before</em> the list fully stops.</li></ul></li><li><strong>Inertial Smoothing</strong>:<ul><li>Huawei replaces the default Android fling curve (which can feel linear or jerky) with a custom, “soft” curve that lasts longer and stops gracefully.</li></ul></li></ol><h2 id="Technical-Deep-Dive-Reverse-Engineering"><a href="#Technical-Deep-Dive-Reverse-Engineering" class="headerlink" title="Technical Deep Dive (Reverse Engineering)"></a>Technical Deep Dive (Reverse Engineering)</h2><p>Analysis of Weibo v10.8.1 reveals that during initialization, the app checks for the presence of Huawei’s <strong>PerfSDK</strong>.</p><h3 id="Monitoring-Velocity"><a href="#Monitoring-Velocity" class="headerlink" title="Monitoring Velocity"></a>Monitoring Velocity</h3><p>Weibo registers a <code>HwPerfVelocityCallback</code> on its main <code>ListView</code>. It listens for two key events:</p><ol><li><code>HwPerfonVelocityDownToThreshold</code>: Velocity dropped below the safe limit; resume image loading.</li><li><code>HwPerfonVelocityUpToThreshold</code>: Velocity exceeds the limit; pause loading to save frames.</li></ol><p><img src="/en/images/15979019932037.jpg" alt="Reverse Engineered Callback"></p><h3 id="The-Fling-Curve-Framework-Layer"><a href="#The-Fling-Curve-Framework-Layer" class="headerlink" title="The Fling Curve (Framework Layer)"></a>The Fling Curve (Framework Layer)</h3><p>In Huawei’s modified <code>OverScroller.java</code>, we can see custom logic for distance and velocity calculations when specific vendor flags are set.</p><p><img src="/en/images/15979020033894.jpg" alt="Huawei Framework Code Snippets"></p><p>This results in a scroll feel that is closer to iOS—where the list takes a long time to come to a very gradual halt—rather than the “abrupt stop” often seen in vanilla Android.</p><h2 id="Handling-Other-Manufacturers"><a href="#Handling-Other-Manufacturers" class="headerlink" title="Handling Other Manufacturers"></a>Handling Other Manufacturers</h2><p>If the app detects it’s not on a Huawei device (<code>HwPerfUtil.a</code> returns <code>false</code>), it falls back to a global server-side feature flag: <code>feed_scroll_loadimage_enable</code>. While this allows other phones to load images during scroll, it often lacks the “velocity-aware” precision and smooth fling curves provided by the Huawei SDK.</p><hr><h1 id="The-“Scroll-to-Click”-Challenge"><a href="#The-“Scroll-to-Click”-Challenge" class="headerlink" title="The “Scroll-to-Click” Challenge"></a>The “Scroll-to-Click” Challenge</h1><p>One side effect of a long, “soft” fling curve (like iOS or optimized Huawei) is that the list stays in the <code>FLING</code> state for much longer. In standard Android, clicking an item while it’s flinging will stop the list but won’t trigger the item’s <code>onClick</code> event. The user has to click twice: once to stop, once to open.</p><p>This requires a delicate balance. If the fling is <em>too</em> long, it becomes an annoyance. Modern implementations (like MIUI 12 or optimized Huawei firmware) allow “click-through” logic where if the velocity is very low (e.g., the last 5% of the scroll), a tap will both stop the list and trigger the item action simultaneously.</p><h1 id="Extended-Reading"><a href="#Extended-Reading" class="headerlink" title="Extended Reading"></a>Extended Reading</h1><h2 id="Performance-Considerations"><a href="#Performance-Considerations" class="headerlink" title="Performance Considerations"></a>Performance Considerations</h2><p>Why pause loading during fast scrolls?</p><ol><li><strong>Efficiency</strong>: If a user is flicking through hundreds of posts to find a specific one, loading every intermediate image is a waste of data and battery.</li><li><strong>Latency</strong>: If 50 images are in the load queue, the one image the user actually stops to look at will have to wait for the previous 49 to finish (or be canceled), leading to “placeholder lag.”</li></ol><h2 id="Scroll-State-Cheat-Sheet"><a href="#Scroll-State-Cheat-Sheet" class="headerlink" title="Scroll State Cheat Sheet"></a>Scroll State Cheat Sheet</h2><p>For developers using <code>AbsListView.OnScrollListener</code>:</p><ol><li><code>SCROLL_STATE_IDLE</code>: Not moving.</li><li><code>SCROLL_STATE_TOUCH_SCROLL</code>: Finger is touching and moving the list.</li><li><code>SCROLL_STATE_FLING</code>: Finger released; moving by inertia.</li></ol><h1 id="Conclusion"><a href="#Conclusion" class="headerlink" title="Conclusion"></a>Conclusion</h1><p>This “Weibo + Huawei” collaboration is more than just a marketing gimmick. It’s a pragmatic way to solve the “smoothness vs. data” trade-off. As Android users demand higher fluidity, we can expect more apps to seek these kinds of vendor-level integrations.</p><h1 id="About-Me-amp-amp-Blog"><a href="#About-Me-amp-amp-Blog" class="headerlink" title="About Me &amp;&amp; Blog"></a>About Me &amp;&amp; Blog</h1><p>Below is my personal intro and related links. I look forward to exchanging ideas with fellow professionals. “When three walk together, one can always be my teacher!”</p><ol><li><a href="https://www.androidperformance.com/en/about/">Blogger Intro</a></li><li><a href="https://www.androidperformance.com/en/2019/12/01/BlogMap/">Blog Content Navigation</a>: A guide for my blog content.</li><li><a href="https://www.androidperformance.com/en/2018/05/07/Android-performance-optimization-skills-and-tools/">Curated Excellent Blog Articles - Android Performance Optimization Must-Knows</a></li><li><a href="https://www.androidperformance.com/en/2023/12/30/the-performance/">Android Performance Optimization Knowledge Planet</a></li></ol><blockquote><p><strong>One walks faster alone, but a group walks further together.</strong></p></blockquote><p><img src="/en/images/WechatIMG581.webp" alt="Scan WeChat QR Code"></p>]]></content>
    
    
    <summary type="html">&lt;p&gt;A fellow developer shared a Weibo post (&lt;a href=&quot;https://weibo.com/1808884742/IApbpEVQr&quot;&gt;https://weibo.com/1808884742/IApbpEVQr&lt;/a&gt;) where blogger @王波粒 noticed a peculiar phenomenon on the Mate 30 Pro. I highly recommend watching the video first.&lt;/p&gt;
&lt;p&gt;The video’s description and some of the comments aren’t quite technically accurate. Here’s a summary of what’s actually happening: &lt;strong&gt;On Huawei phones, the Weibo app continues to load images smoothly while scrolling the main feed. However, the exact same version of the Weibo client on other phones waits until scrolling completely stops before it begins loading images.&lt;/strong&gt;&lt;/p&gt;
&lt;p&gt;This post looks at this phenomenon from a technical perspective, explores why it happens, and discusses what we can learn from it.&lt;/p&gt;</summary>


    <category term="Android" scheme="https://androidperformance.com/en/categories/Android/"/>
    
    
    <category term="Android" scheme="https://androidperformance.com/en/tags/Android/"/>
    
    <category term="Jank" scheme="https://androidperformance.com/en/tags/Jank/"/>
    
    <category term="Java" scheme="https://androidperformance.com/en/tags/Java/"/>
    
    <category term="Smooth" scheme="https://androidperformance.com/en/tags/Smooth/"/>
    
    <category term="Experience Optimization" scheme="https://androidperformance.com/en/tags/Experience-Optimization/"/>
    
  </entry>
  
  <entry>
    <title>An Incident Caused by a &#39;Leap&#39; Month - Analysis of Samsung System Reboots</title>
    <link href="https://androidperformance.com/en/2020/05/26/samsung_crash/"/>
    <id>https://androidperformance.com/en/2020/05/26/samsung_crash/</id>
    <published>2020-05-25T16:56:05.000Z</published>
    <updated>2026-05-10T23:29:51.068Z</updated>
    
    <content type="html"><![CDATA[<p>Around 1:30 AM on May 23, 2020, a large number of Samsung phone users in China experienced severe issues including freezes, infinite reboots, and forced entries into Recovery Mode. Improper handling by users led to data loss, and the incident quickly became a trending topic on social media platforms like Zhihu, with service centers overwhelmed.</p><p>Social media responses ranged from frustration to anger, with some comparing the incident to the Note 7 battery disaster, “charging-gate,” or “green-screen-gate.” Some predicted Samsung would be forced out of the Chinese market. People lost job offers due to missed calls, others lost valuable data, and some even resorted to smashing their devices in frustration.</p><p>As an Android developer, I am not here to pile on Samsung. My goal is to uncover the root cause of this incident and see what we can learn from it. Since it’s a technical failure in the Android system, it’s essential to analyze it from a technical perspective.</p><span id="more"></span><p><img src="/en/images/15904500356668.jpg" alt="Zhihu Trending Topic"></p><p>Even display units in shopping malls were bricked:</p><p><img src="/en/images/15904500558308.jpg" alt="Bricked Display Unit"></p><hr><h2 id="Conclusion"><a href="#Conclusion" class="headerlink" title="Conclusion"></a>Conclusion</h2><p>For those who prefer the bottom line, here is the summary of the investigation:</p><p><strong>The incident was caused by a critical system service repeatedly crashing, which triggered the system’s self-rescue mechanism and forced phones into Recovery Mode. The culprit was Samsung’s <code>SystemUI</code> process, specifically during the initialization of the Always On Display (AOD) plugin. Because AOD is a core part of the system interface, its failure caused <code>SystemUI</code> to crash loop. After a certain number of crashes, Android automatically enters Recovery Mode to protect the device (see image below).</strong></p><p><strong>AOD stands for Always On Display, a feature on high-end models that displays the time, weather, and patterns on the screen while the device is locked.</strong></p><p><strong>The crash occurred because May 23, 2020, marked the beginning of a “Leap 4th Month” in the Chinese lunar calendar. When AOD tried to render the lunar date, it hit a rare code branch for leap months. This branch attempted to retrieve a string resource called <code>common_date_leap_month</code>. Due to a bug in the build process of specific AOD versions, this field was missing from the resource files. This triggered a <code>FATAL EXCEPTION</code>, causing the process to restart. Upon restarting, it hit the same missing field, crashed again, and ultimately triggered the system’s jump to Recovery Mode.</strong></p><p><strong>This explains why the issue was localized to Chinese users: only they required the lunar “Leap” (闰) character to be displayed. It wasn’t the “Year 2000 bug” (Y2K), nor a server hack, nor a malicious move by Samsung. It was a build-time bug that remained hidden until a rare leap month occurred. In such cases, one simply has to admit the failure and apologize sincerely.</strong></p><hr><h2 id="Analysis"><a href="#Analysis" class="headerlink" title="Analysis"></a>Analysis</h2><p>For interested Android developers, let’s dive deeper into the technical analysis.</p><p>For Samsung’s engineers, analyzing this crash was likely trivial—they just needed to pull the logs from their monitoring systems. In fact, the problem was quickly identified and had technically been fixed in newer versions for about six months. However, for outside developers, we need to use a few tools to piece the story together.</p><h3 id="1-Starting-from-the-Symptoms"><a href="#1-Starting-from-the-Symptoms" class="headerlink" title="1. Starting from the Symptoms"></a>1. Starting from the Symptoms</h3><p>As mentioned, a frequent crash in a <code>persist</code> process triggers a system self-rescue into Recovery Mode. Most user screenshots reflected this:</p><p><img src="/en/images/15904500815732.jpg" alt="Recovery Interface"></p><p>Some users, however, saw an interface with specific error messages (presumably a custom Samsung diagnostic feature), which provided the essential clues:</p><p><img src="/en/images/15904500993262.jpg" alt="Error Message Interface"></p><p>This stack trace is all an Android developer needs. During a frame rendering flow, AOD’s <code>LocalDataView</code> failed during initialization. Specifically, the <code>getLunarCalendarInChina</code> method threw an error while trying to find the <code>common_date_leap_month</code> string resource.</p><p>The investigation then focused on two points:</p><ol><li><strong>The code logic surrounding the <code>common_date_leap_month</code> field.</strong></li><li><strong>Why the string field was missing despite being referenced by the code.</strong></li></ol><h3 id="2-Code-Analysis"><a href="#2-Code-Analysis" class="headerlink" title="2. Code Analysis"></a>2. Code Analysis</h3><p>To analyze the logic, we need to decompile the AOD APK. A highly recommended tool for this is <a href="https://github.com/tp7309/TTDeDroid">TTDeDroid</a>.</p><p>We can find the AOD APK on sites like APKMirror. Looking at the version history, Samsung updates AOD frequently. Feedback suggests that not all users were affected, and updating to the latest version resolved the issue. This implies the bug resided in older versions (likely around V4.0).</p><h4 id="Normal-Version-V5-2-05"><a href="#Normal-Version-V5-2-05" class="headerlink" title="Normal Version (V5.2.05)"></a>Normal Version (V5.2.05)</h4><p>The latest version works correctly. The logic in this version is:</p><figure class="highlight java"><table><tr><td class="gutter"><pre><span class="line">1</span><br></pre></td><td class="code"><pre><span class="line"><span class="type">String</span> <span class="variable">month</span> <span class="operator">=</span> shouldShowLeapMonth(locale) ? context.getResources().getString(R.string.common_date_leap_month) + months[convertMonth] : months[convertMonth];</span><br></pre></td></tr></table></figure><p>If it is a leap month, it fetches <code>common_date_leap_month</code>. A global search reveals this field is correctly defined in this version’s <code>R.java</code> and <code>strings.xml</code>.</p><p>This confirms the logic: <strong>The code only attempts to access <code>common_date_leap_month</code> when a leap month needs to be displayed. For 99.9% of the time, this code branch is never hit.</strong></p><p><img src="/en/images/15904501249419.jpg" alt="Normal Code Logic"><br><img src="/en/images/15904501422407.jpg" alt="R file with definition"><br><img src="/en/images/15904501665686.jpg" alt="strings.xml definition"></p><h4 id="Affected-Version-V4-1-70"><a href="#Affected-Version-V4-1-70" class="headerlink" title="Affected Version (V4.1.70)"></a>Affected Version (V4.1.70)</h4><p>In the versions that crashed on May 23, a global search for <code>common_date_leap_month</code> shows it is referenced in the code, but there is no corresponding entry in <code>R.java</code> or <code>strings.xml</code>. The code uses the field, but it is neither defined nor assigned a value.</p><p><img src="/en/images/15904501980864.jpg" alt="Field used but not defined"></p><p>The problematic code matches the stack trace exactly:</p><p><img src="/en/images/15904502144641.jpg" alt="Problematic Code Match"></p><figure class="highlight java"><table><tr><td class="gutter"><pre><span class="line">1</span><br><span class="line">2</span><br><span class="line">3</span><br><span class="line">4</span><br><span class="line">5</span><br><span class="line">6</span><br><span class="line">7</span><br><span class="line">8</span><br><span class="line">9</span><br><span class="line">10</span><br><span class="line">11</span><br><span class="line">12</span><br><span class="line">13</span><br><span class="line">14</span><br><span class="line">15</span><br><span class="line">16</span><br><span class="line">17</span><br><span class="line">18</span><br><span class="line">19</span><br><span class="line">20</span><br><span class="line">21</span><br><span class="line">22</span><br><span class="line">23</span><br></pre></td><td class="code"><pre><span class="line"><span class="keyword">private</span> String <span class="title function_">getLunarCalendarInChina</span><span class="params">(Context context)</span> &#123;</span><br><span class="line">    <span class="keyword">if</span> (sSolarLunarConverter == <span class="literal">null</span>) &#123;</span><br><span class="line">        sSolarLunarConverter = SECCalendarFeatures.getInstance().getSolarLunarConverter();</span><br><span class="line">        <span class="keyword">if</span> (sSolarLunarConverter == <span class="literal">null</span>) &#123;</span><br><span class="line">            <span class="keyword">return</span> <span class="string">&quot;&quot;</span>;</span><br><span class="line">        &#125;</span><br><span class="line">    &#125;</span><br><span class="line">    <span class="type">Time</span> <span class="variable">time</span> <span class="operator">=</span> <span class="keyword">new</span> <span class="title class_">Time</span>();</span><br><span class="line">    time.set(Calendar.getInstance().getTimeInMillis());</span><br><span class="line">    sSolarLunarConverter.convertSolarToLunar(time.getYear(), time.getMonth(), time.getMonthDay());</span><br><span class="line">    String[] months = context.getResources().getStringArray(R.array.common_LunarMonth);</span><br><span class="line">    String[] days = context.getResources().getStringArray(R.array.common_LunarDay);</span><br><span class="line">    <span class="type">int</span> <span class="variable">convertMonth</span> <span class="operator">=</span> sSolarLunarConverter.getMonth();</span><br><span class="line">    <span class="type">int</span> <span class="variable">convertDay</span> <span class="operator">=</span> sSolarLunarConverter.getDay() - <span class="number">1</span>;</span><br><span class="line">    ACLog.d(TAG, <span class="string">&quot;Lunar month and day : &quot;</span> + convertMonth + <span class="string">&quot;, &quot;</span> + convertDay);</span><br><span class="line">    <span class="keyword">if</span> (convertMonth &lt; <span class="number">0</span> || convertMonth &gt;= months.length || convertDay &lt; <span class="number">0</span> || convertDay &gt;= days.length) &#123;</span><br><span class="line">        ACLog.e(TAG, <span class="string">&quot;getLunarCalendarInChina, array out of bound month = &quot;</span> + months.length + <span class="string">&quot;, days = &quot;</span> + days.length);</span><br><span class="line">        <span class="keyword">return</span> <span class="string">&quot;&quot;</span>;</span><br><span class="line">    &#125;</span><br><span class="line">    <span class="comment">// The crash happens here because R.string.common_date_leap_month is missing</span></span><br><span class="line">    <span class="type">String</span> <span class="variable">chinaLunar</span> <span class="operator">=</span> (sSolarLunarConverter.isLeapMonth() ? context.getResources().getString(R.string.common_date_leap_month) + months[convertMonth] : months[convertMonth]) + days[convertDay];</span><br><span class="line">    <span class="keyword">return</span> chinaLunar;</span><br><span class="line">&#125;</span><br></pre></td></tr></table></figure><h3 id="3-When-did-the-bug-appear"><a href="#3-When-did-the-bug-appear" class="headerlink" title="3. When did the bug appear?"></a>3. When did the bug appear?</h3><p>Investigation shows the field disappeared when AOD was upgraded from V3.3.18 to V4.0.57 (October 2018). It remained missing until V4.2.44 was released in June 2019.</p><p><img src="/en/images/15904502326041.jpg" alt="Fix in V4.2.44"><br><img src="/en/images/15904502473489.jpg" alt="Field present in V3.3.18"></p><p><strong>Timeline Recap:</strong></p><ol><li><strong>October 24, 2018</strong>: Bug introduced in V4.0.57.</li><li><strong>June 24, 2019</strong>: Bug fixed in V4.2.44.</li></ol><p>Devices built with and never updated beyond those two dates were silent “time bombs,” waiting for the next leap month on May 23, 2020, to crash.</p><h3 id="4-The-Build-Issue"><a href="#4-The-Build-Issue" class="headerlink" title="4. The Build Issue"></a>4. The Build Issue</h3><p>A critical question remains: <strong>How did it compile?</strong><br>Usually, if you reference <code>R.string.some_field</code> in code without defining it in <code>strings.xml</code>, the compiler will fail immediately.</p><p><img src="/en/images/15904515163672.jpg" alt="The Culprit"></p><p>Possible explanations for this compiled APK existing:</p><ol><li><strong>Inter-library conflict</strong>: Different versions of the same library were used during compilation versus runtime.</li><li><strong>Maven&#x2F;Dependency Sync</strong>: The project used one version of a resource package during compilation, but a different version was packaged into the final APK.</li></ol><p>It’s likely the second case: the main project and its sub-modules had mismatched dependencies. The code successfully found the field at compile time from one module, but the field was missing in the resource package included in the final APK, leading to the runtime <code>NoSuchFieldError</code>.</p><hr><h2 id="Summary"><a href="#Summary" class="headerlink" title="Summary"></a>Summary</h2><p>This incident was a perfect storm: a build-time dependency error meeting a once-in-a-decade lunar leap month.</p><h3 id="Lessons-Learned"><a href="#Lessons-Learned" class="headerlink" title="Lessons Learned:"></a>Lessons Learned:</h3><ol><li><strong>Feature Testing</strong>: Specialized functions like lunar calendars often go untested because they aren’t “daily” features. High-risk, rare-occurrence code paths must be meticulously validated, ideally by subject-matter experts.</li><li><strong>Dependency Management</strong>: In projects with complex dependencies, ensure absolute consistency between compile-time and runtime environments.</li><li><strong>UI Stability</strong>: Modules like <code>SystemUI</code> (lock screen, status bar, AOD) and the Launcher are critical to user perception. A failure here is catastrophic. Engineers in these areas must balance innovation with extreme stability.</li><li><strong>Updates</strong>: Users should be encouraged to stay current with system and core app updates, as these often contain critical fixes that aren’t advertised as flashy features.</li><li><strong>Curiosity and Humility</strong>: For developers, curiosity helps look past symptoms to find the essence of a bug. Humility reminds us that the Android ecosystem is vast, and our knowledge is but a drop in the ocean.</li></ol><h1 id="About-Me-amp-amp-Blog"><a href="#About-Me-amp-amp-Blog" class="headerlink" title="About Me &amp;&amp; Blog"></a>About Me &amp;&amp; Blog</h1><p>Below is my personal intro and related links. I look forward to exchanging ideas with fellow professionals. “When three walk together, one can always be my teacher!”</p><ol><li><a href="https://www.androidperformance.com/en/about/">Blogger Intro</a></li><li><a href="https://www.androidperformance.com/en/2019/12/01/BlogMap/">Blog Content Navigation</a>: A guide for my blog content.</li><li><a href="https://www.androidperformance.com/en/2018/05/07/Android-performance-optimization-skills-and-tools/">Curated Excellent Blog Articles - Android Performance Optimization Must-Knows</a></li><li><a href="https://www.androidperformance.com/en/2023/12/30/the-performance/">Android Performance Optimization Knowledge Planet</a></li></ol><blockquote><p><strong>One walks faster alone, but a group walks further together.</strong></p></blockquote><p><img src="/en/images/WechatIMG581.webp" alt="Scan WeChat QR Code"></p>]]></content>
    
    
    <summary type="html">&lt;p&gt;Around 1:30 AM on May 23, 2020, a large number of Samsung phone users in China experienced severe issues including freezes, infinite reboots, and forced entries into Recovery Mode. Improper handling by users led to data loss, and the incident quickly became a trending topic on social media platforms like Zhihu, with service centers overwhelmed.&lt;/p&gt;
&lt;p&gt;Social media responses ranged from frustration to anger, with some comparing the incident to the Note 7 battery disaster, “charging-gate,” or “green-screen-gate.” Some predicted Samsung would be forced out of the Chinese market. People lost job offers due to missed calls, others lost valuable data, and some even resorted to smashing their devices in frustration.&lt;/p&gt;
&lt;p&gt;As an Android developer, I am not here to pile on Samsung. My goal is to uncover the root cause of this incident and see what we can learn from it. Since it’s a technical failure in the Android system, it’s essential to analyze it from a technical perspective.&lt;/p&gt;</summary>


    <category term="Android" scheme="https://androidperformance.com/en/categories/Android/"/>
    
    
    <category term="Android" scheme="https://androidperformance.com/en/tags/Android/"/>
    
    <category term="Java" scheme="https://androidperformance.com/en/tags/Java/"/>
    
  </entry>
  
  <entry>
    <title>Analysis of Android App Chain Wakeups</title>
    <link href="https://androidperformance.com/en/2020/05/07/Android-App-Chain-Wakeup/"/>
    <id>https://androidperformance.com/en/2020/05/07/Android-App-Chain-Wakeup/</id>
    <published>2020-05-07T15:16:20.000Z</published>
    <updated>2026-05-10T23:29:51.053Z</updated>
    
    <content type="html"><![CDATA[<p>The release of MIUI 12 brought a long-standing battle between App developers and ROM developers into the public eye, revealing the intricate details of this technical tug-of-war. As the saying goes, “While the demon rises a foot, the path rises ten feet.” ROM developers, with their higher system-level permissions, generally hold the upper hand. App developers, however, are not easily deterred, employing various “black technologies” for background persistence and cross-app wakeups. Even Google has stepped in to mediate, establishing rules to regulate behavior for both parties. This competition is arguably healthy; a total victory by either side would inevitably lead to stagnation or the loss of useful functionality.</p><p>However, the victims of this struggle are undoubtedly the consumers. If App developers succeed, phones become cluttered with persistent background processes that hog CPU and memory. Conversely, if ROM developers are too aggressive, the app experience suffer—a pain well-known to many Android developers.</p><p>As discussed later in this article, most smartphone manufacturers have developed their own strategies to handle auto-starts and associated starts. Beyond the technical struggle, there’s the issue of privacy. Baidu’s Robin Li once remarked that <strong>“Chinese people are more open about privacy and relatively less sensitive. If they can trade privacy for convenience, safety, or efficiency, they are willing to do so in many cases.”</strong> Consider the convenience of copying a phrase in WeChat and having Taobao automatically open to the corresponding item. It’s helpful, isn’t it? But do we really want every app peering into our clipboards?</p><span id="more"></span><p>Privacy should not be dismissed lightly. Technology is a double-edged sword. If privacy falls into the wrong hands, the consequences can be severe. This is exactly why the EU implemented the General Data Protection Regulation (GDPR). For example, many domestic manufacturers now differentiate their products for the EU market, disabling various data collection features to avoid massive fines. In other markets, data collection often remains unchecked.</p><p>This article does not delve into the ethics of privacy—I unconditionally support privacy protection. Instead, I will analyze the technical aspects of “Auto-start” and “Chain Wakeup” as highlighted by MIUI 12.</p><p><em>Note: You may not see some of these behaviors on your own phone because I am using AOSP code based on Android 10. Most domestic ROMs have already blocked these activities.</em></p><hr><h2 id="Technical-Terminology-Explained"><a href="#Technical-Terminology-Explained" class="headerlink" title="Technical Terminology Explained"></a>Technical Terminology Explained</h2><p>First, let’s define a few key terms to establish a common understanding.</p><h3 id="Process-Startup"><a href="#Process-Startup" class="headerlink" title="Process Startup"></a>Process Startup</h3><p>In Android, an app is composed of six potential parts: the <strong>Process</strong> (Mandatory), <strong>Activity</strong> (Optional), <strong>BroadcastReceiver</strong> (Optional), <strong>Service</strong> (Optional), <strong>ContentProvider</strong> (Optional), and <strong>Sub-processes</strong> (Optional).</p><p>While the last four are the well-known “Four Major Components,” they are special because each can be started independently. However, before any component starts, the system checks if its corresponding process exists. If not, the system must first launch the process before starting the component. When you tap an app icon on the home screen, you are launching an Activity. The system creates the process, starts the Activity, and then you see the interface.</p><p>Typically, auto-starts and chain wakeups avoid launching Activities because they are visible to the user. Mysteriously popping up a window from the background is a quick way to get uninstalled. Instead, these “silent” startups usually target <code>BroadcastReceiver</code>, <code>Service</code>, or <code>ContentProvider</code>.</p><h3 id="Auto-start-Self-starting"><a href="#Auto-start-Self-starting" class="headerlink" title="Auto-start (Self-starting)"></a>Auto-start (Self-starting)</h3><p>Auto-start refers to an app launching its own process without the help of other apps, typically by listening for system events (like booting or network changes) or file modifications using system mechanisms.</p><h3 id="Associated-Start-Link-starting-x2F-Chain-Wakeup"><a href="#Associated-Start-Link-starting-x2F-Chain-Wakeup" class="headerlink" title="Associated Start (Link-starting &#x2F; Chain Wakeup)"></a>Associated Start (Link-starting &#x2F; Chain Wakeup)</h3><p>This involves one app leveraging another to launch itself. For example, opening a reading app might trigger the background launch of a writer’s assistant, a telecom app, or a language learning tool.</p><h3 id="Startup-Blocking"><a href="#Startup-Blocking" class="headerlink" title="Startup Blocking"></a>Startup Blocking</h3><p>Also known as “Wakeup Interception,” ROM developers insert logic at the component startup point. Only components meeting specific criteria are allowed to launch their process. If the criteria aren’t met, the request is discarded, effectively blocking the startup.</p><p>This is a delicate task. ROM developers must judge work states and the “reasonableness” of a launch. Incorrect blocking can break legitimate user flows—for instance, if a user attempts to pay via Alipay from within another app but the ROM blocks Alipay’s payment component, the resulting UX failure will surely frustrate the user.</p><hr><h2 id="Analysis-Methods"><a href="#Analysis-Methods" class="headerlink" title="Analysis Methods"></a>Analysis Methods</h2><h3 id="Monkey"><a href="#Monkey" class="headerlink" title="Monkey"></a>Monkey</h3><p>To analyze app startups, you need to install a large number of apps and run Monkey to force most processes into action. The command I used is:</p><figure class="highlight shell"><table><tr><td class="gutter"><pre><span class="line">1</span><br></pre></td><td class="code"><pre><span class="line">adb shell monkey --kill-process-after-error --ignore-security-exceptions --ignore-crashes --pct-appswitch 90 --pct-touch 10 --throttle 10000 --ignore-timeouts --ignore-native-crashes 100000000</span><br></pre></td></tr></table></figure><h3 id="EventLog"><a href="#EventLog" class="headerlink" title="EventLog"></a>EventLog</h3><p>EventLog provides a truthful record of process starts and deaths. I use the following filter:</p><figure class="highlight shell"><table><tr><td class="gutter"><pre><span class="line">1</span><br></pre></td><td class="code"><pre><span class="line">adb logcat -b events | egrep &quot;am_proc_died|am_proc_start&quot;</span><br></pre></td></tr></table></figure><h3 id="Dumpsys"><a href="#Dumpsys" class="headerlink" title="Dumpsys"></a>Dumpsys</h3><p><code>dumpsys activity</code> is invaluable for analyzing the details of a process’s components.</p><figure class="highlight shell"><table><tr><td class="gutter"><pre><span class="line">1</span><br></pre></td><td class="code"><pre><span class="line">adb shell dumpsys activity</span><br></pre></td></tr></table></figure><hr><h2 id="Technical-Analysis-of-Auto-starts"><a href="#Technical-Analysis-of-Auto-starts" class="headerlink" title="Technical Analysis of Auto-starts"></a>Technical Analysis of Auto-starts</h2><p>Auto-starts rely on system mechanisms to wake up a process. Common events include booting, network changes, and media library scans.</p><h3 id="Boot-Completed"><a href="#Boot-Completed" class="headerlink" title="Boot Completed"></a>Boot Completed</h3><p>After a phone restarts, the system broadcasts a “Boot Completed” signal to all apps registered for it. These apps can then wake themselves up to start background tasks (or launch even more processes). The broadcast is:</p><figure class="highlight plaintext"><table><tr><td class="gutter"><pre><span class="line">1</span><br></pre></td><td class="code"><pre><span class="line">android.intent.action.BOOT_COMPLETED</span><br></pre></td></tr></table></figure><p>Apps use this to continue tasks like photo backups, contact syncing, checking for updates, or pushing news. <strong>This is a primary method for auto-starting.</strong></p><h4 id="Case-Study-Tencent-News"><a href="#Case-Study-Tencent-News" class="headerlink" title="Case Study: Tencent News"></a>Case Study: Tencent News</h4><p>In the logs, <code>com.tencent.news.system.BootBroadcastReceiver</code> received the <code>BOOT_COMPLETED</code> broadcast and spent 7 seconds processing it. To do this, the system first had to launch the <code>com.tencent.news</code> process to execute the <code>onReceive</code> method. This is a classic auto-start case.</p><p><img src="/en/images/15888647034327.jpg"></p><h3 id="Network-Changes"><a href="#Network-Changes" class="headerlink" title="Network Changes"></a>Network Changes</h3><p>This includes connecting&#x2F;disconnecting to the internet or switching between Wi-Fi and mobile data. The broadcast is:</p><figure class="highlight plaintext"><table><tr><td class="gutter"><pre><span class="line">1</span><br></pre></td><td class="code"><pre><span class="line">android.net.conn.CONNECTIVITY_CHANGE</span><br></pre></td></tr></table></figure><p>Apps listen to this to adjust behavior—for example, a live streaming app might warn a user if they switch from Wi-Fi to 4G to prevent data overages. <strong>However, it is also frequently used for silent auto-starts.</strong></p><h4 id="Examples"><a href="#Examples" class="headerlink" title="Examples"></a>Examples</h4><p>Here are some broadcast receivers triggered by network changes (there were over 200 in my test):</p><ol><li><strong>DingTalk</strong> (<code>com.alibaba.android.rimet</code>): <code>com.xiaomi.push.service.receivers.NetworkStatusReceiver</code></li><li><strong>Learning Strong Nation</strong> (<code>cn.xuexi.android</code>): <code>com.xiaomi.push.service.receivers.NetworkStatusReceiver</code></li><li><strong>Weibo</strong> (<code>com.sina.weibo</code>): <code>com.xiaomi.push.service.receivers.NetworkStatusReceiver</code></li><li><strong>DiDi</strong> (<code>com.sdu.didi.psnger</code>): <code>com.didi.sdk.push.PushNetReceiver</code></li><li><strong>Inke</strong> (<code>com.meelive.ingkee</code>): <code>com.network_optimization.NetWorkStateReceiver</code></li></ol><p><img src="/en/images/15888647135669.jpg"></p><p>Other similar broadcasts include <code>android.net.wifi.STATE_CHANGE</code>:</p><p><img src="/en/images/15888647201101.jpg"></p><h3 id="Media-Library-Scanning"><a href="#Media-Library-Scanning" class="headerlink" title="Media Library Scanning"></a>Media Library Scanning</h3><p>The system notifies apps when files change or storage is mounted.</p><figure class="highlight plaintext"><table><tr><td class="gutter"><pre><span class="line">1</span><br><span class="line">2</span><br><span class="line">3</span><br></pre></td><td class="code"><pre><span class="line">android.intent.action.MEDIA_SCANNER_STARTED</span><br><span class="line">android.intent.action.MEDIA_SCANNER_FINISHED</span><br><span class="line">android.intent.action.MEDIA_EJECT</span><br></pre></td></tr></table></figure><h4 id="Case-Study-JD-Finance"><a href="#Case-Study-JD-Finance" class="headerlink" title="Case Study: JD Finance"></a>Case Study: JD Finance</h4><p><code>com.jd.jrapp.library.longconnection.receiver.BootReceiver</code> listens for <code>MEDIA_SCANNER_STARTED</code> to trigger a process launch.</p><p><img src="/en/images/15888647284822.jpg"></p><h3 id="Third-Party-SDKs-e-g-GeTui"><a href="#Third-Party-SDKs-e-g-GeTui" class="headerlink" title="Third-Party SDKs (e.g., GeTui)"></a>Third-Party SDKs (e.g., GeTui)</h3><p>GeTui is a popular push notification SDK. It integrates multiple auto-start methods, including <code>BOOT_COMPLETED</code>, <code>CONNECTIVITY_CHANGE</code>, and <code>USER_PRESENT</code>. Developers often customize a service inheriting from <code>com.igexin.sdk.PushService</code>. Using <code>:pushservice</code> as a process name suffix is a common indicator.</p><p>Looking at GeTui’s configuration documentation:</p><figure class="highlight xml"><table><tr><td class="gutter"><pre><span class="line">1</span><br><span class="line">2</span><br><span class="line">3</span><br><span class="line">4</span><br><span class="line">5</span><br><span class="line">6</span><br><span class="line">7</span><br><span class="line">8</span><br><span class="line">9</span><br><span class="line">10</span><br><span class="line">11</span><br><span class="line">12</span><br><span class="line">13</span><br><span class="line">14</span><br><span class="line">15</span><br><span class="line">16</span><br><span class="line">17</span><br></pre></td><td class="code"><pre><span class="line"><span class="tag">&lt;<span class="name">service</span></span></span><br><span class="line"><span class="tag">    <span class="attr">android:name</span>=<span class="string">&quot;com.igexin.sdk.PushService&quot;</span></span></span><br><span class="line"><span class="tag">    <span class="attr">android:permission</span>=<span class="string">&quot;android.permission.BIND_JOB_SERVICE&quot;</span></span></span><br><span class="line"><span class="tag">    <span class="attr">android:exported</span>=<span class="string">&quot;false&quot;</span></span></span><br><span class="line"><span class="tag">    <span class="attr">android:label</span>=<span class="string">&quot;NotificationCenter&quot;</span></span></span><br><span class="line"><span class="tag">    <span class="attr">android:process</span>=<span class="string">&quot;:pushservice&quot;</span>/&gt;</span></span><br><span class="line"><span class="tag">&lt;<span class="name">receiver</span> <span class="attr">android:name</span>=<span class="string">&quot;com.igexin.sdk.PushReceiver&quot;</span> &gt;</span></span><br><span class="line">    <span class="tag">&lt;<span class="name">intent-filter</span>&gt;</span></span><br><span class="line">        <span class="tag">&lt;<span class="name">action</span> <span class="attr">android:name</span>=<span class="string">&quot;android.intent.action.BOOT_COMPLETED&quot;</span> /&gt;</span></span><br><span class="line">        <span class="tag">&lt;<span class="name">action</span> <span class="attr">android:name</span>=<span class="string">&quot;android.net.conn.CONNECTIVITY_CHANGE&quot;</span> /&gt;</span></span><br><span class="line">        <span class="tag">&lt;<span class="name">action</span> <span class="attr">android:name</span>=<span class="string">&quot;android.intent.action.USER_PRESENT&quot;</span> /&gt;</span></span><br><span class="line">        <span class="comment">&lt;!-- Optional actions to improve survival --&gt;</span></span><br><span class="line">        <span class="tag">&lt;<span class="name">action</span> <span class="attr">android:name</span>=<span class="string">&quot;android.intent.action.MEDIA_MOUNTED&quot;</span> /&gt;</span></span><br><span class="line">        <span class="tag">&lt;<span class="name">action</span> <span class="attr">android:name</span>=<span class="string">&quot;android.intent.action.ACTION_POWER_CONNECTED&quot;</span> /&gt;</span></span><br><span class="line">        <span class="tag">&lt;<span class="name">action</span> <span class="attr">android:name</span>=<span class="string">&quot;android.intent.action.ACTION_POWER_DISCONNECTED&quot;</span> /&gt;</span></span><br><span class="line">    <span class="tag">&lt;/<span class="name">intent-filter</span>&gt;</span></span><br><span class="line"><span class="tag">&lt;/<span class="name">receiver</span>&gt;</span></span><br></pre></td></tr></table></figure><p><img src="/en/images/15888647377742.jpg"></p><hr><h2 id="Technical-Analysis-of-Associated-Starts-Chain-Wakeups"><a href="#Technical-Analysis-of-Associated-Starts-Chain-Wakeups" class="headerlink" title="Technical Analysis of Associated Starts (Chain Wakeups)"></a>Technical Analysis of Associated Starts (Chain Wakeups)</h2><p>Associated starts occur when multiple apps use the same SDK. When you launch one app, that SDK can then launch other apps that use it. This happens within large app families (like those of BAT) or through shared third-party SDKs like JPush.</p><p>Let’s look at an <code>EventLog</code> entry:</p><figure class="highlight plaintext"><table><tr><td class="gutter"><pre><span class="line">1</span><br></pre></td><td class="code"><pre><span class="line">[0,19428,10195,com.qq.reader,service,&#123;com.qq.reader/cn.jpush.android.service.DaemonService&#125;]</span><br></pre></td></tr></table></figure><ul><li><strong>Process Started</strong>: <code>com.qq.reader</code> (QQ Reader)</li><li><strong>PID</strong>: 19428</li><li><strong>Component</strong>: <code>cn.jpush.android.service.DaemonService</code></li><li><strong>Type</strong>: Service</li></ul><h3 id="Case-Study-Qidian-Launching-QQ-Reader-via-JPush"><a href="#Case-Study-Qidian-Launching-QQ-Reader-via-JPush" class="headerlink" title="Case Study: Qidian Launching QQ Reader via JPush"></a>Case Study: Qidian Launching QQ Reader via JPush</h3><p>After forcing QQ Reader to stop, I observed the <code>EventLog</code>. QQ Reader’s process was awakened by the launch of the <code>DaemonService</code> component. While <code>EventLog</code> doesn’t show <em>who</em> requested the launch, <code>dumpsys activity</code> reveals the caller in the <code>ServiceRecord</code>‘s <code>Connections</code> field: it was <code>com.qidian.QDReader:pushcore</code>.</p><p><img src="/en/images/15888647497735.jpg"><br><img src="/en/images/15888647596688.jpg"></p><p>Xiaomi’s MIUI 12 would display this as: “Qidian Reading launched QQ Reader at 8:48 AM.” JPush’s official documentation explicitly provides features for waking up other apps and being awakened by them.</p><h4 id="JPush-Wakeup-Configuration"><a href="#JPush-Wakeup-Configuration" class="headerlink" title="JPush Wakeup Configuration"></a>JPush Wakeup Configuration</h4><p><img src="/en/images/15888647676816.jpg"><br><img src="/en/images/15888647754201.jpg"><br><img src="/en/images/15888647806293.jpg"></p><hr><h2 id="OEM-Responses"><a href="#OEM-Responses" class="headerlink" title="OEM Responses"></a>OEM Responses</h2><p>Process management is the most contested area in Android. MIUI chose to show this battle to users, but other manufacturers do the same quietly behind the scenes. Without these controls, phones would be unusable. On my test Pixel, processes are constantly killed by the Low Memory Killer (LMK) due to low RAM, only to be immediately restarted, draining the battery and causing severe lag.</p><p>The official documentation for push SDKs often lists the settings paths for various OEMs. It’s worth checking these lists to remove apps from white-lists that you don’t want running in the background.</p><h3 id="GeTui-White-list-Configurations"><a href="#GeTui-White-list-Configurations" class="headerlink" title="GeTui White-list Configurations"></a>GeTui White-list Configurations</h3><h4 id="EMUI-OS-Huawei"><a href="#EMUI-OS-Huawei" class="headerlink" title="EMUI OS (Huawei)"></a>EMUI OS (Huawei)</h4><ul><li><strong>Auto-start Management</strong>: Apps must be added to the “Auto-start” list, or they won’t launch after being killed or at boot.</li><li><strong>Background App Protection</strong>: Apps must be manually added to this list to survive device sleep.</li><li><strong>Notification Management</strong>: Settings include Prompt, Allow, and Prohibit.</li></ul><h4 id="Flyme-OS-Meizu"><a href="#Flyme-OS-Meizu" class="headerlink" title="Flyme OS (Meizu)"></a>Flyme OS (Meizu)</h4><ul><li><strong>Auto-start Management</strong>: Requires manual inclusion in the list.</li><li><strong>Notification Push</strong>: Disabling notifications hides all messages.</li></ul><h4 id="Funtouch-OS-VIVO"><a href="#Funtouch-OS-VIVO" class="headerlink" title="Funtouch OS (VIVO)"></a>Funtouch OS (VIVO)</h4><ul><li><strong>Auto-start Management</strong>: Managed via “iManager.” Force-killing an app manually prevents auto-restart even if it’s on the list.</li></ul><h4 id="Color-OS-OPPO"><a href="#Color-OS-OPPO" class="headerlink" title="Color OS (OPPO)"></a>Color OS (OPPO)</h4><ul><li><strong>Frozen App Management</strong>: Apps must be added to “Pure Background” to receive messages during lock screen.</li><li><strong>Auto-start Management</strong>: Requires inclusion in the list and “locking” the process in the recent apps&#x2F;running view.</li></ul><h4 id="MIUI-OS-Xiaomi"><a href="#MIUI-OS-Xiaomi" class="headerlink" title="MIUI OS (Xiaomi)"></a>MIUI OS (Xiaomi)</h4><ul><li><strong>Auto-start Management</strong>: Requires manual inclusion.</li><li><strong>Battery Saver</strong>: Must be disabled for the app, or network access will be restricted after a few minutes in the background.</li></ul><hr><h1 id="About-Me-amp-amp-Blog"><a href="#About-Me-amp-amp-Blog" class="headerlink" title="About Me &amp;&amp; Blog"></a>About Me &amp;&amp; Blog</h1><p>Below are my personal details and links. I look forward to connecting and sharing knowledge with fellow developers!</p><ol><li><a href="https://www.androidperformance.com/en/about/">About Me</a>: Includes my WeChat and WeChat group links.</li><li><a href="https://www.androidperformance.com/en/2019/12/01/BlogMap/">Blog Navigation</a>: A guide to the content on this blog.</li><li><a href="https://www.androidperformance.com/en/2018/05/07/Android-performance-optimization-skills-and-tools/">Curated Android Performance Articles</a>: A collection of must-read performance optimization articles. Self-nominations&#x2F;recommendations are welcome!</li><li><a href="https://www.androidperformance.com/en/2023/12/30/the-performance/">Android Performance Knowledge Planet</a>: Join our community for more insights.</li></ol><blockquote><p><strong>“If you want to go fast, go alone. If you want to go far, go together.”</strong></p></blockquote><p><img src="/en/images/WechatIMG581.webp" alt="WeChat QR Code"></p>]]></content>
    
    
    <summary type="html">&lt;p&gt;The release of MIUI 12 brought a long-standing battle between App developers and ROM developers into the public eye, revealing the intricate details of this technical tug-of-war. As the saying goes, “While the demon rises a foot, the path rises ten feet.” ROM developers, with their higher system-level permissions, generally hold the upper hand. App developers, however, are not easily deterred, employing various “black technologies” for background persistence and cross-app wakeups. Even Google has stepped in to mediate, establishing rules to regulate behavior for both parties. This competition is arguably healthy; a total victory by either side would inevitably lead to stagnation or the loss of useful functionality.&lt;/p&gt;
&lt;p&gt;However, the victims of this struggle are undoubtedly the consumers. If App developers succeed, phones become cluttered with persistent background processes that hog CPU and memory. Conversely, if ROM developers are too aggressive, the app experience suffer—a pain well-known to many Android developers.&lt;/p&gt;
&lt;p&gt;As discussed later in this article, most smartphone manufacturers have developed their own strategies to handle auto-starts and associated starts. Beyond the technical struggle, there’s the issue of privacy. Baidu’s Robin Li once remarked that &lt;strong&gt;“Chinese people are more open about privacy and relatively less sensitive. If they can trade privacy for convenience, safety, or efficiency, they are willing to do so in many cases.”&lt;/strong&gt; Consider the convenience of copying a phrase in WeChat and having Taobao automatically open to the corresponding item. It’s helpful, isn’t it? But do we really want every app peering into our clipboards?&lt;/p&gt;</summary>


    <category term="Android" scheme="https://androidperformance.com/en/categories/Android/"/>
    
    
    <category term="Android" scheme="https://androidperformance.com/en/tags/Android/"/>
    
    <category term="Startup" scheme="https://androidperformance.com/en/tags/Startup/"/>
    
    <category term="Memory" scheme="https://androidperformance.com/en/tags/Memory/"/>
    
  </entry>
  
  <entry>
    <title>Android Systrace Basics - SurfaceFlinger Explained</title>
    <link href="https://androidperformance.com/en/2020/02/14/Android-Systrace-SurfaceFlinger/"/>
    <id>https://androidperformance.com/en/2020/02/14/Android-Systrace-SurfaceFlinger/</id>
    <published>2020-02-14T02:25:45.000Z</published>
    <updated>2026-05-10T23:29:51.060Z</updated>
    
    <content type="html"><![CDATA[<p>This is the fifth article in the Systrace series, primarily providing a brief introduction to the workflow of <code>SurfaceFlinger</code>. It covers several important threads within <code>SurfaceFlinger</code>, including Vsync signal interpretation, app buffer display, and jank detection. Since Vsync has already been covered in <a href="https://www.androidperformance.com/en/2019/12/01/Android-Systrace-Vsync/">Systrace Basics - Vsync Explained</a> and <a href="https://www.androidperformance.com/en/2019/10/22/Android-Choreographer/">Detailed Explanation of Android Rendering Mechanism Based on Choreographer</a>, it won’t be discussed in detail here.</p><p>The purpose of this series is to view the overall operation of the Android system from a different perspective using Systrace, while also providing an alternative angle for learning the Framework. Perhaps you’ve read many articles about the Framework but can never remember the code, or you’re unclear about the execution flow. Maybe from Systrace’s graphical perspective, you can gain a deeper understanding.</p><span id="more"></span><h2 id="Table-of-Contents"><a href="#Table-of-Contents" class="headerlink" title="Table of Contents"></a>Table of Contents</h2><ul><li><a href="#series">Series Article Index</a></li><li><a href="#content">Main Content</a></li><li><a href="#app">App Section</a></li><li><a href="#bq">BufferQueue Section</a></li><li><a href="#sf">SurfaceFlinger Section</a></li><li><a href="#hwc">HWComposer Section</a></li><li><a href="#refs">References</a></li><li><a href="#about">About Me &amp;&amp; Blog</a></li></ul><p><a id="series"></a></p><h1 id="Series-Article-Index"><a href="#Series-Article-Index" class="headerlink" title="Series Article Index"></a>Series Article Index</h1><ol><li><a href="https://www.androidperformance.com/en/2019/05/28/Android-Systrace-About/">Introduction to Systrace</a></li><li><a href="https://www.androidperformance.com/en/2019/07/23/Android-Systrace-Pre/">Systrace Basics - Prerequisites for Systrace</a></li><li><a href="https://www.androidperformance.com/en/2019/05/27/why-60-fps/">Systrace Basics - Why 60 fps?</a></li><li><a href="https://www.androidperformance.com/en/2019/06/29/Android-Systrace-SystemServer/">Android Systrace Basics - SystemServer Explained</a></li><li><a href="https://www.androidperformance.com/en/2020/02/14/Android-Systrace-SurfaceFlinger/">Systrace Basics - SurfaceFlinger Explained</a></li><li><a href="https://www.androidperformance.com/en/2019/11/04/Android-Systrace-Input/">Systrace Basics - Input Explained</a></li><li><a href="https://www.androidperformance.com/en/2019/12/01/Android-Systrace-Vsync/">Systrace Basics - Vsync Explained</a></li><li><a href="https://www.androidperformance.com/en/2019/10/22/Android-Choreographer/">Systrace Basics - Vsync-App: Detailed Explanation of Choreographer-Based Rendering Mechanism</a></li><li><a href="https://www.androidperformance.com/en/2019/11/06/Android-Systrace-MainThread-And-RenderThread/">Systrace Basics - MainThread and RenderThread Explained</a></li><li><a href="https://www.androidperformance.com/en/2019/12/06/Android-Systrace-Binder/">Systrace Basics - Binder and Lock Contention Explained</a></li><li><a href="https://www.androidperformance.com/en/2019/12/15/Android-Systrace-Triple-Buffer">Systrace Basics - Triple Buffer Explained</a></li><li><a href="https://www.androidperformance.com/en/2019/12/21/Android-Systrace-CPU">Systrace Basics - CPU Info Explained</a></li><li><a href="https://www.androidperformance.com/en/2021/04/24/android-systrace-smooth-in-action-1/">Systrace Smoothness in Action 1: Understanding Jank Principles</a></li><li><a href="https://www.androidperformance.com/en/2021/04/24/android-systrace-smooth-in-action-2/">Systrace Smoothness in Action 2: Case Analysis - MIUI Launcher Scroll Jank Analysis</a></li><li><a href="https://www.androidperformance.com/en/2021/04/24/android-systrace-smooth-in-action-3/">Systrace Smoothness in Action 3: FAQs During Jank Analysis</a></li><li><a href="https://www.androidperformance.com/en/2021/09/13/android-systrace-Responsiveness-in-action-1/">Systrace Responsiveness in Action 1: Understanding Responsiveness Principles</a></li><li><a href="https://www.androidperformance.com/en/2021/09/13/android-systrace-Responsiveness-in-action-2/">Systrace Responsiveness in Action 2: Responsiveness Analysis - Using App Startup as an Example</a></li><li><a href="https://www.androidperformance.com/en/2021/09/13/android-systrace-Responsiveness-in-action-3/">Systrace Responsiveness in Action 3: Extended Knowledge on Responsiveness</a></li><li><a href="https://www.androidperformance.com/en/2022/01/21/android-systrace-cpu-state-runnable/">Systrace Thread CPU State Analysis Tips - Runnable</a></li><li><a href="https://www.androidperformance.com/en/2022/03/13/android-systrace-cpu-state-running/">Systrace Thread CPU State Analysis Tips - Running</a></li><li><a href="https://www.androidperformance.com/en/2022/03/13/android-systrace-cpu-state-sleep/">Systrace Thread CPU State Analysis Tips - Sleep and Uninterruptible Sleep</a></li></ol><p><a id="content"></a></p><h1 id="Main-Content"><a href="#Main-Content" class="headerlink" title="Main Content"></a>Main Content</h1><p>Read this SurfaceFlinger article together with <a href="https://www.androidperformance.com/en/2025/08/05/Android-Perfetto-08-Vsync/">Perfetto 8: Vsync and performance analysis</a>. In old Systrace, the main evidence was the relationship between the SurfaceFlinger main thread, BufferQueue, HWC, and app buffers. In Perfetto, the same objects still matter, but the evidence should be read across the SurfaceFlinger process tracks, Display&#x2F;HWC related tracks, buffer slices, Frame Timeline, and CPU scheduling.</p><p>The key workflow change is this: do not judge only by whether the app exceeded 16.6ms, and do not judge only by whether SurfaceFlinger has a long slice. First locate the problematic frame, then check whether the app submitted a buffer on time, whether SurfaceFlinger latched it on time, whether composition waited for fences&#x2F;HWC&#x2F;GPU, and whether CPU or Binder delayed SurfaceFlinger. That separates dropped frames into app production delay, unavailable buffer, slow SurfaceFlinger composition, and HWC&#x2F;GPU waiting.</p><p>Here is the official <a href="https://source.android.google.cn/devices/graphics/arch-sf-hwc.html?authuser=0&hl=de">definition of SurfaceFlinger</a>:</p><ol><li>Most apps display three layers on the screen: a status bar at the top, a navigation bar at the bottom or side, and the app interface itself. Some apps may have more or fewer layers (e.g., the default home screen app has a dedicated wallpaper layer, while a fullscreen game might hide the status bar). Each layer can be updated independently. The status bar and navigation bar are rendered by system processes, while the app layer is rendered by the app, with no coordination between them.</li><li>Device displays refresh at a fixed rate, typically 60 fps on phones and tablets. If content updates during a refresh, tearing occurs; therefore, it’s essential to update content only between cycles. The system receives a signal from the display device when it’s safe to update content. For historical reasons, we call this the <strong>VSYNC signal</strong>.</li><li>Refresh rates may change over time; for example, some mobile devices range between 58 fps and 62 fps depending on current conditions. For HDMI-connected TVs, the rate can theoretically drop to 24 Hz or 48 Hz to match video. Since each refresh cycle can only update the screen once, submitting buffers at 200 fps is wasteful as most frames will be discarded. <code>SurfaceFlinger</code> doesn’t act every time an app submits a buffer; instead, it wakes up only when the display device is ready for a new buffer.</li><li>When a VSYNC signal arrives, <code>SurfaceFlinger</code> traverses its layer list searching for new buffers. If found, it acquires them; otherwise, it continues using previously acquired buffers. <code>SurfaceFlinger</code> must always display content, so it retains one buffer. If a layer lacks a submitted buffer, it is ignored.</li><li>After collecting all buffers for visible layers, <code>SurfaceFlinger</code> consults the Hardware Composer on how to perform composition.</li></ol><p>— Cited from <a href="https://source.android.google.cn/devices/graphics/arch-sf-hwc.html?authuser=0&hl=de">SurfaceFlinger and Hardware Composer</a></p><p>Below is the flowchart corresponding to this process. Simply put, <code>SurfaceFlinger</code>‘s primary function is: <strong>it accepts data buffers from multiple sources, composites them, and sends them to the display device.</strong></p><p><img src="/en/images/15816781462135.jpg"></p><p>In Systrace, we focus on the parts corresponding to this diagram:</p><ol><li><strong>App Section</strong></li><li><strong>BufferQueue Section</strong></li><li><strong>SurfaceFlinger Section</strong></li><li><strong>HWComposer Section</strong></li></ol><p>These four parts appear in Systrace in chronological order: 1, 2, 3, then 4. Let’s examine the rendering flow from these four perspectives.</p><p><a id="app"></a></p><h2 id="App-Section"><a href="#App-Section" class="headerlink" title="App Section"></a>App Section</h2><p>The App section is detailed in <a href="https://www.androidperformance.com/en/2019/11/06/Android-Systrace-MainThread-And-RenderThread/">Systrace Basics - MainThread and RenderThread Explained</a>. The primary flow is shown below:</p><p><img src="/en/images/15818258189902.jpg"></p><p>From <code>SurfaceFlinger</code>‘s perspective, the App section is responsible for producing the Surfaces needed for composition.</p><p>The interaction between an App and <code>SurfaceFlinger</code> centers on three points:</p><ol><li>Vsync signal reception and processing.</li><li><code>RenderThread</code>‘s <code>dequeueBuffer</code>.</li><li><code>RenderThread</code>‘s <code>queueBuffer</code>.</li></ol><h3 id="Vsync-Signal-Reception-and-Processing"><a href="#Vsync-Signal-Reception-and-Processing" class="headerlink" title="Vsync Signal Reception and Processing"></a>Vsync Signal Reception and Processing</h3><p>This is covered in <a href="https://www.androidperformance.com/en/2019/10/22/Android-Choreographer/">Android Based on Choreographer Rendering Mechanism Explained</a>. The first item in the diagram marks the <code>Vsync-App</code> signal arriving from <code>SurfaceFlinger</code>. Upon receiving this, the app begins preparing its frame.</p><p><img src="/en/images/15822547481351.jpg"></p><h3 id="RenderThread’s-dequeueBuffer"><a href="#RenderThread’s-dequeueBuffer" class="headerlink" title="RenderThread’s dequeueBuffer"></a>RenderThread’s dequeueBuffer</h3><p><code>dequeueBuffer</code> means requesting a buffer from the <code>BufferQueue</code> within <code>SurfaceFlinger</code>. Before rendering begins, the app makes a Binder call to obtain a buffer:</p><p><strong>App-side Systrace:</strong><br><img src="/en/images/15822556410563.jpg" alt="-w1249"></p><p><strong>SurfaceFlinger-side Systrace:</strong><br><img src="/en/images/15822558376614.jpg" alt="-w826"></p><h3 id="RenderThread’s-queueBuffer"><a href="#RenderThread’s-queueBuffer" class="headerlink" title="RenderThread’s queueBuffer"></a>RenderThread’s queueBuffer</h3><p><code>queueBuffer</code> puts the buffer back into the <code>BufferQueue</code> after the app finishes processing (writing drawcalls). This follows the <code>eglSwapBuffersWithDamageKHR -&gt; queueBuffer</code> flow:</p><p><strong>App-side Systrace:</strong><br><img src="/en/images/15822960954718.jpg" alt="-w1165"></p><p><strong>SurfaceFlinger-side Systrace:</strong><br><img src="/en/images/15822964913781.jpg" alt="-w1295"></p><p>Through these three parts, you should have a clear understanding of the flow depicted below:<br><img src="/en/images/15822965692055.jpg" alt="-w410"></p><p><a id="bq"></a></p><h2 id="BufferQueue-Section"><a href="#BufferQueue-Section" class="headerlink" title="BufferQueue Section"></a>BufferQueue Section</h2><p><code>BufferQueue</code> is discussed in <a href="https://www.androidperformance.com/en/2019/12/15/Android-Systrace-Triple-Buffer/#BufferQueue">Systrace Basics - Triple Buffer Explained</a>. Each process with a display interface has a corresponding <code>BufferQueue</code>. The consumer creates and owns the data structure, which can exist in a different process from the producer. The flow is:</p><p><img src="/en/images/15823652509728.jpg"></p><p>In this example, the App is the <strong>producer</strong> (filling buffers), and <code>SurfaceFlinger</code> is the <strong>consumer</strong> (compositing buffers).</p><ol><li><strong>dequeue</strong> (initiated by producer): When the producer needs a buffer, it calls <code>dequeueBuffer()</code>, specifying width, height, pixel format, and flags.</li><li><strong>queue</strong> (initiated by producer): After filling the buffer, the producer calls <code>queueBuffer()</code> to return it to the queue.</li><li><strong>acquire</strong> (initiated by consumer): The consumer calls <code>acquireBuffer()</code> to take the buffer and use its content.</li><li><strong>release</strong> (initiated by consumer): Once finished, the consumer calls <code>releaseBuffer()</code> to return the buffer to the queue.</li></ol><p><a id="sf"></a></p><h2 id="SurfaceFlinger-Section"><a href="#SurfaceFlinger-Section" class="headerlink" title="SurfaceFlinger Section"></a>SurfaceFlinger Section</h2><h3 id="Workflow"><a href="#Workflow" class="headerlink" title="Workflow"></a>Workflow</h3><p>As mentioned, <code>SurfaceFlinger</code>‘s main job is composition:</p><blockquote><p>When a VSYNC signal arrives, <code>SurfaceFlinger</code> traverses its layer list searching for new buffers. If found, it acquires them; otherwise, it continues using previously acquired buffers… It then asks the Hardware Composer how to perform composition.</p></blockquote><p>In Systrace, the main thread starts working upon receiving the Vsync signal:<br><img src="/en/images/15822972813466.jpg" alt="-w1296"></p><p>The corresponding code handles two main messages:</p><ol><li><code>MessageQueue::INVALIDATE</code> — executes <code>handleMessageTransaction</code> and <code>handleMessageInvalidate</code>.</li><li><code>MessageQueue::REFRESH</code> — executes <code>handleMessageRefresh</code>.</li></ol><p><code>frameworks/native/services/surfaceflinger/SurfaceFlinger.cpp</code></p><figure class="highlight cpp"><table><tr><td class="gutter"><pre><span class="line">1</span><br><span class="line">2</span><br><span class="line">3</span><br><span class="line">4</span><br><span class="line">5</span><br><span class="line">6</span><br><span class="line">7</span><br><span class="line">8</span><br><span class="line">9</span><br><span class="line">10</span><br><span class="line">11</span><br><span class="line">12</span><br><span class="line">13</span><br><span class="line">14</span><br><span class="line">15</span><br><span class="line">16</span><br><span class="line">17</span><br><span class="line">18</span><br><span class="line">19</span><br><span class="line">20</span><br><span class="line">21</span><br><span class="line">22</span><br><span class="line">23</span><br><span class="line">24</span><br><span class="line">25</span><br><span class="line">26</span><br><span class="line">27</span><br><span class="line">28</span><br><span class="line">29</span><br><span class="line">30</span><br><span class="line">31</span><br><span class="line">32</span><br><span class="line">33</span><br><span class="line">34</span><br><span class="line">35</span><br><span class="line">36</span><br><span class="line">37</span><br><span class="line">38</span><br><span class="line">39</span><br><span class="line">40</span><br><span class="line">41</span><br><span class="line">42</span><br><span class="line">43</span><br><span class="line">44</span><br><span class="line">45</span><br><span class="line">46</span><br><span class="line">47</span><br><span class="line">48</span><br><span class="line">49</span><br><span class="line">50</span><br><span class="line">51</span><br><span class="line">52</span><br><span class="line">53</span><br><span class="line">54</span><br><span class="line">55</span><br><span class="line">56</span><br><span class="line">57</span><br><span class="line">58</span><br><span class="line">59</span><br><span class="line">60</span><br><span class="line">61</span><br><span class="line">62</span><br><span class="line">63</span><br><span class="line">64</span><br><span class="line">65</span><br><span class="line">66</span><br><span class="line">67</span><br><span class="line">68</span><br><span class="line">69</span><br><span class="line">70</span><br><span class="line">71</span><br><span class="line">72</span><br><span class="line">73</span><br><span class="line">74</span><br><span class="line">75</span><br></pre></td><td class="code"><pre><span class="line"><span class="function"><span class="type">void</span> <span class="title">SurfaceFlinger::onMessageReceived</span><span class="params">(<span class="type">int32_t</span> what)</span> NO_THREAD_SAFETY_ANALYSIS </span>&#123;</span><br><span class="line">    <span class="built_in">ATRACE_CALL</span>();</span><br><span class="line">    <span class="keyword">switch</span> (what) &#123;</span><br><span class="line">        <span class="keyword">case</span> MessageQueue::INVALIDATE: &#123;</span><br><span class="line">            ......</span><br><span class="line">            <span class="type">bool</span> refreshNeeded = <span class="built_in">handleMessageTransaction</span>();</span><br><span class="line">            refreshNeeded |= <span class="built_in">handleMessageInvalidate</span>();</span><br><span class="line">            ......</span><br><span class="line">            <span class="keyword">break</span>;</span><br><span class="line">        &#125;</span><br><span class="line">        <span class="keyword">case</span> MessageQueue::REFRESH: &#123;</span><br><span class="line">            <span class="built_in">handleMessageRefresh</span>();</span><br><span class="line">            <span class="keyword">break</span>;</span><br><span class="line">        &#125;</span><br><span class="line">    &#125;</span><br><span class="line">&#125;</span><br><span class="line"></span><br><span class="line"><span class="comment">// handleMessageInvalidate implementation:</span></span><br><span class="line"><span class="function"><span class="type">bool</span> <span class="title">SurfaceFlinger::handleMessageInvalidate</span><span class="params">()</span> </span>&#123;</span><br><span class="line">    <span class="built_in">ATRACE_CALL</span>();</span><br><span class="line">    <span class="type">bool</span> refreshNeeded = <span class="built_in">handlePageFlip</span>();</span><br><span class="line"></span><br><span class="line">    <span class="keyword">if</span> (mVisibleRegionsDirty) &#123;</span><br><span class="line">        <span class="built_in">computeLayerBounds</span>();</span><br><span class="line">        <span class="keyword">if</span> (mTracingEnabled) &#123;</span><br><span class="line">            mTracing.<span class="built_in">notify</span>(<span class="string">&quot;visibleRegionsDirty&quot;</span>);</span><br><span class="line">        &#125;</span><br><span class="line">    &#125;</span><br><span class="line"></span><br><span class="line">    <span class="keyword">for</span> (<span class="keyword">auto</span>&amp; layer : mLayersPendingRefresh) &#123;</span><br><span class="line">        Region visibleReg;</span><br><span class="line">        visibleReg.<span class="built_in">set</span>(layer-&gt;<span class="built_in">getScreenBounds</span>());</span><br><span class="line">        <span class="built_in">invalidateLayerStack</span>(layer, visibleReg);</span><br><span class="line">    &#125;</span><br><span class="line">    mLayersPendingRefresh.<span class="built_in">clear</span>();</span><br><span class="line">    <span class="keyword">return</span> refreshNeeded;</span><br><span class="line">&#125;</span><br><span class="line"></span><br><span class="line"><span class="comment">// handleMessageRefresh implementation; most SF work starts here:</span></span><br><span class="line"><span class="function"><span class="type">void</span> <span class="title">SurfaceFlinger::handleMessageRefresh</span><span class="params">()</span> </span>&#123;</span><br><span class="line">    <span class="built_in">ATRACE_CALL</span>();</span><br><span class="line"></span><br><span class="line">    mRefreshPending = <span class="literal">false</span>;</span><br><span class="line"></span><br><span class="line">    <span class="type">const</span> <span class="type">bool</span> repaintEverything = mRepaintEverything.<span class="built_in">exchange</span>(<span class="literal">false</span>);</span><br><span class="line">    <span class="built_in">preComposition</span>();</span><br><span class="line">    <span class="built_in">rebuildLayerStacks</span>();</span><br><span class="line">    <span class="built_in">calculateWorkingSet</span>();</span><br><span class="line">    <span class="keyword">for</span> (<span class="type">const</span> <span class="keyword">auto</span>&amp; [token, display] : mDisplays) &#123;</span><br><span class="line">        <span class="built_in">beginFrame</span>(display);</span><br><span class="line">        <span class="built_in">prepareFrame</span>(display);</span><br><span class="line">        <span class="built_in">doDebugFlashRegions</span>(display, repaintEverything);</span><br><span class="line">        <span class="built_in">doComposition</span>(display, repaintEverything);</span><br><span class="line">    &#125;</span><br><span class="line"></span><br><span class="line">    <span class="built_in">logLayerStats</span>();</span><br><span class="line"></span><br><span class="line">    <span class="built_in">postFrame</span>();</span><br><span class="line">    <span class="built_in">postComposition</span>();</span><br><span class="line"></span><br><span class="line">    mHadClientComposition = <span class="literal">false</span>;</span><br><span class="line">    mHadDeviceComposition = <span class="literal">false</span>;</span><br><span class="line">    <span class="keyword">for</span> (<span class="type">const</span> <span class="keyword">auto</span>&amp; [token, displayDevice] : mDisplays) &#123;</span><br><span class="line">        <span class="keyword">auto</span> display = displayDevice-&gt;<span class="built_in">getCompositionDisplay</span>();</span><br><span class="line">        <span class="type">const</span> <span class="keyword">auto</span> displayId = display-&gt;<span class="built_in">getId</span>();</span><br><span class="line">        mHadClientComposition =</span><br><span class="line">                mHadClientComposition || <span class="built_in">getHwComposer</span>().<span class="built_in">hasClientComposition</span>(displayId);</span><br><span class="line">        mHadDeviceComposition =</span><br><span class="line">                mHadDeviceComposition || <span class="built_in">getHwComposer</span>().<span class="built_in">hasDeviceComposition</span>(displayId);</span><br><span class="line">    &#125;</span><br><span class="line"></span><br><span class="line">    mVsyncModulator.<span class="built_in">onRefreshed</span>(mHadClientComposition);</span><br><span class="line"></span><br><span class="line">    mLayersWithQueuedFrames.<span class="built_in">clear</span>();</span><br><span class="line">&#125;</span><br></pre></td></tr></table></figure><p>Major functional categories in <code>handleMessageRefresh</code>:</p><ol><li><strong>Preparation</strong><ol><li><code>preComposition()</code></li><li><code>rebuildLayerStacks()</code></li><li><code>calculateWorkingSet()</code></li></ol></li><li><strong>Composition</strong><ol><li><code>beginFrame(display)</code></li><li><code>prepareFrame(display)</code></li><li><code>doDebugFlashRegions(display, repaintEverything)</code></li><li><code>doComposition(display, repaintEverything)</code></li></ol></li><li><strong>Cleanup</strong><ol><li><code>logLayerStats()</code></li><li><code>postFrame()</code></li><li><code>postComposition()</code></li></ol></li></ol><p>Given the display system’s complexity, we won’t cover every detail. If your work involves this area, familiarize yourself with all flows; otherwise, understanding the high-level logic is enough.</p><h3 id="Dropped-Frames-Jank"><a href="#Dropped-Frames-Jank" class="headerlink" title="Dropped Frames (Jank)"></a>Dropped Frames (Jank)</h3><p>To determine if an app is dropping frames in Systrace, look at <code>SurfaceFlinger</code>:</p><ol><li>Does the <code>SurfaceFlinger</code> main thread skip composition at each <code>Vsync-SF</code>?</li><li>If it skips, find the reason:<ol><li>No available buffers?</li><li>Occuppied by other tasks (screenshot, HWC, etc.)?</li><li>Waiting for <code>presentFence</code>?</li><li>Waiting for GPU fence?</li></ol></li><li>If composition occurs, check if <strong>your app’s</strong> available buffer count is normal. If it’s 0, investigate why the app didn’t <code>queueBuffer</code> in time (likely an app-side issue), as the composition might have been triggered by other processes having available buffers.</li></ol><p>For more details on reading this in Systrace, see <a href="https://www.androidperformance.com/en/2019/12/15/Android-Systrace-Triple-Buffer/#%E9%80%BB%E8%BE%91%E6%8E%89%E5%B8%A7">Systrace Basics - Triple Buffer Explained - Jank Detection</a>.</p><p><a id="hwc"></a></p><h2 id="HWComposer-Section"><a href="#HWComposer-Section" class="headerlink" title="HWComposer Section"></a>HWComposer Section</h2><p>Refer to the <a href="https://source.android.google.cn/devices/graphics/arch-sf-hwc.html?authuser=0&hl=de">official introduction</a> for Hardware Composer HAL (HWC):</p><ol><li>HWC determines the most efficient way to composite buffers using available hardware. As a HAL, its implementation is device-specific and typically provided by the display hardware OEM.</li><li>Overlay planes composite multiple buffers in hardware rather than the GPU. For example, a portrait phone screen with a status bar, navigation bar, and app content can use:<ol><li>Render app content to a temporary buffer, then render the status and navigation bars on top, then send that buffer to display hardware.</li><li>Send all three buffers to display hardware and instruct it to read different screen parts from different buffers. This is significantly more efficient.</li></ol></li><li>Display processor capabilities vary. HWC performs these calculations to achieve optimal performance:<ol><li><code>SurfaceFlinger</code> provides a layer list and asks, “How do you want to handle these?”</li><li>HWC marks each layer as either an overlay or GLES composition.</li><li><code>SurfaceFlinger</code> handles GLES composition, sends the output buffer to HWC, and lets HWC handle the rest.</li></ol></li><li>When screen content doesn’t change, overlays can be less efficient than GL composition, especially with transparent pixels. HWC may opt for GLES composition in such cases to save battery during idle.</li><li>Android 4.4+ devices typically support 4 overlay planes. Exceeding this triggers GLES composition for some layers, significantly affecting energy and performance.</li></ol><p>— Cited from <a href="https://source.android.google.cn/devices/graphics/arch-sf-hwc.html?authuser=0&hl=de">SurfaceFlinger and Hardware Composer</a></p><p>Continuing with the <code>SurfaceFlinger</code> main thread, here is the communication with HWC (step 3 above):<br><img src="/en/images/15823673746926.jpg" alt="-w1149"></p><p>This corresponds to the latter part of the earlier diagram:<br><img src="/en/images/15823674500263.jpg" alt="-w563"></p><p>Details are extensive. HWC’s performance critical; issues like insufficient performance or slow interrupts can cause jank, as noted in <a href="https://www.androidperformance.com/en/2019/09/05/Android-Jank-Due-To-System/#3-WHC-Service-%E6%89%A7%E8%A1%8C%E8%80%97%E6%97%B6">Overview of Jank Causes in Android - System Side</a>.</p><p>For more HWC knowledge, see <a href="https://www.jianshu.com/p/824a9ddf68b9">Android P Display System (1): Hardware Composition HWC2</a> and the related series.</p><p><a id="refs"></a></p><h1 id="References"><a href="#References" class="headerlink" title="References"></a>References</h1><ol><li><a href="https://www.jianshu.com/p/824a9ddf68b9">Android P Display System (1): Hardware Composition HWC2</a></li><li><a href="https://www.jianshu.com/nb/28304383">Android P Graphics Display System</a></li><li><a href="https://source.android.google.cn/devices/graphics/arch-sf-hwc.html?authuser=0&hl=de">Definition of SurfaceFlinger</a></li><li><a href="https://github.com/openthos/display-analysis/blob/master/repo/android%E5%90%AF%E5%8A%A8%E5%9B%BE%E5%BD%A2%E7%95%8C%E9%9D%A2%E7%9B%B8%E5%85%B3log%E6%8A%A5%E5%91%8A/surface%E5%88%86%E6%9E%90%E6%96%87%E6%A1%A3.md">SurfaceFlinger Analysis Document</a></li></ol><p><a id="about"></a></p><h1 id="About-Me-amp-amp-Blog"><a href="#About-Me-amp-amp-Blog" class="headerlink" title="About Me &amp;&amp; Blog"></a>About Me &amp;&amp; Blog</h1><p>Below is my personal intro and related links. I look forward to exchanging ideas with fellow professionals. “When three walk together, one can always be my teacher!”</p><ol><li><a href="https://www.androidperformance.com/en/about/">Blogger Intro</a>: Includes personal WeChat and WeChat group links.</li><li><a href="https://www.androidperformance.com/en/2019/12/01/BlogMap/">Blog Content Navigation</a>: A guide for my blog content.</li><li><a href="https://www.androidperformance.com/en/2018/05/07/Android-performance-optimization-skills-and-tools/">Curated Excellent Blog Articles - Android Performance Optimization Must-Knows</a>: Welcome to recommend projects&#x2F;articles.</li><li><a href="https://www.androidperformance.com/en/2023/12/30/the-performance/">Android Performance Optimization Knowledge Planet</a>: Welcome to join and thank you for your support~</li></ol><blockquote><p><strong>One walks faster alone, but a group walks further together.</strong></p></blockquote><p><img src="/en/images/WechatIMG581.webp" alt="Scan WeChat QR Code"></p>]]></content>
    
    
    <summary type="html">&lt;p&gt;This is the fifth article in the Systrace series, primarily providing a brief introduction to the workflow of &lt;code&gt;SurfaceFlinger&lt;/code&gt;. It covers several important threads within &lt;code&gt;SurfaceFlinger&lt;/code&gt;, including Vsync signal interpretation, app buffer display, and jank detection. Since Vsync has already been covered in &lt;a href=&quot;https://www.androidperformance.com/en/2019/12/01/Android-Systrace-Vsync/&quot;&gt;Systrace Basics - Vsync Explained&lt;/a&gt; and &lt;a href=&quot;https://www.androidperformance.com/en/2019/10/22/Android-Choreographer/&quot;&gt;Detailed Explanation of Android Rendering Mechanism Based on Choreographer&lt;/a&gt;, it won’t be discussed in detail here.&lt;/p&gt;
&lt;p&gt;The purpose of this series is to view the overall operation of the Android system from a different perspective using Systrace, while also providing an alternative angle for learning the Framework. Perhaps you’ve read many articles about the Framework but can never remember the code, or you’re unclear about the execution flow. Maybe from Systrace’s graphical perspective, you can gain a deeper understanding.&lt;/p&gt;</summary>


    <category term="Android" scheme="https://androidperformance.com/en/categories/Android/"/>
    
    
    <category term="Android" scheme="https://androidperformance.com/en/tags/Android/"/>
    
    <category term="Systrace" scheme="https://androidperformance.com/en/tags/Systrace/"/>
    
    <category term="Startup" scheme="https://androidperformance.com/en/tags/Startup/"/>
    
    <category term="Jank" scheme="https://androidperformance.com/en/tags/Jank/"/>
    
    <category term="Performance" scheme="https://androidperformance.com/en/tags/Performance/"/>
    
  </entry>
  
  <entry>
    <title>Android Developer Learning Path (2020 Edition)</title>
    <link href="https://androidperformance.com/en/2020/02/03/android-development-learning-path-2020-edition/"/>
    <id>https://androidperformance.com/en/2020/02/03/android-development-learning-path-2020-edition/</id>
    <published>2020-02-02T16:06:25.000Z</published>
    <updated>2026-05-10T23:29:51.064Z</updated>
    
    <content type="html"><![CDATA[<p>On Medium, @MindOrks published a <a href="https://medium.com/mindorks/android-development-learning-path-2020-edition-3f464ac56dbf">2020 Android Developer Learning Path</a>. Given that some readers may have difficulty accessing the original content, I am sharing it here combined with my own 2020 learning plan for your reference.</p><p><strong>The original article is quite simple, mostly listing knowledge points without much explanation. I have added brief introductions for each point and included some additional topics based on my own understanding. This is for your reference only.</strong></p><p>This article is primarily for Android developers. If you are a beginner, it will help you find a learning path. If you are an experienced developer, it can help you identify gaps in your knowledge. If you have any other suggestions, feel free to leave a message.</p><span id="more"></span><p>This is a 2020 learning path. Core foundations such as Java&#x2F;Kotlin, Android components, View, Gradle, and storage still matter, but the main path needs modern additions. For UI, learn Jetpack Compose, Material 3, adaptive layouts, and mixed View&#x2F;Compose debugging. For async and architecture, treat Coroutines&#x2F;Flow, Lifecycle, ViewModel, Room, WorkManager, Hilt, and Navigation as the default Jetpack stack. For builds, learn Android Gradle Plugin, R8, modularization, and Baseline Profiles&#x2F;Startup Profiles. For performance, move from the Systrace&#x2F;MAT era to Perfetto, Android Studio Profiler, Layout Inspector, Macrobenchmark, JankStats, and Android Vitals. For release quality, add privacy and permission changes, targetSdk behavior changes, Play Console vitals, ANR&#x2F;crash governance, and multi-device adaptation.</p><h1 id="Programming"><a href="#Programming" class="headerlink" title="Programming"></a>Programming</h1><h2 id="Java"><a href="#Java" class="headerlink" title="Java"></a>Java</h2><p>Java is the default language for Android App development and the Android Framework. Mastering Java is a mandatory skill for Android developers.</p><p>For those who want to dive deeper into the Java Virtual Machine, I recommend:</p><ol><li>Zhou Zhiming’s <a href="https://book.douban.com/subject/34907497/">“Understanding the Java Virtual Machine (3rd Edition)”</a></li><li>Deng Fanheng’s <a href="https://book.douban.com/subject/33390277/">“Understanding Android Java VM: ART”</a></li></ol><h2 id="Kotlin"><a href="#Kotlin" class="headerlink" title="Kotlin"></a>Kotlin</h2><p>Google shifted to a “Kotlin First” strategy several years ago. Most official documentation and demos now use Kotlin by default. Its importance is self-evident.</p><p>Google also provides a <a href="https://codelabs.developers.google.com/codelabs/java-to-kotlin">“Refactoring to Kotlin”</a> tutorial:</p><blockquote><p>This codelab is for any developer who uses Java and is considering migrating their project to Kotlin. We will start with several Java classes and guide you through converting them to Kotlin using the IDE. Then, we look at the converted code and research how to improve it, make it more idiomatic, and avoid common pitfalls.</p></blockquote><h2 id="Flutter"><a href="#Flutter" class="headerlink" title="Flutter"></a>Flutter</h2><p>As Google’s “favorite son,” Flutter receives significant official support. Flutter recently released <a href="https://github.com/flutter/flutter/releases/tag/v1.12.13%2Bhotfix.7">v1.12.13_hotfix.7</a>, which fixed several critical bugs. As mentioned in <a href="https://juejin.im/post/5e369be9f265da3e272912dc">Flutter 1.12 latest hotfix and 2020 Roadmap</a>: “The v1.12.13+hotfix.7 release mainly resolves three major issues: reportFullyDrawn exception, crashes on Huawei phones, and cursor&#x2F;keyboard input anomalies.” You can also check out their <a href="https://github.com/flutter/flutter/wiki/Roadmap">2020 Roadmap</a> released on January 30th.</p><p>For the development of Flutter, you can refer to Gityuan’s <a href="http://gityuan.com/flutter/">Flutter Cross-Platform Evolution and Architecture</a>. Currently, several Bytedance apps have integrated Flutter for hybrid development. Personally, I believe it’s no longer a time to wait and see on Flutter in 2020; readers can decide whether to start learning based on their own technical plans.</p><h1 id="Android-Studio"><a href="#Android-Studio" class="headerlink" title="Android Studio"></a>Android Studio</h1><h2 id="Android-Studio-IDE-Overview"><a href="#Android-Studio-IDE-Overview" class="headerlink" title="Android Studio IDE Overview"></a>Android Studio IDE Overview</h2><p>As the default Android development tool, recent updates have resolved many performance issues. While hardware requirements remain high, it is a very powerful tool once you get used to it.</p><p>Key areas to master:</p><ol><li>AS Shortcuts</li><li>AS Plugins</li><li>AS Profiler (Memory, CPU, IO, Network)</li></ol><h2 id="Project-Structure-—-Java-x2F-Kotlin-x2F-Flutter-XML-gradle-files"><a href="#Project-Structure-—-Java-x2F-Kotlin-x2F-Flutter-XML-gradle-files" class="headerlink" title="Project Structure — Java&#x2F;Kotlin&#x2F;Flutter, XML, .gradle files"></a>Project Structure — Java&#x2F;Kotlin&#x2F;Flutter, XML, .gradle files</h2><p>Familiarize yourself with project directory structures, resource files, and Gradle files.</p><h1 id="Android-Basics"><a href="#Android-Basics" class="headerlink" title="Android Basics"></a>Android Basics</h1><h2 id="Core-Components"><a href="#Core-Components" class="headerlink" title="Core Components"></a>Core Components</h2><p>These are the foundations of Android development:</p><ol><li>Activity — Activity Lifecycle, Tasks &amp; Back Stack</li><li>Service</li><li>Broadcast Receiver</li><li>Content Provider</li></ol><h2 id="Intents"><a href="#Intents" class="headerlink" title="Intents"></a>Intents</h2><ol><li>Types of Intent - Implicit, Explicit</li><li>Intent Filter</li></ol><h2 id="Static-User-Interface"><a href="#Static-User-Interface" class="headerlink" title="Static User Interface"></a>Static User Interface</h2><ol><li>View — Button, ImageView, TextView, EditText, etc.: Common components used to build complex layouts.</li><li>ViewGroup - LinearLayout, RelativeLayout, FrameLayout: The three traditional layouts.</li><li>ConstraintLayout: Google’s recommended layout, which has largely replaced RelativeLayout as the default for apps. Refer to the <a href="https://developer.android.com/reference/androidx/constraintlayout/widget/ConstraintLayout">Official Documentation</a>.</li></ol><h2 id="Dynamic-User-Interface"><a href="#Dynamic-User-Interface" class="headerlink" title="Dynamic User Interface"></a>Dynamic User Interface</h2><ol><li>RecyclerView - The preferred widget for lists, offering better performance and more features than ListView.</li><li>ViewPager</li><li>Spinner</li></ol><h2 id="CustomView"><a href="#CustomView" class="headerlink" title="CustomView"></a>CustomView</h2><p>When default layouts don’t meet design requirements, you need to customize Views. Master the following:</p><ol><li>Canvas</li><li>Bitmap</li><li>Paint</li></ol><h2 id="UI-Resources"><a href="#UI-Resources" class="headerlink" title="UI Resources"></a>UI Resources</h2><p>Using resource files instead of hardcoding improves maintainability.</p><ol><li>Drawables</li><li>Strings</li><li>Styles</li></ol><h2 id="Fragments"><a href="#Fragments" class="headerlink" title="Fragments"></a>Fragments</h2><p>Many advocate for a Single Activity + Multiple Fragments architecture. Managing Fragments is an art in itself, and you’ll encounter various “gotchas” in practice.</p><ol><li>Fragment Lifecycle</li><li>Fragment Manager</li></ol><h2 id="Support-User-Interface"><a href="#Support-User-Interface" class="headerlink" title="Support User Interface"></a>Support User Interface</h2><p>Common functional components:</p><ol><li>ProgressBar</li><li>Dialogs</li><li>Toast &amp; Snackbar</li></ol><h2 id="Storage"><a href="#Storage" class="headerlink" title="Storage"></a>Storage</h2><p>App development inevitably involves file handling.</p><ol><li>Shared Preferences - Best for key-value pairs.</li><li>File Systems - File-based storage.</li><li>Database — RoomDB - Google’s recommended database solution (part of AndroidX). Refer to the <a href="https://developer.android.com/training/data-storage/room">Official Documentation</a>.</li></ol><h2 id="Build"><a href="#Build" class="headerlink" title="Build"></a>Build</h2><p>Android apps use Gradle by default. Familiarize yourself with Gradle, build configurations (Debug&#x2F;Release), multi-channel packaging, and bytecode manipulation tools like ASM.</p><ol><li>Gradle</li><li>Debug &#x2F; Release Configuration</li><li>Multi-channel Packaging</li><li>ASM</li></ol><h2 id="Threading"><a href="#Threading" class="headerlink" title="Threading"></a>Threading</h2><p>Understanding Threading is crucial. Efficiently switching between the main thread and worker threads is key.</p><ol><li>Threads</li><li>Handler &#x2F; Looper &#x2F; Message &#x2F; MessageQueue</li><li>AIDL &#x2F; Binder (for inter-process communication)</li></ol><h1 id="Debugging"><a href="#Debugging" class="headerlink" title="Debugging"></a>Debugging</h1><p>Essential debugging tools and techniques:</p><ol><li>Memory profiling - MAT, AS Memory Profiler</li><li>Logging - Logs provide rich information to reconstruct issues.</li><li>Systrace - A tool to view the running state of system processes. Refer to my <a href="https://www.androidperformance.com/en/2019/05/28/Android-Systrace-About/">Systrace Series</a>.</li><li>Exceptions - Handling various exceptions to ensure robustness.</li><li>Error Handling - Resolving Errors that cause app crashes.</li></ol><h1 id="Memory-Leak"><a href="#Memory-Leak" class="headerlink" title="Memory Leak"></a>Memory Leak</h1><p>A major topic involving both Java and Native memory leaks. Java leaks are generally easier to detect and fix with tools like LeakCanary or Matrix, while Native leaks can be more challenging.</p><ol><li>Detecting and Fixing Memory Leaks</li><li>Context - Improper use of Context is a common cause of leaks.</li><li>Native Memory Leaks</li></ol><h1 id="3rd-Party-Libraries"><a href="#3rd-Party-Libraries" class="headerlink" title="3rd Party Libraries"></a>3rd Party Libraries</h1><p>Classic libraries that significantly save development time:</p><ol><li>Image Loading - Glide, Picasso</li><li>Dependency Injection - Dagger</li><li>Networking - Retrofit, OkHttp</li><li>MultiThreading - RxJava, Coroutines</li></ol><h1 id="Data-Formats"><a href="#Data-Formats" class="headerlink" title="Data Formats"></a>Data Formats</h1><p>Common data serialization formats:</p><ol><li>JSON — GSON, Moshi</li><li>FlatBuffers</li><li>Protocol Buffers (Protobuf)</li></ol><h1 id="Android-Jetpack"><a href="#Android-Jetpack" class="headerlink" title="Android Jetpack"></a>Android Jetpack</h1><p><a href="https://developer.android.com/jetpack">Jetpack</a> is a suite of libraries, tools, and guidance to help developers write high-quality apps more easily.</p><ol><li>Foundation Components — AppCompat, Android KTX, Multidex</li><li>Architecture Components — LiveData, ViewModel, DataBinding, Paging, WorkManager, Navigation</li><li>Behavior Components - DownloadManager, MediaPlayback, Notifications, Permissions, Preferences, Sharing, Slices</li><li>UI Components - Animation &amp; Transition, Emoji, Palette</li></ol><h1 id="Architecture"><a href="#Architecture" class="headerlink" title="Architecture"></a>Architecture</h1><p>Understand the common architectural patterns and choose what fits your project:</p><ol><li>MVVM - Model-View-ViewModel, separates UI state and logic.</li><li>MVI - Model-View-Intent.</li><li>MVP - Model-View-Presenter, where the Presenter handles logic and the Model provides data.</li></ol><h1 id="Testing"><a href="#Testing" class="headerlink" title="Testing"></a>Testing</h1><ol><li>Local Unit Testing</li><li>Instrumentation Testing</li></ol><h1 id="Firebase"><a href="#Firebase" class="headerlink" title="Firebase"></a>Firebase</h1><p>Useful for global apps:</p><ol><li>FCM (Firebase Cloud Messaging)</li><li>Crashlytics</li><li>Analytics</li><li>Remote Config</li><li>App Indexing</li><li>Dynamic Links</li></ol><h1 id="Security"><a href="#Security" class="headerlink" title="Security"></a>Security</h1><p>Security is paramount, especially regarding user data.</p><ol><li>Encryption &#x2F; Decryption</li><li>Proguard</li><li>R8</li></ol><h1 id="App-Release"><a href="#App-Release" class="headerlink" title="App Release"></a>App Release</h1><ol><li>.keystore files</li><li>App Bundle</li><li>Play Store</li><li>Multi-channel Packaging</li><li>Pluginization</li></ol><h1 id="Keep-Learning-and-Improving"><a href="#Keep-Learning-and-Improving" class="headerlink" title="Keep Learning and Improving"></a>Keep Learning and Improving</h1><p>As an aspiring Android developer, having your own technical stack and roadmap is vital for competitiveness. Set clear goals for 2020. <strong>Keep Learning and Improving!</strong></p><p>If you are looking for better time management, I recommend this video on <a href="https://www.bilibili.com/video/av79348217">How I Make Weekly Plans | Productivity | My Method</a>.</p><blockquote><p>“Plan ahead, or fail.” Annual plans are too long, and daily plans are too short. Managing time by the week is often the most practical way to maintain consistency over the long term.</p></blockquote><h1 id="Other-Links"><a href="#Other-Links" class="headerlink" title="Other Links"></a>Other Links</h1><p>For further discussion, you can also find this article on:<br><a href="https://zhuanlan.zhihu.com/p/104878641">Zhihu - Android Developer Learning Path (2020 Edition)</a></p><h1 id="About-Me-amp-amp-Blog"><a href="#About-Me-amp-amp-Blog" class="headerlink" title="About Me &amp;&amp; Blog"></a>About Me &amp;&amp; Blog</h1><p>Below is my personal introduction and related links. I look forward to exchanging ideas with fellow professionals. “When three walk together, one can always be my teacher!”</p><ol><li><a href="https://www.androidperformance.com/en/about/">Blogger Intro</a>: Includes personal WeChat and WeChat group links.</li><li><a href="https://www.androidperformance.com/en/2019/12/01/BlogMap/">Blog Content Navigation</a>: A guide for my blog content.</li><li><a href="https://www.androidperformance.com/en/2018/05/07/Android-performance-optimization-skills-and-tools/">Curated Excellent Blog Articles - Android Performance Optimization Must-Knows</a>: Welcome to recommend projects&#x2F;articles.</li><li><a href="https://www.androidperformance.com/en/2023/12/30/the-performance/">Android Performance Optimization Knowledge Planet</a>: Welcome to join and thank you for your support~</li></ol><blockquote><p><strong>One walks faster alone, but a group walks further together.</strong></p></blockquote><p><img src="/en/images/WechatIMG581.webp" alt="Scan WeChat QR Code"></p>]]></content>
    
    
    <summary type="html">&lt;p&gt;On Medium, @MindOrks published a &lt;a href=&quot;https://medium.com/mindorks/android-development-learning-path-2020-edition-3f464ac56dbf&quot;&gt;2020 Android Developer Learning Path&lt;/a&gt;. Given that some readers may have difficulty accessing the original content, I am sharing it here combined with my own 2020 learning plan for your reference.&lt;/p&gt;
&lt;p&gt;&lt;strong&gt;The original article is quite simple, mostly listing knowledge points without much explanation. I have added brief introductions for each point and included some additional topics based on my own understanding. This is for your reference only.&lt;/strong&gt;&lt;/p&gt;
&lt;p&gt;This article is primarily for Android developers. If you are a beginner, it will help you find a learning path. If you are an experienced developer, it can help you identify gaps in your knowledge. If you have any other suggestions, feel free to leave a message.&lt;/p&gt;</summary>


    <category term="Java" scheme="https://androidperformance.com/en/categories/Java/"/>
    
    
    <category term="Android" scheme="https://androidperformance.com/en/tags/Android/"/>
    
    <category term="Memory" scheme="https://androidperformance.com/en/tags/Memory/"/>
    
    <category term="Java" scheme="https://androidperformance.com/en/tags/Java/"/>
    
    <category term="Kotlin" scheme="https://androidperformance.com/en/tags/Kotlin/"/>
    
  </entry>
  
  <entry>
    <title>My 2020 Reading List</title>
    <link href="https://androidperformance.com/en/2020/01/28/2020-read/"/>
    <id>https://androidperformance.com/en/2020/01/28/2020-read/</id>
    <published>2020-01-28T11:06:29.000Z</published>
    <updated>2026-05-10T23:29:51.052Z</updated>
    
    <content type="html"><![CDATA[<p>Below is my 2020 reading list. Everything recorded here has been finished - technical books are not included since it’s hard to define when they’re “finished.”</p><p>I prefer reading history-related books. Among them, <strong>The Siege of Kaifeng</strong> was very uncomfortable to read - the weak have no diplomacy, it’s truly realistic; <strong>Bad Kids</strong> lives up to its name, personally I feel it’s much better than the TV series; <strong>Rework 2</strong> and <strong>Rework 3</strong> are work-related, covering remote work and work methods, consistent with the 2020 trend of working from home - recommended for white-collar programmers; <strong>My Last Diet Book</strong> systematically and professionally discusses weight loss knowledge, very useful for someone like me who’s trying to lose weight; finally, <strong>Blades of the Guardians</strong> is already a classic in Chinese comics - I’ll definitely buy a physical set for collection once it’s complete (same for Attack on Titan).</p><p>Didn’t read much in 2020. Need to invest more in this area in 2021. <strong>Read + Record + Summarize</strong> - reading notes will be added later.</p><span id="more"></span><p>Current Reading List:</p><ol><li><input checked="" disabled="" type="checkbox"> Lessons from Ming Dynasty History</li><li><input checked="" disabled="" type="checkbox"> The Siege of Kaifeng: Diplomacy, War, and People in Late Northern Song</li><li><input checked="" disabled="" type="checkbox"> Android Efficient Progress: From Data to AI</li><li><input checked="" disabled="" type="checkbox"> A Turbulent Hundred Years</li><li><input checked="" disabled="" type="checkbox"> Remote: More Simple and Efficient Remote Work</li><li><input checked="" disabled="" type="checkbox"> Shark’s Fin and Sichuan Pepper</li><li><input checked="" disabled="" type="checkbox"> Rework 2</li><li><input checked="" disabled="" type="checkbox"> Born a Crime</li><li><input checked="" disabled="" type="checkbox"> Low IQ Crime</li><li><input checked="" disabled="" type="checkbox"> Rework 3</li><li><input checked="" disabled="" type="checkbox"> The Long Night</li><li><input checked="" disabled="" type="checkbox"> Bad Kids</li><li><input checked="" disabled="" type="checkbox"> Fifteen Days Between Two Capitals</li><li><input checked="" disabled="" type="checkbox"> Permanent Record</li><li><input checked="" disabled="" type="checkbox"> My Last Diet Book</li><li><input checked="" disabled="" type="checkbox"> Blades of the Guardians</li><li><input checked="" disabled="" type="checkbox"> Journey Through the Middle East</li></ol><!-- more --><h1 id="Lessons-from-Ming-Dynasty-History"><a href="#Lessons-from-Ming-Dynasty-History" class="headerlink" title="Lessons from Ming Dynasty History"></a>Lessons from Ming Dynasty History</h1><p><img src="/en/images/15802103247651.jpg" alt="Lessons from Ming Dynasty History"></p><p>First, let me introduce the author, so readers can have some context:</p><blockquote><p>Wu Han, original name Wu Chunhan, courtesy name Chenbo. Historian and educator. From Yiwu, Zhejiang. Joined the Communist Party of China in 1957. Graduated from Tsinghua University in 1934. Later served as professor at Yunnan University, Southwest Associated University, and Tsinghua University, where he was department head and dean of the School of Liberal Arts. In 1943, he joined the China Democratic League and was actively involved in the democracy movement. After the founding of the PRC, he successively served as Deputy Mayor of Beijing, Vice Chairman of the 1st through 4th Beijing CPPCC, and member of the Philosophy and Social Sciences Division of the Chinese Academy of Sciences. Elected Vice Chairman of the Central Committee of the China Democratic League in 1958. Was a deputy to the 1st through 3rd National People’s Congress, member of the 1st National CPPCC, and standing committee member of the 2nd and 3rd National CPPCC. His life’s work was research on Chinese-Canadian ancient history, with particular achievements in Ming Dynasty history. Authored “Biography of Zhu Yuanzhang” and the historical play “Hai Rui Dismissed from Office.” After the “Cultural Revolution” began, Wu Han was brutally persecuted both mentally and physically. He was arrested and imprisoned in March 1968 and persecuted to death on October 11, 1969. His unjust case was only vindicated after the “Cultural Revolution” ended.</p></blockquote><p>This “Lessons from Ming Dynasty History” is a collection of essays covering Zhu Yuanzhang’s ruling methods, internal contradictions of the ruling class, the Eastern and Western Depots and Jinyiwei, civilian life, factional strife, peasants, slaves and mutinies, the official class, bandits, etc. If “Those Things in the Ming Dynasty” tells the stories of great figures throughout the dynasty, this book takes us from another angle to understand the various chaotic phenomena from the ruling class to the ruled class in the Ming Dynasty. Many chapters are independent yet interconnected. It can be said that the internal troubles and external threats of the late Ming period were not simply the Qing invasion and the rise of bandits - the dynasty had rotted from top to bottom, and one or two people couldn’t save it.</p><p>This book is available on WeRead, recommended.</p><h1 id="The-Siege-of-Kaifeng-Diplomacy-War-and-People-in-Late-Northern-Song"><a href="#The-Siege-of-Kaifeng-Diplomacy-War-and-People-in-Late-Northern-Song" class="headerlink" title="The Siege of Kaifeng: Diplomacy, War, and People in Late Northern Song"></a>The Siege of Kaifeng: Diplomacy, War, and People in Late Northern Song</h1><p><img src="/en/images/15802109582858.jpg" alt="The Siege of Kaifeng"></p><p>You’ve surely heard of the “Shame of Jingkang.” This book details the causes and consequences of the Jingkang Incident. Honestly, I didn’t have a detailed understanding of this period of history before reading it. After reading, I felt that calling it the “Shame of Jingkang” is absolutely right - especially how the army collapsed at first contact, the treachery in negotiations, and <strong>the repeated plundering of the capital Kaifeng during the siege that lasted most of a year</strong>. Reading it made me both angry and helpless. Without strength, you will be bullied - this eternal truth has been proven repeatedly throughout history. It only took three years from prosperity to destruction… There’s a passage in the book I really like: “<strong>It reminds us to be vigilant in peacetime. At any moment, crisis and prosperity are just one step apart. Peace is not inevitable - it requires us to view the world with humility, learning from the world’s strengths while avoiding arrogance and pride. More importantly, we must consciously avoid war. Humility is not wrong - misjudging the situation is the most terrifying thing, because all situations are interconnected. Once you take the first step, you cannot turn back, nor can you control the future direction.</strong>“</p><blockquote><p>This book traces the complete historical details of the Jingkang Incident at the end of Northern Song, narrating the peace and war among Song, Liao, and Jin, focusing on the critical moments of the great historical turning point of Northern Song, and the causes and consequences of the comprehensive eruption of crisis from within and without the empire. During the Xuanhe years of Northern Song, the empire appeared prosperous, but hidden dangers lurked beneath the prosperity. Internal crises such as fiscal difficulties, military ailments, and vicious factional strife, combined with external crises like military threats from Liao and Jin in the north, gradually put the empire in a precarious situation. To “recover” the Sixteen Prefectures of Yan and Yun as a strategic buffer, Emperor Huizong decided to ally with Jin to destroy Liao. Although the Song-Jin alliance gradually consumed Liao, Jin saw through Northern Song’s weakness, and combined with complex interest disputes between the two countries, Jin turned south to attack Song. In the first year of Jingkang (1126), Jin’s army besieged Kaifeng for the second time, and the city fell in November. Northern Song collapsed, taking only three years from prosperity to destruction. Based on historical records considering the positions of Song, Liao, and Jin, the author uses accessible narrative style to recreate the historical process of the Jingkang Incident, exploring the deep causes behind Northern Song’s rise and fall, and its timeless significance as a mirror.</p></blockquote><p>This book is available on WeRead, recommended.</p><h1 id="Android-Efficient-Progress-From-Data-to-AI"><a href="#Android-Efficient-Progress-From-Data-to-AI" class="headerlink" title="Android Efficient Progress: From Data to AI"></a>Android Efficient Progress: From Data to AI</h1><p><img src="/en/images/15802098163281.jpg" alt="Android Efficient Progress"></p><p>“Android Efficient Progress: From Data to AI” is a book combining Android advanced technology with practical application, organized into 3 main areas. First, Android engineering system practice and advancement, including mobile data technology, tool infrastructure advancement, efficiency advancement, as well as tool application advancement and engineering construction advancement; second, exploration of current mobile frontend technologies, including container technology, large frontend technology, and AI technology; third, mobile application security attack and defense technology and advanced design pattern practice. The book is comprehensive, focusing on practical experience and advanced skills. Through this book, you can not only learn the latest mobile technologies and knowledge combining advanced technology with practical applications, but more importantly, comprehend the author’s spirit of technical research and thinking methods, helping Android developers progress efficiently.</p><p>“Android Efficient Progress: From Data to AI” is suitable for mobile application developers, Android system developers, Android system security engineers, and mobile technology leaders in the Android field.</p><p>From the book’s content, the author is an experienced developer. Many topics have fairly detailed architecture implementations that readers can use to build their own systems. It’s a rare book of experience, available on WeRead.</p><h1 id="A-Turbulent-Hundred-Years"><a href="#A-Turbulent-Hundred-Years" class="headerlink" title="A Turbulent Hundred Years"></a>A Turbulent Hundred Years</h1><p><img src="/en/images/15890825861013.jpg" alt="A Turbulent Hundred Years"></p><p>Author Wu Xiaobo presents China’s development over the past hundred years from a commercial perspective. The author mentions three phenomena in development: first, the interference of ideological debates on modernization; second, the central authority concept’s catalysis of national commercialism; third, the influence of traditional anti-commerce and official-commerce culture on the emerging entrepreneur class. Sadly, in the multiple economic reform movements after the Westernization Movement, these three themes haunted like ghosts, impossible to shake off.</p><p>My personal feeling after reading: national stability is too important for commercial development. China’s political situation in modern times was very unstable, and commercial development always rose and fell with political changes; commerce before the Reform and Opening was basically stagnant. It can be said that China’s commercial and technological development started basically from zero after the Reform and Opening. The gap with the United States, which had over a hundred years of stable development, is enormous. This is my biggest takeaway from this book. Although technology sharing and technological explosion exist, our country still masters too few core technologies.</p><blockquote><p>In these 100+ years, suffering has given us the opportunity to focus and reflect, learning many things. It has allowed the Chinese to carefully examine their experiences and more harshly observe their thousand-year history. Without humiliation, we might not have paid attention at all, still immersed in the illusion of being a great nation.<br>Since the Opium War of 1840, one phrase has covered all themes, becoming the lifelong ideal of countless patriotic Chinese: “Strong Nation.” The urgency of “Strong Nation” made the country incredibly anxious, sometimes even impatient, willing to take risks before thoroughly investigating a path. At many sensitive critical moments, gradualist thinking was often seen as “reactionary,” and revolutionary upheaval, even bloody violence, became the choice of the entire nation. A hundred years of spring and autumn, with farces, tragedies, and comedies interweaving on stage.<br>In this 100 years driven by the “Strong Nation Dream,” China’s revival began at a dark and desperate moment of awakening. Commercial evolution has always been an important direction for national progress and national redemption. It is precisely in this process that the emerging entrepreneur class rose as an independent force. Their tortuous fate intertwined with the political changes and national choices of this country, sometimes united, sometimes split, but mostly in a discordant state. Over the past century, China’s economic problems can ultimately be summarized as adjustments in three interest relationships: first, adjustment between government interests and public interests; second, adjustment between central government and local government interests; third, adjustment between wealthy public and poor public interests. As representatives of the wealthy public, the entrepreneur group has never reached principled and constructive consensus in relationships with the government (including central and local), intellectuals, and the poor public. This has become one of the important reasons why Chinese commercial progress is always interrupted by various events.</p></blockquote><h1 id="Remote-A-More-Simple-and-Efficient-Way-of-Remote-Work"><a href="#Remote-A-More-Simple-and-Efficient-Way-of-Remote-Work" class="headerlink" title="Remote: A More Simple and Efficient Way of Remote Work"></a>Remote: A More Simple and Efficient Way of Remote Work</h1><p><img src="/en/images/15929815335750.jpg" alt="Remote"></p><p>This book is called Remote. The Chinese translation calling it “Rework 2” is a terrible translation.</p><p>The authors are the two founders of 37Signals. The book covers all aspects of remote work, including the advantages of remote work, how to collaborate remotely, side effects of remote work, employee management in remote work, and self-management in remote work. The 2020 COVID-19 pandemic made most companies try remote work, and many things mentioned in this book were encountered in actual remote work.</p><p>Here are some excerpts to ponder:</p><blockquote><p>What really matters is getting the work done well, not rigidly sticking to work hours.</p></blockquote><blockquote><p>The luxury of the new era is breaking free from the mental shackle of “enjoy life later” and doing what you love now, alongside work. Why waste time on daydreams like “how wonderful life will be when I retire”? Drawing a line between work and retirement is actually quite arbitrary. Your life no longer needs to follow such rules. You can mix the two together, having both fun and income - designing a better lifestyle that makes work enjoyable, because work isn’t the only thing in life. Those golden handcuffs prevent you from living the life you truly want to live. Break free from that resentment!</p></blockquote><blockquote><p>When you can’t watch someone all day, the only criterion for judgment is work results. A whole bunch of other trivial standards disappear. You just look at work results. Therefore, you don’t need to ask remote workers “what did you do today” - just say “show me today’s results.”</p></blockquote><blockquote><p>When meetings become the norm, become essential tools for discussion and debate, used to solve any problem, they’re being abused, and everyone becomes numb. Meetings should be like salt, carefully sprinkled on dishes for flavor, not poured on by the spoonful. Too much salt ruins the dish; too many meetings lower morale and enthusiasm.</p></blockquote><blockquote><p>If you don’t manage the balance between life and work well, the freedom of remote work becomes slavery. This is possible because when you break free from the 9-to-5 job, you can easily fall into the shackles of working all day.</p></blockquote><blockquote><p>Remote work lifts the veil, letting people see a fact that has always existed but isn’t always acknowledged or seen: excellent remote workers are simply excellent workers. It’s that simple.</p></blockquote><blockquote><p>Internal motivation: Programmers write open source software generally because they love doing it, not for money. Money often comes along, but it’s rarely the source of motivation. That is, when you’re solving a particularly interesting, exciting problem, you don’t need managers constantly peering over your shoulder to check if you’re working.<br>Everything public: Most open source software is coordinated through mailing lists and code tracking systems like GitHub. As long as someone wants to help, they can, because all information is public. You can volunteer to participate, and the person most expert in a particular area can easily jump in.</p></blockquote><h1 id="Shark’s-Fin-and-Sichuan-Pepper"><a href="#Shark’s-Fin-and-Sichuan-Pepper" class="headerlink" title="Shark’s Fin and Sichuan Pepper"></a>Shark’s Fin and Sichuan Pepper</h1><p><img src="/en/images/15929848508400.jpg" alt="Shark&#39;s Fin and Sichuan Pepper"></p><p>Author <strong>Fuchsia Dunlop</strong> grew up in Oxford and earned a Bachelor’s degree in English Literature from Cambridge University, then obtained a Master’s degree in Chinese Studies with distinction from SOAS, University of London. In 1994, after receiving a British Council scholarship, Fuchsia went to study at Sichuan University for a year; she then received three months of professional chef training at the Sichuan Institute of Higher Cuisine, becoming the first foreign student there.</p><p>I originally approached this “Shark’s Fin and Sichuan Pepper” with a relaxed mood. The first half of the book indeed has a very relaxed and pleasant atmosphere, following the author through the streets and alleys of Chengdu looking for home-cooked food, with a recipe for a home-cooked dish after each section. The author’s description of Chengdu life also makes one feel content:</p><blockquote><p>The slow, languid feeling of this place also subtly influences you. In Chengdu, forget about realizing plans - even making plans is completely impossible. Since the Tang Dynasty, this place has been famous for its comfortable and leisurely life. The climate is suitable, and the soil is legendarily fertile. Chengdu people don’t have to work particularly hard to eat well and have fun. The city has a bit of a southern feel, even somewhat Mediterranean. Chengdu people walk slower than Beijing or Shanghai people. They sit in teahouses for an entire afternoon and evening, playing mahjong, playing cards, joking and bickering in the slow-paced, sweet-toned Sichuan dialect with drawn-out vowels and cute erhua endings. They call this “bai long men zhen” - Sichuan’s unique way of chatting about everything. And the most vivid Sichuan phrase is “hao shua” (particularly fun). They say it in a lazy voice, grinning, with bamboo chairs creaking in the background. “Those coastal people,” a taxi driver chatted with me about Cantonese and Fujianese people, “they have big ambitions and work hard, so they got rich first. We Sichuan people, as long as we make enough money to eat well and drink spicy food, that’s enough.”</p></blockquote><p>The dishes described in the book include Chengdu home-cooked dishes, Hong Kong Cantonese cuisine, Hunan cuisine, and Yangzhou Jiangsu-Zhejiang cuisine. However, since the author stayed in Sichuan longer, Sichuan cuisine and Sichuan life appear more frequently. Each region’s cuisine has its own characteristics, and just reading the author’s descriptions, you can almost smell the fragrant aromas.</p><p>However, the latter half of the book also discusses food safety issues, eating wild game, eating protected animals, and some things about Chinese officialdom. The more I read, the heavier it became, yet there was nothing I could do. The city is changing, society is changing, people are changing, things are changing. The author came to the greatly changed Chengdu again, recording these changes as an observer:</p><blockquote><p>On one hand, such demolition is truly a tragedy - my personal tragedy: falling in love with a place that is disappearing so rapidly. My research into cooking and food originally intended to record a vibrant city. Only later did I understand that from many perspectives, I was writing the “epitaph” of old Chengdu. I feel this is also a tragedy for Chengdu people, though they don’t realize it. This city was so charming, so unique, now being replaced by a city that exists everywhere in China - a terrible waste, sad and lamentable.</p></blockquote><blockquote><p>On the other hand, 1990s China seemed to overflow with vitality and optimism. The previous utilitarianism, asceticism, and monotonous blandness disappeared. The whole country was moving, 1.2 billion people united, moving forward together. In England, even demolishing a dilapidated old building would make us sad and distressed. But in Sichuan, they swung hammers all the way, flattening the entire city! This reckless confidence was admirable. They firmly believed the future would be better than the past.</p></blockquote><blockquote><p>So, even though my heart still ached passing through those leveled streets, I was also stirred and agitated by this vibrant optimism. I too was in an unstable state, my life was also changing. I was tapping into potential creativity, making great friends, slowly shedding skin like a snake.</p></blockquote><h1 id="Born-a-Crime"><a href="#Born-a-Crime" class="headerlink" title="Born a Crime"></a>Born a Crime</h1><p><img src="/en/images/15946504381924.jpg" alt="Born a Crime"></p><blockquote><p>You don’t choose where you’re born, but you can choose your life</p></blockquote><p>Because of the Daily Show, I started following Trevor Noah. This book is Trevor Noah’s autobiography. The title is confusing - what does “born a crime” mean? I hadn’t paid much attention to African history before. After reading this book, I learned that “born a crime” refers to the apartheid era in Africa when blacks and whites couldn’t be together, let alone have children. But Trevor is the son of a white father and black mother, so he was born a criminal.</p><p>Two major themes run through the article: one is racial segregation, one is racial identity. During white rule in Africa, apartheid was implemented. This segregation wasn’t just segregation of people, but also included language segregation, cultural segregation, ideological segregation, and even segregation between black tribes. The other is racial identity. In local terms, Trevor belongs to the colored race - the kind that wasn’t accepted by either the black community or the white community. Indians and Chinese would also group together. For a child at that time, who to hang out with (gaining acceptance from which group) was very important. From childhood, Trevor was isolated by various groups, but through his mother and knowledge, he found a way to survive among various races and groups, eventually becoming a successful comedian, talk show host, and TV&#x2F;radio host.</p><blockquote><p>Apartheid represented a police state, a system of laws and surveillance that kept black people under absolute control. If all the laws could be written down and stacked together, it would take over three thousand sheets of paper, weighing up to five kilograms. But the essence of South African apartheid is very easy for Americans to understand. Three things happened in American history: driving Native Americans to reservations, black slavery, and segregation. Imagine these three things happening to the same group of people at the same time - that’s apartheid.</p></blockquote><blockquote><p>I found my place. Since I didn’t belong to any small circle, I could move between different circles. I was still a chameleon, a cultural chameleon. I knew how to blend in. I could exercise with athletic kids, discuss computers with nerds. I could jump into crowds and dance with small-town boys. I could have brief intersections with everyone, studying together, chatting, telling jokes, delivering food.</p></blockquote><h1 id="About-Me-amp-amp-Blog"><a href="#About-Me-amp-amp-Blog" class="headerlink" title="About Me &amp;&amp; Blog"></a>About Me &amp;&amp; Blog</h1><p>Below is my personal introduction and related links. I look forward to exchanging ideas with peers - when three people walk together, there must be a teacher among them!</p><ol><li><a href="https://www.androidperformance.com/en/about/">Blogger’s Personal Introduction</a>: Contains my WeChat and WeChat group links.</li><li><a href="https://www.androidperformance.com/en/2019/12/01/BlogMap/">Blog Content Navigation</a>: A navigation guide for my blog content.</li><li><a href="https://www.androidperformance.com/en/2018/05/07/Android-performance-optimization-skills-and-tools/">Personally Curated Excellent Blog Posts - Android Performance Optimization Must-Knows</a>: Recommendations and self-recommendations welcome (just WeChat message me)</li><li><a href="https://www.androidperformance.com/en/2023/12/30/the-performance/">Android Performance Optimization Knowledge Planet</a>: Welcome to join, thanks for the support~</li></ol><blockquote><p><strong>One person can walk faster, a group can walk further</strong></p></blockquote><p><img src="/en/images/WechatIMG581.webp" alt="Scan WeChat QR Code"></p>]]></content>
    
    
    <summary type="html">&lt;p&gt;Below is my 2020 reading list. Everything recorded here has been finished - technical books are not included since it’s hard to define when they’re “finished.”&lt;/p&gt;
&lt;p&gt;I prefer reading history-related books. Among them, &lt;strong&gt;The Siege of Kaifeng&lt;/strong&gt; was very uncomfortable to read - the weak have no diplomacy, it’s truly realistic; &lt;strong&gt;Bad Kids&lt;/strong&gt; lives up to its name, personally I feel it’s much better than the TV series; &lt;strong&gt;Rework 2&lt;/strong&gt; and &lt;strong&gt;Rework 3&lt;/strong&gt; are work-related, covering remote work and work methods, consistent with the 2020 trend of working from home - recommended for white-collar programmers; &lt;strong&gt;My Last Diet Book&lt;/strong&gt; systematically and professionally discusses weight loss knowledge, very useful for someone like me who’s trying to lose weight; finally, &lt;strong&gt;Blades of the Guardians&lt;/strong&gt; is already a classic in Chinese comics - I’ll definitely buy a physical set for collection once it’s complete (same for Attack on Titan).&lt;/p&gt;
&lt;p&gt;Didn’t read much in 2020. Need to invest more in this area in 2021. &lt;strong&gt;Read + Record + Summarize&lt;/strong&gt; - reading notes will be added later.&lt;/p&gt;</summary>


    <category term="Reading Notes" scheme="https://androidperformance.com/en/categories/Reading-Notes/"/>
    
    
    <category term="Android" scheme="https://androidperformance.com/en/tags/Android/"/>
    
    <category term="Jank" scheme="https://androidperformance.com/en/tags/Jank/"/>
    
  </entry>
  
  <entry>
    <title>Android Systrace Basics - CPU Info Interpretation</title>
    <link href="https://androidperformance.com/en/2019/12/21/Android-Systrace-CPU/"/>
    <id>https://androidperformance.com/en/2019/12/21/Android-Systrace-CPU/</id>
    <published>2019-12-21T07:16:26.000Z</published>
    <updated>2026-05-10T23:29:51.059Z</updated>
    
    <content type="html"><![CDATA[<p>This is the twelfth article in the Systrace series, primarily providing a brief introduction to the CPU information area (Kernel) in Systrace. It covers how to view CPU-related information output by the Kernel module, including CPU frequency, scheduling, frequency locking, and core locking.</p><p>The purpose of this series is to view the overall operation of the Android system from a different perspective using Systrace, while also providing an alternative angle for learning the Framework. Perhaps you’ve read many articles about the Framework but can never remember the code, or you’re unclear about the execution flow. Maybe from Systrace’s graphical perspective, you can gain a deeper understanding.</p><span id="more"></span><h2 id="Table-of-Contents"><a href="#Table-of-Contents" class="headerlink" title="Table of Contents"></a>Table of Contents</h2><ul><li><a href="#series">Series Article Index</a></li><li><a href="#cpu-fig">CPU Area Legend</a></li><li><a href="#arch">Core Architecture</a></li><li><a href="#pin">Core Binding (Pinning)</a></li><li><a href="#lockfreq">Frequency Locking</a></li><li><a href="#cpu-state">CPU States</a></li><li><a href="#details">Detailed Information in Systrace</a></li><li><a href="#refs">References</a></li><li><a href="#about">About Me &amp;&amp; Blog</a></li></ul><p><a id="series"></a></p><h1 id="Series-Article-Index"><a href="#Series-Article-Index" class="headerlink" title="Series Article Index"></a>Series Article Index</h1><ol><li><a href="https://www.androidperformance.com/en/2019/05/28/Android-Systrace-About/">Introduction to Systrace</a></li><li><a href="https://www.androidperformance.com/en/2019/07/23/Android-Systrace-Pre/">Systrace Basics - Prerequisites for Systrace</a></li><li><a href="https://www.androidperformance.com/en/2019/05/27/why-60-fps/">Systrace Basics - Why 60 fps?</a></li><li><a href="https://www.androidperformance.com/en/2019/06/29/Android-Systrace-SystemServer/">Android Systrace Basics - SystemServer Explained</a></li><li><a href="https://www.androidperformance.com/en/2020/02/14/Android-Systrace-SurfaceFlinger/">Systrace Basics - SurfaceFlinger Explained</a></li><li><a href="https://www.androidperformance.com/en/2019/11/04/Android-Systrace-Input/">Systrace Basics - Input Explained</a></li><li><a href="https://www.androidperformance.com/en/2019/12/01/Android-Systrace-Vsync/">Systrace Basics - Vsync Explained</a></li><li><a href="https://www.androidperformance.com/en/2019/10/22/Android-Choreographer/">Systrace Basics - Vsync-App: Detailed Explanation of Choreographer-Based Rendering Mechanism</a></li><li><a href="https://www.androidperformance.com/en/2019/11/06/Android-Systrace-MainThread-And-RenderThread/">Systrace Basics - MainThread and RenderThread Explained</a></li><li><a href="https://www.androidperformance.com/en/2019/12/06/Android-Systrace-Binder/">Systrace Basics - Binder and Lock Contention Explained</a></li><li><a href="https://www.androidperformance.com/en/2019/12/15/Android-Systrace-Triple-Buffer">Systrace Basics - Triple Buffer Explained</a></li><li><a href="https://www.androidperformance.com/en/2019/12/21/Android-Systrace-CPU">Systrace Basics - CPU Info Explained</a></li><li><a href="https://www.androidperformance.com/en/2021/04/24/android-systrace-smooth-in-action-1/">Systrace Smoothness in Action 1: Understanding Jank Principles</a></li><li><a href="https://www.androidperformance.com/en/2021/04/24/android-systrace-smooth-in-action-2/">Systrace Smoothness in Action 2: Case Analysis - MIUI Launcher Scroll Jank Analysis</a></li><li><a href="https://www.androidperformance.com/en/2021/04/24/android-systrace-smooth-in-action-3/">Systrace Smoothness in Action 3: FAQs During Jank Analysis</a></li><li><a href="https://www.androidperformance.com/en/2021/09/13/android-systrace-Responsiveness-in-action-1/">Systrace Responsiveness in Action 1: Understanding Responsiveness Principles</a></li><li><a href="https://www.androidperformance.com/en/2021/09/13/android-systrace-Responsiveness-in-action-2/">Systrace Responsiveness in Action 2: Responsiveness Analysis - Using App Startup as an Example</a></li><li><a href="https://www.androidperformance.com/en/2021/09/13/android-systrace-Responsiveness-in-action-3/">Systrace Responsiveness in Action 3: Extended Knowledge on Responsiveness</a></li><li><a href="https://www.androidperformance.com/en/2022/01/21/android-systrace-cpu-state-runnable/">Systrace Thread CPU State Analysis Tips - Runnable</a></li><li><a href="https://www.androidperformance.com/en/2022/03/13/android-systrace-cpu-state-running/">Systrace Thread CPU State Analysis Tips - Running</a></li><li><a href="https://www.androidperformance.com/en/2022/03/13/android-systrace-cpu-state-sleep/">Systrace Thread CPU State Analysis Tips - Sleep and Uninterruptible Sleep</a></li></ol><p><a id="cpu-fig"></a></p><h1 id="CPU-Area-Legend"><a href="#CPU-Area-Legend" class="headerlink" title="CPU Area Legend"></a>CPU Area Legend</h1><p>Read this CPU Info article together with <a href="https://www.androidperformance.com/en/2025/11/12/Android-Perfetto-09-CPU/">Perfetto 9: CPU information</a>. The old Systrace CPU area placed frequency, scheduling, running threads, and big&#x2F;little core information near the top, which made it easy to ask whether a thread got CPU, which core it ran on, and whether the frequency was enough. Perfetto still exposes the same evidence, but the entry points are CPU tracks, thread-state tracks, counters, the selection panel, and SQL tables.</p><p>The analysis workflow should also move from “read colors and tracks” to “combine evidence.” First locate the target thread’s Runnable, Running, and Sleep intervals. Then check which CPU it actually ran on, CPU frequency and idle state at that time, and whether higher-priority work preempted it. For scheduling, CPU affinity, frequency lock, or boost problems, Perfetto’s visual UI is good for locating the interval, while <code>trace_processor</code> and SQL are better for aggregating how long the thread spent on different CPUs or frequency ranges.</p><p>Below is the CPU Info area in the Kernel of a Systrace captured from a Qualcomm Snapdragon 845 device (we’re focusing on Kernel CPU info here, skipping lower sections).</p><p><img src="/en/images/15769147700353.jpg" alt="CPU Area Legend"></p><p>The CPU Info in Systrace is generally at the top, and commonly used information includes:</p><ol><li>CPU frequency changes</li><li>Task execution status</li><li>Scheduling across large and small cores</li><li>CPU Boost scheduling</li></ol><p>In general, Kernel CPU Info in Systrace is used to examine task scheduling and determine if frequency or scheduling is causing performance issues for the current task. For example:</p><ol><li>A task runs slowly in a certain scenario; was it scheduled to a small core?</li><li>A task runs slowly; is the current CPU frequency insufficient?</li><li>For special tasks like fingerprint unlocking, can it be pinned to a large core?</li><li>For high-CPU-demand scenarios, can we limit the minimum CPU frequency while it’s running?</li></ol><p>Detailed explanations related to CPU execution can be found in the article <a href="https://www.androidperformance.com/en/2019/07/23/Android-Systrace-Pre/">Android Systrace Basics - Prerequisites for Analyzing Systrace</a>.</p><p><a id="arch"></a></p><h1 id="Core-Architecture"><a href="#Core-Architecture" class="headerlink" title="Core Architecture"></a>Core Architecture</h1><p>Briefly, modern mobile CPUs can be categorized into three types based on core count and architecture:</p><ol><li>Non-big.LITTLE architecture</li><li>big.LITTLE architecture</li><li>Big-Medium-Small core architecture</li></ol><p>Most current CPUs use big.LITTLE, while some (like Snapdragon 855&#x2F;865) use the Big-Medium-Small core architecture. A small number of CPUs use a uniform architecture.</p><p>Let’s discuss the differences to help interpret Systrace:</p><p><img src="/en/images/15769147794281.jpg" alt="big.LITTLE Architecture"></p><h2 id="Non-big-LITTLE-Architecture"><a href="#Non-big-LITTLE-Architecture" class="headerlink" title="Non-big.LITTLE Architecture"></a>Non-big.LITTLE Architecture</h2><p>Older devices with dual or quad cores typically had uniform core architectures, meaning all cores were isomorphic—same frequency, same power consumption, enabling or disabling together. Some entry-level Qualcomm processors also use isomorphic octa-core processors, like Snapdragon 636.</p><p>Most modern devices no longer use this architecture.</p><h2 id="big-LITTLE-Architecture"><a href="#big-LITTLE-Architecture" class="headerlink" title="big.LITTLE Architecture"></a>big.LITTLE Architecture</h2><p>Modern CPUs generally use 8 cores. CPU 0-3 are typically small cores, while CPU 4-7 are large cores, as arranged in Systrace.</p><p>Small cores generally have lower clock speeds and power consumption, typically using the ARM A5x series. For example, the Snapdragon 845 small cores consist of four A55 cores (up to 1.8GHz).</p><p>Large cores have higher maximum frequencies and power consumption, typically using the ARM A7x series. For example, the Snapdragon 845 large cores consist of four A75 cores (up to 2.8GHz).</p><p>Here is the Snapdragon 845 CPU:</p><p><img src="/en/images/15769147884550.jpg" alt="Snapdragon 845"></p><p>Variations exist, such as Snapdragon 636 (4 small + 2 large) or Snapdragon 710 (6 small + 2 large). The principle remains: <strong>large cores support high-load scenarios, and small cores handle daily use. Performance depends on the device’s tier; as the saying goes, “you get what you pay for.”</strong></p><p>Parameters for mainstream Qualcomm big.LITTLE processors:</p><p><img src="/en/images/15769147957115.jpg"></p><h2 id="Big-Medium-Small-Core-Architecture"><a href="#Big-Medium-Small-Core-Architecture" class="headerlink" title="Big-Medium-Small Core Architecture"></a>Big-Medium-Small Core Architecture</h2><p>Some CPUs utilize a Big-Medium-Small architecture, such as:</p><ul><li>Snapdragon 855: 8 cores (1 x A76 Big + 3 x A76 Medium + 4 x A55 Small)</li><li>MTK X30: 10 cores (2 x A73 Big + 4 x A53 Medium + 4 x A35 Small)</li><li>Kirin 980: 8 cores (2 x A76 Big + 2 x A76 Medium + 4 x A55 Small)</li></ul><p>Compared to big.LITTLE, the “Big” core here is often a “Prime” core (Qualcomm calls it Gold+), usually numbering only 1 or 2. It has very high clock speeds and power consumption, designed for highly demanding tasks.</p><p>Comparison of 855, 845, and Kirin 980:</p><p><img src="/en/images/15769148033244.jpg"></p><p>Notably, the Snapdragon 865 continues the Big-Medium-Small architecture, using the A77 architecture for big and medium cores and A55 for small cores. The Prime and medium cores have different maximum frequencies; <strong>there is only one Prime core, clocked at 2.8GHz</strong>.</p><p><img src="/en/images/15769148095558.jpg"></p><p><a id="pin"></a></p><h1 id="Core-Binding-Pinning"><a href="#Core-Binding-Pinning" class="headerlink" title="Core Binding (Pinning)"></a>Core Binding (Pinning)</h1><p>Core binding involves <strong>pinning a specific task to a certain core or set of cores to meet its performance requirements</strong>:</p><ol><li>A high-load task needs large cores to meet timing requirements.</li><li>A task shouldn’t be frequently context-switched and needs to stay on one core.</li><li>An unimportant task with low timing requirements can be restricted to small cores.</li></ol><p>In Android, binding is generally handled by the system using three common methods:</p><h2 id="Configuring-CPUsets"><a href="#Configuring-CPUsets" class="headerlink" title="Configuring CPUsets"></a>Configuring CPUsets</h2><p>The CPUset subsystem limits specific types of tasks to specific CPUs or CPU groups. Android defines default groups that manufacturers can customize:</p><ol><li><code>system-background</code>: Low-priority tasks, restricted to small cores.</li><li><code>foreground</code>: Foreground processes.</li><li><code>top-app</code>: Processes currently interacting with the user.</li><li><code>background</code>: Background processes.</li><li><code>foreground/boost</code>: Previously used to migrate all foreground processes during app launch; now largely inactive.</li></ol><p>CPUset configurations vary by architecture and manufacturer. Here is the Google default:</p><figure class="highlight bash"><table><tr><td class="gutter"><pre><span class="line">1</span><br><span class="line">2</span><br><span class="line">3</span><br><span class="line">4</span><br><span class="line">5</span><br><span class="line">6</span><br><span class="line">7</span><br><span class="line">8</span><br><span class="line">9</span><br><span class="line">10</span><br></pre></td><td class="code"><pre><span class="line">// Default Official Configuration</span><br><span class="line">write /dev/cpuset/top-app/cpus 0-7</span><br><span class="line">write /dev/cpuset/foreground/cpus 0-7</span><br><span class="line">write /dev/cpuset/foreground/boost/cpus 4-7</span><br><span class="line">write /dev/cpuset/background/cpus 0-7</span><br><span class="line">write /dev/cpuset/system-background/cpus 0-3</span><br><span class="line"></span><br><span class="line">// Check your own</span><br><span class="line">adb shell <span class="built_in">cat</span> /dev/cpuset/top-app/cpus</span><br><span class="line">0-7</span><br></pre></td></tr></table></figure><p>You can view tasks in each group via the <code>tasks</code> node:</p><figure class="highlight bash"><table><tr><td class="gutter"><pre><span class="line">1</span><br><span class="line">2</span><br><span class="line">3</span><br><span class="line">4</span><br><span class="line">5</span><br></pre></td><td class="code"><pre><span class="line">$ adb shell <span class="built_in">cat</span> /dev/cpuset/top-app/tasks</span><br><span class="line">1687</span><br><span class="line">1689</span><br><span class="line">1690</span><br><span class="line">3559</span><br></pre></td></tr></table></figure><p>Placement is dynamic and can be changed by authorized processes. Some processes are configured at startup, such as <code>lmkd</code>, which places itself in <code>system-background</code>:</p><figure class="highlight plaintext"><table><tr><td class="gutter"><pre><span class="line">1</span><br><span class="line">2</span><br><span class="line">3</span><br><span class="line">4</span><br><span class="line">5</span><br><span class="line">6</span><br><span class="line">7</span><br><span class="line">8</span><br></pre></td><td class="code"><pre><span class="line">service lmkd /system/bin/lmkd</span><br><span class="line">    class core</span><br><span class="line">    user lmkd</span><br><span class="line">    group lmkd system readproc</span><br><span class="line">    capabilities DAC_OVERRIDE KILL IPC_LOCK SYS_NICE SYS_RESOURCE BLOCK_SUSPEND</span><br><span class="line">    critical</span><br><span class="line">    socket lmkd seqpacket 0660 system system</span><br><span class="line">    writepid /dev/cpuset/system-background/tasks</span><br></pre></td></tr></table></figure><p>Most App processes change groups dynamically. Detailed definitions are in the <code>Process</code> class:</p><p><code>android/os/Process.java</code></p><figure class="highlight java"><table><tr><td class="gutter"><pre><span class="line">1</span><br><span class="line">2</span><br><span class="line">3</span><br><span class="line">4</span><br><span class="line">5</span><br><span class="line">6</span><br><span class="line">7</span><br><span class="line">8</span><br><span class="line">9</span><br></pre></td><td class="code"><pre><span class="line"><span class="keyword">public</span> <span class="keyword">static</span> <span class="keyword">final</span> <span class="type">int</span> <span class="variable">THREAD_GROUP_DEFAULT</span> <span class="operator">=</span> -<span class="number">1</span>;</span><br><span class="line"><span class="keyword">public</span> <span class="keyword">static</span> <span class="keyword">final</span> <span class="type">int</span> <span class="variable">THREAD_GROUP_BG_NONINTERACTIVE</span> <span class="operator">=</span> <span class="number">0</span>;</span><br><span class="line"><span class="keyword">private</span> <span class="keyword">static</span> <span class="keyword">final</span> <span class="type">int</span> <span class="variable">THREAD_GROUP_FOREGROUND</span> <span class="operator">=</span> <span class="number">1</span>;</span><br><span class="line"><span class="keyword">public</span> <span class="keyword">static</span> <span class="keyword">final</span> <span class="type">int</span> <span class="variable">THREAD_GROUP_SYSTEM</span> <span class="operator">=</span> <span class="number">2</span>;</span><br><span class="line"><span class="keyword">public</span> <span class="keyword">static</span> <span class="keyword">final</span> <span class="type">int</span> <span class="variable">THREAD_GROUP_AUDIO_APP</span> <span class="operator">=</span> <span class="number">3</span>;</span><br><span class="line"><span class="keyword">public</span> <span class="keyword">static</span> <span class="keyword">final</span> <span class="type">int</span> <span class="variable">THREAD_GROUP_AUDIO_SYS</span> <span class="operator">=</span> <span class="number">4</span>;</span><br><span class="line"><span class="keyword">public</span> <span class="keyword">static</span> <span class="keyword">final</span> <span class="type">int</span> <span class="variable">THREAD_GROUP_TOP_APP</span> <span class="operator">=</span> <span class="number">5</span>;</span><br><span class="line"><span class="keyword">public</span> <span class="keyword">static</span> <span class="keyword">final</span> <span class="type">int</span> <span class="variable">THREAD_GROUP_RT_APP</span> <span class="operator">=</span> <span class="number">6</span>;</span><br><span class="line"><span class="keyword">public</span> <span class="keyword">static</span> <span class="keyword">final</span> <span class="type">int</span> <span class="variable">THREAD_GROUP_RESTRICTED</span> <span class="operator">=</span> <span class="number">7</span>;</span><br></pre></td></tr></table></figure><p><code>OomAdjuster</code> dynamically modifies CPUsets based on process state (check <code>computeOomAdjLocked</code>, <code>updateOomAdjLocked</code>, and <code>applyOomAdjLocked</code> in Android 10).</p><h2 id="Configuring-Affinity"><a href="#Configuring-Affinity" class="headerlink" title="Configuring Affinity"></a>Configuring Affinity</h2><p><code>affinity</code> sets which core a task runs on using the <code>taskset</code> system call.</p><h3 id="Usage-of-taskset"><a href="#Usage-of-taskset" class="headerlink" title="Usage of taskset"></a>Usage of taskset</h3><p><strong>Display CPU for a process:</strong></p><figure class="highlight bash"><table><tr><td class="gutter"><pre><span class="line">1</span><br></pre></td><td class="code"><pre><span class="line">taskset -p pid</span><br></pre></td></tr></table></figure><p>The returned value is hexadecimal. When converted to binary, each bit corresponds to a logical CPU (lowest bit is CPU 0). A ‘1’ indicates the process is bound to that CPU. For example, <code>0101</code> means binding to CPU 0 and 3.</p><p><strong>Binding setup:</strong></p><figure class="highlight bash"><table><tr><td class="gutter"><pre><span class="line">1</span><br><span class="line">2</span><br></pre></td><td class="code"><pre><span class="line">taskset -pc 3 pid     <span class="comment"># Bind process PID to the 3rd core</span></span><br><span class="line">taskset -c 3 <span class="built_in">command</span>  <span class="comment"># Execute command and bind its process to the 3rd core</span></span><br></pre></td></tr></table></figure><p>Android can use this call to pin tasks. Older kernels lacking CPUset support often used <code>taskset</code>.</p><h2 id="Scheduling-Algorithms"><a href="#Scheduling-Algorithms" class="headerlink" title="Scheduling Algorithms"></a>Scheduling Algorithms</h2><p>Modifying scheduling logic within the Linux scheduler can also pin tasks to specific cores. Some manufacturers use this for “core scheduling optimization.”</p><p><a id="lockfreq"></a></p><h1 id="Frequency-Locking"><a href="#Frequency-Locking" class="headerlink" title="Frequency Locking"></a>Frequency Locking</h1><p>Normally, CPU scheduling satisfies daily use, but some Android scenarios require more performance than the default scheduler provides. For app launches, relying solely on the scheduler to ramp up frequency and migrate cores might be too slow. A task might start on a small core, find it insufficient, ramp up frequency, find it still lacking, and eventually migrate through medium to large cores. This process wastes time.</p><p>To address this, the system “forcefully” ramps up hardware resources (CPU, GPU, IO, BUS, etc.) to maximum for specific scenarios. Conversely, it might limit resources—for example, capping maximum CPU frequency to cool down a device.</p><p>Android typically locks frequencies in these scenarios:</p><ol><li>App launches</li><li>App installation</li><li>Screen rotation</li><li>Window animations</li><li>List Flinging</li><li>Gaming</li></ol><p>On Qualcomm platforms, frequency locking is visible in CPU Info:</p><p><img src="/en/images/15769148260464.jpg"></p><p><a id="cpu-state"></a></p><h1 id="CPU-States"><a href="#CPU-States" class="headerlink" title="CPU States"></a>CPU States</h1><p>CPU Info also shows CPU states. As seen below, there are states 0, 1, 2, and 3:<br><img src="/en/images/15769148355062.jpg"></p><p>While older CPUs supported hot-unplugging (shutting down when idle), modern CPUs use <strong>C-States</strong>.</p><p>Below are power states for a processor supporting C0-C4 (Android performance varies by platform):</p><ol><li><strong>C0 State (Active)</strong>: Max work state, receiving instructions and processing data. Required by all modern processors.</li><li><strong>C1 State (Halt)</strong>: Entered via the <code>HLT</code> instruction. Ultra-fast wakeup (as fast as 10 nanoseconds!). Saves 70% CPU power. Required by all modern processors.</li><li><strong>C2 State (Stop-Clock)</strong>: Processor clock and I&#x2F;O buffers are stopped. Saves 70% CPU and platform energy. Wakeup takes over 100 nanoseconds.</li><li><strong>C3 State (Deep Sleep)</strong>: Bus clock and PLLs are locked. Cache is invalidated in multi-core systems. In single-core systems, memory is off but cache remains valid. Saves 70% CPU power. Wakeup takes around 50 microseconds.</li></ol><p><a id="details"></a></p><h1 id="Detailed-Information-in-Systrace"><a href="#Detailed-Information-in-Systrace" class="headerlink" title="Detailed Information in Systrace"></a>Detailed Information in Systrace</h1><p>While Systrace is usually viewed graphically in Chrome, it can be opened as text to see raw details.</p><p>Here is a CPU scheduling message:</p><figure class="highlight plaintext"><table><tr><td class="gutter"><pre><span class="line">1</span><br></pre></td><td class="code"><pre><span class="line">appEventThread-8193  [001] d..2 1638545.400415: sched_switch: prev_comm=appEventThread prev_pid=8193 prev_prio=97 prev_state=S ==&gt; next_comm=swapper/1 next_pid=0 next_prio=120</span><br></pre></td></tr></table></figure><p>Breakdown:</p><ul><li><code>appEventThread-8193</code>: TASK-PID identification.</li><li><code>[001]</code>: CPU number (CPU 1 here).</li><li><code>d..2</code>: Four bits for <code>irqs-off</code>, <code>need-resched</code>, <code>hardirq/softirq</code>, and <code>preempt-depth</code>.</li><li><code>1638545.400415</code>: Delay TIMESTAMP.</li><li><code>sched_switch ...</code>: Info area containing previous task description, PID, and priority, and current task info.</li></ul><p>Other interesting outputs:</p><ol><li><code>sched_waking</code>: <code>comm=kworker/u16:4 pid=17373 prio=120 target_cpu=003</code></li><li><code>sched_blocked_reason</code>: <code>pid=17373 iowait=0 caller=rpmh_write_batch+0x638/0x7d0</code></li><li><code>cpu_idle</code>: <code>state=0 cpu_id=3</code></li><li><code>softirq_raise</code>: <code>vec=6 [action=TASKLET]</code></li><li><code>cpu_frequency_limits</code>: <code>min=1555200 max=1785600 cpu_id=0</code></li><li><code>cpu_frequency_limits</code>: <code>min=710400 max=2419200 cpu_id=4</code></li><li><code>cpu_frequency_limits</code>: <code>min=825600 max=2841600 cpu_id=7</code></li></ol><p><a id="about"></a></p><h1 id="About-Me-amp-amp-Blog"><a href="#About-Me-amp-amp-Blog" class="headerlink" title="About Me &amp;&amp; Blog"></a>About Me &amp;&amp; Blog</h1><p>Below is my personal intro and related links. I look forward to exchanging ideas with fellow professionals. “When three walk together, one can always be my teacher!”</p><ol><li><a href="https://www.androidperformance.com/en/about/">Blogger Intro</a>: Includes personal WeChat and WeChat group links.</li><li><a href="https://www.androidperformance.com/en/2019/12/01/BlogMap/">Blog Content Navigation</a>: A guide for my blog content.</li><li><a href="https://www.androidperformance.com/en/2018/05/07/Android-performance-optimization-skills-and-tools/">Curated Excellent Blog Articles - Android Performance Optimization Must-Knows</a>: Welcome to recommend projects&#x2F;articles.</li><li><a href="https://www.androidperformance.com/en/2023/12/30/the-performance/">Android Performance Optimization Knowledge Planet</a>: Welcome to join and thank you for your support~</li></ol><blockquote><p><strong>One walks faster alone, but a group walks further together.</strong></p></blockquote><p><img src="/en/images/WechatIMG581.webp" alt="Scan WeChat QR Code"></p><p><a id="refs"></a></p><h1 id="References"><a href="#References" class="headerlink" title="References"></a>References</h1><ol><li><a href="https://blog.csdn.net/breaksoftware/article/details/79160916">taskset: A tool for binding CPU logical cores</a></li><li><a href="http://www.voidcn.com/article/p-kcjkqmld-bmg.html">CPU Power States</a></li></ol><h1 id="Spring-Bamboo-Shoots"><a href="#Spring-Bamboo-Shoots" class="headerlink" title="Spring Bamboo Shoots"></a>Spring Bamboo Shoots</h1><p>I took a photo and thought it was quite nice, sharing it with everyone.<br><img src="/en/images/15769151861715.jpg"></p>]]></content>
    
    
    <summary type="html">&lt;p&gt;This is the twelfth article in the Systrace series, primarily providing a brief introduction to the CPU information area (Kernel) in Systrace. It covers how to view CPU-related information output by the Kernel module, including CPU frequency, scheduling, frequency locking, and core locking.&lt;/p&gt;
&lt;p&gt;The purpose of this series is to view the overall operation of the Android system from a different perspective using Systrace, while also providing an alternative angle for learning the Framework. Perhaps you’ve read many articles about the Framework but can never remember the code, or you’re unclear about the execution flow. Maybe from Systrace’s graphical perspective, you can gain a deeper understanding.&lt;/p&gt;</summary>


    <category term="Android" scheme="https://androidperformance.com/en/categories/Android/"/>
    
    
    <category term="Android" scheme="https://androidperformance.com/en/tags/Android/"/>
    
    <category term="Systrace" scheme="https://androidperformance.com/en/tags/Systrace/"/>
    
    <category term="Startup" scheme="https://androidperformance.com/en/tags/Startup/"/>
    
    <category term="Jank" scheme="https://androidperformance.com/en/tags/Jank/"/>
    
    <category term="Performance" scheme="https://androidperformance.com/en/tags/Performance/"/>
    
  </entry>
  
  <entry>
    <title>Android Systrace Basics - Triple Buffer Explained</title>
    <link href="https://androidperformance.com/en/2019/12/15/Android-Systrace-Triple-Buffer/"/>
    <id>https://androidperformance.com/en/2019/12/15/Android-Systrace-Triple-Buffer/</id>
    <published>2019-12-15T15:31:20.000Z</published>
    <updated>2026-05-10T23:29:51.060Z</updated>
    
    <content type="html"><![CDATA[<p>This is the eleventh article in the Systrace series, providing a brief introduction to Triple Buffer within Systrace. It covers how to identify jank in Systrace, perform preliminary localization and analysis, and explains the impact of Triple Buffer on performance.</p><p>The purpose of this series is to view the overall operation of the Android system from a different perspective using Systrace, while also providing an alternative angle for learning the Framework. Perhaps you’ve read many articles about the Framework but can never remember the code, or you’re unclear about the execution flow. Maybe from Systrace’s graphical perspective, you can gain a deeper understanding.</p><span id="more"></span><h2 id="Table-of-Contents"><a href="#Table-of-Contents" class="headerlink" title="Table of Contents"></a>Table of Contents</h2><ul><li><a href="#series">Series Article Index</a></li><li><a href="#define-jank">How to Define Dropped Frames (Jank)?</a></li><li><a href="#bq-tb">BufferQueue and Triple Buffer</a></li><li><a href="#effects">The Role of Triple Buffer</a></li><li><a href="#debug">Debugging Triple Buffer</a></li><li><a href="#refs">References</a></li><li><a href="#attachments">Attachments</a></li><li><a href="#about">About Me &amp;&amp; Blog</a></li></ul><p><a id="series"></a></p><h1 id="Series-Article-Index"><a href="#Series-Article-Index" class="headerlink" title="Series Article Index"></a>Series Article Index</h1><ol><li><a href="https://www.androidperformance.com/en/2019/05/28/Android-Systrace-About/">Introduction to Systrace</a></li><li><a href="https://www.androidperformance.com/en/2019/07/23/Android-Systrace-Pre/">Systrace Basics - Prerequisites for Systrace</a></li><li><a href="https://www.androidperformance.com/en/2019/05/27/why-60-fps/">Systrace Basics - Why 60 fps?</a></li><li><a href="https://www.androidperformance.com/en/2019/06/29/Android-Systrace-SystemServer/">Android Systrace Basics - SystemServer Explained</a></li><li><a href="https://www.androidperformance.com/en/2020/02/14/Android-Systrace-SurfaceFlinger/">Systrace Basics - SurfaceFlinger Explained</a></li><li><a href="https://www.androidperformance.com/en/2019/11/04/Android-Systrace-Input/">Systrace Basics - Input Explained</a></li><li><a href="https://www.androidperformance.com/en/2019/12/01/Android-Systrace-Vsync/">Systrace Basics - Vsync Explained</a></li><li><a href="https://www.androidperformance.com/en/2019/10/22/Android-Choreographer/">Systrace Basics - Vsync-App: Detailed Explanation of Choreographer-Based Rendering Mechanism</a></li><li><a href="https://www.androidperformance.com/en/2019/11/06/Android-Systrace-MainThread-And-RenderThread/">Systrace Basics - MainThread and RenderThread Explained</a></li><li><a href="https://www.androidperformance.com/en/2019/12/06/Android-Systrace-Binder/">Systrace Basics - Binder and Lock Contention Explained</a></li><li><a href="https://www.androidperformance.com/en/2019/12/15/Android-Systrace-Triple-Buffer">Systrace Basics - Triple Buffer Explained</a></li><li><a href="https://www.androidperformance.com/en/2019/12/21/Android-Systrace-CPU">Systrace Basics - CPU Info Explained</a></li><li><a href="https://www.androidperformance.com/en/2021/04/24/android-systrace-smooth-in-action-1/">Systrace Smoothness in Action 1: Understanding Jank Principles</a></li><li><a href="https://www.androidperformance.com/en/2021/04/24/android-systrace-smooth-in-action-2/">Systrace Smoothness in Action 2: Case Analysis - MIUI Launcher Scroll Jank Analysis</a></li><li><a href="https://www.androidperformance.com/en/2021/04/24/android-systrace-smooth-in-action-3/">Systrace Smoothness in Action 3: FAQs During Jank Analysis</a></li><li><a href="https://www.androidperformance.com/en/2021/09/13/android-systrace-Responsiveness-in-action-1/">Systrace Responsiveness in Action 1: Understanding Responsiveness Principles</a></li><li><a href="https://www.androidperformance.com/en/2021/09/13/android-systrace-Responsiveness-in-action-2/">Systrace Responsiveness in Action 2: Responsiveness Analysis - Using App Startup as an Example</a></li><li><a href="https://www.androidperformance.com/en/2021/09/13/android-systrace-Responsiveness-in-action-3/">Systrace Responsiveness in Action 3: Extended Knowledge on Responsiveness</a></li><li><a href="https://www.androidperformance.com/en/2022/01/21/android-systrace-cpu-state-runnable/">Systrace Thread CPU State Analysis Tips - Runnable</a></li><li><a href="https://www.androidperformance.com/en/2022/03/13/android-systrace-cpu-state-running/">Systrace Thread CPU State Analysis Tips - Running</a></li><li><a href="https://www.androidperformance.com/en/2022/03/13/android-systrace-cpu-state-sleep/">Systrace Thread CPU State Analysis Tips - Sleep and Uninterruptible Sleep</a></li></ol><p><a id="define-jank"></a></p><h1 id="How-to-Define-Dropped-Frames-Jank"><a href="#How-to-Define-Dropped-Frames-Jank" class="headerlink" title="How to Define Dropped Frames (Jank)?"></a>How to Define Dropped Frames (Jank)?</h1><p>Read this Triple Buffer article together with <a href="https://www.androidperformance.com/en/2025/08/05/Android-Perfetto-08-Vsync/">Perfetto 8: Vsync and performance analysis</a>. In old Systrace, judging dropped frames usually meant checking both app-side frame time and whether SurfaceFlinger still had an available buffer in BufferQueue. In Perfetto, the same judgment still applies, but the evidence is distributed across Frame Timeline, App &#x2F; RenderThread tracks, SurfaceFlinger tracks, Buffer&#x2F;Fence related information, and CPU scheduling.</p><p>The old shortcut “main thread over 16.6ms means a dropped frame” is easier to misuse today. High refresh rate devices change the frame budget to 11.1ms, 8.3ms, and similar values, and Triple Buffer &#x2F; BufferQueue means app-side time is not always equivalent to whether the display repeats an old frame. The current workflow should start from the real refresh rate and Frame Timeline, then check whether the app missed submission, whether SurfaceFlinger had an older buffer available, whether fences blocked composition, and whether the display repeated an old frame.</p><p>Systrace displays app frame drops. While it’s common to say jank occurs if the main thread exceeds 16.6 ms, this isn’t always true due to Triple Buffer (explained later). Generally, jank in Systrace should be judged by looking at both the App side and the <code>SurfaceFlinger</code> side.</p><h2 id="Judging-Jank-on-the-App-Side"><a href="#Judging-Jank-on-the-App-Side" class="headerlink" title="Judging Jank on the App Side"></a>Judging Jank on the App Side</h2><p>Theoretically, the app in the following trace appears to drop a frame because its main thread drawing time exceeds 16.6ms. However, this isn’t necessarily a jank. Due to <code>BufferQueue</code> and Triple Buffer, <code>SurfaceFlinger</code> might already have a prepared buffer from a previous frame to composite.</p><p><img src="/en/images/15764245549172.jpg"></p><p><strong>Therefore, you cannot definitively judge jank from the App-side trace alone; you must check the <code>SurfaceFlinger</code>-side trace.</strong></p><h2 id="Judging-Jank-on-the-SurfaceFlinger-Side"><a href="#Judging-Jank-on-the-SurfaceFlinger-Side" class="headerlink" title="Judging Jank on the SurfaceFlinger Side"></a>Judging Jank on the SurfaceFlinger Side</h2><p><img src="/en/images/15764245828175.jpg"></p><p>In <code>SurfaceFlinger</code>, you can see the main thread’s composition status and the buffer count in the app’s corresponding <code>BufferQueue</code>. The image above shows a clear jank: the app didn’t render in time, and the <code>BufferQueue</code> was empty, so <code>SurfaceFlinger</code> didn’t composite the app’s layer for that frame.</p><p>In the <em>first</em> image, where we said it’s hard to tell from the App side, the corresponding <code>SurfaceFlinger</code> trace is shown below. Thanks to Triple Buffer, SF has a buffer available from the app, so even though the app’s frame took over 16.6ms, SF still composited a buffer, and no jank occurred.</p><p><img src="/en/images/15764245923282.jpg" alt="SurfaceFlinger"></p><h2 id="Logical-Jank"><a href="#Logical-Jank" class="headerlink" title="Logical Jank"></a>Logical Jank</h2><p>While the rendering-related jank above is easily spotted in Systrace, <strong>logical jank</strong> also exists.</p><p><strong>Logical jank</strong> occurs when the app’s code logic results in non-uniform or jerky visual updates, even if rendering and composition happen in time. Systrace won’t show this, but users will feel it.</p><p>For example, when scrolling a list, a perfect experience has the list advancing along a smooth, decaying curve after release. If the list jumps 20 pixels, then 10, then 30, it will feel jittery even if every frame completes within 16.6ms. Android optimizes for this in <code>android/view/animation/AnimationUtils.java</code>; specifically, check these methods:</p><figure class="highlight java"><table><tr><td class="gutter"><pre><span class="line">1</span><br><span class="line">2</span><br><span class="line">3</span><br></pre></td><td class="code"><pre><span class="line"><span class="keyword">public</span> <span class="keyword">static</span> <span class="keyword">void</span> <span class="title function_">lockAnimationClock</span><span class="params">(<span class="type">long</span> vsyncMillis)</span></span><br><span class="line"><span class="keyword">public</span> <span class="keyword">static</span> <span class="keyword">void</span> <span class="title function_">unlockAnimationClock</span><span class="params">()</span></span><br><span class="line"><span class="keyword">public</span> <span class="keyword">static</span> <span class="type">long</span> <span class="title function_">currentAnimationTimeMillis</span><span class="params">()</span></span><br></pre></td></tr></table></figure><p>System animations rarely have this issue, but developers might inadvertently write such code—for instance, calculating animation properties based on <strong>real-time clock</strong> instead of the <strong>Vsync arrival time</strong>. In such cases, any rendering delay leads to uneven animation steps.</p><p>Dropped frames have many causes. Refer to these three articles:</p><ol><li><a href="https://www.androidperformance.com/en/2019/09/05/Android-Jank-Debug/">Overview of Jank Causes in Android - Methodology</a></li><li><a href="https://www.androidperformance.com/en/2019/09/05/Android-Jank-Due-To-System/">Overview of Jank Causes in Android - System Side</a></li><li><a href="https://www.androidperformance.com/en/2019/09/05/Android-Jank-Due-To-App/">Overview of Jank Causes in Android - App Side</a></li></ol><p><a id="bq-tb"></a></p><h1 id="BufferQueue-and-Triple-Buffer"><a href="#BufferQueue-and-Triple-Buffer" class="headerlink" title="BufferQueue and Triple Buffer"></a>BufferQueue and Triple Buffer</h1><h2 id="BufferQueue"><a href="#BufferQueue" class="headerlink" title="BufferQueue"></a>BufferQueue</h2><p><code>BufferQueue</code> uses a Producer-Consumer model. Typically, the Consumer creates and owns the <code>BufferQueue</code> data structure, while the Producer exists in a different process.</p><p><img src="/en/images/15764246330689.jpg"></p><p>Operating logic:</p><ol><li>When a Producer needs a buffer, it calls <code>dequeueBuffer()</code>, specifying dimensions and format, to request a buffer from <code>BufferQueue</code>.</li><li>The Producer fills the buffer and calls <code>queueBuffer()</code> to return it to the queue.</li><li>The Consumer calls <code>acquireBuffer()</code> to take and consume the content.</li><li>Once finished, the Consumer calls <code>releaseBuffer()</code> to return it to the queue.</li></ol><p>Android uses Vsync to control these flows. For details, see:</p><ol><li><a href="https://www.androidperformance.com/en/2019/12/01/Android-Systrace-Vsync/">Systrace Basics - Vsync Explained</a></li><li><a href="https://www.androidperformance.com/en/2019/10/22/Android-Choreographer/">Detailed Explanation of Android Rendering Mechanism Based on Choreographer</a></li></ol><p>In app rendering, the <strong>App is the Producer</strong> and <strong>SurfaceFlinger is the Consumer</strong>:</p><ol><li><strong>App</strong> calls <code>dequeueBuffer()</code> to request a buffer.</li><li><strong>App</strong> renders (via CPU or GPU) and calls <code>queueBuffer()</code> to return it.</li><li><strong>SurfaceFlinger</strong> receives a Vsync signal, calls <code>acquireBuffer()</code> to take the buffer, and performs composition.</li><li><strong>SurfaceFlinger</strong> calls <code>releaseBuffer()</code> to return it after composition.</li></ol><p>The number of buffers in the <code>BufferQueue</code> significantly affects performance. Let’s analyze single, double, and triple buffering.</p><h2 id="Single-Buffer"><a href="#Single-Buffer" class="headerlink" title="Single Buffer"></a>Single Buffer</h2><p>With only one buffer, it must be used for both composition and rendering simultaneously.</p><p><img src="/en/images/15764246600451.jpg" alt="Single Buffer"></p><p>Ideally, this could work with Vsync-Offset:</p><ol><li>App receives Vsync and starts rendering.</li><li>After Vsync-Offset, <code>SurfaceFlinger</code> receives Vsync and composites.</li><li>Screen refreshes to show the frame.</li></ol><p><img src="/en/images/15764246714403.jpg" alt="Single Buffer"></p><p>However, if rendering or composition isn’t finished before the refresh, the user sees an incomplete buffer—manifesting as screen tearing.</p><p><img src="/en/images/15764246782401.jpg" alt="Single Buffer"></p><p>Single buffering is no longer used; this is purely illustrative.</p><h2 id="Double-Buffer"><a href="#Double-Buffer" class="headerlink" title="Double Buffer"></a>Double Buffer</h2><p>Double buffering provides two alternately rotating buffers. While the Consumer uses one, the Producer can use the spare.</p><p><img src="/en/images/15764246889873.jpg" alt="Double Buffer"></p><p>Ideal double buffering workflow:</p><p><img src="/en/images/DoubleBufferPipline_NoJank.webp" alt="DoubleBufferPipline_NoJank"></p><p>However, if an app’s production consistently exceeds Vsync cycles (missing SF’s composition window), jank occurs:</p><p><img src="/en/images/15764247063129.jpg" alt="Double Buffer"></p><h2 id="Triple-Buffer"><a href="#Triple-Buffer" class="headerlink" title="Triple Buffer"></a>Triple Buffer</h2><p>Triple buffering adds a BackBuffer, allowing three buffers to rotate. While <code>FrontBuffer</code> is in use, the app has <em>two</em> idle buffers. Even if the GPU times out, the CPU can still take a fresh buffer for production (<strong>SF consumes FrontBuffer, GPU uses one BackBuffer, CPU uses another BackBuffer</strong>).</p><p><img src="/en/images/15764247163985.jpg" alt="Triple Buffer"></p><p>Triple buffering solves the jank caused by buffer shortages in double buffering:</p><p><img src="/en/images/TripleBufferPipline_NoJank.webp" alt="TripleBufferPipline_NoJank"></p><p>Comparison (Double Buffer janks twice; Triple Buffer janks once):</p><p><img src="/en/images/TripleBuffer_VS_DoubleBuffer.webp" alt="TripleBuffer_VS_DoubleBuffer"></p><p><a id="effects"></a></p><h1 id="The-Role-of-Triple-Buffer"><a href="#The-Role-of-Triple-Buffer" class="headerlink" title="The Role of Triple Buffer"></a>The Role of Triple Buffer</h1><h2 id="Mitigating-Jank"><a href="#Mitigating-Jank" class="headerlink" title="Mitigating Jank"></a>Mitigating Jank</h2><p>As shown in the comparison, triple buffering helps reduce the frequency of jank during consecutive main thread timeouts (reducing two janks to one). This is why an app-side timeout doesn’t always result in a user-perceived jank in <code>SurfaceFlinger</code>.</p><p><img src="/en/images/15764247460509.jpg" alt="Mitigating Jank"></p><h2 id="Reducing-Wait-Times"><a href="#Reducing-Wait-Times" class="headerlink" title="Reducing Wait Times"></a>Reducing Wait Times</h2><p>In <strong>Double Buffering</strong>, the app’s main thread must sometimes wait for <code>SurfaceFlinger</code> to release a buffer before it can start production. Since most phones receive Vsync signals for SF and App simultaneously, this delay shortens the available time for the main thread:</p><p><img src="/en/images/15764247531355.jpg" alt="Reducing Wait Times"></p><p>In Systrace, this appears as:</p><p><img src="/en/images/15764247599570.jpg" alt="Reducing Wait Times"></p><p>With <strong>Triple Buffering</strong>, this wait rarely occurs. The rendering thread can smoothly <code>dequeueBuffer</code> and begin work immediately.</p><h2 id="Lowering-GPU-and-SurfaceFlinger-Bottlenecks"><a href="#Lowering-GPU-and-SurfaceFlinger-Bottlenecks" class="headerlink" title="Lowering GPU and SurfaceFlinger Bottlenecks"></a>Lowering GPU and SurfaceFlinger Bottlenecks</h2><p>In double buffering, any GPU timeout easily prevents <code>SurfaceFlinger</code> from compositing in time, causing jank. Triple buffering allows app buffers to enter the queue earlier for GPU rendering (without waiting), effectively lowering thresholds. It also reduces <code>dequeueBuffer</code> wait times when <code>SurfaceFlinger</code> itself is heavily loaded.</p><p>Below are traces showing <strong>Double Buffering jank</strong> caused by high <code>SurfaceFlinger</code> load and delayed <code>dequeueBuffer</code> responses. These issues mostly disappear with Triple Buffering.</p><p><img src="/en/images/15764247685189.jpg"></p><p><img src="/en/images/15764247751046.jpg"></p><p><a id="debug"></a></p><h1 id="Debugging-Triple-Buffer"><a href="#Debugging-Triple-Buffer" class="headerlink" title="Debugging Triple Buffer"></a>Debugging Triple Buffer</h1><h2 id="Dumpsys-SurfaceFlinger"><a href="#Dumpsys-SurfaceFlinger" class="headerlink" title="Dumpsys SurfaceFlinger"></a>Dumpsys SurfaceFlinger</h2><p><code>dumpsys SurfaceFlinger</code> provides status, performance metrics, buffer states, and layer info. Below is a snippet showing buffer usage; apps under different loads use Triple Buffering differently:</p><p><img src="/en/images/15764247853726.jpg"></p><h2 id="Disabling-Triple-Buffer"><a href="#Disabling-Triple-Buffer" class="headerlink" title="Disabling Triple Buffer"></a>Disabling Triple Buffer</h2><p>Properties vary across Android versions (a logic bug fixed in Android 10).</p><h3 id="Android-Version-lt-x3D-Android-P"><a href="#Android-Version-lt-x3D-Android-P" class="headerlink" title="Android Version &lt;&#x3D; Android P"></a>Android Version &lt;&#x3D; Android P</h3><figure class="highlight cpp"><table><tr><td class="gutter"><pre><span class="line">1</span><br><span class="line">2</span><br><span class="line">3</span><br></pre></td><td class="code"><pre><span class="line"><span class="comment">// Logic</span></span><br><span class="line"><span class="built_in">property_get</span>(<span class="string">&quot;ro.sf.disable_triple_buffer&quot;</span>, value, <span class="string">&quot;1&quot;</span>);</span><br><span class="line">mLayerTripleBufferingDisabled = <span class="built_in">atoi</span>(value);</span><br></pre></td></tr></table></figure><p><strong>Modify and restart Framework (requires Root):</strong></p><figure class="highlight shell"><table><tr><td class="gutter"><pre><span class="line">1</span><br><span class="line">2</span><br><span class="line">3</span><br></pre></td><td class="code"><pre><span class="line">adb root</span><br><span class="line">adb shell setprop ro.sf.disable_triple_buffer 0</span><br><span class="line">adb shell stop &amp;&amp; adb shell start</span><br></pre></td></tr></table></figure><h3 id="Android-Version-gt-Android-P"><a href="#Android-Version-gt-Android-P" class="headerlink" title="Android Version &gt; Android P"></a>Android Version &gt; Android P</h3><figure class="highlight cpp"><table><tr><td class="gutter"><pre><span class="line">1</span><br><span class="line">2</span><br><span class="line">3</span><br></pre></td><td class="code"><pre><span class="line"><span class="comment">// Logic</span></span><br><span class="line"><span class="built_in">property_get</span>(<span class="string">&quot;ro.sf.disable_triple_buffer&quot;</span>, value, <span class="string">&quot;0&quot;</span>);</span><br><span class="line">mLayerTripleBufferingDisabled = <span class="built_in">atoi</span>(value);</span><br></pre></td></tr></table></figure><p><strong>Modify and restart Framework (requires Root):</strong></p><figure class="highlight shell"><table><tr><td class="gutter"><pre><span class="line">1</span><br><span class="line">2</span><br><span class="line">3</span><br></pre></td><td class="code"><pre><span class="line">adb root</span><br><span class="line">adb shell setprop ro.sf.disable_triple_buffer 1</span><br><span class="line">adb shell stop &amp;&amp; adb shell start</span><br></pre></td></tr></table></figure><p><a id="refs"></a></p><h1 id="References"><a href="#References" class="headerlink" title="References"></a>References</h1><ol><li><a href="https://source.android.google.cn/devices/graphics">Android Graphics</a></li></ol><p><a id="attachments"></a></p><h1 id="Attachments"><a href="#Attachments" class="headerlink" title="Attachments"></a>Attachments</h1><p>Systrace attachments are available for download. Extract and open in <strong>Chrome</strong>:<br><a href="https://github.com/Gracker/SystraceForBlog/tree/master/Android_Systrace_TripleBuffer">Download Systrace attachments for this article</a></p><p><a id="about"></a></p><h1 id="About-Me-amp-amp-Blog"><a href="#About-Me-amp-amp-Blog" class="headerlink" title="About Me &amp;&amp; Blog"></a>About Me &amp;&amp; Blog</h1><p>Below is my personal intro and related links. I look forward to exchanging ideas with fellow professionals. “When three walk together, one can always be my teacher!”</p><ol><li><a href="https://www.androidperformance.com/en/about/">Blogger Intro</a>: Includes personal WeChat and WeChat group links.</li><li><a href="https://www.androidperformance.com/en/2019/12/01/BlogMap/">Blog Content Navigation</a>: A guide for my blog content.</li><li><a href="https://www.androidperformance.com/en/2018/05/07/Android-performance-optimization-skills-and-tools/">Curated Excellent Blog Articles - Android Performance Optimization Must-Knows</a>: Welcome to recommend projects&#x2F;articles.</li><li><a href="https://www.androidperformance.com/en/2023/12/30/the-performance/">Android Performance Optimization Knowledge Planet</a>: Welcome to join and thank you for your support~</li></ol><blockquote><p><strong>One walks faster alone, but a group walks further together.</strong></p></blockquote><p><img src="/en/images/WechatIMG581.webp" alt="Scan WeChat QR Code"></p>]]></content>
    
    
    <summary type="html">&lt;p&gt;This is the eleventh article in the Systrace series, providing a brief introduction to Triple Buffer within Systrace. It covers how to identify jank in Systrace, perform preliminary localization and analysis, and explains the impact of Triple Buffer on performance.&lt;/p&gt;
&lt;p&gt;The purpose of this series is to view the overall operation of the Android system from a different perspective using Systrace, while also providing an alternative angle for learning the Framework. Perhaps you’ve read many articles about the Framework but can never remember the code, or you’re unclear about the execution flow. Maybe from Systrace’s graphical perspective, you can gain a deeper understanding.&lt;/p&gt;</summary>


    <category term="Android" scheme="https://androidperformance.com/en/categories/Android/"/>
    
    
    <category term="Android" scheme="https://androidperformance.com/en/tags/Android/"/>
    
    <category term="Systrace" scheme="https://androidperformance.com/en/tags/Systrace/"/>
    
    <category term="Startup" scheme="https://androidperformance.com/en/tags/Startup/"/>
    
    <category term="Jank" scheme="https://androidperformance.com/en/tags/Jank/"/>
    
    <category term="Performance" scheme="https://androidperformance.com/en/tags/Performance/"/>
    
  </entry>
  
  <entry>
    <title>Android Systrace Basics - Binder and Lock Contention Explained</title>
    <link href="https://androidperformance.com/en/2019/12/06/Android-Systrace-Binder/"/>
    <id>https://androidperformance.com/en/2019/12/06/Android-Systrace-Binder/</id>
    <published>2019-12-06T11:12:34.000Z</published>
    <updated>2026-05-10T23:29:51.059Z</updated>
    
    <content type="html"><![CDATA[<p>This is the tenth article in the Systrace series, primarily providing a brief introduction to Binder and lock information in Systrace. It covers the basic situation of Binder, the representation of Binder communication in Systrace, how to view Binder information, and analysis of lock contention in <code>SystemServer</code>.</p><p>The purpose of this series is to view the overall operation of the Android system from a different perspective using Systrace, while also providing an alternative angle for learning the Framework. Perhaps you’ve read many articles about the Framework but can never remember the code, or you’re unclear about the execution flow. Maybe from Systrace’s graphical perspective, you can gain a deeper understanding.</p><span id="more"></span><h2 id="Table-of-Contents"><a href="#Table-of-Contents" class="headerlink" title="Table of Contents"></a>Table of Contents</h2><ul><li><a href="#series">Series Article Index</a></li><li><a href="#overview">Binder Overview</a></li><li><a href="#diagram">Binder Call Diagram</a></li><li><a href="#locks">Lock Information in Systrace</a></li><li><a href="#waiting">Waiting for Lock Analysis</a></li><li><a href="#code">Related Code</a></li><li><a href="#refs">References</a></li><li><a href="#attachments">Attachments</a></li><li><a href="#about">About Me &amp;&amp; Blog</a></li></ul><p><a id="series"></a></p><h1 id="Series-Article-Index"><a href="#Series-Article-Index" class="headerlink" title="Series Article Index"></a>Series Article Index</h1><ol><li><a href="https://www.androidperformance.com/en/2019/05/28/Android-Systrace-About/">Introduction to Systrace</a></li><li><a href="https://www.androidperformance.com/en/2019/07/23/Android-Systrace-Pre/">Systrace Basics - Prerequisites for Systrace</a></li><li><a href="https://www.androidperformance.com/en/2019/05/27/why-60-fps/">Systrace Basics - Why 60 fps?</a></li><li><a href="https://www.androidperformance.com/en/2019/06/29/Android-Systrace-SystemServer/">Android Systrace Basics - SystemServer Explained</a></li><li><a href="https://www.androidperformance.com/en/2020/02/14/Android-Systrace-SurfaceFlinger/">Systrace Basics - SurfaceFlinger Explained</a></li><li><a href="https://www.androidperformance.com/en/2019/11/04/Android-Systrace-Input/">Systrace Basics - Input Explained</a></li><li><a href="https://www.androidperformance.com/en/2019/12/01/Android-Systrace-Vsync/">Systrace Basics - Vsync Explained</a></li><li><a href="https://www.androidperformance.com/en/2019/10/22/Android-Choreographer/">Systrace Basics - Vsync-App: Detailed Explanation of Choreographer-Based Rendering Mechanism</a></li><li><a href="https://www.androidperformance.com/en/2019/11/06/Android-Systrace-MainThread-And-RenderThread/">Systrace Basics - MainThread and RenderThread Explained</a></li><li><a href="https://www.androidperformance.com/en/2019/12/06/Android-Systrace-Binder/">Systrace Basics - Binder and Lock Contention Explained</a></li><li><a href="https://www.androidperformance.com/en/2019/12/15/Android-Systrace-Triple-Buffer">Systrace Basics - Triple Buffer Explained</a></li><li><a href="https://www.androidperformance.com/en/2019/12/21/Android-Systrace-CPU">Systrace Basics - CPU Info Explained</a></li><li><a href="https://www.androidperformance.com/en/2021/04/24/android-systrace-smooth-in-action-1/">Systrace Smoothness in Action 1: Understanding Jank Principles</a></li><li><a href="https://www.androidperformance.com/en/2021/04/24/android-systrace-smooth-in-action-2/">Systrace Smoothness in Action 2: Case Analysis - MIUI Launcher Scroll Jank Analysis</a></li><li><a href="https://www.androidperformance.com/en/2021/04/24/android-systrace-smooth-in-action-3/">Systrace Smoothness in Action 3: FAQs During Jank Analysis</a></li><li><a href="https://www.androidperformance.com/en/2021/09/13/android-systrace-Responsiveness-in-action-1/">Systrace Responsiveness in Action 1: Understanding Responsiveness Principles</a></li><li><a href="https://www.androidperformance.com/en/2021/09/13/android-systrace-Responsiveness-in-action-2/">Systrace Responsiveness in Action 2: Responsiveness Analysis - Using App Startup as an Example</a></li><li><a href="https://www.androidperformance.com/en/2021/09/13/android-systrace-Responsiveness-in-action-3/">Systrace Responsiveness in Action 3: Extended Knowledge on Responsiveness</a></li><li><a href="https://www.androidperformance.com/en/2022/01/21/android-systrace-cpu-state-runnable/">Systrace Thread CPU State Analysis Tips - Runnable</a></li><li><a href="https://www.androidperformance.com/en/2022/03/13/android-systrace-cpu-state-running/">Systrace Thread CPU State Analysis Tips - Running</a></li><li><a href="https://www.androidperformance.com/en/2022/03/13/android-systrace-cpu-state-sleep/">Systrace Thread CPU State Analysis Tips - Sleep and Uninterruptible Sleep</a></li></ol><p><a id="overview"></a></p><h1 id="Binder-Overview"><a href="#Binder-Overview" class="headerlink" title="Binder Overview"></a>Binder Overview</h1><p>This article maps to <a href="https://www.androidperformance.com/en/2025/11/16/Android-Perfetto-10-Binder/">Perfetto 10: Binder scheduling and lock contention</a>. In old Systrace, Binder analysis mainly used Flow Events, Binder slices, and lock-contention text to identify caller and callee. In Perfetto, the same relationship still matters, but the evidence is distributed across Binder slices, thread states, CPU scheduling, flow relationships, and SQL queries.</p><p>When analyzing Binder-related jank today, first use the old method to establish the call relationship: who called whom, how long the call took, and what the caller was waiting for. Then continue with the current Perfetto workflow: check whether the caller slept waiting for Binder return, whether the callee was running, whether it queued behind a SystemServer lock, whether the Binder thread pool was busy, and whether CPU was saturated at the same time. This separates “Binder is slow” into remote execution time, lock contention, Binder thread-pool queueing, and CPU scheduling delay.</p><p>Most inter-process communication in Android uses Binder. I won’t provide an over-explanation of Binder here. If you want a deep understanding of Binder’s implementation, I recommend reading these three articles:</p><ol><li><a href="https://paul.pub/android-binder-driver/">Understanding Android Binder Mechanism 1&#x2F;3: Driver Layer</a></li><li><a href="https://paul.pub/android-binder-cpp/">Understanding Android Binder Mechanism 2&#x2F;3: C++ Layer</a></li><li><a href="https://paul.pub/android-binder-java/">Understanding Android Binder Mechanism 3&#x2F;3: Java Layer</a></li></ol><p><strong>The reason for discussing Binder and locks in Systrace separately is that many jank and responsiveness issues stem from cross-process Binder communication. Lock contention can extend Binder communication time, affecting the calling end. A classic example is when an app’s rendering thread calls <code>dequeueBuffer</code>, and the <code>SurfaceFlinger</code> main thread is blocked, causing the <code>dequeueBuffer</code> to take longer and resulting in app jank. Another example is when <code>AMS</code> or <code>WMS</code> methods in <code>SystemServer</code> are holding locks, causing long wait times for app calls.</strong></p><p>Here is a Binder architecture diagram from an article. This piece focuses on Systrace, so we’ll cover how Binder appears in Systrace without diving into its internal implementation.</p><p><img src="/en/images/15756309069397.jpg"></p><p><a id="diagram"></a></p><h1 id="Binder-Call-Diagram"><a href="#Binder-Call-Diagram" class="headerlink" title="Binder Call Diagram"></a>Binder Call Diagram</h1><p>Binder is primarily used for cross-process communication. The diagram below simply shows how Binder communication is displayed in Systrace:</p><p><img src="/en/images/15756309176435.jpg"></p><p>In the diagram, the <code>SystemServer</code> process is communicating with Qualcomm’s <code>perf</code> process. Enabling <strong>Flow Events</strong> in the <code>ViewOptions</code> in the top right corner of Systrace will reveal Binder information.</p><p><img src="/en/images/15756309267278.jpg"></p><p>Clicking on a Binder event reveals detailed information. Some of this data is useful during problem analysis, but we won’t go into detail here.</p><p><img src="/en/images/15756309336019.jpg"></p><p>For Binder, this section focuses on how to view <strong>lock information</strong> and <strong>lock waiting</strong> in Systrace. Analyzing many jank and responsiveness issues depends on interpreting this information. Ultimately, you’ll need to return to the code: once an issue is identified, read the source code to understand the logic and perform appropriate optimizations.</p><p><a id="locks"></a></p><h1 id="Lock-Information-in-Systrace"><a href="#Lock-Information-in-Systrace" class="headerlink" title="Lock Information in Systrace"></a>Lock Information in Systrace</h1><p><img src="/en/images/15756309429683.jpg"></p><p><strong>monitor contention with owner Binder:1605_B (4667) at void com.android.server.wm.ActivityTaskManagerService.activityPaused(android.os.IBinder)(ActivityTaskManagerService.java:1733) waiters&#x3D;2 blocking from android.app.ActivityManager$StackInfo com.android.server.wm.ActivityTaskManagerService.getFocusedStackInfo()(ActivityTaskManagerService.java:2064)</strong></p><p>Let’s break the above message into two parts, using <strong>blocking</strong> as the dividing line.</p><h2 id="Part-1-Interpretation"><a href="#Part-1-Interpretation" class="headerlink" title="Part 1 Interpretation"></a>Part 1 Interpretation</h2><p><strong>monitor contention with owner Binder:1605_B (4667) at void com.android.server.wm.ActivityTaskManagerService.activityPaused(android.os.IBinder)(ActivityTaskManagerService.java:1733) waiters&#x3D;2</strong></p><p><strong>Monitor</strong> refers to the current pool for the lock object. In Java, every object has two pools: a lock (monitor) pool and a wait pool.</p><p><strong>Lock Pool</strong> (Synchronized Queue): Suppose thread A already owns the lock of an object (not a class). Other threads wanting to call a <code>synchronized</code> method (or block) on this object must first acquire ownership of that object’s lock. Since thread A currently owns it, these other threads enter the object’s lock pool.</p><p>The word <strong>contention</strong> is used here, meaning there’s a struggle because the object’s lock is currently held by another object (Owner), so ownership cannot be acquired, and the thread enters the lock pool.</p><p><strong>Owner</strong>: The object currently <strong>possessing</strong> the lock for this object. Here, it’s <code>Binder:1605_B</code>, with thread ID <code>4667</code>.</p><p><strong>at</strong>: Describes what the <strong>Owner</strong> thread is currently doing. Here, it’s executing the <code>void com.android.server.wm.ActivityTaskManagerService.activityPaused</code> method. The code location is <code>ActivityTaskManagerService.java:1733</code>. The corresponding code is:</p><p><code>com/android/server/wm/ActivityTaskManagerService.java</code></p><figure class="highlight java"><table><tr><td class="gutter"><pre><span class="line">1</span><br><span class="line">2</span><br><span class="line">3</span><br><span class="line">4</span><br><span class="line">5</span><br><span class="line">6</span><br><span class="line">7</span><br><span class="line">8</span><br><span class="line">9</span><br><span class="line">10</span><br><span class="line">11</span><br></pre></td><td class="code"><pre><span class="line"><span class="meta">@Override</span></span><br><span class="line"><span class="keyword">public</span> <span class="keyword">final</span> <span class="keyword">void</span> <span class="title function_">activityPaused</span><span class="params">(IBinder token)</span> &#123;</span><br><span class="line">    <span class="keyword">final</span> <span class="type">long</span> <span class="variable">origId</span> <span class="operator">=</span> Binder.clearCallingIdentity();</span><br><span class="line">    <span class="keyword">synchronized</span> (mGlobalLock) &#123; <span class="comment">// Line 1733 is here</span></span><br><span class="line">        <span class="type">ActivityStack</span> <span class="variable">stack</span> <span class="operator">=</span> ActivityRecord.getStackLocked(token);</span><br><span class="line">        <span class="keyword">if</span> (stack != <span class="literal">null</span>) &#123;</span><br><span class="line">            stack.activityPausedLocked(token, <span class="literal">false</span>);</span><br><span class="line">        &#125;</span><br><span class="line">    &#125;</span><br><span class="line">    Binder.restoreCallingIdentity(origId);</span><br><span class="line">&#125;</span><br></pre></td></tr></table></figure><p>We can see <code>synchronized (mGlobalLock)</code> acquires the ownership of the <code>mGlobalLock</code> lock. Until it releases the lock, any other place calling <code>synchronized (mGlobalLock)</code> must wait in the lock pool.</p><p><strong>waiters</strong>: The number of operations currently waiting in the lock pool for the object’s lock. <code>waiters=2</code> indicates there’s already one operation waiting for the lock, so adding this one makes a total of three.</p><h2 id="Part-2-Interpretation"><a href="#Part-2-Interpretation" class="headerlink" title="Part 2 Interpretation"></a>Part 2 Interpretation</h2><p><strong>blocking from android.app.ActivityManager$StackInfo com.android.server.wm.ActivityTaskManagerService.getFocusedStackInfo()(ActivityTaskManagerService.java:2064)</strong></p><p>The second part is simpler: it identifies the method currently being blocked while waiting for the lock. Here, <code>ActivityManager</code>‘s <code>getFocusedStackInfo</code> is blocked. The corresponding code is:</p><p><code>com/android/server/wm/ActivityTaskManagerService.java</code></p><figure class="highlight java"><table><tr><td class="gutter"><pre><span class="line">1</span><br><span class="line">2</span><br><span class="line">3</span><br><span class="line">4</span><br><span class="line">5</span><br><span class="line">6</span><br><span class="line">7</span><br><span class="line">8</span><br><span class="line">9</span><br><span class="line">10</span><br><span class="line">11</span><br><span class="line">12</span><br><span class="line">13</span><br><span class="line">14</span><br><span class="line">15</span><br><span class="line">16</span><br></pre></td><td class="code"><pre><span class="line"><span class="meta">@Override</span></span><br><span class="line"><span class="keyword">public</span> ActivityManager.StackInfo <span class="title function_">getFocusedStackInfo</span><span class="params">()</span> <span class="keyword">throws</span> RemoteException &#123;</span><br><span class="line">    enforceCallerIsRecentsOrHasPermission(MANAGE_ACTIVITY_STACKS, <span class="string">&quot;getStackInfo()&quot;</span>);</span><br><span class="line">    <span class="type">long</span> <span class="variable">ident</span> <span class="operator">=</span> Binder.clearCallingIdentity();</span><br><span class="line">    <span class="keyword">try</span> &#123;</span><br><span class="line">        <span class="keyword">synchronized</span> (mGlobalLock) &#123; <span class="comment">// Line 2064 is here</span></span><br><span class="line">            <span class="type">ActivityStack</span> <span class="variable">focusedStack</span> <span class="operator">=</span> getTopDisplayFocusedStack();</span><br><span class="line">            <span class="keyword">if</span> (focusedStack != <span class="literal">null</span>) &#123;</span><br><span class="line">                <span class="keyword">return</span> mRootActivityContainer.getStackInfo(focusedStack.mStackId);</span><br><span class="line">            &#125;</span><br><span class="line">            <span class="keyword">return</span> <span class="literal">null</span>;</span><br><span class="line">        &#125;</span><br><span class="line">    &#125; <span class="keyword">finally</span> &#123;</span><br><span class="line">        Binder.restoreCallingIdentity(ident);</span><br><span class="line">    &#125;</span><br><span class="line">&#125;</span><br></pre></td></tr></table></figure><p>This also calls <code>synchronized (mGlobalLock)</code> (Note: The original text might have varied between <code>mGlobalLock</code> and <code>ActivityManagerService.this</code> due to Android versions, but the principle is the same), requiring wait for the ownership of the object’s lock.</p><h2 id="Summary"><a href="#Summary" class="headerlink" title="Summary"></a>Summary</h2><p>The above message translates to:</p><p><strong>The <code>getFocusedStackInfo</code> method of <code>ActivityTaskManagerService</code> was blocked during execution because it couldn’t acquire ownership of the synchronization object’s lock when executing a synchronized block. It must wait until another method, <code>ActivityTaskManagerService.activityPaused</code>, which currently owns the lock, finishes execution before it can acquire ownership and continue.</strong></p><p>Compare with the original text:</p><p><strong>monitor contention with owner Binder:1605_B (4667)<br>at void com.android.server.wm.ActivityTaskManagerService.activityPaused(android.os.IBinder)(ActivityTaskManagerService.java:1733)<br>waiters&#x3D;2<br>blocking from android.app.ActivityManager$StackInfo com.android.server.wm.ActivityTaskManagerService.getFocusedStackInfo()(ActivityTaskManagerService.java:2064)</strong></p><p><a id="waiting"></a></p><h1 id="Waiting-for-Lock-Analysis"><a href="#Waiting-for-Lock-Analysis" class="headerlink" title="Waiting for Lock Analysis"></a>Waiting for Lock Analysis</h1><p>In the same Systrace, the Binder info shows <code>waiters=2</code>, meaning two operations preceded this one in waiting for the lock release. This sums to three operations waiting for <code>Binder:1605_B (4667)</code> to release the lock. Let’s look at the execution of <code>Binder:1605_B</code>:</p><p><img src="/en/images/15756309846544.jpg"></p><p>The diagram shows <code>Binder:1605_B</code> executing <code>activityPaused</code>, with some other Binder operations in between, before finally releasing the lock upon completion.</p><p>Now let’s trace the execution order, including the two <strong>waiters</strong>:</p><h2 id="Lock-Waiting"><a href="#Lock-Waiting" class="headerlink" title="Lock Waiting"></a>Lock Waiting</h2><p><img src="/en/images/15756309922668.jpg"></p><p>The diagram illustrates the contention for the <code>mGlobalLock</code> object lock:</p><ol><li><code>Binder_1605_B</code> first begins executing <strong>activityPaused</strong>, which requires the <code>mGlobalLock</code> lock. Since there’s no current contention, <code>activityPaused</code> acquires the lock and starts.</li><li>The <code>android.display</code> thread starts executing the <strong>checkVisibility</strong> method, which also needs the <code>mGlobalLock</code> lock. Since <code>Binder_1605_B</code> holds it, <code>checkVisibility</code> waits and enters a sleep state.</li><li>The <code>android.anim</code> thread starts executing <strong>relayoutWindow</strong>, also needing the <code>mGlobalLock</code> lock. Since <code>Binder_1605_B</code> holds it, it also waits and enters sleep.</li><li>The <code>android.bg</code> thread starts <strong>getFocusedStackInfo</strong>, also needing the lock. It also waits and sleeps.</li></ol><p>After these four steps, <code>Binder_1605_B</code> is running while the other three threads failed to acquire the <code>mGlobalLock</code> lock and are sleeping, waiting for <code>Binder_1605_B</code> to finish and release the lock.</p><h2 id="Lock-Release"><a href="#Lock-Release" class="headerlink" title="Lock Release"></a>Lock Release</h2><p><img src="/en/images/15756310021037.jpg"></p><p>This diagram shows the lock release and subsequent flow:</p><ol><li><code>Binder_1605_B</code>‘s <strong>activityPaused</strong> finishes, and the <code>mGlobalLock</code> lock is released.</li><li>The first waiting thread, <code>android.display</code>, starts executing <strong>checkVisibility</strong>. Its wakeup info shows it was woken by <code>Binder_1605_B (4667)</code>.</li><li><code>checkVisibility</code> finishes, and the lock is released.</li><li>The second waiting thread, <code>android.anim</code>, starts <strong>relayoutWindow</strong>. Its wakeup info shows it was woken by <code>android.display (1683)</code>.</li><li><code>relayoutWindow</code> finishes, and the lock is released.</li><li>The third waiting thread, <code>android.bg</code>, starts <strong>getFocusedStackInfo</strong>. It was woken by <code>android.anim (1684)</code>.</li></ol><p>After these 6 steps, this round of lock waiting caused by <code>mGlobalLock</code> concludes. This is a simple example; in practice, Binder lock waiting in <code>SystemServer</code> can be very severe, with <code>waiters</code> often reaching 7-10—quite alarming, as seen below:</p><p><img src="/en/images/15756310119592.jpg"></p><p>This explains why the system can become laggy after many apps are installed or after prolonged use. A brief period of this can also occur after a reboot.</p><p>If you’re unsure how to view wakeup information, refer to this article: <a href="https://www.androidperformance.com/en/2019/07/23/Android-Systrace-Pre/#%E8%BF%9B%E7%A8%8B%E5%94%A4%E9%86%92%E4%BF%A1%E6%81%AF%E5%88%86%E6%9E%90">Analyzing Process Wakeup Information in Systrace</a>.</p><p><a id="code"></a></p><h1 id="Related-Code"><a href="#Related-Code" class="headerlink" title="Related Code"></a>Related Code</h1><h3 id="Monitor-Info"><a href="#Monitor-Info" class="headerlink" title="Monitor Info"></a>Monitor Info</h3><p><code>art/runtime/monitor.cc</code></p><figure class="highlight cc"><table><tr><td class="gutter"><pre><span class="line">1</span><br><span class="line">2</span><br><span class="line">3</span><br><span class="line">4</span><br><span class="line">5</span><br><span class="line">6</span><br><span class="line">7</span><br><span class="line">8</span><br><span class="line">9</span><br><span class="line">10</span><br><span class="line">11</span><br><span class="line">12</span><br><span class="line">13</span><br><span class="line">14</span><br><span class="line">15</span><br><span class="line">16</span><br><span class="line">17</span><br><span class="line">18</span><br><span class="line">19</span><br><span class="line">20</span><br></pre></td><td class="code"><pre><span class="line"><span class="function">std::string <span class="title">Monitor::PrettyContentionInfo</span><span class="params">(<span class="type">const</span> std::string&amp; owner_name,</span></span></span><br><span class="line"><span class="params"><span class="function">                                          <span class="type">pid_t</span> owner_tid,</span></span></span><br><span class="line"><span class="params"><span class="function">                                          ArtMethod* owners_method,</span></span></span><br><span class="line"><span class="params"><span class="function">                                          <span class="type">uint32_t</span> owners_dex_pc,</span></span></span><br><span class="line"><span class="params"><span class="function">                                          <span class="type">size_t</span> num_waiters)</span> </span>&#123;</span><br><span class="line">  Locks::mutator_lock_-&gt;<span class="built_in">AssertSharedHeld</span>(Thread::<span class="built_in">Current</span>());</span><br><span class="line">  <span class="type">const</span> <span class="type">char</span>* owners_filename;</span><br><span class="line">  <span class="type">int32_t</span> owners_line_number = <span class="number">0</span>;</span><br><span class="line">  <span class="keyword">if</span> (owners_method != <span class="literal">nullptr</span>) &#123;</span><br><span class="line">    <span class="built_in">TranslateLocation</span>(owners_method, owners_dex_pc, &amp;owners_filename, &amp;owners_line_number);</span><br><span class="line">  &#125;</span><br><span class="line">  std::ostringstream oss;</span><br><span class="line">  oss &lt;&lt; <span class="string">&quot;monitor contention with owner &quot;</span> &lt;&lt; owner_name &lt;&lt; <span class="string">&quot; (&quot;</span> &lt;&lt; owner_tid &lt;&lt; <span class="string">&quot;)&quot;</span>;</span><br><span class="line">  <span class="keyword">if</span> (owners_method != <span class="literal">nullptr</span>) &#123;</span><br><span class="line">    oss &lt;&lt; <span class="string">&quot; at &quot;</span> &lt;&lt; owners_method-&gt;<span class="built_in">PrettyMethod</span>();</span><br><span class="line">    oss &lt;&lt; <span class="string">&quot;(&quot;</span> &lt;&lt; owners_filename &lt;&lt; <span class="string">&quot;:&quot;</span> &lt;&lt; owners_line_number &lt;&lt; <span class="string">&quot;)&quot;</span>;</span><br><span class="line">  &#125;</span><br><span class="line">  oss &lt;&lt; <span class="string">&quot; waiters=&quot;</span> &lt;&lt; num_waiters;</span><br><span class="line">  <span class="keyword">return</span> oss.<span class="built_in">str</span>();</span><br><span class="line">&#125;</span><br></pre></td></tr></table></figure><h3 id="Block-Info"><a href="#Block-Info" class="headerlink" title="Block Info"></a>Block Info</h3><p><code>art/runtime/monitor.cc</code></p><figure class="highlight cc"><table><tr><td class="gutter"><pre><span class="line">1</span><br><span class="line">2</span><br><span class="line">3</span><br><span class="line">4</span><br><span class="line">5</span><br><span class="line">6</span><br><span class="line">7</span><br><span class="line">8</span><br><span class="line">9</span><br><span class="line">10</span><br><span class="line">11</span><br><span class="line">12</span><br><span class="line">13</span><br><span class="line">14</span><br><span class="line">15</span><br><span class="line">16</span><br><span class="line">17</span><br><span class="line">18</span><br><span class="line">19</span><br><span class="line">20</span><br><span class="line">21</span><br><span class="line">22</span><br><span class="line">23</span><br></pre></td><td class="code"><pre><span class="line"><span class="keyword">if</span> (<span class="built_in">ATRACE_ENABLED</span>()) &#123;</span><br><span class="line">  <span class="keyword">if</span> (owner_ != <span class="literal">nullptr</span>) &#123;  <span class="comment">// Did the owner_ give the lock up?</span></span><br><span class="line">    std::ostringstream oss;</span><br><span class="line">    std::string name;</span><br><span class="line">    owner_-&gt;<span class="built_in">GetThreadName</span>(name);</span><br><span class="line">    oss &lt;&lt; <span class="built_in">PrettyContentionInfo</span>(name,</span><br><span class="line">                                owner_-&gt;<span class="built_in">GetTid</span>(),</span><br><span class="line">                                owners_method,</span><br><span class="line">                                owners_dex_pc,</span><br><span class="line">                                num_waiters);</span><br><span class="line">    <span class="comment">// Add info for contending thread.</span></span><br><span class="line">    <span class="type">uint32_t</span> pc;</span><br><span class="line">    ArtMethod* m = self-&gt;<span class="built_in">GetCurrentMethod</span>(&amp;pc);</span><br><span class="line">    <span class="type">const</span> <span class="type">char</span>* filename;</span><br><span class="line">    <span class="type">int32_t</span> line_number;</span><br><span class="line">    <span class="built_in">TranslateLocation</span>(m, pc, &amp;filename, &amp;line_number);</span><br><span class="line">    oss &lt;&lt; <span class="string">&quot; blocking from &quot;</span></span><br><span class="line">        &lt;&lt; ArtMethod::<span class="built_in">PrettyMethod</span>(m) &lt;&lt; <span class="string">&quot;(&quot;</span> &lt;&lt; (filename != <span class="literal">nullptr</span> ? filename : <span class="string">&quot;null&quot;</span>)</span><br><span class="line">        &lt;&lt; <span class="string">&quot;:&quot;</span> &lt;&lt; line_number &lt;&lt; <span class="string">&quot;)&quot;</span>;</span><br><span class="line">    <span class="built_in">ATRACE_BEGIN</span>(oss.<span class="built_in">str</span>().<span class="built_in">c_str</span>());</span><br><span class="line">    started_trace = <span class="literal">true</span>;</span><br><span class="line">  &#125;</span><br><span class="line">&#125;</span><br></pre></td></tr></table></figure><p><a id="refs"></a></p><h1 id="References"><a href="#References" class="headerlink" title="References"></a>References</h1><ol><li><a href="https://paul.pub/android-binder-driver/">Understanding Android Binder Mechanism 1&#x2F;3: Driver Layer</a></li><li><a href="https://paul.pub/android-binder-cpp/">Understanding Android Binder Mechanism 2&#x2F;3: C++ Layer</a></li><li><a href="https://paul.pub/android-binder-java/">Understanding Android Binder Mechanism 3&#x2F;3: Java Layer</a></li></ol><p><a id="attachments"></a></p><h1 id="Attachments"><a href="#Attachments" class="headerlink" title="Attachments"></a>Attachments</h1><p>The attachments involved in this article have been uploaded. Download, extract, and open them in <strong>Chrome</strong>:<br><a href="https://github.com/Gracker/SystraceForBlog/tree/master/Android_Systrace_Binder">Click here to download the Systrace attachments related to the article</a></p><p><a id="about"></a></p><h1 id="About-Me-amp-amp-Blog"><a href="#About-Me-amp-amp-Blog" class="headerlink" title="About Me &amp;&amp; Blog"></a>About Me &amp;&amp; Blog</h1><p>Below is my personal intro and related links. I look forward to exchanging ideas with fellow professionals. “When three walk together, one can always be my teacher!”</p><ol><li><a href="https://www.androidperformance.com/en/about/">Blogger Intro</a>: Includes personal WeChat and WeChat group links.</li><li><a href="https://www.androidperformance.com/en/2019/12/01/BlogMap/">Blog Content Navigation</a>: A guide for my blog content.</li><li><a href="https://www.androidperformance.com/en/2018/05/07/Android-performance-optimization-skills-and-tools/">Curated Excellent Blog Articles - Android Performance Optimization Must-Knows</a>: Welcome to recommend projects&#x2F;articles.</li><li><a href="https://www.androidperformance.com/en/2023/12/30/the-performance/">Android Performance Optimization Knowledge Planet</a>: Welcome to join and thank you for your support~</li></ol><blockquote><p><strong>One walks faster alone, but a group walks further together.</strong></p></blockquote><p><img src="/en/images/WechatIMG581.webp" alt="Scan WeChat QR Code"></p>]]></content>
    
    
    <summary type="html">&lt;p&gt;This is the tenth article in the Systrace series, primarily providing a brief introduction to Binder and lock information in Systrace. It covers the basic situation of Binder, the representation of Binder communication in Systrace, how to view Binder information, and analysis of lock contention in &lt;code&gt;SystemServer&lt;/code&gt;.&lt;/p&gt;
&lt;p&gt;The purpose of this series is to view the overall operation of the Android system from a different perspective using Systrace, while also providing an alternative angle for learning the Framework. Perhaps you’ve read many articles about the Framework but can never remember the code, or you’re unclear about the execution flow. Maybe from Systrace’s graphical perspective, you can gain a deeper understanding.&lt;/p&gt;</summary>


    <category term="Android" scheme="https://androidperformance.com/en/categories/Android/"/>
    
    
    <category term="Android" scheme="https://androidperformance.com/en/tags/Android/"/>
    
    <category term="Systrace" scheme="https://androidperformance.com/en/tags/Systrace/"/>
    
    <category term="Startup" scheme="https://androidperformance.com/en/tags/Startup/"/>
    
    <category term="Jank" scheme="https://androidperformance.com/en/tags/Jank/"/>
    
    <category term="Performance" scheme="https://androidperformance.com/en/tags/Performance/"/>
    
  </entry>
  
  <entry>
    <title>[Sticky] Blog Article Directory</title>
    <link href="https://androidperformance.com/en/2019/12/01/BlogMap/"/>
    <id>https://androidperformance.com/en/2019/12/01/BlogMap/</id>
    <published>2019-11-30T23:38:21.000Z</published>
    <updated>2026-05-10T23:29:51.061Z</updated>
    
    <content type="html"><![CDATA[<p>The content of this blog mainly focuses on Android development and optimization-related topics, including the use of performance tools, Android App optimization knowledge, Android Framework explanations, and performance theory. Here is an organized directory for your reference. You can choose the parts you are interested in. This directory includes not only blog content but also some of my answers on <a href="https://www.zhihu.com/people/gracker">Zhihu</a> or the <a href="https://t.zsxq.com/mIimiey">Knowledge Planet - The Performance</a>. This directory lists my original blog posts. Additionally, I have collected some excellent articles in <a href="https://www.androidperformance.com/en/2018/05/07/Android-performance-optimization-skills-and-tools/">Must-Knows for Android Performance Optimization</a>, which I update periodically.</p><span id="more"></span><p>This directory will be updated with every blog post for easy reference. I will try my best to update weekly. Learning is endless; let’s encourage each other. If there is anything you want to know or if there are any inadequacies in the blog, please leave a message on the blog, Zhihu, Weibo, or WeChat. I will actively correct them.</p><h1 id="Theoretical-Knowledge"><a href="#Theoretical-Knowledge" class="headerlink" title="Theoretical Knowledge"></a>Theoretical Knowledge</h1><ol><li><a href="https://www.androidperformance.com/en/2022/01/07/The-Performace-1-Performance-Tools/">Techniques, Philosophy, and Tools for Android Performance Optimization</a></li><li><a href="https://www.androidperformance.com/en/2022/03/13/the-performance">Introduction to The Performance Knowledge Planet</a></li><li><a href="https://www.androidperformance.com/en/2022/03/27/the-performance-tea-part-01/">The Performance Planet Tea Party - Episode 1</a></li><li><a href="https://www.androidperformance.com/en/2023/08/21/the-performance-design-of-os/">Performance Design in OS Design</a></li></ol><h1 id="Perfetto-Series"><a href="#Perfetto-Series" class="headerlink" title="Perfetto Series"></a>Perfetto Series</h1><p>As Google announced the discontinuation of the Systrace tool and introduced Perfetto, Perfetto has basically replaced Systrace in my daily work. At the same time, major manufacturers like Oppo and Vivo have also switched from Systrace to Perfetto. Many developers new to Android performance optimization find Perfetto’s dazzling interface and complex functions overwhelming. I hope to present those previous Systrace articles using Perfetto.</p><p>When reading these two series now, separate the system mechanisms from the tool workflow. The old Systrace articles are still useful for mechanisms such as thread states, Vsync, Input, SurfaceFlinger, and Binder. The capture and analysis workflow should move to Perfetto: on Android 10 and later, System Tracing mainly produces <code>.perfetto-trace</code> files, and the default viewer should be <a href="https://ui.perfetto.dev/">https://ui.perfetto.dev/</a>. The legacy Systrace view can still be used from Perfetto UI when needed, but current analysis should usually start from Perfetto tracks, search, SQL, and <code>trace_processor</code>.</p><ol><li><a href="https://www.androidperformance.com/en/2024/03/27/Android-Perfetto-101/#/Perfetto-%E7%B3%BB%E5%88%97%E7%9B%AE%E5%BD%95">Android Perfetto Series Index</a></li><li><a href="https://www.androidperformance.com/en/2024/05/21/Android-Perfetto-01-What-is-perfetto/">Android Perfetto Series 1: Introduction to Perfetto</a></li><li><a href="https://www.androidperformance.com/en/2024/05/21/Android-Perfetto-02-how-to-get-perfetto/">Android Perfetto Series 2: Capturing Perfetto Traces</a></li><li><a href="https://www.androidperformance.com/en/2024/05/21/Android-Perfetto-03-how-to-analysis-perfetto/">Android Perfetto Series 3: Getting Familiar with Perfetto View</a></li><li><a href="https://www.androidperformance.com/en/2025/02/08/Android-Perfetto-04-Open-Big-Trace-With-Command-Line/">Android Perfetto Series 4: Opening Large Traces Locally Using the Command Line</a></li><li><a href="https://www.androidperformance.com/en/2025/03/26/Android-Perfetto-05-Chorergrapher/">Android Perfetto Series 5: Android App Rendering Pipeline Based on Choreographer</a></li><li><a href="https://www.androidperformance.com/en/2025/04/26/Android-Perfetto-06-Why-120Hz/">Android Perfetto Series 6: Why 120Hz? Advantages and Challenges of High Refresh Rate</a></li><li><a href="https://www.androidperformance.com/en/2025/08/02/Android-Perfetto-07-MainThread-And-RenderThread/">Android Perfetto Series 7 - MainThread and RenderThread Explained</a></li><li><a href="https://www.androidperformance.com/en/2025/08/05/Android-Perfetto-08-Vsync/">Android Perfetto Series 8: Deep Dive into Vsync Mechanism and Performance Analysis</a></li><li><a href="https://www.androidperformance.com/en/2025/11/12/Android-Perfetto-09-CPU/">Android Perfetto Series 9 - CPU Information Explained</a></li><li><a href="https://www.androidperformance.com/en/2025/11/16/Android-Perfetto-10-Binder/">Android Perfetto Series 10: Binder Scheduling and Lock Contention</a></li><li><a href="https://www.bilibili.com/video/BV1oi82efE4D/?vd_source=0c6d2191e785de0a36dc21a9da7e664e">Video (Bilibili) - Android Perfetto Basics and Case Studies</a></li><li><a href="https://www.bilibili.com/video/BV17A6bBLECu/">Video (Bilibili) - Android Perfetto: Trace Graph Types - AOSP, WebView, Flutter + OEM System Optimization</a></li></ol><h1 id="Systrace-Series"><a href="#Systrace-Series" class="headerlink" title="Systrace Series"></a>Systrace Series</h1><p>The Systrace tool is a powerful tool for analyzing Android performance issues. It can show the operation of the entire machine from a graphical perspective. The Systrace tool can not only analyze performance issues but is also excellent for learning the Framework, which is one reason I wrote this series.</p><p>If you start from this series today, use this mapping to move to the current Perfetto workflow:</p><table><thead><tr><th>Systrace article direction</th><th>Perfetto reading path</th></tr></thead><tbody><tr><td>Tool introduction, capture flow, UI operations</td><td><a href="https://www.androidperformance.com/en/2024/05/21/Android-Perfetto-01-What-is-perfetto/">Perfetto introduction</a> &#x2F; <a href="https://www.androidperformance.com/en/2024/05/21/Android-Perfetto-02-how-to-get-perfetto/">Capturing Perfetto traces</a> &#x2F; <a href="https://www.androidperformance.com/en/2024/05/21/Android-Perfetto-03-how-to-analysis-perfetto/">Perfetto View</a></td></tr><tr><td>Why 60 fps and high refresh rate</td><td><a href="https://www.androidperformance.com/en/2025/04/26/Android-Perfetto-06-Why-120Hz/">Why 120Hz?</a></td></tr><tr><td>Choreographer, MainThread, RenderThread, jank analysis</td><td><a href="https://www.androidperformance.com/en/2025/03/26/Android-Perfetto-05-Chorergrapher/">Choreographer rendering flow</a> &#x2F; <a href="https://www.androidperformance.com/en/2025/08/02/Android-Perfetto-07-MainThread-And-RenderThread/">MainThread and RenderThread</a></td></tr><tr><td>Vsync, SurfaceFlinger, Triple Buffer</td><td><a href="https://www.androidperformance.com/en/2025/08/05/Android-Perfetto-08-Vsync/">Vsync and performance analysis</a></td></tr><tr><td>CPU, Runnable, Running, Sleep</td><td><a href="https://www.androidperformance.com/en/2025/11/12/Android-Perfetto-09-CPU/">CPU information</a></td></tr><tr><td>Binder, lock contention, SystemServer waits</td><td><a href="https://www.androidperformance.com/en/2025/11/16/Android-Perfetto-10-Binder/">Binder scheduling and lock contention</a></td></tr></tbody></table><ol><li><a href="https://www.androidperformance.com/en/2019/05/28/Android-Systrace-About/">Introduction to Systrace</a></li><li><a href="https://www.androidperformance.com/en/2019/07/23/Android-Systrace-Pre/">Systrace Basics - Prerequisites for Systrace</a></li><li><a href="https://www.androidperformance.com/en/2019/05/27/why-60-fps/">Systrace Basics - Why 60 fps?</a></li><li><a href="https://www.androidperformance.com/en/2019/06/29/Android-Systrace-SystemServer/">Android Systrace Basics - SystemServer Explained</a></li><li><a href="https://www.androidperformance.com/en/2019/11/04/Android-Systrace-Input/">Systrace Basics - Input Explained</a></li><li><a href="https://www.androidperformance.com/en/2019/12/01/Android-Systrace-Vsync/">Systrace Basics - Vsync Mechanism Explained</a></li><li><a href="https://www.androidperformance.com/en/2019/10/22/Android-Choreographer/">Systrace Basics - Vsync-App: Detailed Explanation of Choreographer-Based Rendering Mechanism</a></li><li><a href="https://www.androidperformance.com/en/2019/11/06/Android-Systrace-MainThread-And-RenderThread/">Systrace Basics - MainThread and RenderThread Explained</a></li><li><a href="https://www.androidperformance.com/en/2019/12/06/Android-Systrace-Binder/">Systrace Basics - Binder and Lock Contention Explained</a></li><li><a href="https://www.androidperformance.com/en/2019/12/15/Android-Systrace-Triple-Buffer">Systrace Basics - Triple Buffer Explained</a></li><li><a href="https://www.androidperformance.com/en/2019/12/21/Android-Systrace-CPU">Systrace Basics - CPU Info Explained</a></li><li><a href="https://www.androidperformance.com/en/2019/06/29/Android-Systrace-SystemServer/">Android Systrace Basics - SystemServer Explained</a></li><li><a href="https://www.androidperformance.com/en/2020/02/14/Android-Systrace-SurfaceFlinger/">Systrace Basics - SurfaceFlinger Explained</a></li><li><a href="https://www.androidperformance.com/en/2021/04/24/android-systrace-smooth-in-action-1/">Systrace Smoothness in Action 1: Understanding Jank Principles</a></li><li><a href="https://www.androidperformance.com/en/2021/04/24/android-systrace-smooth-in-action-2/">Systrace Smoothness in Action 2: Case Analysis - MIUI Launcher Scroll Jank Analysis</a></li><li><a href="https://www.androidperformance.com/en/2021/04/24/android-systrace-smooth-in-action-3/">Systrace Smoothness in Action 3: FAQs During Jank Analysis</a></li><li><a href="https://www.androidperformance.com/en/2021/09/13/android-systrace-Responsiveness-in-action-1/">Systrace Responsiveness in Action 1: Understanding Responsiveness Principles</a></li><li><a href="https://www.androidperformance.com/en/2021/09/13/android-systrace-Responsiveness-in-action-2/">Systrace Responsiveness in Action 2: Responsiveness Analysis - Using App Startup as an Example</a></li><li><a href="https://www.androidperformance.com/en/2021/09/13/android-systrace-Responsiveness-in-action-3/">Systrace Responsiveness in Action 3: Extended Knowledge on Responsiveness</a></li><li><a href="https://www.androidperformance.com/en/2022/01/21/android-systrace-cpu-state-runnable/">Systrace Thread CPU State Analysis Tips - Runnable</a></li><li><a href="https://www.androidperformance.com/en/2022/03/13/android-systrace-cpu-state-running/">Systrace Thread CPU State Analysis Tips - Running</a></li><li><a href="https://www.androidperformance.com/en/2022/03/13/android-systrace-cpu-state-sleep/">Systrace Thread CPU State Analysis Tips - Sleep and Uninterruptible Sleep</a></li></ol><h1 id="Smoothness"><a href="#Smoothness" class="headerlink" title="Smoothness"></a>Smoothness</h1><p>Smoothness refers to jank and dropped frames, often discussed as Smooth vs Jank.</p><ol><li><a href="https://www.androidperformance.com/en/2019/09/05/Android-Jank-Debug/">Overview of Jank and Dropped Frames in Android - Methodology</a></li><li><a href="https://www.androidperformance.com/en/2019/09/05/Android-Jank-Due-To-System/">Overview of Jank and Dropped Frames in Android - System Edition</a></li><li><a href="https://www.androidperformance.com/en/2019/09/05/Android-Jank-Due-To-App/">Overview of Jank and Dropped Frames in Android - App Edition</a></li><li><a href="https://www.androidperformance.com/en/2019/09/18/Android-Jank-Due-To-Low-Memory/">Overview of Jank and Dropped Frames in Android - Low Memory Edition</a></li><li><a href="https://www.androidperformance.com/en/2018/08/13/Some-Thoughts-on-the-Fluency-of-Android/">Reflections on Android System Smoothness</a></li><li><a href="https://www.androidperformance.com/en/2019/05/15/90hz-on-android/">A New Experience of Smoothness: Talking About 90Hz</a></li><li><a href="https://www.androidperformance.com/en/2014/10/20/android-performance-optimization-overdraw-1/">Android Performance Optimization - Overdraw (Part 1)</a></li><li><a href="https://www.androidperformance.com/en/2015/01/13/android-performance-optimization-overdraw-2/">Android Performance Optimization - Overdraw (Part 2)</a></li><li><a href="https://www.androidperformance.com/en/2015/03/31/android-performance-case-study-follow-up/">Follow-up on Android Performance Optimization</a></li><li><a href="https://www.androidperformance.com/en/2020/08/20/weibo-imageload-opt-on-huawei/">Why Is the Weibo Experience Better on Huawei? A Technical Analysis and Reflection</a></li></ol><h1 id="Responsiveness"><a href="#Responsiveness" class="headerlink" title="Responsiveness"></a>Responsiveness</h1><p>Responsiveness mainly refers to App cold and warm start, interface navigation speed, screen on&#x2F;off speed, etc., often discussed as Fast vs Slow.</p><ol><li><a href="https://www.androidperformance.com/en/2019/11/18/Android-App-Lunch-Optimize/">A Full Record of Android App Launch Optimization</a></li><li><a href="https://www.androidperformance.com/en/2018/05/20/zhihu-startingwindow/">Zhihu: Save Your StartingWindow</a></li><li><a href="https://www.androidperformance.com/en/2015/12/31/How-to-calculation-android-app-lunch-time/">How to Calculate App Launch Time in Android?</a></li><li><a href="https://www.androidperformance.com/en/2015/11/18/Android-app-lunch-optimize-delay-load/">Android App Launch Optimization: Implementation and Principle of DelayLoad (Part 1)</a></li><li><a href="https://www.androidperformance.com/en/2015/12/29/Android-App-Launch-Optimization-DelayLoad-Part-2/">Android App Launch Optimization: Implementation and Principle of DelayLoad (Part 2)</a></li></ol><h1 id="ANR"><a href="#ANR" class="headerlink" title="ANR"></a>ANR</h1><p>Articles related to Android ANR.</p><ol><li><a href="https://www.androidperformance.com/en/2025/02/08/Android-ANR-01-ANR-Design/">Android App ANR Series 1: Deep Dive into Android ANR Mechanism</a></li><li><a href="https://www.androidperformance.com/en/2025/02/08/Android-ANR-02-How-to-analysis-ANR/">Android App ANR Series 2: ANR Analysis Methodology and Key Logs</a></li><li><a href="https://www.androidperformance.com/en/2025/02/08/Android-ANR-03-ANR-Case-Share/">Android App ANR Series 3: ANR Case Studies</a></li></ol><h1 id="Memory"><a href="#Memory" class="headerlink" title="Memory"></a>Memory</h1><p>Articles related to Android memory optimization and its impact on the system.</p><ol><li><a href="https://www.androidperformance.com/en/2019/09/18/Android-Jank-Due-To-Low-Memory/">Impact of Low Memory on Performance in Android</a></li><li><a href="https://www.androidperformance.com/en/2018/09/13/android-memory/">Does the Android System Not Release Memory?</a></li><li><a href="https://www.androidperformance.com/en/2015/07/20/Android-Performance-Memory-AndroidResource/">Memory Optimization Suggestions for Android Code - Resources</a></li><li><a href="https://www.androidperformance.com/en/2015/07/20/Android-Performance-Memory-Google/">Memory Optimization Suggestions for Android Code - Official Android Guide</a></li><li><a href="https://www.androidperformance.com/en/2015/07/20/Android-Performance-Memory-Java/">Memory Optimization Suggestions for Android Code - Official Java Guide</a></li><li><a href="https://www.androidperformance.com/en/2015/04/11/AndroidMemory-Usage-Of-MAT/">Android Memory Optimization (1): Introduction to MAT</a></li><li><a href="https://www.androidperformance.com/en/2015/04/11/AndroidMemory-Usage-Of-MAT-Pro/">Android Memory Optimization (2): Advanced MAT Usage</a></li><li><a href="https://www.androidperformance.com/en/2015/04/11/AndroidMemory-Open-Bitmap-Object-In-MAT/">Android Memory Optimization (3): Viewing Original Bitmap Images in MAT</a></li></ol><h1 id="Framework-Knowledge"><a href="#Framework-Knowledge" class="headerlink" title="Framework Knowledge"></a>Framework Knowledge</h1><p>Framework-related content, including operating principles, problem-solving ideas, and optimization methods.</p><ol><li><a href="https://www.androidperformance.com/en/2023/05/14/bad-android-app-with-system-permissions/#/6-5-WriteSettingsExecutor">With System Permissions, Can an App Really Do Whatever It Wants?</a></li><li><a href="https://www.androidperformance.com/en/2019/10/24/Android-Background-Animation/">Analyzing “Invalid Background Animation” Behavior in Android</a></li><li><a href="https://www.androidperformance.com/en/2019/09/17/Android-Kill-Background-App-Debug/">Android Framework Case Study: Who Killed the Launcher?</a></li><li><a href="https://www.androidperformance.com/en/2019/09/01/Android-Activity-Lunch-Mode/">Detailed Explanation of Activity Launch Modes in Android</a></li><li><a href="https://www.androidperformance.com/en/2019/07/27/Android-Hardware-Layer/">Detailed Explanation of Hardware Layer in Android</a></li><li><a href="https://www.androidperformance.com/en/2019/01/21/android-performance-case-jank-accessbility/">Case Study: System-Wide Lag Caused by Android Accessibility Services</a></li><li><a href="https://www.androidperformance.com/en/2018/10/24/android-process-review-with-user-side/">Understanding Android App States from a User Perspective</a></li><li><a href="https://www.androidperformance.com/en/2015/08/12/AndroidL-hwui-RenderThread-workflow/">RenderThread Workflow in Android hwui</a></li><li><a href="https://www.androidperformance.com/en/2015/08/05/HashMap/">HashMap Source Code Analysis</a></li><li><a href="https://www.androidperformance.com/en/2015/05/06/Java-Singleton/">Detailed Explanation of Java Singleton Pattern</a></li><li><a href="https://www.androidperformance.com/en/2018/11/01/android-system-develop-0/">Setting Up a Source Code Environment for Android System Development</a></li><li><a href="https://www.androidperformance.com/en/2020/05/07/Android-App-Chain-Wakeup/">Analysis of Chain Wakeups in Android Apps</a></li><li><a href="https://www.androidperformance.com/en/2020/05/26/samsung_crash/">An Incident Caused by a “Leap” Month - Analysis of Samsung System Reboots</a></li><li><a href="https://www.androidperformance.com/en/2021/10/26/build-android-12/">Android System Development (1): Downloading, Compiling, and Flashing Android 12 Source Code</a></li></ol><h1 id="App-Development"><a href="#App-Development" class="headerlink" title="App Development"></a>App Development</h1><p>Articles related to App development. Since they were written early, you can just take a quick look.</p><ol><li><a href="https://www.androidperformance.com/en/2016/04/05/android-bottom-bar-1/">Android Bottom Navigation Specification 1: Usage</a></li><li><a href="https://www.androidperformance.com/en/2016/04/05/android-bottom-bar-2/">Android Bottom Navigation Specification 2: Styles, Behaviors, and Specs</a></li><li><a href="https://www.androidperformance.com/en/2014/03/17/android-build-your-own-android-notification-service-app/">Android Service: Developing Your Own Notification Center (1): Introduction to Accessibility Services</a></li><li><a href="https://www.androidperformance.com/en/2014/04/01/android-service-build-your-own-notification-servers-app/">Android Service: Developing Your Own Notification Center (2): Practical Accessibility Services</a></li><li><a href="https://www.androidperformance.com/en/2014/05/02/android_log_to_file/">Android Development: Log2File Utility</a></li><li><a href="https://www.androidperformance.com/en/2014/03/25/ubuntu-adb-can-not-find-devices/">Android: Ubuntu Fails to Find Devices for Adb Commands</a></li><li><a href="https://www.androidperformance.com/en/2014/06/03/android-edittext-do-not-auto-get-focus/">Android Tip: How to Prevent EditText from Automatically Gaining Focus</a></li></ol><h1 id="Personal-Summary-and-Recommendations"><a href="#Personal-Summary-and-Recommendations" class="headerlink" title="Personal Summary and Recommendations"></a>Personal Summary and Recommendations</h1><p>Not related to technology, but can improve happiness and work efficiency.</p><ol><li><a href="https://www.androidperformance.com/en/2024/01/01/2023-review/">Reflections on 2023: Health, Career, and the Future</a></li><li><a href="https://www.androidperformance.com/en/2022/01/03/2021-Review/">2021 Year in Review: Baby, Career, and Growth</a></li><li><a href="https://www.androidperformance.com/en/2019/04/07/liqi/">Gracker’s Sharp Tools</a></li><li><a href="https://www.androidperformance.com/en/2019/01/12/recommend-of-2018/">Gracker’s Top Recommendations of 2018 - A Reward for Hard Work</a></li><li><a href="https://www.androidperformance.com/en/2018/10/25/How-do-engineers-count-well/">How Do Engineers Become Excellent?</a></li><li><a href="https://www.androidperformance.com/en/2018/01/06/2017-recommendations/">Top Recommendations of 2017 - A Reward for Hard Work</a></li><li><a href="https://www.androidperformance.com/en/2017/04/23/About-work/">Reflections on Work and Growth (2017)</a></li><li><a href="https://www.androidperformance.com/en/2020/02/03/android-development-learning-path-2020-edition/">Android Developer Learning Path (2020 Edition)</a></li><li><a href="https://www.androidperformance.com/en/2020/01/28/2020-read/">My 2020 Reading List</a></li></ol><h1 id="Reading-Notes"><a href="#Reading-Notes" class="headerlink" title="Reading Notes"></a>Reading Notes</h1><ol><li><a href="https://www.androidperformance.com/en/2021/10/27/if-i-write-a-book-about-performance/">What Should Be in a Book About Android Smoothness?</a></li><li><a href="https://www.androidperformance.com/en/2018/09/19/how-to-stop-sucking-and-be-awesome-instead-1/">The Programmer’s Apprenticeship - 01: The Art of Fighting Back</a></li><li><a href="https://www.androidperformance.com/en/2018/09/20/how-to-stop-sucking-and-be-awesome-instead-2/">The Programmer’s Apprenticeship - 02: The Way of Programming</a></li><li><a href="https://www.androidperformance.com/en/2018/09/26/how-to-stop-sucking-and-be-awesome-instead-3/">The Programmer’s Apprenticeship - 03: Web Design Principles</a></li><li><a href="https://www.androidperformance.com/en/2018/09/27/how-to-stop-sucking-and-be-awesome-instead-4/">The Programmer’s Apprenticeship - 04: Reflections on Testing</a></li><li><a href="https://www.androidperformance.com/en/2018/09/28/how-to-stop-sucking-and-be-awesome-instead-5/">The Programmer’s Apprenticeship - 05: Know Your Users</a></li><li><a href="https://www.androidperformance.com/en/2018/09/29/how-to-stop-sucking-and-be-awesome-instead-6/">The Programmer’s Apprenticeship - 06: All About the Internet</a></li><li><a href="https://www.androidperformance.com/en/2018/09/30/how-to-stop-sucking-and-be-awesome-instead-7/">The Programmer’s Apprenticeship - 07: Games and Programming</a></li><li><a href="https://www.androidperformance.com/en/2018/10/01/how-to-stop-sucking-and-be-awesome-instead-8/">The Programmer’s Apprenticeship - 08: The Beauty of Reading</a></li></ol><h1 id="Performance-Optimization-Patterns-and-Tips"><a href="#Performance-Optimization-Patterns-and-Tips" class="headerlink" title="Performance Optimization Patterns and Tips"></a>Performance Optimization Patterns and Tips</h1><p>Performance Optimization Patterns is a series of short videos by Google (6 seasons). I originally wanted to accompany each with an article. Android Tips are translations from another blogger.</p><ol><li><a href="https://www.androidperformance.com/en/2015/04/19/Android-Performance-Patterns/">Overview of Android Performance Patterns</a></li><li><a href="https://www.androidperformance.com/en/2015/04/19/Android-Performance-Patterns-1/">Android Performance Patterns - Render Performance</a></li><li><a href="https://www.androidperformance.com/en/2015/04/19/Android-Performance-Patterns-2/">Android Performance Patterns - Understanding Overdraw</a></li><li><a href="https://www.androidperformance.com/en/2015/04/19/Android-Performance-Patterns-3/">Android Performance Patterns - Understanding VSYNC</a></li><li><a href="https://www.androidperformance.com/en/2015/04/19/Android-Performance-Patterns-4/">Android Performance Patterns - Profile GPU Rendering</a></li><li><a href="https://www.androidperformance.com/en/2014/05/28/android-tips-round-up-1/">Android Tips 1</a></li><li><a href="https://www.androidperformance.com/en/2014/05/31/android-tips-round-up-2/">Android Tips 2</a></li><li><a href="https://www.androidperformance.com/en/2015/03/15/android-tips-round-up-3/">Android Tips 3</a></li><li><a href="https://www.androidperformance.com/en/2015/03/15/android-tips-round-up-4/">Android Tips 4</a></li><li><a href="https://www.androidperformance.com/en/2015/03/15/android-tips-round-up-5/">Android Tips 5</a></li></ol><h1 id="Zhihu-Q-amp-A"><a href="#Zhihu-Q-amp-A" class="headerlink" title="Zhihu Q&amp;A"></a>Zhihu Q&amp;A</h1><p>Some articles are from Zhihu columns. Here are some top-voted answers.</p><ol><li><a href="https://www.zhihu.com/people/gracker">Personal Zhihu Homepage</a></li><li><a href="https://www.zhihu.com/question/67627009/answer/255199992">Why Are Two Large Cores Locked When Running Honor of Kings on Some Xiaomi Models?</a></li><li><a href="https://www.zhihu.com/question/38533041/answer/77512815">Why Is Flyme 5 So Much Smoother Than Flyme 4? What Is the Fundamental Change?</a></li><li><a href="https://www.zhihu.com/question/24976909/answer/49711238">Does the Android System Not Release Memory?</a></li><li><a href="https://www.zhihu.com/question/350047125">Is Understanding the Android Framework Layer Helpful for Work?</a></li><li><a href="https://www.zhihu.com/question/396666758/answer/1245994988">What Do You Think of the Samsung System Crashes on May 23?</a></li></ol><h1 id="Android-Weekly"><a href="#Android-Weekly" class="headerlink" title="Android Weekly"></a>Android Weekly</h1><ol><li><strong>Juejin Column</strong>: <a href="https://juejin.cn/column/7456829086335107091">Android Weekly</a></li><li><strong>Zhihu Column</strong>: <a href="https://www.zhihu.com/column/c_1278963991947780096">Android Weekly</a></li></ol><h3 id="Android-Weekly-Articles"><a href="#Android-Weekly-Articles" class="headerlink" title="Android Weekly Articles:"></a>Android Weekly Articles:</h3><ol><li><a href="https://www.androidperformance.com/en/2025/01/06/Android-Weekly-2025-01/">Android Weekly Issue 2025-01</a></li><li><a href="https://www.androidperformance.com/en/2025/01/12/Android-Weekly-2025-02/">Android Weekly Issue 2025-02</a></li><li><a href="https://www.androidperformance.com/en/2025/01/19/Android-Weekly-2025-03/">Android Weekly Issue 2025-03</a></li><li><a href="https://www.androidperformance.com/en/2025/01/27/Android-Weekly-2025-04/">Android Weekly Issue 2025-04</a></li><li><a href="https://www.androidperformance.com/en/2025/02/03/Android-Weekly-2025-05/">Android Weekly Issue 2025-05</a></li><li><a href="https://www.androidperformance.com/en/2025/02/09/Android-Weekly-2025-06/">Android Weekly Issue 2025-06</a></li><li><a href="https://www.androidperformance.com/en/2025/02/16/Android-Weekly-2025-07/">Android Weekly Issue 2025-07</a></li><li><a href="https://www.androidperformance.com/en/2025/02/23/Android-Weekly-2025-08/">Android Weekly Issue 2025-08</a></li><li><a href="https://www.androidperformance.com/en/2025/03/02/Android-Weekly-2025-09/">Android Weekly Issue 2025-09</a></li><li><a href="https://www.androidperformance.com/en/2025/03/10/Android-Weekly-2025-10/">Android Weekly Issue 2025-10</a></li><li><a href="https://www.androidperformance.com/en/2025/03/16/Android-Weekly-2025-11/">Android Weekly Issue 2025-11</a></li><li><a href="https://www.androidperformance.com/en/2025/03/31/Android-Weekly-2025-12/">Android Weekly Issue 2025-12</a></li><li><a href="https://www.androidperformance.com/en/2025/04/06/Android-Weekly-2025-13/">Android Weekly Issue 2025-13</a></li><li><a href="https://www.androidperformance.com/en/2025/04/13/Android-Weekly-2025-14/">Android Weekly Issue 2025-14</a></li><li><a href="https://www.androidperformance.com/en/2025/04/20/Android-Weekly-2025-15/">Android Weekly Issue 2025-15</a></li><li><a href="https://www.androidperformance.com/en/2025/05/19/Android-Weekly-2025-16/">Android Weekly Issue 2025-16</a></li><li><a href="https://www.androidperformance.com/en/2025/05/25/Android-Weekly-2025-17/">Android Weekly Issue 2025-17</a></li><li><a href="https://www.androidperformance.com/en/2025/07/20/Android-Weekly-2025-18/">Android Weekly Issue 2025-18</a></li><li><a href="https://www.androidperformance.com/en/2025/07/28/Android-Weekly-2025-19/">Android Weekly Issue 2025-19</a></li></ol><h1 id="Personal-Page"><a href="#Personal-Page" class="headerlink" title="Personal Page"></a>Personal Page</h1><p>Below is my personal introduction and related links. I look forward to exchanging ideas with fellow professionals. “When three walk together, one can always be my teacher!”</p><ol><li><a href="https://www.androidperformance.com/en/">Personal Blog</a>: Where I write</li><li><a href="https://www.androidperformance.com/en/about/">Blogger Intro</a>: Includes personal WeChat and WeChat group links.</li><li><a href="https://www.androidperformance.com/en/2018/05/07/Android-performance-optimization-skills-and-tools/">Curated Performance Articles</a>: Welcome to recommend projects&#x2F;articles.</li><li><a href="https://www.androidperformance.com/en/2023/12/30/the-performance/">Android Performance Knowledge Planet</a>: Welcome to join and thank you for your support~</li><li><strong>WeChat Official Account</strong><br><img src="/en/images/BlogMap/46c63e7f-e15e-4538-9aa1-72ccc6245942.webp"></li><li><a href="https://www.zhihu.com/people/gracker">Zhihu</a>: <a href="https://www.zhihu.com/people/gracker">https://www.zhihu.com/people/gracker</a></li><li><a href="https://androidweekly.zhubai.love/">Email Subscription</a>: <a href="https://androidweekly.zhubai.love/">https://androidweekly.zhubai.love/</a></li><li><a href="https://juejin.cn/user/1816846860560749">Juejin</a>: <a href="https://juejin.cn/user/1816846860560749">https://juejin.cn/user/1816846860560749</a></li></ol><h1 id="Presentations-and-Training-PPTs"><a href="#Presentations-and-Training-PPTs" class="headerlink" title="Presentations and Training PPTs"></a>Presentations and Training PPTs</h1><p>This section will be released after some organization. As you know, PPTs don’t contain too much detail, mostly just an outline.</p><ol><li><a href="https://www.bilibili.com/video/BV1oi82efE4D/?vd_source=0c6d2191e785de0a36dc21a9da7e664e">Video (Bilibili) - Android Perfetto Basics and Case Studies</a></li><li><a href="https://www.bilibili.com/video/BV17A6bBLECu/">Video (Bilibili) - Android Perfetto: Trace Graph Types - AOSP, WebView, Flutter + OEM System Optimization</a></li></ol><h1 id="Knowledge-Planet"><a href="#Knowledge-Planet" class="headerlink" title="Knowledge Planet"></a>Knowledge Planet</h1><p>The Knowledge Planet is named <strong>The Performance</strong>, a community for sharing performance optimization-related knowledge in the Android development field. The moderator is the blogger himself, a senior developer in performance optimization at a top-tier domestic mobile phone manufacturer. He has years of accumulated knowledge and experience in performance-related fields and can provide one-stop services for performance and power analysis knowledge, covering basics, methodology, tool usage, and the most valuable case studies.<br><img src="/en/images/17039900286551.jpg" alt="The Performance Knowledge Planet"></p>]]></content>
    
    
    <summary type="html">&lt;p&gt;The content of this blog mainly focuses on Android development and optimization-related topics, including the use of performance tools, Android App optimization knowledge, Android Framework explanations, and performance theory. Here is an organized directory for your reference. You can choose the parts you are interested in. This directory includes not only blog content but also some of my answers on &lt;a href=&quot;https://www.zhihu.com/people/gracker&quot;&gt;Zhihu&lt;/a&gt; or the &lt;a href=&quot;https://t.zsxq.com/mIimiey&quot;&gt;Knowledge Planet - The Performance&lt;/a&gt;. This directory lists my original blog posts. Additionally, I have collected some excellent articles in &lt;a href=&quot;https://www.androidperformance.com/en/2018/05/07/Android-performance-optimization-skills-and-tools/&quot;&gt;Must-Knows for Android Performance Optimization&lt;/a&gt;, which I update periodically.&lt;/p&gt;</summary>


    <category term="Reading Notes" scheme="https://androidperformance.com/en/categories/Reading-Notes/"/>
    
    
    <category term="Android" scheme="https://androidperformance.com/en/tags/Android/"/>
    
    <category term="Perfetto" scheme="https://androidperformance.com/en/tags/Perfetto/"/>
    
    <category term="Systrace" scheme="https://androidperformance.com/en/tags/Systrace/"/>
    
    <category term="RenderThread" scheme="https://androidperformance.com/en/tags/RenderThread/"/>
    
  </entry>
  
  <entry>
    <title>Android Systrace Basics - Vsync Explained</title>
    <link href="https://androidperformance.com/en/2019/12/01/Android-Systrace-Vsync/"/>
    <id>https://androidperformance.com/en/2019/12/01/Android-Systrace-Vsync/</id>
    <published>2019-11-30T22:38:21.000Z</published>
    <updated>2026-05-10T23:29:51.060Z</updated>
    
    <content type="html"><![CDATA[<p>This is the seventh article in the Systrace series, primarily introducing the Vsync mechanism in Android. This article examines the display of each frame in the Android system from the perspective of Systrace. Vsync is a critical mechanism in Systrace. Although invisible and intangible when operating a phone, we can see in Systrace how the Android system, guided by Vsync signals, orderly performs rendering and composition for each frame, ensuring stable frame rates.</p><p>The purpose of this series is to view the overall operation of the Android system from a different perspective using Systrace, while also providing an alternative angle for learning the Framework. Perhaps you’ve read many articles about the Framework but can never remember the code, or you’re unclear about the execution flow. Maybe from Systrace’s graphical perspective, you can gain a deeper understanding.</p><span id="more"></span><h2 id="Table-of-Contents"><a href="#Table-of-Contents" class="headerlink" title="Table of Contents"></a>Table of Contents</h2><ul><li><a href="#series">Series Article Index</a></li><li><a href="#content">Main Content</a></li><li><a href="#gfx-flow">Android Graphics Data Flow</a></li><li><a href="#systrace-flow">Graphic Data Flow in Systrace</a></li><li><a href="#offset">Vsync Offset</a></li><li><a href="#hw-vsync">HW_Vsync</a></li><li><a href="#others">Other Addresses for This Article</a></li><li><a href="#refs">References</a></li><li><a href="#about">About Me &amp;&amp; Blog</a></li></ul><p><a id="series"></a></p><h1 id="Series-Article-Index"><a href="#Series-Article-Index" class="headerlink" title="Series Article Index"></a>Series Article Index</h1><ol><li><a href="https://www.androidperformance.com/en/2019/05/28/Android-Systrace-About/">Introduction to Systrace</a></li><li><a href="https://www.androidperformance.com/en/2019/07/23/Android-Systrace-Pre/">Systrace Basics - Prerequisites for Systrace</a></li><li><a href="https://www.androidperformance.com/en/2019/05/27/why-60-fps/">Systrace Basics - Why 60 fps?</a></li><li><a href="https://www.androidperformance.com/en/2019/06/29/Android-Systrace-SystemServer/">Android Systrace Basics - SystemServer Explained</a></li><li><a href="https://www.androidperformance.com/en/2020/02/14/Android-Systrace-SurfaceFlinger/">Systrace Basics - SurfaceFlinger Explained</a></li><li><a href="https://www.androidperformance.com/en/2019/11/04/Android-Systrace-Input/">Systrace Basics - Input Explained</a></li><li><a href="https://www.androidperformance.com/en/2019/12/01/Android-Systrace-Vsync/">Systrace Basics - Vsync Explained</a></li><li><a href="https://www.androidperformance.com/en/2019/10/22/Android-Choreographer/">Systrace Basics - Vsync-App: Detailed Explanation of Choreographer-Based Rendering Mechanism</a></li><li><a href="https://www.androidperformance.com/en/2019/11/06/Android-Systrace-MainThread-And-RenderThread/">Systrace Basics - MainThread and RenderThread Explained</a></li><li><a href="https://www.androidperformance.com/en/2019/12/06/Android-Systrace-Binder/">Systrace Basics - Binder and Lock Contention Explained</a></li><li><a href="https://www.androidperformance.com/en/2019/12/15/Android-Systrace-Triple-Buffer">Systrace Basics - Triple Buffer Explained</a></li><li><a href="https://www.androidperformance.com/en/2019/12/21/Android-Systrace-CPU">Systrace Basics - CPU Info Explained</a></li><li><a href="https://www.androidperformance.com/en/2021/04/24/android-systrace-smooth-in-action-1/">Systrace Smoothness in Action 1: Understanding Jank Principles</a></li><li><a href="https://www.androidperformance.com/en/2021/04/24/android-systrace-smooth-in-action-2/">Systrace Smoothness in Action 2: Case Analysis - MIUI Launcher Scroll Jank Analysis</a></li><li><a href="https://www.androidperformance.com/en/2021/04/24/android-systrace-smooth-in-action-3/">Systrace Smoothness in Action 3: FAQs During Jank Analysis</a></li><li><a href="https://www.androidperformance.com/en/2021/09/13/android-systrace-Responsiveness-in-action-1/">Systrace Responsiveness in Action 1: Understanding Responsiveness Principles</a></li><li><a href="https://www.androidperformance.com/en/2021/09/13/android-systrace-Responsiveness-in-action-2/">Systrace Responsiveness in Action 2: Responsiveness Analysis - Using App Startup as an Example</a></li><li><a href="https://www.androidperformance.com/en/2021/09/13/android-systrace-Responsiveness-in-action-3/">Systrace Responsiveness in Action 3: Extended Knowledge on Responsiveness</a></li><li><a href="https://www.androidperformance.com/en/2022/01/21/android-systrace-cpu-state-runnable/">Systrace Thread CPU State Analysis Tips - Runnable</a></li><li><a href="https://www.androidperformance.com/en/2022/03/13/android-systrace-cpu-state-running/">Systrace Thread CPU State Analysis Tips - Running</a></li><li><a href="https://www.androidperformance.com/en/2022/03/13/android-systrace-cpu-state-sleep/">Systrace Thread CPU State Analysis Tips - Sleep and Uninterruptible Sleep</a></li></ol><p><a id="content"></a></p><h1 id="Main-Content"><a href="#Main-Content" class="headerlink" title="Main Content"></a>Main Content</h1><p>The Vsync mechanism in this article still applies, but current analysis should not stop at the old Systrace HTML screenshots of <code>VSYNC_APP</code> and <code>VSYNC_SF</code>. When reading this with Perfetto, pair it with <a href="https://www.androidperformance.com/en/2025/08/05/Android-Perfetto-08-Vsync/">Perfetto 8: Vsync mechanism and performance analysis</a>. The App Vsync, SurfaceFlinger Vsync, HWC Vsync, buffer flow, and composition rhythm discussed here should now be read across App threads, RenderThread, SurfaceFlinger, and Display &#x2F; HWC related tracks in Perfetto.</p><p>The workflow also changes. The old flow was to visually align <code>VSYNC_APP</code> and <code>VSYNC_SF</code> in Systrace. The current flow is to locate the problematic frame in Perfetto, then check whether the app was woken by Vsync, whether RenderThread queued the buffer on time, whether SurfaceFlinger latched and composed it on the expected Vsync, and whether CPU scheduling or Binder waits stretched any stage. For high refresh rate cases, read this together with <a href="https://www.androidperformance.com/en/2025/04/26/Android-Perfetto-06-Why-120Hz/">Perfetto 6: Why 120Hz?</a>, because the frame budget is no longer always 16.6ms.</p><p>Vsync signals can be generated by hardware or simulated via software, though hardware generation is now standard. The Hardware Composer (HWC) produces VSYNC events and sends them to <code>SurfaceFlinger</code> via callbacks. <code>DispSync</code> then generates <code>VSYNC_APP</code> and <code>VSYNC_SF</code> signals from these for use by <code>Choreographer</code> and <code>SurfaceFlinger</code>.</p><p><img src="/en/images/15751536260871.jpg"></p><p>In the article <a href="https://www.androidperformance.com/en/2019/10/22/Android-Choreographer/">Detailed Explanation of Android Rendering Mechanism Based on Choreographer</a>, we mentioned that <code>Choreographer</code> coordinates with Vsync to provide a stable Message processing timing for App-level rendering. When Vsync arrives, the system adjusts the signal period to control when each frame is drawn. Most current phones have a 60Hz refresh rate (16.6ms). To match this, the system sets the Vsync period to 16.6ms, waking <code>Choreographer</code> every period to perform app drawing—this is the primary purpose of <code>Choreographer</code>.</p><p>While <code>Choreographer</code> handles Vsync for the rendering layer (App), <code>SurfaceFlinger</code> handles it for the composition layer. <code>SurfaceFlinger</code> composites all prepared Surfaces when Vsync arrives.</p><p>The diagram below shows <code>VSYNC_APP</code> and <code>VSYNC_SF</code> within the <code>SurfaceFlinger</code> process in Systrace.</p><p><img src="/en/images/15751536450451.jpg"></p><p><a id="gfx-flow"></a></p><h1 id="Android-Graphics-Data-Flow"><a href="#Android-Graphics-Data-Flow" class="headerlink" title="Android Graphics Data Flow"></a>Android Graphics Data Flow</h1><p>First, we must understand the high-level direction of graphics data. From app drawing to screen display, the process consists of several stages:</p><p><img src="/en/images/15751536542613.jpg"></p><ol><li><strong>Stage 1</strong>: Upon receiving <code>Vsync-App</code>, the App performs <code>measure</code>, <code>layout</code>, and <code>draw</code> (constructing a <code>DisplayList</code> containing OpenGL commands and data) on the main thread. This corresponds to the <strong>doFrame</strong> operation in Systrace’s main thread.</li><li><strong>Stage 2</strong>: The CPU uploads data (via sharing or copying) to the GPU. On ARM devices, CPU and GPU usually share memory. This corresponds to the <strong>flush drawing commands</strong> operation in Systrace’s rendering thread.</li><li><strong>Stage 3</strong>: Notify the GPU to render. Real devices typically don’t block waiting for GPU completion; the CPU returns to other tasks immediately. The Fence mechanism is used for synchronization.</li><li><strong>Stage 4</strong>: <code>swapBuffers</code> and notification to <code>SurfaceFlinger</code> for layer composition. This corresponds to the <strong>eglSwapBuffersWithDamageKHR</strong> operation in Systrace’s rendering thread.</li><li><strong>Stage 5</strong>: <code>SurfaceFlinger</code> starts composition. If previous GPU tasks aren’t finished, it waits (Fence mechanism). Composition still relies on the GPU, but as a subsequent task. This corresponds to <code>onMessageReceived</code> (including <code>handleTransaction</code>, <code>handleMessageInvalidate</code>, <code>handleMessageRefresh</code>) in <code>SurfaceFlinger</code>‘s main thread. <code>SurfaceFlinger</code> delegates some work to the Hardware Composer to offload the GPU; only layers HWC can’t handle (or those explicitly assigned to OpenGL) use OpenGL.</li><li><strong>Stage 6</strong>: Final composited data is placed in the Frame Buffer and becomes visible upon refresh.</li></ol><p>The following official diagram shows how frame data flows across processes from left to right:</p><p><img src="/en/images/15751536775887.jpg"></p><p><a id="systrace-flow"></a></p><h1 id="Graphic-Data-Flow-in-Systrace"><a href="#Graphic-Data-Flow-in-Systrace" class="headerlink" title="Graphic Data Flow in Systrace"></a>Graphic Data Flow in Systrace</h1><p>By mapping the abstract data flow above to Systrace, we get this:</p><p><img src="/en/images/15751536946754.jpg"></p><p>The diagram above includes <code>SurfaceFlinger</code>, App, and <code>hwc</code> processes. Let’s follow the numbers:</p><ol><li>First Vsync signal arrives; <code>SurfaceFlinger</code> and App receive it simultaneously.</li><li><code>SurfaceFlinger</code> receives <code>Vsync-sf</code> and begins compositing the App’s previous frame buffer.</li><li>App receives <code>Vsync-app</code> and begins rendering the current frame buffer (stages 1-4 above).</li><li>Second Vsync signal arrives. <code>SurfaceFlinger</code> retrieves the buffer the App rendered in step 2 and begins composition (stage 5). Simultaneously, the App receives <code>Vsync-app</code> and starts rendering the next frame buffer (stages 1-4).</li></ol><p><a id="offset"></a></p><h1 id="Vsync-Offset"><a href="#Vsync-Offset" class="headerlink" title="Vsync Offset"></a>Vsync Offset</h1><p>As mentioned, HWC produces hardware Vsync, which <code>DispSync</code> converts into <code>VSYNC_APP</code> and <code>VSYNC_SF</code>.</p><p><img src="/en/images/disp_sync_arch.webp" alt="disp_sync_arch"></p><p>Both <code>app</code> and <code>sf</code> signals have offsets relative to <code>hw_vsync_0</code>, namely <code>phase-app</code> and <code>phase-sf</code>:</p><p><img src="/en/images/15751537168911.jpg"></p><p><strong>Vsync Offset refers to the difference between <code>VSYNC_APP</code> and <code>VSYNC_SF</code> (i.e., <code>phase-sf - phase-app</code>)</strong>, which manufacturers can configure. If the offset is non-zero, the App and <code>SurfaceFlinger</code> don’t receive the signal simultaneously; they receive it separated by the Offset (usually 0-16.6ms).</p><p>Most manufacturers leave this at 0, so App and <code>SurfaceFlinger</code> receive signals simultaneously.</p><p>Check the values using <code>Dumpsys SurfaceFlinger</code>:</p><p><strong>Offset &#x3D; 0</strong>: (<code>sf phase - app phase = 0</code>)</p><figure class="highlight plaintext"><table><tr><td class="gutter"><pre><span class="line">1</span><br><span class="line">2</span><br><span class="line">3</span><br><span class="line">4</span><br><span class="line">5</span><br><span class="line">6</span><br></pre></td><td class="code"><pre><span class="line">Sync configuration: [using: EGL_ANDROID_native_fence_sync EGL_KHR_wait_sync]</span><br><span class="line">DispSync configuration:</span><br><span class="line">          app phase 1000000 ns,              sf phase 1000000 ns</span><br><span class="line">    early app phase 1000000 ns,        early sf phase 1000000 ns</span><br><span class="line"> early app gl phase 1000000 ns,     early sf gl phase 1000000 ns</span><br><span class="line">      present offset 0 ns                      refresh 16666666 ns</span><br></pre></td></tr></table></figure><p><strong>Offset ≠ 0</strong> (<code>SF phase - app phase = 4 ms</code>)</p><figure class="highlight plaintext"><table><tr><td class="gutter"><pre><span class="line">1</span><br><span class="line">2</span><br><span class="line">3</span><br><span class="line">4</span><br><span class="line">5</span><br><span class="line">6</span><br><span class="line">7</span><br></pre></td><td class="code"><pre><span class="line">Sync configuration: [using: EGL_ANDROID_native_fence_sync EGL_KHR_wait_sync]</span><br><span class="line"></span><br><span class="line">VSYNC configuration:</span><br><span class="line">         app phase:   2000000 ns         SF phase:   6000000 ns</span><br><span class="line">   early app phase:   2000000 ns   early SF phase:   6000000 ns</span><br><span class="line">GL early app phase:   2000000 nsGL early SF phase:   6000000 ns</span><br><span class="line">    present offset:         0 ns     VSYNC period:  16666666 ns</span><br></pre></td></tr></table></figure><p>Now let’s see how Offset looks in Systrace.</p><h2 id="Offset-x3D-0"><a href="#Offset-x3D-0" class="headerlink" title="Offset &#x3D; 0"></a>Offset &#x3D; 0</h2><p>When Offset is 0, App and <code>SurfaceFlinger</code> receive Vsync simultaneously:</p><p><img src="/en/images/15751537800460.jpg"></p><p>As shown, the App-rendered buffer must wait until the <em>next</em> <code>Vsync-SF</code> for composition, causing a ~16.6ms delay. You might wonder: <strong>if <code>SurfaceFlinger</code> could start composition immediately after the App swaps the buffer into <code>BufferQueue</code>, could we save those 0-16.6ms?</strong></p><p>Yes, that’s exactly what the Offset mechanism does. The App receives Vsync first, performs rendering, and after the Offset delay, <code>SurfaceFlinger</code> receives Vsync and begins composition. If the app’s buffer is ready, <code>SurfaceFlinger</code> can include it in the current composition, allowing the user to see it sooner.</p><h2 id="Offset-≠-0"><a href="#Offset-≠-0" class="headerlink" title="Offset ≠ 0"></a>Offset ≠ 0</h2><p>Below is an example with a 4ms Offset: <code>SurfaceFlinger</code> receives Vsync 4ms after the App does.</p><p><img src="/en/images/15751537928994.jpg"></p><h2 id="Pros-and-Cons-of-Offset"><a href="#Pros-and-Cons-of-Offset" class="headerlink" title="Pros and Cons of Offset"></a>Pros and Cons of Offset</h2><p>The challenge is determining the optimal Offset—one reason many manufacturers don’t configure it. Its effectiveness depends on device performance and usage scenarios.</p><ol><li><strong>If Offset is too short</strong>: The app might not finish rendering before <code>SurfaceFlinger</code> starts composition. If no previous buffers are ready, <code>SurfaceFlinger</code>‘s current composition won’t include the new frame, delaying it until the next <code>Vsync-SF</code>. The delay effectively becomes <code>Vsync period + Offset</code> instead of the expected <code>Offset</code>.</li><li><strong>If Offset is too long</strong>: It loses its purpose.</li></ol><p><a id="hw-vsync"></a></p><h1 id="HW-Vsync"><a href="#HW-Vsync" class="headerlink" title="HW_Vsync"></a>HW_Vsync</h1><p>Note that hardware Vsync isn’t requested every time. It’s only requested from HWC if the last composition was more than 500ms ago.</p><p>Using Launcher scrolling as an example, you can see the <code>HW_VSYNC</code> state in the <code>SurfaceFlinger</code> process trace.</p><p><img src="/en/images/15751538069738.jpg"></p><p>Subsequent Vsync requests from Apps can occur either with or without <code>HW_VSYNC</code>.</p><h2 id="Without-HW-VSYNC"><a href="#Without-HW-VSYNC" class="headerlink" title="Without HW_VSYNC"></a>Without HW_VSYNC</h2><p><img src="/en/images/15751538170844.jpg"></p><h2 id="With-HW-VSYNC"><a href="#With-HW-VSYNC" class="headerlink" title="With HW_VSYNC"></a>With HW_VSYNC</h2><p><img src="/en/images/15751538247774.jpg"></p><p><code>HW_VSYNC</code> primarily uses recent hardware Vsync timestamps for prediction (usually 3-32, minimum 6). <code>DispSync</code> calculates <code>SW_VSYNC</code> after receiving 6 timestamps. As long as incoming <code>Present Fence</code> errors remain within threshold, hardware Vsync is turned off; otherwise it remains active to recalibrate <code>SW_VSYNC</code>. For details, see <a href="https://juejin.im/post/5dbe658be51d452a45800e76#heading-20">Generation and Transmission of SW-VSYNC</a>. Here is their conclusion:</p><blockquote><p><code>SurfaceFlinger</code> implements the <code>HWC2::ComposerCallback</code> interface to receive hardware VSYNC callbacks and pass them to <code>DispSync</code>. <code>DispSync</code> records these timestamps. After collecting enough (currently ≥6), it calculates the <code>SW-VSYNC</code> offset <code>mPeriod</code>. This is used by <code>DispSyncThread</code> to periodically wake and notify listeners—<code>SurfaceFlinger</code> and all apps needing to render. Listeners register via <code>Connection</code> objects in <code>EventThread</code>, which is linked to <code>DispSyncThread</code> through <code>DispSyncSource</code>. When <code>SW-VSYNC</code> arrives, <code>EventThread</code> notifies connections, triggering <code>SurfaceFlinger</code> composition and App frame drawing. Once enough hardware VSYNCs are received and errors are within tolerance, hardware VSYNC is disabled via <code>EventControlThread</code>.</p></blockquote><p><a id="others"></a></p><h1 id="Other-Addresses-for-This-Article"><a href="#Other-Addresses-for-This-Article" class="headerlink" title="Other Addresses for This Article"></a>Other Addresses for This Article</h1><p>To be updated.</p><p><a id="refs"></a></p><h1 id="References"><a href="#References" class="headerlink" title="References"></a>References</h1><ol><li><a href="https://source.android.google.cn/devices/graphics/implement-vsync">VSYNC</a></li><li><a href="https://juejin.im/post/5b6948086fb9a04fb87771fb">Sync and Vsync</a></li><li><a href="http://gityuan.com/2017/02/05/graphic_arch/">Android Graphics Architecture</a></li><li><a href="https://juejin.im/post/5dbe658be51d452a45800e76#heading-20">Generation and Transmission of SW-VSYNC</a></li><li><a href="http://echuang54.blogspot.com/2015/01/dispsync.html">DispSync Implementation Details</a></li></ol><p><a id="about"></a></p><h1 id="About-Me-amp-amp-Blog"><a href="#About-Me-amp-amp-Blog" class="headerlink" title="About Me &amp;&amp; Blog"></a>About Me &amp;&amp; Blog</h1><p>Below is my personal intro and related links. I look forward to exchanging ideas with fellow professionals. “When three walk together, one can always be my teacher!”</p><ol><li><a href="https://www.androidperformance.com/en/about/">Blogger Intro</a>: Includes personal WeChat and WeChat group links.</li><li><a href="https://www.androidperformance.com/en/2019/12/01/BlogMap/">Blog Content Navigation</a>: A guide for my blog content.</li><li><a href="https://www.androidperformance.com/en/2018/05/07/Android-performance-optimization-skills-and-tools/">Curated Excellent Blog Articles - Android Performance Optimization Must-Knows</a>: Welcome to recommend projects&#x2F;articles.</li><li><a href="https://www.androidperformance.com/en/2023/12/30/the-performance/">Android Performance Optimization Knowledge Planet</a>: Welcome to join and thank you for your support~</li></ol><blockquote><p><strong>One walks faster alone, but a group walks further together.</strong></p></blockquote><p><img src="/en/images/WechatIMG581.webp" alt="Scan WeChat QR Code"></p>]]></content>
    
    
    <summary type="html">&lt;p&gt;This is the seventh article in the Systrace series, primarily introducing the Vsync mechanism in Android. This article examines the display of each frame in the Android system from the perspective of Systrace. Vsync is a critical mechanism in Systrace. Although invisible and intangible when operating a phone, we can see in Systrace how the Android system, guided by Vsync signals, orderly performs rendering and composition for each frame, ensuring stable frame rates.&lt;/p&gt;
&lt;p&gt;The purpose of this series is to view the overall operation of the Android system from a different perspective using Systrace, while also providing an alternative angle for learning the Framework. Perhaps you’ve read many articles about the Framework but can never remember the code, or you’re unclear about the execution flow. Maybe from Systrace’s graphical perspective, you can gain a deeper understanding.&lt;/p&gt;</summary>


    <category term="Android" scheme="https://androidperformance.com/en/categories/Android/"/>
    
    
    <category term="Android" scheme="https://androidperformance.com/en/tags/Android/"/>
    
    <category term="Systrace" scheme="https://androidperformance.com/en/tags/Systrace/"/>
    
    <category term="Startup" scheme="https://androidperformance.com/en/tags/Startup/"/>
    
    <category term="Jank" scheme="https://androidperformance.com/en/tags/Jank/"/>
    
    <category term="Performance" scheme="https://androidperformance.com/en/tags/Performance/"/>
    
  </entry>
  
  <entry>
    <title>Complete Guide to Android App Startup Optimization</title>
    <link href="https://androidperformance.com/en/2019/11/18/Android-App-Lunch-Optimize-NEW/"/>
    <id>https://androidperformance.com/en/2019/11/18/Android-App-Lunch-Optimize-NEW/</id>
    <published>2019-11-18T15:02:46.000Z</published>
    <updated>2026-05-10T23:29:51.053Z</updated>
    
    <content type="html"><![CDATA[<p>This article compiles most current Android app startup optimization solutions. If you need optimization guidance, simply reference this article to review others’ approaches and identify gaps. Many solutions require business-specific adjustments, so this article doesn’t detail every method—when you need a particular solution, search online for its specific implementation. This serves as a comprehensive reference.</p><p>I’ve also included some system manufacturer optimizations related to startup, though I’ve only listed those I’m aware of. Some manufacturers have proprietary technologies not discussed here. Understanding manufacturer practices may help you—for example, contacting manufacturers for whitelisting or integrating their SDKs.</p><span id="more"></span><p>First update the startup measurement workflow. <code>adb shell am start -W</code> is still useful for quick local <code>ThisTime</code>&#x2F;<code>TotalTime</code>&#x2F;<code>WaitTime</code> checks, but it is not a stable release-quality metric and does not cover complex first-frame, first-content, login-state, warmup, or device-load scenarios. Encode important startup paths as Macrobenchmark tests and use <code>StartupTimingMetric</code> for repeatable cold, warm, and hot startup measurement. Use Baseline Profiles&#x2F;Startup Profiles to improve first-launch and critical-path compilation, Android Vitals to monitor app startup time, ANR, slow&#x2F;frozen frames, and LMK in the field, and Perfetto&#x2F;System Trace to align SystemServer, app main thread, RenderThread, I&#x2F;O, Binder, GC, and first-frame evidence.</p><h1 id="App-Startup-Overview"><a href="#App-Startup-Overview" class="headerlink" title="App Startup Overview"></a>App Startup Overview</h1><h2 id="General-App-Startup-Flow"><a href="#General-App-Startup-Flow" class="headerlink" title="General App Startup Flow"></a>General App Startup Flow</h2><p>From tapping the app icon on the home screen to having the main interface ready for user interaction, app startup generally follows this flow:</p><p><img src="/en/images/15740895170994.jpg"></p><p>During app startup, the two most critical processes are <strong>SystemServer</strong> and <strong>App Process</strong>. Their responsibilities are divided as follows:</p><ul><li><strong>SystemServer handles app startup flow scheduling, process creation and management, window creation and management (StartingWindow and AppWindow), etc.</strong></li><li><strong>After being created by SystemServer, the app process performs a series of process initializations, component initializations (Activity, Service, ContentProvider, Broadcast), main interface construction, content population, etc.</strong></li></ul><h2 id="Cold-Start-vs-Hot-Start"><a href="#Cold-Start-vs-Hot-Start" class="headerlink" title="Cold Start vs. Hot Start"></a>Cold Start vs. Hot Start</h2><p>We also need to introduce the concepts of cold start and hot start, which we frequently encounter:</p><ul><li><strong>Cold Start</strong>: When starting an app with no existing process in the background, the system creates a new process for the app, then launches the corresponding process components based on startup parameters.</li><li><strong>Hot Start</strong>: When starting an app with an existing process in the background (e.g., after pressing back&#x2F;home—the app exits but its process remains in the background, visible in the task list), the startup reuses the existing process to launch the corresponding components.</li></ul><h2 id="Measuring-Startup-Speed"><a href="#Measuring-Startup-Speed" class="headerlink" title="Measuring Startup Speed"></a>Measuring Startup Speed</h2><p>Different companies have their own measurement methods. The key challenge is defining the endpoint of startup—some apps are easy to measure, while others are too complex for direct measurement. Methods like <code>adb</code> are fine for personal experimentation but useless in production; screen recording itself introduces performance overhead…</p><p>I recommend learning from the measurement approach mentioned in <a href="https://mp.weixin.qq.com/s?__biz=MzAxNDEwNjk5OQ==&mid=2650403370&idx=1&sn=b4297b138eb7f73c95a6279c3458f025&chksm=83953a32b4e2b3247fc18cbee08a2682d8b09720a1c5fef0c36257ae92b1e201cb1ad3125455&mpshare=1&scene=1&srcid=#rd">“历时1年，上百万行代码！首次揭秘手淘全链路性能优化（上）”</a>: automated, stable, and integrated into CI&#x2F;CD.</p><blockquote><p>Extract text information from images using OCR as key features. This algorithm’s advantages: 1. App pages typically contain text; OCR can recognize text on images—text appearance indicates image loading completion, aligning with user perception. 2. Using text as features filters out much noise from image features, reducing algorithm debugging effort. Additionally, Alibaba Group has mature, excellent OCR services—“读光” with over 99.7% document recognition rate. Using the OCR service encapsulated by the Waterdrop platform enables quick integration. The final recognition solution is based on OCR.</p></blockquote><h1 id="App-Level-Optimizations"><a href="#App-Level-Optimizations" class="headerlink" title="App-Level Optimizations"></a>App-Level Optimizations</h1><h2 id="Startup-Window-Optimization"><a href="#Startup-Window-Optimization" class="headerlink" title="Startup Window Optimization"></a>Startup Window Optimization</h2><p>The startup window, also called the launch page, SplashWindow, or StartingWindow, refers to the preview window displayed during app startup. iOS apps mandatorily have a launch screen—after users tap the app icon, the system immediately shows this launch window, then displays the main page once ready. Android has a similar mechanism (the startup window is system-provided) but also provides an interface for developers to set whether to show this startup window (default is show). Some developers disable the system-provided startup window and implement their own.</p><p>However, displaying a custom window takes longer than showing the system’s startup window, causing user-perceived delay—tapping the icon results in a pause before the window animation enters the app. We should avoid this:</p><ul><li><strong>Don’t disable the system’s default startup window</strong>: i.e., don’t set <code>android:windowDisablePreview</code> to <code>true</code> in the theme.</li><li>Customize startup window content: e.g., set the splash page theme background to the splash image, or尽量使闪屏页面的主题和主页一致 (make the splash page theme consistent with the main page). Reference practices from Zhihu and TikTok.</li><li>Merge splash and main page Activities: WeChat’s approach. However, since WeChat sets <code>android:windowDisablePreview</code> and is on most manufacturers’ whitelists (rarely killed), cold starts are infrequent. Still, it’s worth considering.</li></ul><h2 id="Thread-Optimization"><a href="#Thread-Optimization" class="headerlink" title="Thread Optimization"></a>Thread Optimization</h2><p>Thread optimization primarily reduces CPU scheduling fluctuations, making startup times more stable. Too many threads launching simultaneously puts significant pressure on the CPU, especially on lower-end devices. Excessive concurrent threads increase the main thread’s Sleep and Runnable states, slowing app startup. During optimization, note:</p><ul><li>Control thread count—use thread pools.</li><li>Check inter-thread locks to prevent dependency waits.</li><li>Use reasonable startup architectures:<ul><li>mmkernel (used internally by WeChat)</li><li>Alibaba’s Alpha</li></ul></li></ul><h2 id="System-Scheduling-Optimization"><a href="#System-Scheduling-Optimization" class="headerlink" title="System Scheduling Optimization"></a>System Scheduling Optimization</h2><p>During app startup, if the main thread handles too much work, it becomes overly busy. Note these system scheduling-related points:</p><ul><li><strong>Reduce system calls during startup</strong>, avoiding lock competition with AMS and WMS. During startup, AMS and WMS already handle much work, and many AMS&#x2F;WMS operations are locked. If the app makes excessive Binder calls to communicate with AMS&#x2F;WMS, SystemServer experiences大量锁等待 (significant lock waits), blocking critical operations.</li><li><strong>Don’t launch child processes during startup</strong>. If multiple processes start simultaneously, system load doubles, and SystemServer becomes busier.</li><li><strong>Be cautious launching components other than Activity during startup</strong>. Since all four major components launch on the main thread, slow component startup占用Message通道 (occupies the Message channel), affecting app startup speed.</li><li>Asynchronously initialize certain code in Application and main Activity’s onCreate.</li></ul><p>Busy CPU during startup:<br><img src="/en/images/15740895432157.jpg"></p><p>Busy SystemServer during startup:<br><img src="/en/images/15740895514226.jpg"></p><h2 id="GC-Optimization"><a href="#GC-Optimization" class="headerlink" title="GC Optimization"></a>GC Optimization</h2><p>Reduce GC frequency during startup:</p><ul><li>Avoid大量字符串操作 (extensive string operations), especially serialization&#x2F;deserialization.</li><li>Consider reusing frequently created objects.</li><li>Move implementations to Native.</li></ul><p>Reference: <a href="https://juejin.im/post/5be1077d518825171140dbfa">“支付宝客户端架构解析：Android 客户端启动速度优化之「垃圾回收」”</a></p><h2 id="IO-Optimization"><a href="#IO-Optimization" class="headerlink" title="IO Optimization"></a>IO Optimization</h2><p>Startup负载比较高 (load is relatively high), with many system IOs occurring simultaneously. IO performance declines rapidly during this period, making app IO operations slower than usual, especially on lower-performance devices.</p><p>IO分为网络IO和磁盘IO (IO分为网络IO和磁盘IO). Avoid network IO during startup. For disk IO, scrutinize carefully—as mentioned in the expert course:</p><ol><li>Understand exactly what files are read during startup: how many bytes, buffer size, duration, thread, etc.</li><li>Monitor IO during startup. WeChat discovered users with 500MB database files during IO monitoring.</li></ol><p><img src="/en/images/15740895712642.jpg"></p><p>The image below shows significant IO waits on the main thread during app startup under low memory (UI Thread column, orange代表IO等待 (represents IO wait)):</p><p><img src="/en/images/15740895799020.jpg"></p><p><img src="/en/images/15740895863900.jpg"></p><h2 id="Resource-Reordering"><a href="#Resource-Reordering" class="headerlink" title="Resource Reordering"></a>Resource Reordering</h2><p>Leverage Linux’s IO reading策略 (strategies), PageCache, and ReadAhead mechanisms. Reorder resources according to read sequence to reduce disk IO次数 (count). For具体操作 (specific operations), reference <a href="https://juejin.im/post/5be400c3f265da61476fb63c">“支付宝 App 构建优化解析：通过安装包重排布优化 Android 端启动性能”</a>.</p><p>Between the底层文件系统 (underlying filesystem) VFS and app processes lies a pagecache layer composed of physical pages in memory, whose content corresponds to blocks on disk. Pagecache size changes dynamically—it can expand or shrink under memory pressure. Cached storage devices are called backing store. A page typically contains multiple blocks, which aren’t necessarily contiguous.</p><p><img src="/en/images/15740895943096.jpg"></p><p>Combining file re-layout with the Pagecache mechanism reduces actual IO次数 (count) during startup. Simply put, file re-layout arranges files needed during startup phase together within the APK,尽可能利用pagecache机制 (maximizing use of the pagecache mechanism), reading as many startup-phase files as possible with minimal disk IO, reducing IO overhead to improve startup performance.</p><h2 id="Class-Reordering"><a href="#Class-Reordering" class="headerlink" title="Class Reordering"></a>Class Reordering</h2><p>Class reordering adjusts class arrangement within Dex files using ReDex’s Interdex. Interdex optimization doesn’t require analyzing class references—it simply reorders classes within Dex, placing startup-required classes sequentially in the main dex. We can implement this entirely during compilation. This optimization improves startup speed, with Facebook’s data showing significant效果 (effectiveness) and high cost-effectiveness. For具体实现 (specific implementation), reference <a href="https://mp.weixin.qq.com/s/Bf41Kez_OLZTyty4EondHA">“Redex 初探与 Interdex：Andorid 冷启动优化”</a>.</p><h2 id="Main-Page-Layout-Optimization"><a href="#Main-Page-Layout-Optimization" class="headerlink" title="Main Page Layout Optimization"></a>Main Page Layout Optimization</h2><p>Main interface layout optimization is a common topic. Combined approaches无非就是下面两点 (essentially boil down to these two points), requiring optimization based on specific interface layouts. Plenty of online resources exist:</p><ul><li>Reduce view hierarchy by eliminating冗余或者嵌套布局 (redundant or nested layouts).</li><li>Replace UI controls not needed during startup with ViewStub.</li><li>Use custom Views instead of complex View stacking.</li></ul><h2 id="Idle-Calls"><a href="#Idle-Calls" class="headerlink" title="Idle Calls"></a>Idle Calls</h2><p>IdleHandler: Called only when the Handler is idle. If返回true (returns true), it continues executing; if返回false (returns false), it executes once then removes itself from the message queue. For example, we can place server token fetching in a delayed IdleHandler, or load less important Views via IdleHandler.</p><h2 id="Class-Loading-Optimization"><a href="#Class-Loading-Optimization" class="headerlink" title="Class Loading Optimization"></a>Class Loading Optimization</h2><p>You can see the verifyClass process in systrace-generated files. Since it需要校验方法的每一个指令 (needs to verify every instruction of each method), it’s a relatively time-consuming operation.</p><p><img src="/en/images/15740896151484.jpg"></p><h2 id="App-Thinning-App-瘦身"><a href="#App-Thinning-App-瘦身" class="headerlink" title="App Thinning (App 瘦身)"></a>App Thinning (App 瘦身)</h2><p>App thinning includes both code and resource optimization. Common practices include:</p><ul><li><strong>Inspect Code</strong>: Use Android Studio’s built-in code inspection tool, which embeds Lint for static analysis.</li><li><strong>Code Obfuscation</strong>: Use ProGuard&#x2F;R8 to remove unused code and shrink the APK size.</li><li><strong>Image Format Selection</strong>: If image quality requirements are not critical, consider using RGB_565 format instead of ARGB_8888.</li><li><strong>Resource Obfuscation</strong>: Implement resource name obfuscation to reduce APK size.</li><li><strong>Reduce Dex Count</strong>: Minimize the number of Dex files to improve class loading performance.</li></ul><h2 id="Choosing-the-Right-Startup-Framework-选择合适的启动框架"><a href="#Choosing-the-Right-Startup-Framework-选择合适的启动框架" class="headerlink" title="Choosing the Right Startup Framework (选择合适的启动框架)"></a>Choosing the Right Startup Framework (选择合适的启动框架)</h2><p>Startup optimization requires systematic process organization. We introduce the concept of a <strong>Directed Acyclic Graph (DAG)</strong> to structure the startup flow. The entire startup process is organized into a DAG structure, with tasks loaded sequentially.</p><p>In the startup phase, we first load essential startup items using a multi-process approach, controlled by the DAG. Non-essential items can be deferred for later loading. The DAG-based sequential loading also considers process requirements, determining which items should load in the main process versus other processes.</p><p>This approach draws inspiration from Spark’s DAGScheduler, which employs <strong>Stage-Oriented Scheduling</strong>: dividing applications into stages and arranging tasks within those stages. By building a DAG, task dependencies are clearly organized. Stage-based execution allows concentrating resources to complete stage one before moving to stage two, controlling congestion while ensuring proper sequencing and enabling concurrent execution to maximize device performance.</p><p>For reference, see Taobao’s full-link optimization case: <a href="https://yq.aliyun.com/articles/710466">“历时1年，上百万行代码！首次揭秘手淘全链路性能优化（上）”</a></p><h2 id="Startup-Network-Optimization-启动网络链路优化"><a href="#Startup-Network-Optimization-启动网络链路优化" class="headerlink" title="Startup Network Optimization (启动网络链路优化)"></a>Startup Network Optimization (启动网络链路优化)</h2><h3 id="Problems-and-Optimization-Points"><a href="#Problems-and-Optimization-Points" class="headerlink" title="Problems and Optimization Points"></a>Problems and Optimization Points</h3><ul><li><strong>Send&#x2F;Receive Processing Stage</strong>: Network library bindService affects the first few requests; image concurrency limits cause thread queuing in image libraries.</li><li><strong>Network Latency</strong>: Some requests have large response sizes, including SO files, cache resources, and large original images.</li><li><strong>Response Processing</strong>: Complex JSON parsing for certain data gateway requests causes severe delays (up to 3s), compounded by inappropriate historical thread queue designs.</li><li><strong>UI Blocking</strong>: Callbacks to the UI thread get blocked, causing severe main thread stutter. High-end devices experience ~1s delays, while low-end devices worsen to 3s+.</li><li><strong>Callback Blocking</strong>: Some business callbacks execute slowly, blocking either the main thread or callback threads.</li></ul><h3 id="Optimization-Strategies"><a href="#Optimization-Strategies" class="headerlink" title="Optimization Strategies"></a>Optimization Strategies</h3><ul><li><strong>Request Consolidation</strong>: Business teams must consolidate duplicate requests and reduce non-essential ones.</li><li><strong>Large Data Requests</strong>: Defer or cancel non-essential large requests like resource files and SO libraries during startup.</li><li><strong>Callback Optimization</strong>: Business teams must optimize callbacks that block the main thread. For smooth 60fps operation, each frame must complete within 16ms. Push teams whose callbacks exceed 16ms on the main thread to optimize their execution.</li><li><strong>JSON Parsing Optimization</strong>: Overly complex JSON structures cause severe parsing delays. Since network concurrency threads are limited, lengthy parsing occupies MTOP threads, affecting other critical requests. Encourage business teams to use custom threads for parsing or simplify JSON structures.</li></ul><h2 id="Preloading-预加载"><a href="#Preloading-预加载" class="headerlink" title="Preloading (预加载)"></a>Preloading (预加载)</h2><p>Preload data before the Activity opens, then display the preloaded data once the UI layout initializes, significantly reducing startup time. Reference implementation: <a href="https://github.com/luckybilly/PreLoader/blob/master/README-zh-CN.md">PreLoader</a></p><h2 id="Keep-Alive-保活"><a href="#Keep-Alive-保活" class="headerlink" title="Keep-Alive (保活)"></a>Keep-Alive (保活)</h2><p>Keep-alive is both a nightmare for app developers and a focus area for Android manufacturers. From a startup perspective, if an app process isn’t killed, startup naturally becomes faster (hot start). However, we don’t recommend using “black magic” techniques like mutual wake-up or notification bombing.</p><p>Instead, provide genuine functionality that makes users feel your background presence is reasonable and acceptable. When in the background, release all possible resources, avoid power-hungry operations, stop unnecessary services, and disable animations.</p><p>While this may seem idealistic given current manufacturer practices (aggressively killing background apps), it’s the right direction. Google is working on both standardizing app background behavior and regulating manufacturer app handling. Improving Android’s ecosystem requires collaboration between app developers and manufacturers.</p><p>Another approach is collaborating with manufacturers: optimize background memory usage, eliminate duplicate wake-ups, remove aggressive logic, and respond promptly to low-memory warnings. After implementing these improvements, contact system manufacturers to discuss <strong>feasibility for whitelisting in both kill lists and auto-start lists</strong>.</p><h2 id="Business-Organization-业务梳理"><a href="#Business-Organization-业务梳理" class="headerlink" title="Business Organization (业务梳理)"></a>Business Organization (业务梳理)</h2><p>This involves specific business logic unique to each app, though the approach remains consistent. As mentioned in the expert course:</p><ul><li><strong>Audit Every Module</strong>: Clearly identify which modules are absolutely necessary during startup, which can be eliminated, and which can be lazily loaded.</li><li><strong>Different Launch Modes</strong>: Determine different startup patterns based on various business scenarios.</li><li><strong>Prevent Centralization</strong>: Implement lazy loading to avoid resource concentration.</li></ul><p>Business logic can be categorized into four dimensions:</p><ul><li><strong>Essential &amp; Time-Consuming</strong>: Startup initialization - consider using threads for initialization.</li><li><strong>Essential &amp; Fast</strong>: Homepage rendering.</li><li><strong>Non-Essential but Time-Consuming</strong>: Data reporting, plugin initialization.</li><li><strong>Non-Essential &amp; Fast</strong>: Remove entirely; load only when needed.</li></ul><p>Then optimize loading based on these categories.</p><h2 id="Business-Optimization-业务优化"><a href="#Business-Optimization-业务优化" class="headerlink" title="Business Optimization (业务优化)"></a>Business Optimization (业务优化)</h2><ol><li><strong>Optimize Code Efficiency</strong>: Focus on obvious bottlenecks first, then gradually optimize other areas.</li><li><strong>Address Technical Debt</strong>: Refactor historical code; don’t let it accumulate indefinitely.</li></ol><p>Specific businesses have specific optimization scenarios. Reference this article for optimization processes and items: <a href="https://www.jianshu.com/p/f5514b1a826c">https://www.jianshu.com/p/f5514b1a826c</a></p><blockquote><ol><li>Move database and IO operations to worker threads with THREAD_PRIORITY_BACKGROUND priority (maximum 10% CPU time slice), ensuring main thread execution priority.</li><li><strong>Process Organization &amp; Deferred Execution</strong>: Most effective for startup acceleration. Through process analysis, discover issues like:<ul><li>Update operations called before first screen display, causing resource competition.</li><li>Calls to iOS-specific switches (for App Store review avoidance) causing dense network requests.</li><li>Custom statistics creating fixed 5-thread pools in Application, causing resource competition.</li><li>Modify ad splash logic to take effect next time.</li></ul></li><li>Remove unused legacy code still being executed.</li><li>Remove development-only code executed in production.</li><li>Eliminate duplicate logic execution.</li><li>Remove excess code in third-party SDKs or demos.</li><li><strong>Information Caching</strong>: Cache commonly used information; fetch only once, then retrieve from cache.</li><li><strong>Multi-process Architecture</strong>: Execute Application.onCreate() only in the main process.</li></ol></blockquote><h2 id="Reducing-Activity-Navigation-Hierarchy-减少Activity的跳转层次"><a href="#Reducing-Activity-Navigation-Hierarchy-减少Activity的跳转层次" class="headerlink" title="Reducing Activity Navigation Hierarchy (减少Activity的跳转层次)"></a>Reducing Activity Navigation Hierarchy (减少Activity的跳转层次)</h2><p>The StartingWindow is created and displayed immediately after user taps the app icon (provided the app hasn’t disabled StartingWindow). When the AppWindow is ready, the StartingWindow disappears, and the AppWindow displays.</p><h3 id="Default-App-Startup-Window-Flow"><a href="#Default-App-Startup-Window-Flow" class="headerlink" title="Default App Startup Window Flow"></a>Default App Startup Window Flow</h3><figure class="highlight cpp"><table><tr><td class="gutter"><pre><span class="line">1</span><br><span class="line">2</span><br></pre></td><td class="code"><pre><span class="line"><span class="built_in">StartingWindow</span>(SystemWindow)</span><br><span class="line">  -&gt; <span class="built_in">MainActivity</span>(AppWindow)</span><br></pre></td></tr></table></figure><h3 id="Most-Third-Party-App-Startup-Flow"><a href="#Most-Third-Party-App-Startup-Flow" class="headerlink" title="Most Third-Party App Startup Flow"></a>Most Third-Party App Startup Flow</h3><figure class="highlight cpp"><table><tr><td class="gutter"><pre><span class="line">1</span><br><span class="line">2</span><br><span class="line">3</span><br></pre></td><td class="code"><pre><span class="line"><span class="built_in">StartingWindow</span>(SystemWindow)</span><br><span class="line">  -&gt; <span class="built_in">SplashActivity</span>(AppWindow)</span><br><span class="line">    -&gt; <span class="built_in">MainActivity</span>(AppWindow)</span><br></pre></td></tr></table></figure><h3 id="Worse-Startup-Flow"><a href="#Worse-Startup-Flow" class="headerlink" title="Worse Startup Flow"></a>Worse Startup Flow</h3><figure class="highlight cpp"><table><tr><td class="gutter"><pre><span class="line">1</span><br><span class="line">2</span><br><span class="line">3</span><br><span class="line">4</span><br></pre></td><td class="code"><pre><span class="line"><span class="built_in">StartingWindow</span>(SystemWindow)</span><br><span class="line">  -&gt; <span class="built_in">MainActivity</span>(AppWindow)</span><br><span class="line">    -&gt; <span class="built_in">SplashActivity</span>(AppWindow)</span><br><span class="line">      -&gt; <span class="built_in">MainActivity</span>(AppWindow)</span><br></pre></td></tr></table></figure><h3 id="Even-Worse-Disabled-StartingWindow"><a href="#Even-Worse-Disabled-StartingWindow" class="headerlink" title="Even Worse: Disabled StartingWindow"></a>Even Worse: Disabled StartingWindow</h3><figure class="highlight cpp"><table><tr><td class="gutter"><pre><span class="line">1</span><br><span class="line">2</span><br></pre></td><td class="code"><pre><span class="line"><span class="built_in">SplashActivity</span>(AppWindow)</span><br><span class="line">   -&gt; <span class="built_in">MainActivity</span>(AppWindow)</span><br></pre></td></tr></table></figure><p>For users, the first flow is best, involving only one window transition. Some apps use the second flow due to ad page requirements. However, avoid the third and fourth flows as they provide poor user experience.</p><h1 id="Manufacturer-Optimizations-厂商优化"><a href="#Manufacturer-Optimizations-厂商优化" class="headerlink" title="Manufacturer Optimizations (厂商优化)"></a>Manufacturer Optimizations (厂商优化)</h1><p>Beyond app-level optimizations, Android frameworks also focus heavily on application startup, implementing numerous optimizations. Different manufacturers have varying strategies, but most include these approaches:</p><h3 id="Startup-Acceleration"><a href="#Startup-Acceleration" class="headerlink" title="Startup Acceleration"></a>Startup Acceleration</h3><p>During app launch, the system heavily prioritizes resources (CPU, IO, GPU) for the launching app. Capture a Systrace to see this - whether in frequency or scheduling algorithms, the launching app receives VIP treatment.</p><p>Some manufacturers provide resource scheduling SDKs that apps can integrate to request resources directly when needed.</p><h3 id="PreFork"><a href="#PreFork" class="headerlink" title="PreFork"></a>PreFork</h3><p>Android Q introduced the PreFork mechanism, which forks several empty processes in advance. When an app launches, it can directly reuse these pre-forked processes instead of forking anew.</p><h3 id="Message-Reordering"><a href="#Message-Reordering" class="headerlink" title="Message Reordering"></a>Message Reordering</h3><p>Reorganizing messages during startup to prioritize launch-related operations.</p><h3 id="Main-Thread-amp-Render-Thread-Acceleration"><a href="#Main-Thread-amp-Render-Thread-Acceleration" class="headerlink" title="Main Thread &amp; Render Thread Acceleration"></a>Main Thread &amp; Render Thread Acceleration</h3><p>Some manufacturers give special treatment to the app’s main and render threads during startup, such as forcing them onto big cores while moving less important threads to little cores.</p><h3 id="Startup-Prediction"><a href="#Startup-Prediction" class="headerlink" title="Startup Prediction"></a>Startup Prediction</h3><p>Some scenarios learn user habits - when, where, and in what context users typically open their phones. The system predicts which app you’ll launch and pre-warms it in the background, making your tap result in a hot start.</p><h3 id="Background-Keep-Alive"><a href="#Background-Keep-Alive" class="headerlink" title="Background Keep-Alive"></a>Background Keep-Alive</h3><p>Systems may specially handle certain apps to improve user experience, including: <strong>process&#x2F;thread priority adjustment, kill whitelisting, user frequent app recording</strong>, etc. Appropriate background keep-alive ensures the next launch is a hot start.</p><h3 id="Background-Restart"><a href="#Background-Restart" class="headerlink" title="Background Restart"></a>Background Restart</h3><p>Systems may specially handle important apps that shouldn’t be killed. Some manufacturers perform seamless restarts when such apps go to the background. For example, if an app exceeds memory limits or crashes continuously, background restart effectively addresses this, ensuring the next user launch is a hot start.</p><h3 id="Memory-Optimization"><a href="#Memory-Optimization" class="headerlink" title="Memory Optimization"></a>Memory Optimization</h3><p>Some apps require substantial memory during startup (e.g., modern camera apps). Without sufficient memory, the system must kill many apps and release caches to make room, causing these memory-intensive apps to perform frequent memory operations during startup, slowing them down.</p><p>Some manufacturers monitor such memory-intensive app launches and perform memory reclamation in advance, ensuring sufficient memory is available when the app starts.</p><h3 id="Optimizing-Startup-Logic"><a href="#Optimizing-Startup-Logic" class="headerlink" title="Optimizing Startup Logic"></a>Optimizing Startup Logic</h3><p>Android system updates also optimize app startup speed, such as the aforementioned Pre-Fork mechanism and simplifying doFrame counts.</p><h1 id="OEM-Level-Optimizations"><a href="#OEM-Level-Optimizations" class="headerlink" title="OEM-Level Optimizations"></a>OEM-Level Optimizations</h1><p>System manufacturers also optimize for startup:</p><ul><li><strong>Resource Tipping</strong>: During an app launch, the system tilts CPU, IO, and GPU resources toward that process (VIP treatment).</li><li><strong>Pre-Fork (Android Q+)</strong>: Forking empty processes in advance to save time when an app starts.</li><li><strong>Message Reordering</strong>: Prioritizing startup-related messages in the queue.</li><li><strong>Big Core Allocation</strong>: Forcing the app’s main and render threads onto high-performance CPU cores.</li><li><strong>Startup Prediction</strong>: Learning user habits to pre-warm apps in the background.</li></ul><h1 id="References"><a href="#References" class="headerlink" title="References"></a>References</h1><ol><li><a href="https://mp.weixin.qq.com/s?__biz=MzAxMTI4MTkwNQ==&mid=2650829097&idx=2&sn=e59841d4b1ed7e12a30e29ec51072d70&chksm=80b7a5b7b7c02ca184e0c06289d90823d589e738c55712318875f51e4aeb8646294b8d426299&mpshare=1&scene=1&srcid=&sharer_sharetime=1571275213308&sharer_shareid=60bd7acea7881a97fbf9a6126d3e88d3#rd">都9102年了，Android 冷启动优化除了老三样还有哪些新招？</a></li><li><a href="https://developer.android.google.cn/topic/performance/vitals/launch-time">App startup time</a></li><li><a href="https://mp.weixin.qq.com/s?__biz=MzAxNDEwNjk5OQ==&mid=2650403370&idx=1&sn=b4297b138eb7f73c95a6279c3458f025&chksm=83953a32b4e2b3247fc18cbee08a2682d8b09720a1c5fef0c36257ae92b1e201cb1ad3125455&mpshare=1&scene=1&srcid=#rd">历时1年，上百万行代码！首次揭秘手淘全链路性能优化（上）</a></li><li><a href="https://time.geekbang.org/column/intro/142">极客时间 ： Android 高手开发课</a></li><li><a href="https://github.com/facebook/redex">Facebook-Redex</a></li><li><a href="http://yummylau.com/2019/03/15/%E6%BA%90%E7%A0%81%E8%A7%A3%E6%9E%90%E4%B9%8B%20alpha/">关于 Android 异步启动框架 alpha 的思考</a></li><li><a href="https://mp.weixin.qq.com/s/79tAFx6zi3JRG-ewoapIVQ">支付宝 App 构建优化解析：通过安装包重排布优化 Android 端启动性能</a></li><li><a href="https://github.com/facebook/redex">Redex 官网</a></li><li><a href="https://mp.weixin.qq.com/s/Bf41Kez_OLZTyty4EondHA">Redex 初探与 Interdex：Andorid 冷启动优化</a></li><li><a href="https://juejin.im/post/5c21ea325188254eaa5c45b1#heading-5">Android性能优化笔记（一）——启动优化</a></li></ol><h1 id="Other-Locations-for-This-Article"><a href="#Other-Locations-for-This-Article" class="headerlink" title="Other Locations for This Article"></a>Other Locations for This Article</h1><p>Since blog comments aren’t convenient for discussion, you can visit the Zhihu or Juejin versions of this article for likes and交流:</p><p><a href="https://zhuanlan.zhihu.com/p/92497570">知乎 - Android App 启动优化全记录</a></p><h1 id="About-Me-amp-amp-Blog"><a href="#About-Me-amp-amp-Blog" class="headerlink" title="About Me &amp;&amp; Blog"></a>About Me &amp;&amp; Blog</h1><p>Below is my personal introduction and related links. I look forward to exchanging ideas with fellow professionals. “When three walk together, one can always be my teacher!”</p><ol><li><a href="https://www.androidperformance.com/about/">Blogger Introduction</a> : Contains personal WeChat and WeChat group links.</li><li><a href="https://androidperformance.com/2019/12/01/BlogMap/">Blog Content Navigation</a> : A navigation guide for my blog content.</li><li><a href="https://androidperformance.com/2018/05/07/Android-performance-optimization-skills-and-tools/">Curated Excellent Blog Articles - Android Performance Optimization Must-Knows</a> : Welcome self-recommendations and recommendations (WeChat private chat is fine).</li><li><a href="https://www.androidperformance.com/2023/12/30/the-performance/">Android Performance Optimization Knowledge Planet</a> : Welcome to join, thanks for your support!</li></ol><blockquote><p><strong>One walks faster alone, but a group walks further together.</strong></p></blockquote><p><img src="/en/images/WechatIMG581.webp" alt="Scan WeChat QR Code"></p>]]></content>
    
    
    <summary type="html">&lt;p&gt;This article compiles most current Android app startup optimization solutions. If you need optimization guidance, simply reference this article to review others’ approaches and identify gaps. Many solutions require business-specific adjustments, so this article doesn’t detail every method—when you need a particular solution, search online for its specific implementation. This serves as a comprehensive reference.&lt;/p&gt;
&lt;p&gt;I’ve also included some system manufacturer optimizations related to startup, though I’ve only listed those I’m aware of. Some manufacturers have proprietary technologies not discussed here. Understanding manufacturer practices may help you—for example, contacting manufacturers for whitelisting or integrating their SDKs.&lt;/p&gt;</summary>


    <category term="Android" scheme="https://androidperformance.com/en/categories/Android/"/>
    
    
    <category term="Android" scheme="https://androidperformance.com/en/tags/Android/"/>
    
    <category term="Startup" scheme="https://androidperformance.com/en/tags/Startup/"/>
    
    <category term="Memory" scheme="https://androidperformance.com/en/tags/Memory/"/>
    
    <category term="Performance" scheme="https://androidperformance.com/en/tags/Performance/"/>
    
    <category term="Linux" scheme="https://androidperformance.com/en/tags/Linux/"/>
    
  </entry>
  
  <entry>
    <title>Comprehensive Record of Android App Startup Optimization</title>
    <link href="https://androidperformance.com/en/2019/11/18/Android-App-Lunch-Optimize/"/>
    <id>https://androidperformance.com/en/2019/11/18/Android-App-Lunch-Optimize/</id>
    <published>2019-11-18T15:02:46.000Z</published>
    <updated>2026-05-10T23:29:51.053Z</updated>
    
    <content type="html"><![CDATA[<p>This article summarizes major Android app startup optimization strategies available today. If you need to optimize your app’s launch performance, use this as a checklist to identify gaps in your current implementation. Since many solutions depend on specific business requirements, I focus on presenting the options rather than deep-diving into every implementation detail. You can easily find specific technical guides for each method online.</p><p>I’ve also included some optimizations performed by system manufacturers. Understanding what happens at the OS level can help you make better decisions, such as requesting whitelisting or integrating manufacturer SDKs.</p><span id="more"></span><p>First update the startup measurement workflow. <code>adb shell am start -W</code> is still useful for quick local <code>ThisTime</code>&#x2F;<code>TotalTime</code>&#x2F;<code>WaitTime</code> checks, but it is not a stable release-quality metric and does not cover complex first-frame, first-content, login-state, warmup, or device-load scenarios. Encode important startup paths as Macrobenchmark tests and use <code>StartupTimingMetric</code> for repeatable cold, warm, and hot startup measurement. Use Baseline Profiles&#x2F;Startup Profiles to improve first-launch and critical-path compilation, Android Vitals to monitor app startup time, ANR, slow&#x2F;frozen frames, and LMK in the field, and Perfetto&#x2F;System Trace to align SystemServer, app main thread, RenderThread, I&#x2F;O, Binder, GC, and first-frame evidence.</p><h1 id="Application-Startup-Overview"><a href="#Application-Startup-Overview" class="headerlink" title="Application Startup Overview"></a>Application Startup Overview</h1><h2 id="General-Startup-Workflow"><a href="#General-Startup-Workflow" class="headerlink" title="General Startup Workflow"></a>General Startup Workflow</h2><p>The journey from tapping an app icon to the main interface becoming interactive follows this general flow:</p><p><img src="/en/images/15740895170994.jpg"></p><p>The two most critical processes during startup are <strong>SystemServer</strong> and the <strong>App Process</strong>.</p><ul><li><strong>SystemServer</strong>: Handles startup scheduling, process creation&#x2F;management, and window creation&#x2F;management (StartingWindow and AppWindow).</li><li><strong>App Process</strong>: Once created, it performs process initialization, component initialization (Activity, Service, ContentProvider, Broadcast), main UI construction, and content inflation.</li></ul><h2 id="Cold-vs-Hot-Startup"><a href="#Cold-vs-Hot-Startup" class="headerlink" title="Cold vs. Hot Startup"></a>Cold vs. Hot Startup</h2><p>These are two fundamental concepts in performance optimization:</p><ul><li><strong>Cold Startup</strong>: Starting an app when its process isn’t running in the background. The system must create a new process and initialize components from scratch.</li><li><strong>Hot Startup</strong>: Starting an app when its process is already alive in the background (e.g., after the user pressed Back or Home). The system simply brings the existing process to the foreground and restarts the activity.</li></ul><h2 id="Measuring-Startup-Speed"><a href="#Measuring-Startup-Speed" class="headerlink" title="Measuring Startup Speed"></a>Measuring Startup Speed</h2><p>While every team has its own method, the challenge lies in defining the “end point” of a startup. Simple tools like <code>adb shell am start -W</code> are fun but unsuitable for production. Screen recording introduces performance overhead.</p><p>I recommend the methodology used by the Mobile Taobao team: <strong>Automated, Stable, and CI-integrated</strong>. They use OCR to extract text from screenshots as key features. When text appears, the image is considered “loaded,” which aligns with actual user perception.</p><h1 id="App-Level-Optimizations"><a href="#App-Level-Optimizations" class="headerlink" title="App-Level Optimizations"></a>App-Level Optimizations</h1><h2 id="1-Startup-Window-Optimization"><a href="#1-Startup-Window-Optimization" class="headerlink" title="1. Startup Window Optimization"></a>1. Startup Window Optimization</h2><p>The <strong>StartingWindow</strong> (also known as SplashWindow or Preview Window) is shown immediately by the system when the user taps the icon.</p><ul><li><strong>Do not disable the system’s default preview window</strong>: Avoid setting <code>android:windowDisablePreview</code> to <code>true</code> in your theme. Disabling it causes a jarring lag between the icon tap and the first frame of your app.</li><li><strong>Customize the StartingWindow</strong>: Set the splash theme’s background to match your app’s primary color or brand logo.</li><li><strong>Merge Splash and Main Activity</strong>: This reduces one activity transition, though it requires careful management of internal state.</li></ul><h2 id="2-Thread-Optimization"><a href="#2-Thread-Optimization" class="headerlink" title="2. Thread Optimization"></a>2. Thread Optimization</h2><p>Excessive concurrent threads during startup strain the CPU, especially on low-end devices. This leads to more Sleep and Runnable states for the main thread, slowing down the launch.</p><ul><li>Control thread counts using thread pools.</li><li>Audit locks to prevent dependency deadlocks.</li><li>Use a structured startup framework (e.g., mmkernel, Alpha).</li></ul><h2 id="3-System-Schedule-Optimization"><a href="#3-System-Schedule-Optimization" class="headerlink" title="3. System Schedule Optimization"></a>3. System Schedule Optimization</h2><p>Avoid making the main thread too busy.</p><ul><li><strong>Minimize system calls</strong>: Avoid excessive communication with AMS&#x2F;WMS during launch to prevent lock competition in <code>SystemServer</code>.</li><li><strong>Avoid starting sub-processes</strong>: Multiplying processes during startup doubles the system burden.</li><li><strong>Be cautious with other components</strong>: Activity, Service, ContentProvider, and BroadcastReceiver initializations all happen on the main thread.</li><li>Asynchronously initialize non-critical code in <code>Application</code> and <code>MainActivity</code>.</li></ul><h2 id="4-GC-Optimization"><a href="#4-GC-Optimization" class="headerlink" title="4. GC Optimization"></a>4. GC Optimization</h2><p>Reduce the number of GC cycles during startup.</p><ul><li>Avoid heavy string manipulations, especially serialization&#x2F;deserialization.</li><li>Reuse frequently created objects.</li><li>Move logic to Native code if possible.</li></ul><h2 id="5-IO-Optimization"><a href="#5-IO-Optimization" class="headerlink" title="5. IO Optimization"></a>5. IO Optimization</h2><p>IO performance drops significantly under the high load of startup.</p><ul><li>Monitor exactly which files are read, the buffer sizes used, and on which threads.</li><li>Avoid network IO during initial launch.</li><li>Optimize disk IO, especially for large database files.</li></ul><h2 id="6-Resource-Reordering"><a href="#6-Resource-Reordering" class="headerlink" title="6. Resource Reordering"></a>6. Resource Reordering</h2><p>Use Linux’s <strong>PageCache</strong> and <strong>ReadAhead</strong> mechanisms. By reordering files in the APK to match their read sequence during startup, you can minimize disk seeks and improve performance.</p><h2 id="7-Class-Reordering"><a href="#7-Class-Reordering" class="headerlink" title="7. Class Reordering"></a>7. Class Reordering</h2><p>Use tools like <strong>ReDex (Interdex)</strong> to adjust the order of classes within the Dex file. Moving classes needed during startup to the primary Dex file can provide a noticeable speed boost.</p><h2 id="8-Layout-Optimization"><a href="#8-Layout-Optimization" class="headerlink" title="8. Layout Optimization"></a>8. Layout Optimization</h2><ul><li>Decrease view hierarchy depth.</li><li>Use <code>ViewStub</code> for UI elements not needed immediately.</li><li>Use custom Views instead of complex nested layouts.</li></ul><h2 id="9-IdleHandler-Usage"><a href="#9-IdleHandler-Usage" class="headerlink" title="9. IdleHandler Usage"></a>9. IdleHandler Usage</h2><p>Use <code>IdleHandler</code> to execute non-critical tasks (like fetching push tokens or loading secondary UI) only when the message queue is idle.</p><h2 id="10-Class-Loading-Optimization"><a href="#10-Class-Loading-Optimization" class="headerlink" title="10. Class Loading Optimization"></a>10. Class Loading Optimization</h2><p>Watch for <code>verifyClass</code> in Systrace. This verification process can be time-consuming as the system checks every instruction.</p><h2 id="11-App-Thinning"><a href="#11-App-Thinning" class="headerlink" title="11. App Thinning"></a>11. App Thinning</h2><ul><li>Use <strong>Inspect Code</strong> (Lint) for cleanup.</li><li>Use ProGuard&#x2F;R8 for obfuscation and shrinking.</li><li>Prefer <code>RGB_565</code> for images where high quality isn’t critical.</li><li>Use resource obfuscators and reduce the number of Dex files.</li></ul><h2 id="12-Startup-Frameworks"><a href="#12-Startup-Frameworks" class="headerlink" title="12. Startup Frameworks"></a>12. Startup Frameworks</h2><p>Structure your startup tasks using a <strong>Directed Acyclic Graph (DAG)</strong>. This allows you to manage dependencies clearly and execute independent tasks in parallel across multiple stages, maximizing hardware utilization while preventing congestion.</p><h2 id="13-Networking-Optimization"><a href="#13-Networking-Optimization" class="headerlink" title="13. Networking Optimization"></a>13. Networking Optimization</h2><ul><li>Batch requests to reduce the number of individual connections.</li><li>Defer non-essential data and resource downloads.</li><li>Optimize JSON parsing; complex strings can block the main thread for seconds on low-end devices.</li></ul><h2 id="14-Pre-loading"><a href="#14-Pre-loading" class="headerlink" title="14. Pre-loading"></a>14. Pre-loading</h2><p>Load data before the Activity is even created, and show it once the UI is ready.</p><h2 id="15-Process-Preservation-Keep-Alive"><a href="#15-Process-Preservation-Keep-Alive" class="headerlink" title="15. Process Preservation (Keep-Alive)"></a>15. Process Preservation (Keep-Alive)</h2><p>While controversial, if a process isn’t killed, the “startup” becomes a hot start. Instead of “black magic” (which OEMs target), focus on being a “good citizen”: release resources in the background, stop unnecessary services&#x2F;animations, and respond to low-memory warnings. This builds trust and might help you get on an OEM’s <strong>Whitelist</strong>.</p><h2 id="16-Business-Component-Review"><a href="#16-Business-Component-Review" class="headerlink" title="16. Business Component Review"></a>16. Business Component Review</h2><p>Audit every module initialized at startup. Use these 4 categories:</p><ul><li><strong>Essential &amp; Time-Consuming</strong>: Move to a background thread.</li><li><strong>Essential &amp; Fast</strong>: Keep on the main thread.</li><li><strong>Non-Essential but Time-Consuming</strong>: Defer or use lazy loading.</li><li><strong>Non-Essential &amp; Fast</strong>: Remove or load on demand.</li></ul><h2 id="17-Activity-Jump-Hierarchy"><a href="#17-Activity-Jump-Hierarchy" class="headerlink" title="17. Activity Jump Hierarchy"></a>17. Activity Jump Hierarchy</h2><p>Always prefer: <code>StartingWindow -&gt; MainActivity</code>.<br>Avoid: <code>StartingWindow -&gt; SplashActivity -&gt; MainActivity</code> if possible, as every transition adds latency.</p><h1 id="OEM-Level-Optimizations"><a href="#OEM-Level-Optimizations" class="headerlink" title="OEM-Level Optimizations"></a>OEM-Level Optimizations</h1><p>System manufacturers also optimize for startup:</p><ul><li><strong>Resource Tipping</strong>: During an app launch, the system tilts CPU, IO, and GPU resources toward that process (VIP treatment).</li><li><strong>Pre-Fork (Android Q+)</strong>: Forking empty processes in advance to save time when an app starts.</li><li><strong>Message Reordering</strong>: Prioritizing startup-related messages in the queue.</li><li><strong>Big Core Allocation</strong>: Forcing the app’s main and render threads onto high-performance CPU cores.</li><li><strong>Startup Prediction</strong>: Learning user habits to pre-warm apps in the background.</li></ul><h1 id="References"><a href="#References" class="headerlink" title="References"></a>References</h1><p>(List of references in original article)</p><h1 id="About-Me-amp-amp-Blog"><a href="#About-Me-amp-amp-Blog" class="headerlink" title="About Me &amp;&amp; Blog"></a>About Me &amp;&amp; Blog</h1><p>(Links and introduction)</p>]]></content>
    
    
    <summary type="html">&lt;p&gt;This article summarizes major Android app startup optimization strategies available today. If you need to optimize your app’s launch performance, use this as a checklist to identify gaps in your current implementation. Since many solutions depend on specific business requirements, I focus on presenting the options rather than deep-diving into every implementation detail. You can easily find specific technical guides for each method online.&lt;/p&gt;
&lt;p&gt;I’ve also included some optimizations performed by system manufacturers. Understanding what happens at the OS level can help you make better decisions, such as requesting whitelisting or integrating manufacturer SDKs.&lt;/p&gt;</summary>


    <category term="Android" scheme="https://androidperformance.com/en/categories/Android/"/>
    
    
    <category term="Android" scheme="https://androidperformance.com/en/tags/Android/"/>
    
    <category term="Startup" scheme="https://androidperformance.com/en/tags/Startup/"/>
    
    <category term="Memory" scheme="https://androidperformance.com/en/tags/Memory/"/>
    
    <category term="Performance" scheme="https://androidperformance.com/en/tags/Performance/"/>
    
    <category term="Linux" scheme="https://androidperformance.com/en/tags/Linux/"/>
    
  </entry>
  
  <entry>
    <title>Android Systrace Basics - MainThread and RenderThread Explained</title>
    <link href="https://androidperformance.com/en/2019/11/06/Android-Systrace-MainThread-And-RenderThread/"/>
    <id>https://androidperformance.com/en/2019/11/06/Android-Systrace-MainThread-And-RenderThread/</id>
    <published>2019-11-06T09:11:45.000Z</published>
    <updated>2026-05-10T23:29:51.060Z</updated>
    
    <content type="html"><![CDATA[<p>This is the ninth article in the Systrace series, primarily introducing the <code>MainThread</code> and <code>RenderThread</code> in Android Apps—commonly known as the <strong>Main Thread</strong> and <strong>Rendering Thread</strong>. This article examines their workflows from the perspective of Systrace and covers related topics: jank, software rendering, and dropped frame calculation.</p><p>The purpose of this series is to view the overall operation of the Android system from a different perspective using Systrace, while also providing an alternative angle for learning the Framework. Perhaps you’ve read many articles about the Framework but can never remember the code, or you’re unclear about the execution flow. Maybe from Systrace’s graphical perspective, you can gain a deeper understanding.</p><span id="more"></span><h2 id="Table-of-Contents"><a href="#Table-of-Contents" class="headerlink" title="Table of Contents"></a>Table of Contents</h2><ul><li><a href="#series">Series Article Index</a></li><li><a href="#content">Main Content</a></li><li><a href="#main-thread">Creation of the Main Thread</a></li><li><a href="#render-thread">Creation and Evolution of the Render Thread</a></li><li><a href="#division">Division of Labor: Main Thread vs. Render Thread</a></li><li><a href="#game">Main Thread and Render Thread in Games</a></li><li><a href="#flutter">Main Thread and Render Thread in Flutter</a></li><li><a href="#performance">Performance</a></li><li><a href="#refs">References</a></li><li><a href="#attachments">Attachments</a></li><li><a href="#others">Other Addresses</a></li><li><a href="#about">About Me &amp;&amp; Blog</a></li></ul><p><a id="series"></a></p><h1 id="Series-Article-Index"><a href="#Series-Article-Index" class="headerlink" title="Series Article Index"></a>Series Article Index</h1><ol><li><a href="https://www.androidperformance.com/en/2019/05/28/Android-Systrace-About/">Introduction to Systrace</a></li><li><a href="https://www.androidperformance.com/en/2019/07/23/Android-Systrace-Pre/">Systrace Basics - Prerequisites for Systrace</a></li><li><a href="https://www.androidperformance.com/en/2019/05/27/why-60-fps/">Systrace Basics - Why 60 fps?</a></li><li><a href="https://www.androidperformance.com/en/2019/06/29/Android-Systrace-SystemServer/">Android Systrace Basics - SystemServer Explained</a></li><li><a href="https://www.androidperformance.com/en/2020/02/14/Android-Systrace-SurfaceFlinger/">Systrace Basics - SurfaceFlinger Explained</a></li><li><a href="https://www.androidperformance.com/en/2019/11/04/Android-Systrace-Input/">Systrace Basics - Input Explained</a></li><li><a href="https://www.androidperformance.com/en/2019/12/01/Android-Systrace-Vsync/">Systrace Basics - Vsync Explained</a></li><li><a href="https://www.androidperformance.com/en/2019/10/22/Android-Choreographer/">Systrace Basics - Vsync-App: Detailed Explanation of Choreographer-Based Rendering Mechanism</a></li><li><a href="https://www.androidperformance.com/en/2019/11/06/Android-Systrace-MainThread-And-RenderThread/">Systrace Basics - MainThread and RenderThread Explained</a></li><li><a href="https://www.androidperformance.com/en/2019/12/06/Android-Systrace-Binder/">Systrace Basics - Binder and Lock Contention Explained</a></li><li><a href="https://www.androidperformance.com/en/2019/12/15/Android-Systrace-Triple-Buffer">Systrace Basics - Triple Buffer Explained</a></li><li><a href="https://www.androidperformance.com/en/2019/12/21/Android-Systrace-CPU">Systrace Basics - CPU Info Explained</a></li><li><a href="https://www.androidperformance.com/en/2021/04/24/android-systrace-smooth-in-action-1/">Systrace Smoothness in Action 1: Understanding Jank Principles</a></li><li><a href="https://www.androidperformance.com/en/2021/04/24/android-systrace-smooth-in-action-2/">Systrace Smoothness in Action 2: Case Analysis - MIUI Launcher Scroll Jank Analysis</a></li><li><a href="https://www.androidperformance.com/en/2021/04/24/android-systrace-smooth-in-action-3/">Systrace Smoothness in Action 3: FAQs During Jank Analysis</a></li><li><a href="https://www.androidperformance.com/en/2021/09/13/android-systrace-Responsiveness-in-action-1/">Systrace Responsiveness in Action 1: Understanding Responsiveness Principles</a></li><li><a href="https://www.androidperformance.com/en/2021/09/13/android-systrace-Responsiveness-in-action-2/">Systrace Responsiveness in Action 2: Responsiveness Analysis - Using App Startup as an Example</a></li><li><a href="https://www.androidperformance.com/en/2021/09/13/android-systrace-Responsiveness-in-action-3/">Systrace Responsiveness in Action 3: Extended Knowledge on Responsiveness</a></li></ol><p><a id="content"></a></p><h1 id="Main-Content"><a href="#Main-Content" class="headerlink" title="Main Content"></a>Main Content</h1><p>This article maps directly to <a href="https://www.androidperformance.com/en/2025/03/26/Android-Perfetto-05-Chorergrapher/">Perfetto 5: Choreographer-based rendering flow</a> and <a href="https://www.androidperformance.com/en/2025/08/02/Android-Perfetto-07-MainThread-And-RenderThread/">Perfetto 7: MainThread and RenderThread</a>. The old Systrace article focuses on the relative position of UI Thread, RenderThread, and SurfaceFlinger within one frame. The current Perfetto articles read the same flow through thread tracks, Frame Timeline, CPU scheduling, and buffer movement.</p><p>When analyzing jank today, do not only ask whether a main-thread slice exceeded 16.6ms. A better workflow is to start from the frame budget for the actual refresh rate, then check whether the main thread was woken by Vsync, which part of <code>doFrame</code> exceeded budget, whether RenderThread was blocked while syncing render data or queueing the buffer, and whether CPU scheduling, Binder, locks, or SurfaceFlinger pushed wait time back into the app. The old diagrams help establish frame order; the current Perfetto workflow should continue into the wait reason.</p><p>Using list scrolling as an example, we intercept the workflow of <strong>a single frame</strong> for the main thread and rendering thread (every frame follows this process, though some involve more work than others). Pay special attention to the “UI Thread” and <code>RenderThread</code> rows.</p><p><img src="/en/images/15732904872967.jpg"></p><p><strong>The workflow corresponding to this diagram is as follows:</strong></p><ol><li>The main thread is in a Sleep state, waiting for the Vsync signal.</li><li>Vsync arrived, and the main thread is woken up. <code>Choreographer</code> callbacks <code>FrameDisplayEventReceiver.onVsync</code> to start drawing a frame.</li><li>Process the App’s Input events for this frame (if any).</li><li>Process the App’s Animation events for this frame (if any).</li><li>Process the App’s Traversal events for this frame (if any).</li><li>The main thread synchronizes rendering data with the rendering thread. Once synchronization is finished, the main thread completes its drawing for the frame. It can then process the next Message (if any, <code>IdleHandler</code> will also be triggered if not empty) or return to Sleep to wait for the next Vsync.</li><li>The rendering thread first takes a Buffer from the <code>BufferQueue</code> (<code>dequeueBuffer</code>). After processing data and calling OpenGL-related functions for the actual rendering, it returns the rendered Buffer to the <code>BufferQueue</code> (<code>queueBuffer</code>). Once Vsync-SF arrives, <code>SurfaceFlinger</code> takes all prepared Buffers for composition (this process is mentioned in the <code>SurfaceFlinger</code> section).</li></ol><p>The above process is detailed in the article <a href="https://www.androidperformance.com/en/2019/10/22/Android-Choreographer/">Detailed Explanation of Android Rendering Mechanism Based on Choreographer</a>, including what <code>doFrame</code> does in each frame, jank calculation principles, and APM. I recommend checking that article if you haven’t yet.</p><p>In this article, we’ll dive into several points not covered in that previous piece to help you better understand the main and rendering threads:</p><ol><li>Evolution of the Main Thread</li><li>Creation of the Main Thread</li><li>Creation of the Render Thread</li><li>Division of Labor: Main Thread vs. Render Thread</li><li>Main Thread and Render Thread in Games</li><li>Main Thread and Render Thread in Flutter</li></ol><p><a id="main-thread"></a></p><h1 id="Creation-of-the-Main-Thread"><a href="#Creation-of-the-Main-Thread" class="headerlink" title="Creation of the Main Thread"></a>Creation of the Main Thread</h1><p>An Android App process is based on Linux, and its management follows Linux process management mechanisms. Thus, its creation involves the <code>fork</code> function:</p><p><code>frameworks/base/core/jni/com_android_internal_os_Zygote.cpp</code></p><figure class="highlight cpp"><table><tr><td class="gutter"><pre><span class="line">1</span><br></pre></td><td class="code"><pre><span class="line"><span class="type">pid_t</span> pid = fork();</span><br></pre></td></tr></table></figure><p>The forked process can be seen as the main thread, but it’s not yet connected to Android and cannot handle Android App Messages. Since Android App execution is <strong>message-driven</strong>, this forked main thread must be bound to the Android Message mechanism to handle various Messages.</p><p>This is where <strong><code>ActivityThread</code></strong> comes in. More accurately, it could be called <code>ProcessThread</code>. <code>ActivityThread</code> connects the forked process with the App’s Messages. Their cooperation forms what we know as the Android App main thread. <code>ActivityThread</code> isn’t literally a thread; it initializes the <code>MessageQueue</code>, <code>Looper</code>, and <code>Handler</code> required for the Message mechanism. Since its <code>Handler</code> processes most Messages, we typically refer to <code>ActivityThread</code> as the main thread, though it’s actually a logic processing unit for the main thread.</p><h2 id="Creation-of-ActivityThread"><a href="#Creation-of-ActivityThread" class="headerlink" title="Creation of ActivityThread"></a>Creation of ActivityThread</h2><p>After the App process is forked, control returns to the App process to find the <code>main</code> function of <code>ActivityThread</code>:</p><p><code>com/android/internal/os/ZygoteInit.java</code></p><figure class="highlight java"><table><tr><td class="gutter"><pre><span class="line">1</span><br><span class="line">2</span><br><span class="line">3</span><br><span class="line">4</span><br><span class="line">5</span><br></pre></td><td class="code"><pre><span class="line"><span class="keyword">static</span> <span class="keyword">final</span> Runnable <span class="title function_">childZygoteInit</span><span class="params">(</span></span><br><span class="line"><span class="params">        <span class="type">int</span> targetSdkVersion, String[] argv, ClassLoader classLoader)</span> &#123;</span><br><span class="line">    RuntimeInit.<span class="type">Arguments</span> <span class="variable">args</span> <span class="operator">=</span> <span class="keyword">new</span> <span class="title class_">RuntimeInit</span>.Arguments(argv);</span><br><span class="line">    <span class="keyword">return</span> RuntimeInit.findStaticMain(args.startClass, args.startArgs, classLoader);</span><br><span class="line">&#125;</span><br></pre></td></tr></table></figure><p>Here, <code>startClass</code> is <code>ActivityThread</code>. Once found and called, the logic moves to the <code>main</code> function of <code>ActivityThread</code>:</p><p><code>android/app/ActivityThread.java</code></p><figure class="highlight java"><table><tr><td class="gutter"><pre><span class="line">1</span><br><span class="line">2</span><br><span class="line">3</span><br><span class="line">4</span><br><span class="line">5</span><br><span class="line">6</span><br><span class="line">7</span><br><span class="line">8</span><br><span class="line">9</span><br><span class="line">10</span><br><span class="line">11</span><br><span class="line">12</span><br><span class="line">13</span><br><span class="line">14</span><br></pre></td><td class="code"><pre><span class="line"><span class="keyword">public</span> <span class="keyword">static</span> <span class="keyword">void</span> <span class="title function_">main</span><span class="params">(String[] args)</span> &#123;</span><br><span class="line">    <span class="comment">// 1. Initialize Looper and MessageQueue</span></span><br><span class="line">    Looper.prepareMainLooper();</span><br><span class="line">    <span class="comment">// 2. Initialize ActivityThread</span></span><br><span class="line">    <span class="type">ActivityThread</span> <span class="variable">thread</span> <span class="operator">=</span> <span class="keyword">new</span> <span class="title class_">ActivityThread</span>();</span><br><span class="line">    <span class="comment">// 3. Primarily calls AMS.attachApplicationLocked to sync process info and perform initialization</span></span><br><span class="line">    thread.attach(<span class="literal">false</span>, startSeq);</span><br><span class="line">    <span class="comment">// 4. Get the main thread Handler (H), where most App Messages are handled</span></span><br><span class="line">    <span class="keyword">if</span> (sMainThreadHandler == <span class="literal">null</span>) &#123;</span><br><span class="line">        sMainThreadHandler = thread.getHandler();</span><br><span class="line">    &#125;</span><br><span class="line">    <span class="comment">// 5. Initialization complete, Looper starts working</span></span><br><span class="line">    Looper.loop();</span><br><span class="line">&#125;</span><br></pre></td></tr></table></figure><p>The comments are clear. Once <code>main</code> finishes, the main thread is officially online. Its Systrace flow looks like this:</p><p><img src="/en/images/15732905074966.jpg"></p><h2 id="Functions-of-ActivityThread"><a href="#Functions-of-ActivityThread" class="headerlink" title="Functions of ActivityThread"></a>Functions of ActivityThread</h2><p>We often say Android’s four components run on the main thread. This is easily understood by looking at the <code>ActivityThread</code>‘s <code>Handler</code> Messages:</p><figure class="highlight java"><table><tr><td class="gutter"><pre><span class="line">1</span><br><span class="line">2</span><br><span class="line">3</span><br><span class="line">4</span><br><span class="line">5</span><br><span class="line">6</span><br><span class="line">7</span><br><span class="line">8</span><br><span class="line">9</span><br><span class="line">10</span><br><span class="line">11</span><br><span class="line">12</span><br><span class="line">13</span><br><span class="line">14</span><br><span class="line">15</span><br><span class="line">16</span><br></pre></td><td class="code"><pre><span class="line"><span class="keyword">class</span> <span class="title class_">H</span> <span class="keyword">extends</span> <span class="title class_">Handler</span> &#123; <span class="comment">// Snippet</span></span><br><span class="line">    <span class="keyword">public</span> <span class="keyword">static</span> <span class="keyword">final</span> <span class="type">int</span> <span class="variable">BIND_APPLICATION</span>        <span class="operator">=</span> <span class="number">110</span>;</span><br><span class="line">    <span class="keyword">public</span> <span class="keyword">static</span> <span class="keyword">final</span> <span class="type">int</span> <span class="variable">EXIT_APPLICATION</span>        <span class="operator">=</span> <span class="number">111</span>;</span><br><span class="line">    <span class="keyword">public</span> <span class="keyword">static</span> <span class="keyword">final</span> <span class="type">int</span> <span class="variable">RECEIVER</span>                <span class="operator">=</span> <span class="number">113</span>;</span><br><span class="line">    <span class="keyword">public</span> <span class="keyword">static</span> <span class="keyword">final</span> <span class="type">int</span> <span class="variable">CREATE_SERVICE</span>          <span class="operator">=</span> <span class="number">114</span>;</span><br><span class="line">    <span class="keyword">public</span> <span class="keyword">static</span> <span class="keyword">final</span> <span class="type">int</span> <span class="variable">STOP_SERVICE</span>            <span class="operator">=</span> <span class="number">116</span>;</span><br><span class="line">    <span class="keyword">public</span> <span class="keyword">static</span> <span class="keyword">final</span> <span class="type">int</span> <span class="variable">BIND_SERVICE</span>            <span class="operator">=</span> <span class="number">121</span>;</span><br><span class="line">    <span class="keyword">public</span> <span class="keyword">static</span> <span class="keyword">final</span> <span class="type">int</span> <span class="variable">UNBIND_SERVICE</span>          <span class="operator">=</span> <span class="number">122</span>;</span><br><span class="line">    <span class="keyword">public</span> <span class="keyword">static</span> <span class="keyword">final</span> <span class="type">int</span> <span class="variable">DUMP_SERVICE</span>            <span class="operator">=</span> <span class="number">123</span>;</span><br><span class="line">    <span class="keyword">public</span> <span class="keyword">static</span> <span class="keyword">final</span> <span class="type">int</span> <span class="variable">REMOVE_PROVIDER</span>         <span class="operator">=</span> <span class="number">131</span>;</span><br><span class="line">    <span class="keyword">public</span> <span class="keyword">static</span> <span class="keyword">final</span> <span class="type">int</span> <span class="variable">DISPATCH_PACKAGE_BROADCAST</span> <span class="operator">=</span> <span class="number">133</span>;</span><br><span class="line">    <span class="keyword">public</span> <span class="keyword">static</span> <span class="keyword">final</span> <span class="type">int</span> <span class="variable">DUMP_PROVIDER</span>           <span class="operator">=</span> <span class="number">141</span>;</span><br><span class="line">    <span class="keyword">public</span> <span class="keyword">static</span> <span class="keyword">final</span> <span class="type">int</span> <span class="variable">UNSTABLE_PROVIDER_DIED</span>  <span class="operator">=</span> <span class="number">142</span>;</span><br><span class="line">    <span class="keyword">public</span> <span class="keyword">static</span> <span class="keyword">final</span> <span class="type">int</span> <span class="variable">INSTALL_PROVIDER</span>        <span class="operator">=</span> <span class="number">145</span>;</span><br><span class="line">    <span class="keyword">public</span> <span class="keyword">static</span> <span class="keyword">final</span> <span class="type">int</span> <span class="variable">ON_NEW_ACTIVITY_OPTIONS</span> <span class="operator">=</span> <span class="number">146</span>;</span><br><span class="line">&#125;</span><br></pre></td></tr></table></figure><p>As shown, process creation, Activity launch, and management of Services, Receivers, and Providers are all handled here, leading into specific <code>handleXXX</code> methods.</p><p><img src="/en/images/15732905186985.jpg"></p><p><a id="render-thread"></a></p><h1 id="Creation-and-Evolution-of-the-Render-Thread"><a href="#Creation-and-Evolution-of-the-Render-Thread" class="headerlink" title="Creation and Evolution of the Render Thread"></a>Creation and Evolution of the Render Thread</h1><p>Now for the rendering thread, or <code>RenderThread</code>. Early Android versions didn’t have a dedicated rendering thread; all rendering was done on the main thread using the CPU via the <code>libSkia</code> library. <code>RenderThread</code> was introduced in Android Lollipop to take over some of the main thread’s rendering workload, reducing its burden.</p><h2 id="Software-Rendering"><a href="#Software-Rendering" class="headerlink" title="Software Rendering"></a>Software Rendering</h2><p>“Hardware acceleration” usually refers to GPU acceleration—using <code>RenderThread</code> to call the GPU for faster rendering. In current Android versions, hardware acceleration is enabled by default. Thus, processes with visible content will have both a main thread and a rendering thread by default. If we disable it in the <code>Application</code> tag of the <code>AndroidManifest</code> via:</p><figure class="highlight xml"><table><tr><td class="gutter"><pre><span class="line">1</span><br></pre></td><td class="code"><pre><span class="line">android:hardwareAccelerated=&quot;false&quot;</span><br></pre></td></tr></table></figure><p>The system will detect this and forgo initializing <code>RenderThread</code>, using the CPU via <code>libSkia</code> for direct rendering. Its Systrace looks like this:</p><p><img src="/en/images/15732905305035.jpg"></p><p>Compared to the hardware-accelerated version at the start, the main thread’s execution time increases significantly because it must handle rendering, making jank more likely and reducing the idle intervals for other Messages.</p><h2 id="Hardware-Accelerated-Rendering"><a href="#Hardware-Accelerated-Rendering" class="headerlink" title="Hardware-Accelerated Rendering"></a>Hardware-Accelerated Rendering</h2><p>With hardware acceleration on, the main thread’s <code>draw</code> function doesn’t perform the actual <code>drawCall</code>. Instead, it records the content to a <code>DisplayList</code>, which is then synced to the <code>RenderThread</code>. Once synced, the main thread is freed to handle other tasks while the <code>RenderThread</code> continues rendering.</p><p><img src="/en/images/15732905407683.jpg"></p><h2 id="Rendering-Thread-Initialization"><a href="#Rendering-Thread-Initialization" class="headerlink" title="Rendering Thread Initialization"></a>Rendering Thread Initialization</h2><p><code>RenderThread</code> is initialized when drawing content is required. Typically, when starting an Activity, the first <code>draw</code> execution checks if the rendering thread is initialized and performs the initialization if not.</p><p><code>android/view/ViewRootImpl.java</code></p><figure class="highlight java"><table><tr><td class="gutter"><pre><span class="line">1</span><br><span class="line">2</span><br></pre></td><td class="code"><pre><span class="line">mAttachInfo.mThreadedRenderer.initializeIfNeeded(</span><br><span class="line">        mWidth, mHeight, mAttachInfo, mSurface, surfaceInsets);</span><br></pre></td></tr></table></figure><p>Subsequently, <code>draw</code> is called directly:</p><p><code>android/graphics/HardwareRenderer.java</code></p><figure class="highlight java"><table><tr><td class="gutter"><pre><span class="line">1</span><br><span class="line">2</span><br><span class="line">3</span><br><span class="line">4</span><br><span class="line">5</span><br><span class="line">6</span><br><span class="line">7</span><br><span class="line">8</span><br><span class="line">9</span><br><span class="line">10</span><br><span class="line">11</span><br><span class="line">12</span><br></pre></td><td class="code"><pre><span class="line">mAttachInfo.mThreadedRenderer.draw(mView, mAttachInfo, <span class="built_in">this</span>);</span><br><span class="line"><span class="keyword">void</span> <span class="title function_">draw</span><span class="params">(View view, AttachInfo attachInfo, DrawCallbacks callbacks)</span> &#123;</span><br><span class="line">    <span class="keyword">final</span> <span class="type">Choreographer</span> <span class="variable">choreographer</span> <span class="operator">=</span> attachInfo.mViewRootImpl.mChoreographer;</span><br><span class="line">    choreographer.mFrameInfo.markDrawStart();</span><br><span class="line"></span><br><span class="line">    updateRootDisplayList(view, callbacks);</span><br><span class="line"></span><br><span class="line">    <span class="comment">// ... handle pending animating nodes ...</span></span><br><span class="line"></span><br><span class="line">    <span class="type">int</span> <span class="variable">syncResult</span> <span class="operator">=</span> syncAndDrawFrame(choreographer.mFrameInfo);</span><br><span class="line">    <span class="comment">// ... handle sync results ...</span></span><br><span class="line">&#125;</span><br></pre></td></tr></table></figure><p>The <code>draw</code> here only updates the <code>DisplayList</code>. Afterward, <code>syncAndDrawFrame</code> is called to notify the rendering thread to start work while releasing the main thread. Core implementation of <code>RenderThread</code> is in the <code>libhwui</code> library (<code>frameworks/base/libs/hwui</code>).</p><p><code>frameworks/base/libs/hwui/renderthread/RenderProxy.cpp</code></p><figure class="highlight cpp"><table><tr><td class="gutter"><pre><span class="line">1</span><br><span class="line">2</span><br><span class="line">3</span><br></pre></td><td class="code"><pre><span class="line"><span class="function"><span class="type">int</span> <span class="title">RenderProxy::syncAndDrawFrame</span><span class="params">()</span> </span>&#123;</span><br><span class="line">    <span class="keyword">return</span> mDrawFrameTask.<span class="built_in">drawFrame</span>();</span><br><span class="line">&#125;</span><br></pre></td></tr></table></figure><p>I won’t detail the full <code>RenderThread</code> workflow here, as it warrants its own article. Many excellent resources on <code>hwui</code> exist, which you can consult alongside the source code. Its core flow in Systrace looks like this:</p><p><img src="/en/images/15732905545821.jpg"></p><p><a id="division"></a></p><h2 id="Division-of-Labor-Main-Thread-vs-Render-Thread"><a href="#Division-of-Labor-Main-Thread-vs-Render-Thread" class="headerlink" title="Division of Labor: Main Thread vs. Render Thread"></a>Division of Labor: Main Thread vs. Render Thread</h2><p>The main thread handles process Messages, Input events, Animation logic, Measure, Layout, Draw, and updates the <code>DisplayList</code>, but it doesn’t interact directly with <code>SurfaceFlinger</code>. The rendering thread handles rendering-related work, partly via the CPU and partly by calling OpenGL functions.</p><p>With hardware acceleration, Android uses <code>DisplayList</code> instead of direct CPU drawing for each frame during the <code>Draw</code> phase. <code>DisplayList</code> is a record of drawing operations, abstracted as the <code>RenderNode</code> class. This indirect approach offers several advantages:</p><ol><li><code>DisplayList</code> can be drawn multiple times as needed without re-interacting with business logic.</li><li>Specific operations (like translation or scaling) can apply to the entire <code>DisplayList</code> without redistributing draw commands.</li><li>Once all draw operations are known, they can be optimized (e.g., drawing all text together).</li><li><code>DisplayList</code> processing can be offloaded to another thread (<code>RenderThread</code>).</li><li>The main thread can handle other Messages once <code>sync</code> is finished, without waiting for <code>RenderThread</code> to complete.</li></ol><p>Detailed <code>RenderThread</code> flow can be found here: <a href="http://www.cocoachina.com/articles/35302">http://www.cocoachina.com/articles/35302</a></p><p><a id="game"></a></p><h1 id="Main-Thread-and-Render-Thread-in-Games"><a href="#Main-Thread-and-Render-Thread-in-Games" class="headerlink" title="Main Thread and Render Thread in Games"></a>Main Thread and Render Thread in Games</h1><p>Most games use a separate rendering thread with its own <code>Surface</code> and interact directly with <code>SurfaceFlinger</code>. The main thread plays a minimal role, as most logic is implemented within the custom rendering thread.</p><p>Check the Systrace for “Honor of Kings” (Honor of Kings), focusing on the application process and <code>SurfaceFlinger</code> process (30fps):</p><p><img src="/en/images/15732905635210.jpg"></p><p>The main thread’s primary job is simply passing Input events to Unity’s rendering thread. The rendering thread then handles logic processing and screen updates.</p><p><img src="/en/images/15732905704149.jpg"></p><p><a id="flutter"></a></p><h1 id="Main-Thread-and-Render-Thread-in-Flutter"><a href="#Main-Thread-and-Render-Thread-in-Flutter" class="headerlink" title="Main Thread and Render Thread in Flutter"></a>Main Thread and Render Thread in Flutter</h1><p>Flutter Apps also show distinct patterns in Systrace. Since Flutter rendering is based on <code>libSkia</code>, it doesn’t use the standard <code>RenderThread</code>. Instead, it builds its own <code>RenderEngine</code>. Flutter’s two most important threads are the UI thread and the GPU thread, corresponding to the Framework and Engine layers mentioned below:</p><p><img src="/en/images/15732905786714.jpg"></p><p>Flutter also listens for Vsync signals. Its <code>VsyncView</code> uses <code>postFrameCallback</code> to monitor <code>doFrame</code> callbacks, then calls <code>nativeOnVsync</code> to pass information to the Flutter UI thread to begin a frame’s drawing.</p><p><img src="/en/images/15732905861662.jpg"></p><p>Flutter’s approach is similar to game development: it doesn’t depend on the specific platform, builds its own rendering pipeline, and offers fast updates and cross-platform advantages.</p><p>Flutter SDK includes the <code>Skia</code> library, enabling the latest <code>Skia</code> features without waiting for OS updates. Google has optimized <code>Skia</code> heavily, claiming performance comparable to native apps.</p><p><img src="/en/images/15732905929654.jpg"></p><p>Flutter’s framework is divided into Framework (Dart) and Engine (C++) layers. Apps are built on the Framework, which handles Build, Layout, Paint, and layer generation. The Engine combines those layers, generates textures, and submits data to the GPU via OpenGL.</p><p><img src="/en/images/15732906008462.jpg"></p><p>When the UI needs updating, the Framework notifies the Engine. The Engine waits for the next Vsync, notifies the Framework, which then performs animations, build, layout, compositing, and paint to generate a layer for the Engine. The Engine combines the layers and submits them to the GPU.</p><p><img src="/en/images/15732906073036.jpg"></p><p><a id="performance"></a></p><h1 id="Performance"><a href="#Performance" class="headerlink" title="Performance"></a>Performance</h1><p>If the main thread handles all tasks, long-running operations (like network access or database queries) will block the entire UI thread. A blocked thread cannot dispatch events, including draw events. Overloading the main thread leads to two major issues:</p><ol><li><strong>Jank</strong>: If the combined work of the main and rendering threads exceeds 16.6ms (at 60fps), dropped frames occur.</li><li><strong>Freeze</strong>: If the UI thread is blocked for several seconds (thresholds vary by component), users see the “<a href="http://developer.android.com/guide/practices/responsiveness.html">Application Not Responding</a>“ (ANR) dialog (though some manufacturers skip the dialog and crash to desktop).</li></ol><p>These are undesirable for users, so App developers must address them before release. ANR is relatively easy to locate via call stacks, but intermittent jank often requires tools like Systrace + TraceView. Understanding the relationship and mechanics of the main and rendering threads is crucial—this is the primary motivation for this series.</p><p>Regarding jank, consult these three articles. A janky App isn’t always the App’s fault; it could be the system. Regardless, you must first know how to analyze it.</p><ol><li><a href="https://www.androidperformance.com/en/2019/09/05/Android-Jank-Debug/">Overview of Jank Causes in Android - Methodology</a></li><li><a href="https://www.androidperformance.com/en/2019/09/05/Android-Jank-Due-To-System/">Overview of Jank Causes in Android - System Side</a></li><li><a href="https://www.androidperformance.com/en/2019/09/05/Android-Jank-Due-To-App/">Overview of Jank Causes in Android - App Side</a></li></ol><p><a id="refs"></a></p><h1 id="References"><a href="#References" class="headerlink" title="References"></a>References</h1><ol><li><a href="https://juejin.im/post/5a9e01c3f265da239d48ce32">https://juejin.im/post/5a9e01c3f265da239d48ce32</a></li><li><a href="http://www.cocoachina.com/articles/35302">http://www.cocoachina.com/articles/35302</a></li><li><a href="https://juejin.im/post/5b7767fef265da43803bdc65">https://juejin.im/post/5b7767fef265da43803bdc65</a></li><li><a href="http://gityuan.com/2019/06/15/flutter_ui_draw/">http://gityuan.com/2019/06/15/flutter_ui_draw&#x2F;</a></li><li><a href="https://developer.android.google.cn/guide/components/processes-and-threads">https://developer.android.google.cn/guide/components/processes-and-threads</a></li></ol><p><a id="attachments"></a></p><h1 id="Attachments"><a href="#Attachments" class="headerlink" title="Attachments"></a>Attachments</h1><p>Attachments for this article have been uploaded. Extract and open in <strong>Chrome</strong>:</p><p><a href="https://github.com/Gracker/SystraceForBlog/tree/master/Android_Systrace-MainThread-RenderThread">Download Systrace attachments for this article</a></p><p><a id="others"></a></p><h1 id="Other-Addresses"><a href="#Other-Addresses" class="headerlink" title="Other Addresses"></a>Other Addresses</h1><p>Please visit the Zhihu or Juejin pages for this article for comments or likes:<br><a href="https://juejin.im/post/5dc68556f265da4cff702742">Juejin - Systrace Basics - MainThread and RenderThread Explained</a></p><p><a id="about"></a></p><h1 id="About-Me-amp-amp-Blog"><a href="#About-Me-amp-amp-Blog" class="headerlink" title="About Me &amp;&amp; Blog"></a>About Me &amp;&amp; Blog</h1><p>Below is my personal intro and related links. I look forward to exchanging ideas with fellow professionals. “When three walk together, one can always be my teacher!”</p><ol><li><a href="https://www.androidperformance.com/en/about/">Blogger Intro</a>: Includes personal WeChat and WeChat group links.</li><li><a href="https://www.androidperformance.com/en/2019/12/01/BlogMap/">Blog Content Navigation</a>: A guide for my blog content.</li><li><a href="https://www.androidperformance.com/en/2018/05/07/Android-performance-optimization-skills-and-tools/">Curated Excellent Blog Articles - Android Performance Optimization Must-Knows</a>: Welcome to recommend projects&#x2F;articles.</li><li><a href="https://www.androidperformance.com/en/2023/12/30/the-performance/">Android Performance Optimization Knowledge Planet</a>: Welcome to join and thank you for your support~</li></ol><blockquote><p><strong>One walks faster alone, but a group walks further together.</strong></p></blockquote><p><img src="/en/images/WechatIMG581.webp" alt="Scan WeChat QR Code"></p>]]></content>
    
    
    <summary type="html">&lt;p&gt;This is the ninth article in the Systrace series, primarily introducing the &lt;code&gt;MainThread&lt;/code&gt; and &lt;code&gt;RenderThread&lt;/code&gt; in Android Apps—commonly known as the &lt;strong&gt;Main Thread&lt;/strong&gt; and &lt;strong&gt;Rendering Thread&lt;/strong&gt;. This article examines their workflows from the perspective of Systrace and covers related topics: jank, software rendering, and dropped frame calculation.&lt;/p&gt;
&lt;p&gt;The purpose of this series is to view the overall operation of the Android system from a different perspective using Systrace, while also providing an alternative angle for learning the Framework. Perhaps you’ve read many articles about the Framework but can never remember the code, or you’re unclear about the execution flow. Maybe from Systrace’s graphical perspective, you can gain a deeper understanding.&lt;/p&gt;</summary>


    <category term="Android" scheme="https://androidperformance.com/en/categories/Android/"/>
    
    
    <category term="Android" scheme="https://androidperformance.com/en/tags/Android/"/>
    
    <category term="Systrace" scheme="https://androidperformance.com/en/tags/Systrace/"/>
    
    <category term="Startup" scheme="https://androidperformance.com/en/tags/Startup/"/>
    
    <category term="Jank" scheme="https://androidperformance.com/en/tags/Jank/"/>
    
    <category term="Performance" scheme="https://androidperformance.com/en/tags/Performance/"/>
    
  </entry>
  
  <entry>
    <title>Android Systrace Basics - Input Interpretation</title>
    <link href="https://androidperformance.com/en/2019/11/04/Android-Systrace-Input/"/>
    <id>https://androidperformance.com/en/2019/11/04/Android-Systrace-Input/</id>
    <published>2019-11-04T01:38:29.000Z</published>
    <updated>2026-05-10T23:29:51.059Z</updated>
    
    <content type="html"><![CDATA[<p>This is the sixth article in the Systrace series, primarily providing a brief introduction to Input in Systrace. It covers the Input workflow, how Input information is represented in Systrace, and how to combine Input info to analyze related performance issues.</p><p>The purpose of this series is to view the overall operation of the Android system from a different perspective using Systrace, while also providing an alternative angle for learning the Framework. Perhaps you’ve read many articles about the Framework but can never remember the code, or you’re unclear about the execution flow. Maybe from Systrace’s graphical perspective, you can gain a deeper understanding.</p><span id="more"></span><h2 id="Table-of-Contents"><a href="#Table-of-Contents" class="headerlink" title="Table of Contents"></a>Table of Contents</h2><ul><li><a href="#series">Series Article Index</a></li><li><a href="#content">Main Content</a></li><li><a href="#input-overview">Input in Systrace</a></li><li><a href="#inputdown-ss">InputDown Event Workflow in SystemServer</a></li><li><a href="#inputdown-app">InputDown Event Workflow in App</a></li><li><a href="#key-points">Key Knowledge Points and Processes</a></li><li><a href="#input-vsync">Input Refresh and Vsync</a></li><li><a href="#input-debug">Input Debug Information</a></li><li><a href="#refs">References</a></li><li><a href="#attachments">Attachments</a></li><li><a href="#others">Other Addresses</a></li><li><a href="#about">About Me &amp;&amp; Blog</a></li></ul><p><a id="series"></a></p><h1 id="Series-Article-Index"><a href="#Series-Article-Index" class="headerlink" title="Series Article Index"></a>Series Article Index</h1><ol><li><a href="https://www.androidperformance.com/en/2019/05/28/Android-Systrace-About/">Introduction to Systrace</a></li><li><a href="https://www.androidperformance.com/en/2019/07/23/Android-Systrace-Pre/">Systrace Basics - Prerequisites for Systrace</a></li><li><a href="https://www.androidperformance.com/en/2019/05/27/why-60-fps/">Systrace Basics - Why 60 fps?</a></li><li><a href="https://www.androidperformance.com/en/2019/06/29/Android-Systrace-SystemServer/">Android Systrace Basics - SystemServer Explained</a></li><li><a href="https://www.androidperformance.com/en/2020/02/14/Android-Systrace-SurfaceFlinger/">Systrace Basics - SurfaceFlinger Explained</a></li><li><a href="https://www.androidperformance.com/en/2019/11/04/Android-Systrace-Input/">Systrace Basics - Input Explained</a></li><li><a href="https://www.androidperformance.com/en/2019/12/01/Android-Systrace-Vsync/">Systrace Basics - Vsync Explained</a></li><li><a href="https://www.androidperformance.com/en/2019/10/22/Android-Choreographer/">Systrace Basics - Vsync-App: Detailed Explanation of Choreographer-Based Rendering Mechanism</a></li><li><a href="https://www.androidperformance.com/en/2019/11/06/Android-Systrace-MainThread-And-RenderThread/">Systrace Basics - MainThread and RenderThread Explained</a></li><li><a href="https://www.androidperformance.com/en/2019/12/06/Android-Systrace-Binder/">Systrace Basics - Binder and Lock Contention Explained</a></li><li><a href="https://www.androidperformance.com/en/2019/12/15/Android-Systrace-Triple-Buffer">Systrace Basics - Triple Buffer Explained</a></li><li><a href="https://www.androidperformance.com/en/2019/12/21/Android-Systrace-CPU">Systrace Basics - CPU Info Explained</a></li><li><a href="https://www.androidperformance.com/en/2021/04/24/android-systrace-smooth-in-action-1/">Systrace Smoothness in Action 1: Understanding Jank Principles</a></li><li><a href="https://www.androidperformance.com/en/2021/04/24/android-systrace-smooth-in-action-2/">Systrace Smoothness in Action 2: Case Analysis - MIUI Launcher Scroll Jank Analysis</a></li><li><a href="https://www.androidperformance.com/en/2021/04/24/android-systrace-smooth-in-action-3/">Systrace Smoothness in Action 3: FAQs During Jank Analysis</a></li><li><a href="https://www.androidperformance.com/en/2021/09/13/android-systrace-Responsiveness-in-action-1/">Systrace Responsiveness in Action 1: Understanding Responsiveness Principles</a></li><li><a href="https://www.androidperformance.com/en/2021/09/13/android-systrace-Responsiveness-in-action-2/">Systrace Responsiveness in Action 2: Responsiveness Analysis - Using App Startup as an Example</a></li><li><a href="https://www.androidperformance.com/en/2021/09/13/android-systrace-Responsiveness-in-action-3/">Systrace Responsiveness in Action 3: Extended Knowledge on Responsiveness</a></li><li><a href="https://www.androidperformance.com/en/2022/01/21/android-systrace-cpu-state-runnable/">Systrace Thread CPU State Analysis Tips - Runnable</a></li><li><a href="https://www.androidperformance.com/en/2022/03/13/android-systrace-cpu-state-running/">Systrace Thread CPU State Analysis Tips - Running</a></li><li><a href="https://www.androidperformance.com/en/2022/03/13/android-systrace-cpu-state-sleep/">Systrace Thread CPU State Analysis Tips - Sleep and Uninterruptible Sleep</a></li></ol><p><a id="content"></a></p><h1 id="Main-Content"><a href="#Main-Content" class="headerlink" title="Main Content"></a>Main Content</h1><p>Read this Input article together with <a href="https://www.androidperformance.com/en/2025/03/26/Android-Perfetto-05-Chorergrapher/">Perfetto 5: Choreographer rendering flow</a> and <a href="https://www.androidperformance.com/en/2025/08/02/Android-Perfetto-07-MainThread-And-RenderThread/">Perfetto 7: MainThread and RenderThread</a>. In old Systrace, the key was the relative position of InputReader, InputDispatcher, the app main thread, and Vsync. In Perfetto, the same path should be read through SystemServer&#x2F;input related threads, the target app main thread, Choreographer slices, CPU scheduling, and Binder&#x2F;wakeup relationships.</p><p>The current workflow is to first confirm when the input event entered the system, then when InputDispatcher delivered it to the app, whether the app main thread moved from Sleep&#x2F;Runnable to Running in time, and whether it then requested and executed the Vsync-driven frame. That separates slow input dispatch, busy app main thread, CPU scheduling delay, and later rendering delay instead of judging only by one long Input slice in Systrace.</p><p>In the article <a href="https://www.androidperformance.com/en/2019/10/22/Android-Choreographer/">Detailed Explanation of Android Rendering Mechanism Based on Choreographer</a>, I mentioned that the execution of an Android App’s main thread is essentially driven by Messages. These Messages can be looping animations, timed tasks, or wake-ups from other threads. However, the most common is the <strong>Input Message</strong>. Input here refers to the category under <code>InputReader</code>, which includes not only touch events (Down, Up, Move) but also Key events (Home Key, Back Key). In this article, we focus on <strong>touch events</strong>.</p><p>Because the Android system has added Trace points along the Input chain, and these are quite comprehensive, some manufacturers might add their own. However, we’ll focus on standard Trace points here to ensure the information remains consistent across different devices.</p><p>Input holds a vital position in Android. Most app scrolling and transitions are driven by Input events. I will eventually write a dedicated article on Android’s Input-based operation mechanism. Here, we look at Input from the perspective of Systrace. Before diving into the flow, keep this general handling process in mind:</p><ol><li><strong>The touch screen scans every few milliseconds; if a touch event occurs, it reports it to the corresponding driver.</strong></li><li><strong><code>InputReader</code> reads the touch event and hands it to <code>InputDispatcher</code> for dispatching.</strong></li><li><strong><code>InputDispatcher</code> sends the touch event to the App that registered for Input events.</strong></li><li><strong>Once the App receives the event, it performs event distribution. If the App’s UI changes during this process, it requests Vsync, leading to a frame redraw.</strong></li></ol><p><strong>Also, when viewing Systrace, remember that time flows from left to right. A vertical line drawn on the Systrace means events to the left always happen before those to the right—this is a cornerstone of our analysis. I hope that after reading these Systrace-based analyses, you’ll have a 3D, graphical flowchart in your mind to quickly locate where your code execution stands.</strong></p><p><a id="input-overview"></a></p><h1 id="Input-in-Systrace"><a href="#Input-in-Systrace" class="headerlink" title="Input in Systrace"></a>Input in Systrace</h1><p>Below is an overview diagram using launcher scrolling as an example (<strong>launcher scrolling includes one <code>Input_Down</code> event + several <code>Input_Move</code> events + one <code>Input_Up</code> event, all represented in Systrace, serving as a key entry point for analysis</strong>). The main modules involved are <code>SystemServer</code> and the App. Blue identifies event flow information, while red represents auxiliary data.</p><p><img src="/en/images/15728723423427.jpg"></p><p><strong><code>InputReader</code></strong> and <strong><code>InputDispatcher</code></strong> are two Native threads running within <code>SystemServer</code>, responsible for reading and dispatching Input events. Our Systrace analysis begins here. Below is a brief explanation of the marked numbers in the diagram:</p><ol><li><strong><code>InputReader</code></strong>: Reads Input events from <code>EventHub</code> and passes them to <code>InputDispatcher</code>.</li><li><strong><code>InputDispatcher</code></strong>: Processes events received from <code>InputReader</code> (packaging and dispatching them to the corresponding app).</li><li><strong><code>OutboundQueue</code></strong>: Contains events about to be dispatched to the corresponding <code>AppConnection</code>.</li><li><strong><code>WaitQueue</code></strong>: Records events dispatched to an <code>AppConnection</code> that the App has not yet acknowledged as successfully processed.</li><li><strong><code>PendingInputEventQueue</code></strong>: Records Input events that the App needs to process (now within the application process).</li><li><strong><code>deliverInputEvent</code></strong>: Marks the App UI Thread being woken up by an Input event.</li><li><strong><code>InputResponse</code></strong>: Marks the Input event region, covering the processing stages of <code>Input_Down</code>, <code>Input_Move</code> (multiple), and <code>Input_Up</code>.</li><li><strong>App Response to Input Event</strong>: This shows the scrolling and subsequent release (fling) actions. Launcher updates the screen as the finger moves and triggers Fling after release; the entire flow is visible in Systrace.</li></ol><p>Next, we’ll detail the workflow for the first <code>Input_Down</code> event. Processing for <code>Move</code> and <code>Up</code> events is similar (with minor differences that don’t affect the big picture).</p><p><a id="inputdown-ss"></a></p><h2 id="InputDown-Event-Workflow-in-SystemServer"><a href="#InputDown-Event-Workflow-in-SystemServer" class="headerlink" title="InputDown Event Workflow in SystemServer"></a>InputDown Event Workflow in SystemServer</h2><p>Magnifying the <code>SystemServer</code> section reveals the workflow (blue). <strong>Launcher scrolling includes <code>Input_Down</code> + several <code>Input_Move</code> + <code>Input_Up</code>; we are looking at the <code>Input_Down</code> event here.</strong></p><p><img src="/en/images/15728723576583.jpg"></p><p><a id="inputdown-app"></a></p><h2 id="InputDown-Event-Workflow-in-App"><a href="#InputDown-Event-Workflow-in-App" class="headerlink" title="InputDown Event Workflow in App"></a>InputDown Event Workflow in App</h2><p>Upon receiving an Input event, the App may process it immediately (if no Vsync is present) or wait for a Vsync signal. Here, the <code>Input_Down</code> event directly wakes the main thread for processing. Its Systrace is relatively simple: an Input event queue at the top, with the main thread handling it.</p><p><img src="/en/images/15728723679523.jpg"></p><h3 id="App’s-Pending-Queue"><a href="#App’s-Pending-Queue" class="headerlink" title="App’s Pending Queue"></a>App’s Pending Queue</h3><p><img src="/en/images/15728723758398.jpg"></p><h3 id="Main-Thread-Processing-Input-Events"><a href="#Main-Thread-Processing-Input-Events" class="headerlink" title="Main Thread Processing Input Events"></a>Main Thread Processing Input Events</h3><p>The main thread processing Input events is a familiar concept. From the call stack below, we see the Input event passed to <code>ViewRootImpl</code>, eventually reaching <code>DecorView</code>, followed by the familiar Input event distribution mechanism.</p><p><img src="/en/images/15728723834004.jpg"></p><p><a id="key-points"></a></p><h1 id="Key-Knowledge-Points-and-Processes"><a href="#Key-Knowledge-Points-and-Processes" class="headerlink" title="Key Knowledge Points and Processes"></a>Key Knowledge Points and Processes</h1><p>Based on the Systrace above, the basic Input event flow is as follows:</p><ol><li><strong><code>InputReader</code> reads the Input event.</strong></li><li><strong><code>InputReader</code> places the read Input event into the <code>InboundQueue</code>.</strong></li><li><strong><code>InputDispatcher</code> takes the event from <code>InboundQueue</code> and dispatches it to the <code>OutBoundQueue</code> of various Apps (connections).</strong></li><li><strong>Simultaneously, the event is recorded in each App’s <code>WaitQueue</code>.</strong></li><li><strong>The App receives the Input event, records it in <code>PendingInputEventQueue</code>, and handles its distribution.</strong></li><li><strong>After processing, the App calls back <code>InputManagerService</code> to remove the corresponding Input from the <code>WaitQueue</code>.</strong></li></ol><p>Through this process, a single Input event is consumed (this is the normal case; many exceptions and details exist). This section explains several important knowledge points from this critical flow (some processes and diagrams reference Gityuan’s blog, linked in the <strong>References</strong> section).</p><h2 id="InputReader"><a href="#InputReader" class="headerlink" title="InputReader"></a>InputReader</h2><p><code>InputReader</code> is a Native thread running in the <code>SystemServer</code> process. Its core functions are reading events from <code>EventHub</code>, processing them, and sending them to <code>InputDispatcher</code>.</p><p>The <code>InputReader</code> Loop flow is:</p><ol><li><code>getEvents</code>: Reads events from <code>EventHub</code> (monitoring <code>/dev/input</code>), places them into <code>mEventBuffer</code> (size 256), and converts <code>input_event</code> to <code>RawEvent</code>.</li><li><code>processEventsLocked</code>: Processes events, converting <code>RawEvent</code> -&gt; <code>NotifyKeyArgs</code> (or other <code>NotifyArgs</code>).</li><li><code>QueuedListener-&gt;flush</code>: Sends events to the <code>InputDispatcher</code> thread, converting <code>NotifyKeyArgs</code> -&gt; <code>KeyEntry</code> (or <code>EventEntry</code>).</li></ol><p>The core <code>loopOnce</code> processing flow is:<br><img src="/en/images/15728723980792.jpg"></p><p>Logic of <code>InputReader::loopOnce</code>:</p><figure class="highlight cpp"><table><tr><td class="gutter"><pre><span class="line">1</span><br><span class="line">2</span><br><span class="line">3</span><br><span class="line">4</span><br><span class="line">5</span><br><span class="line">6</span><br><span class="line">7</span><br><span class="line">8</span><br><span class="line">9</span><br><span class="line">10</span><br><span class="line">11</span><br><span class="line">12</span><br><span class="line">13</span><br><span class="line">14</span><br><span class="line">15</span><br><span class="line">16</span><br><span class="line">17</span><br><span class="line">18</span><br></pre></td><td class="code"><pre><span class="line"><span class="function"><span class="type">void</span> <span class="title">InputReader::loopOnce</span><span class="params">()</span> </span>&#123;</span><br><span class="line">    <span class="type">int32_t</span> oldGeneration;</span><br><span class="line">    <span class="type">int32_t</span> timeoutMillis;</span><br><span class="line">    <span class="type">bool</span> inputDevicesChanged = <span class="literal">false</span>;</span><br><span class="line">    std::vector&lt;InputDeviceInfo&gt; inputDevices;</span><br><span class="line">    &#123; <span class="comment">// acquire lock</span></span><br><span class="line">    <span class="comment">// ...</span></span><br><span class="line">    <span class="comment">// Get input events and device add/remove events; count is the event number</span></span><br><span class="line">    <span class="type">size_t</span> count = mEventHub-&gt;<span class="built_in">getEvents</span>(timeoutMillis, mEventBuffer, EVENT_BUFFER_SIZE);</span><br><span class="line">    &#123;</span><br><span class="line">    <span class="comment">// ...</span></span><br><span class="line">        <span class="keyword">if</span> (count) &#123; <span class="comment">// Process events</span></span><br><span class="line">            <span class="built_in">processEventsLocked</span>(mEventBuffer, count);</span><br><span class="line">        &#125;</span><br><span class="line">    &#125;</span><br><span class="line">    <span class="comment">// ...</span></span><br><span class="line">    mQueuedListener-&gt;<span class="built_in">flush</span>(); <span class="comment">// Send events to InputDispatcher</span></span><br><span class="line">&#125;</span><br></pre></td></tr></table></figure><h2 id="InputDispatcher"><a href="#InputDispatcher" class="headerlink" title="InputDispatcher"></a>InputDispatcher</h2><p>After <code>InputReader</code> calls <code>mQueuedListener-&gt;flush</code>, Input events are added to <code>InputDispatcher</code>‘s <code>mInboundQueue</code>, waking it up. Systrace shows the <code>InputDispatch</code> thread being woken by <code>InputReader</code>.</p><p><img src="/en/images/15728724564781.jpg"></p><p>Core logic of <code>InputDispatcher</code>:</p><ol><li><code>dispatchOnceInnerLocked()</code>: Takes <code>EventEntry</code> from <code>mInboundQueue</code>. The start time of this method (<code>currentTime</code>) becomes the <code>deliveryTime</code> for subsequent <code>dispatchEntry</code>.</li><li><code>dispatchKeyLocked()</code>: May add <code>doInterceptKeyBeforeDispatchingLockedInterruptible</code> under certain conditions.</li><li><code>enqueueDispatchEntryLocked()</code>: Generates <code>DispatchEntry</code> and adds it to the connection’s <code>outbound</code> queue.</li><li><code>startDispatchCycleLocked()</code>: Takes <code>DispatchEntry</code> from <code>outboundQueue</code> and moves it to the connection’s <code>waitQueue</code>.</li><li><code>InputChannel.sendMessage</code>: Sends the message to the remote process via socket.</li><li><code>runCommandsLockedInterruptible()</code>: Iteratively processes all commands in <code>mCommandQueue</code> (added via <code>postCommandLocked()</code>).</li></ol><p><img src="/en/images/15728724685263.jpg"></p><p>Core processing in <code>dispatchOnceInnerLocked</code>:</p><figure class="highlight cpp"><table><tr><td class="gutter"><pre><span class="line">1</span><br><span class="line">2</span><br><span class="line">3</span><br><span class="line">4</span><br><span class="line">5</span><br><span class="line">6</span><br><span class="line">7</span><br><span class="line">8</span><br><span class="line">9</span><br><span class="line">10</span><br><span class="line">11</span><br><span class="line">12</span><br><span class="line">13</span><br><span class="line">14</span><br><span class="line">15</span><br><span class="line">16</span><br><span class="line">17</span><br><span class="line">18</span><br><span class="line">19</span><br><span class="line">20</span><br><span class="line">21</span><br><span class="line">22</span><br><span class="line">23</span><br><span class="line">24</span><br><span class="line">25</span><br><span class="line">26</span><br><span class="line">27</span><br><span class="line">28</span><br><span class="line">29</span><br></pre></td><td class="code"><pre><span class="line"><span class="function"><span class="type">void</span> <span class="title">InputDispatcher::dispatchOnceInnerLocked</span><span class="params">(<span class="type">nsecs_t</span>* nextWakeupTime)</span> </span>&#123;</span><br><span class="line">    <span class="keyword">if</span> (!mPendingEvent) &#123;</span><br><span class="line">        <span class="keyword">if</span> (mInboundQueue.<span class="built_in">isEmpty</span>()) &#123;</span><br><span class="line">            <span class="comment">// ...</span></span><br><span class="line">        &#125; <span class="keyword">else</span> &#123;</span><br><span class="line">            mPendingEvent = mInboundQueue.<span class="built_in">dequeueAtHead</span>();</span><br><span class="line">            <span class="built_in">traceInboundQueueLengthLocked</span>();</span><br><span class="line">        &#125;</span><br><span class="line"></span><br><span class="line">        <span class="keyword">if</span> (mPendingEvent-&gt;policyFlags &amp; POLICY_FLAG_PASS_TO_USER) &#123;</span><br><span class="line">            <span class="built_in">pokeUserActivityLocked</span>(mPendingEvent);</span><br><span class="line">        &#125;</span><br><span class="line"></span><br><span class="line">        <span class="built_in">resetANRTimeoutsLocked</span>();</span><br><span class="line">    &#125;</span><br><span class="line">    <span class="keyword">case</span> EventEntry::TYPE_MOTION: &#123;</span><br><span class="line">        done = <span class="built_in">dispatchMotionLocked</span>(currentTime, typedEntry, &amp;dropReason, nextWakeupTime);</span><br><span class="line">        <span class="keyword">break</span>;</span><br><span class="line">    &#125;</span><br><span class="line"></span><br><span class="line">    <span class="keyword">if</span> (done) &#123;</span><br><span class="line">        <span class="keyword">if</span> (dropReason != DROP_REASON_NOT_DROPPED) &#123;</span><br><span class="line">            <span class="built_in">dropInboundEventLocked</span>(mPendingEvent, dropReason);</span><br><span class="line">        &#125;</span><br><span class="line">        mLastDropReason = dropReason;</span><br><span class="line">        <span class="built_in">releasePendingEventLocked</span>();</span><br><span class="line">        *nextWakeupTime = LONG_LONG_MIN; <span class="comment">// force next poll to wake up immediately</span></span><br><span class="line">    &#125;</span><br><span class="line">&#125;</span><br></pre></td></tr></table></figure><h2 id="InboundQueue"><a href="#InboundQueue" class="headerlink" title="InboundQueue"></a>InboundQueue</h2><p>When <code>InputDispatcher</code> executes <code>notifyKey</code>, it encapsulates the Input event and places it in <code>InboundQueue</code>. <code>InputDispatcher</code> then retrieves events from here during its processing loop.</p><p><img src="/en/images/15728724936139.jpg"></p><h2 id="OutboundQueue"><a href="#OutboundQueue" class="headerlink" title="OutboundQueue"></a>OutboundQueue</h2><p>“Outbound” refers to events leaving for App processing. Each App (Connection) has an <code>OutboundQueue</code>. Events enter <code>InboundQueue</code> and are then dispatched by <code>InputDispatcher</code> to each App’s <code>OutboundQueue</code>.</p><p><img src="/en/images/15728725023006.jpg"></p><h2 id="WaitQueue"><a href="#WaitQueue" class="headerlink" title="WaitQueue"></a>WaitQueue</h2><p>Once <code>InputDispatcher</code> dispatches an event, it moves the <code>DispatchEntry</code> from <code>outboundQueue</code> to <code>WaitQueue</code>. When the published event is “finished,” <code>InputManagerService</code> receives a reply and removes the event from <code>WaitQueue</code>. In Systrace, you’ll see the App’s <code>WaitQueue</code> length decrease.</p><p>If the main thread is janky, Input events aren’t consumed in time, which manifests in the <code>WaitQueue</code>:</p><p><img src="/en/images/15728725102137.jpg"></p><h2 id="Overall-Logic"><a href="#Overall-Logic" class="headerlink" title="Overall Logic"></a>Overall Logic</h2><p>Diagram from <a href="http://gityuan.com/">Gityuan’s Blog</a><br><img src="/en/images/15728725219191.jpg"></p><p><a id="input-vsync"></a></p><h1 id="Input-Refresh-and-Vsync"><a href="#Input-Refresh-and-Vsync" class="headerlink" title="Input Refresh and Vsync"></a>Input Refresh and Vsync</h1><p>Input refresh depends on touch screen sampling. Many screens now use 120Hz or 160Hz, sampling every 8ms or 6.25ms. Let’s see how this looks in Systrace:</p><p><img src="/en/images/15728725296687.jpg"></p><p>In the diagram, <code>InputReader</code> reads data every 6.25ms and hands it to <code>InputDispatcher</code> for dispatching. Is a higher sampling rate always better? Not necessarily. As shown, even if data is read every 6.25ms, the <code>WaitQueue</code> shows the App isn’t consuming it. Why?</p><p>The reason is that Apps consume Input events when the Vsync signal arrives. For a 60Hz screen, Vsync intervals are 16.6ms. If two or three Input events occur in that span, only the latest one is usually taken. Therefore:</p><ol><li><strong>If screen refresh rate and system FPS are 60, blindly increasing sampling rate has little effect. It might even cause uneven event groups (two vs. three events per Vsync), leading to UI jitter.</strong></li><li><strong>At 60Hz&#x2F;60FPS, a 120Hz sampling rate is sufficient.</strong></li><li><strong>At 90Hz&#x2F;90FPS, 120Hz sampling isn’t enough; a 180Hz sampling rate should be used.</strong></li></ol><p><a id="input-debug"></a></p><h1 id="Input-Debug-Information"><a href="#Input-Debug-Information" class="headerlink" title="Input Debug Information"></a>Input Debug Information</h1><p><code>Dumpsys Input</code> is primarily for debugging. We can check key information here if issues arise. Command:</p><figure class="highlight shell"><table><tr><td class="gutter"><pre><span class="line">1</span><br></pre></td><td class="code"><pre><span class="line">adb shell dumpsys input</span><br></pre></td></tr></table></figure><p>The output is extensive; we’ll focus on Device info, <code>InputReader</code>, and <code>InputDispatcher</code>.</p><h2 id="Device-Info"><a href="#Device-Info" class="headerlink" title="Device Info"></a>Device Info</h2><p>Lists currently connected devices; below is a touch-related snippet:</p><figure class="highlight shell"><table><tr><td class="gutter"><pre><span class="line">1</span><br><span class="line">2</span><br><span class="line">3</span><br><span class="line">4</span><br><span class="line">5</span><br><span class="line">6</span><br><span class="line">7</span><br><span class="line">8</span><br><span class="line">9</span><br><span class="line">10</span><br><span class="line">11</span><br><span class="line">12</span><br><span class="line">13</span><br></pre></td><td class="code"><pre><span class="line">3: main_touch</span><br><span class="line">  Classes: 0x00000015</span><br><span class="line">  Path: /dev/input/event6</span><br><span class="line">  Enabled: true</span><br><span class="line">  Descriptor: 4055b8a032ccf50ef66dbe2ff99f3b2474e9eab5</span><br><span class="line">  Location: main_touch/input0</span><br><span class="line">  ControllerNumber: 0</span><br><span class="line">  UniqueId:</span><br><span class="line">  Identifier: bus=0x0000, vendor=0xbeef, product=0xdead, version=0x28bb</span><br><span class="line">  KeyLayoutFile: /system/usr/keylayout/main_touch.kl</span><br><span class="line">  KeyCharacterMapFile: /system/usr/keychars/Generic.kcm</span><br><span class="line">  ConfigurationFile:</span><br><span class="line">  HaveKeyboardLayoutOverlay: false</span><br></pre></td></tr></table></figure><h2 id="Input-Reader-Status"><a href="#Input-Reader-Status" class="headerlink" title="Input Reader Status"></a>Input Reader Status</h2><p>Current Input event display:</p><figure class="highlight shell"><table><tr><td class="gutter"><pre><span class="line">1</span><br><span class="line">2</span><br><span class="line">3</span><br><span class="line">4</span><br><span class="line">5</span><br><span class="line">6</span><br><span class="line">7</span><br><span class="line">8</span><br><span class="line">9</span><br><span class="line">10</span><br><span class="line">11</span><br><span class="line">12</span><br><span class="line">13</span><br><span class="line">14</span><br><span class="line">15</span><br><span class="line">16</span><br><span class="line">17</span><br><span class="line">18</span><br><span class="line">19</span><br><span class="line">20</span><br><span class="line">21</span><br><span class="line">22</span><br><span class="line">23</span><br><span class="line">24</span><br><span class="line">25</span><br><span class="line">26</span><br><span class="line">27</span><br><span class="line">28</span><br><span class="line">29</span><br><span class="line">30</span><br><span class="line">31</span><br><span class="line">32</span><br><span class="line">33</span><br><span class="line">34</span><br><span class="line">35</span><br></pre></td><td class="code"><pre><span class="line">Device 3: main_touch</span><br><span class="line">   Generation: 24</span><br><span class="line">   IsExternal: false</span><br><span class="line">   HasMic:     false</span><br><span class="line">   Sources: 0x00005103</span><br><span class="line">   KeyboardType: 1</span><br><span class="line">   Motion Ranges:</span><br><span class="line">     X: source=0x00005002, min=0.000, max=1079.000, flat=0.000, fuzz=0.000, resolution=0.000</span><br><span class="line">     Y: source=0x00005002, min=0.000, max=2231.000, flat=0.000, fuzz=0.000, resolution=0.000</span><br><span class="line">     PRESSURE: source=0x00005002, min=0.000, max=1.000, flat=0.000, fuzz=0.000, resolution=0.000</span><br><span class="line">     SIZE: source=0x00005002, min=0.000, max=1.000, flat=0.000, fuzz=0.000, resolution=0.000</span><br><span class="line">   Keyboard Input Mapper:</span><br><span class="line">     Parameters:</span><br><span class="line">       HasAssociatedDisplay: false</span><br><span class="line">       OrientationAware: false</span><br><span class="line">       HandlesKeyRepeat: false</span><br><span class="line">     KeyboardType: 1</span><br><span class="line">     Orientation: 0</span><br><span class="line">     KeyDowns: 0 keys currently down</span><br><span class="line">     MetaState: 0x0</span><br><span class="line">     DownTime: 521271703875000</span><br><span class="line">   Touch Input Mapper (mode - direct):</span><br><span class="line">     Parameters:</span><br><span class="line">       GestureMode: multi-touch</span><br><span class="line">       DeviceType: touchScreen</span><br><span class="line">       AssociatedDisplay: hasAssociatedDisplay=true, isExternal=false, displayId=&#x27;&#x27;</span><br><span class="line">       OrientationAware: true</span><br><span class="line">     Raw Touch Axes:</span><br><span class="line">       X: min=0, max=1080, flat=0, fuzz=0, resolution=0</span><br><span class="line">       Y: min=0, max=2232, flat=0, fuzz=0, resolution=0</span><br><span class="line">     Viewport: displayId=0, orientation=0, logicalFrame=[0, 0, 1080, 2232], physicalFrame=[0, 0, 1080, 2232], deviceSize=[1080, 2232]</span><br><span class="line">     Last Raw Touch: pointerCount=1</span><br><span class="line">       [0]: id=0, x=660, y=1338, pressure=44, ...</span><br><span class="line">     Last Cooked Touch: pointerCount=1</span><br><span class="line">       [0]: id=0, x=659.389, y=1337.401, ...</span><br></pre></td></tr></table></figure><h2 id="InputDispatcher-Status"><a href="#InputDispatcher-Status" class="headerlink" title="InputDispatcher Status"></a>InputDispatcher Status</h2><p>Key <code>InputDispatch</code> information includes:</p><ol><li><code>FocusedApplication</code>: App currently in focus.</li><li><code>FocusedWindow</code>: Window currently in focus.</li><li><code>TouchStatesByDisplay</code></li><li><code>Windows</code>: All Windows.</li><li><code>MonitoringChannels</code>: Channels corresponding to Windows.</li><li><code>Connections</code>: All connections.</li><li><code>AppSwitch</code>: pending status.</li><li><code>Configuration</code></li></ol><figure class="highlight shell"><table><tr><td class="gutter"><pre><span class="line">1</span><br><span class="line">2</span><br><span class="line">3</span><br><span class="line">4</span><br><span class="line">5</span><br><span class="line">6</span><br><span class="line">7</span><br><span class="line">8</span><br><span class="line">9</span><br><span class="line">10</span><br><span class="line">11</span><br><span class="line">12</span><br><span class="line">13</span><br><span class="line">14</span><br><span class="line">15</span><br><span class="line">16</span><br><span class="line">17</span><br><span class="line">18</span><br><span class="line">19</span><br><span class="line">20</span><br><span class="line">21</span><br><span class="line">22</span><br><span class="line">23</span><br><span class="line">24</span><br></pre></td><td class="code"><pre><span class="line">Input Dispatcher State:</span><br><span class="line">  DispatchEnabled: 1</span><br><span class="line">  DispatchFrozen: 0</span><br><span class="line">  FocusedApplication: name=&#x27;AppWindowToken&#123;... Launcher&#125;&#x27;, dispatchingTimeout=5000.000ms</span><br><span class="line">  FocusedWindow: name=&#x27;Window&#123;... Launcher&#125;&#x27;</span><br><span class="line">  TouchStatesByDisplay:</span><br><span class="line">    0: down=true, split=true, deviceId=3, source=0x00005002</span><br><span class="line">      Windows:</span><br><span class="line">        0: name=&#x27;Window&#123;... Launcher&#125;&#x27;, pointerIds=0x80000000, targetFlags=0x105</span><br><span class="line">  Windows:</span><br><span class="line">    9: name=&#x27;Window&#123;... Launcher&#125;&#x27;, displayId=0, paused=false, hasFocus=true, visible=true, ...</span><br><span class="line">  MonitoringChannels:</span><br><span class="line">    0: &#x27;WindowManager (server)&#x27;</span><br><span class="line">  Connections:</span><br><span class="line">    12: channelName=&#x27;3c007ad launcher (server)&#x27;, windowName=&#x27;Window&#123;... Launcher&#125;&#x27;, status=NORMAL, ...</span><br><span class="line">      OutboundQueue: &lt;empty&gt;</span><br><span class="line">      WaitQueue: length=3</span><br><span class="line">        MotionEvent(..., action=MOVE, age=17.4ms, wait=16.8ms</span><br><span class="line">        MotionEvent(..., action=MOVE, age=11.1ms, wait=10.4ms</span><br><span class="line">        MotionEvent(..., action=MOVE, age=5.2ms, wait=4.6ms</span><br><span class="line">  AppSwitch: not pending</span><br><span class="line">  Configuration:</span><br><span class="line">    KeyRepeatDelay: 50.0ms</span><br><span class="line">    KeyRepeatTimeout: 500.0ms</span><br></pre></td></tr></table></figure><p><a id="refs"></a></p><h1 id="References"><a href="#References" class="headerlink" title="References"></a>References</h1><p>Portions of this article reference Gityuan’s blog. These articles provide deep dives into code details for those interested after finishing this piece.</p><ol><li><a href="http://gityuan.com/2016/12/11/input-reader/">http://gityuan.com/2016/12/11/input-reader/</a></li><li><a href="http://gityuan.com/2016/12/10/input-manager/">http://gityuan.com/2016/12/10/input-manager/</a></li><li><a href="http://gityuan.com/2016/12/17/input-dispatcher/">http://gityuan.com/2016/12/17/input-dispatcher/</a></li><li><a href="https://zhuanlan.zhihu.com/p/29386642">https://zhuanlan.zhihu.com/p/29386642</a></li></ol><p><a id="attachments"></a></p><h1 id="Attachments"><a href="#Attachments" class="headerlink" title="Attachments"></a>Attachments</h1><p>Attachments for this article have been uploaded. Extract and open in <strong>Chrome</strong>:<br><a href="https://github.com/Gracker/SystraceForBlog/tree/master/Android_Systrace_Input">Download Systrace attachments for this article</a></p><p><a id="others"></a></p><h1 id="Other-Addresses"><a href="#Other-Addresses" class="headerlink" title="Other Addresses"></a>Other Addresses</h1><p>For comments or likes, please visit the Zhihu or Juejin pages for this article:<br><a href="https://juejin.im/post/5dc1838ef265da4d02626ae0">Juejin - Systrace Basics - Input Interpretation</a></p><p><a id="about"></a></p><h1 id="About-Me-amp-amp-Blog"><a href="#About-Me-amp-amp-Blog" class="headerlink" title="About Me &amp;&amp; Blog"></a>About Me &amp;&amp; Blog</h1><p>Below is my personal intro and related links. I look forward to exchanging ideas with fellow professionals. “When three walk together, one can always be my teacher!”</p><ol><li><a href="https://www.androidperformance.com/en/about/">Blogger Intro</a>: Includes personal WeChat and WeChat group links.</li><li><a href="https://www.androidperformance.com/en/2019/12/01/BlogMap/">Blog Content Navigation</a>: A guide for my blog content.</li><li><a href="https://www.androidperformance.com/en/2018/05/07/Android-performance-optimization-skills-and-tools/">Curated Excellent Blog Articles - Android Performance Optimization Must-Knows</a>: Welcome to recommend projects&#x2F;articles.</li><li><a href="https://www.androidperformance.com/en/2023/12/30/the-performance/">Android Performance Optimization Knowledge Planet</a>: Welcome to join and thank you for your support~</li></ol><blockquote><p><strong>One walks faster alone, but a group walks further together.</strong></p></blockquote><p><img src="/en/images/WechatIMG581.webp" alt="Scan WeChat QR Code"></p>]]></content>
    
    
    <summary type="html">&lt;p&gt;This is the sixth article in the Systrace series, primarily providing a brief introduction to Input in Systrace. It covers the Input workflow, how Input information is represented in Systrace, and how to combine Input info to analyze related performance issues.&lt;/p&gt;
&lt;p&gt;The purpose of this series is to view the overall operation of the Android system from a different perspective using Systrace, while also providing an alternative angle for learning the Framework. Perhaps you’ve read many articles about the Framework but can never remember the code, or you’re unclear about the execution flow. Maybe from Systrace’s graphical perspective, you can gain a deeper understanding.&lt;/p&gt;</summary>


    <category term="Android" scheme="https://androidperformance.com/en/categories/Android/"/>
    
    
    <category term="Android" scheme="https://androidperformance.com/en/tags/Android/"/>
    
    <category term="Systrace" scheme="https://androidperformance.com/en/tags/Systrace/"/>
    
    <category term="Startup" scheme="https://androidperformance.com/en/tags/Startup/"/>
    
    <category term="Jank" scheme="https://androidperformance.com/en/tags/Jank/"/>
    
    <category term="Performance" scheme="https://androidperformance.com/en/tags/Performance/"/>
    
  </entry>
  
  <entry>
    <title>Analysis of &#39;Zombie Animations&#39; in the Android Background</title>
    <link href="https://androidperformance.com/en/2019/10/24/Android-Background-Animation/"/>
    <id>https://androidperformance.com/en/2019/10/24/Android-Background-Animation/</id>
    <published>2019-10-24T00:27:34.000Z</published>
    <updated>2026-05-10T23:29:51.053Z</updated>
    
    <content type="html"><![CDATA[<p>When an Android app moves to the background, it’s not unusual for it to keep performing work as long as the process isn’t killed—that’s just the nature of Android. However, some apps continue to run “zombie animations”—animations that are completely invisible to the user yet consume precious CPU cycles and battery. When users discover this, the result is often a manual kill, an OS-level background restriction, or an outright uninstallation.</p><p>Most developers never notice this issue. However, if you use <a href="https://www.androidperformance.com/en/2019/05/28/Android-Systrace-About/">Systrace</a> regularly, you can easily spot it. If you open several apps, return to the home screen, and capture a trace while swiping between launcher pages, you’ll often see background apps still firing animation callbacks.</p><p>“Zombie animations” occur when an app, despite being invisible, continues to push <code>CALLBACK_ANIMATION</code> requests to the <a href="https://www.androidperformance.com/en/2019/10/22/Android-Choreographer/">Choreographer</a>. Every app is different, but the root cause is usually a missing <code>pause</code> or <code>stop</code> call.</p><span id="more"></span><p>Let’s look at two real-world examples to understand the technical cause and the fix. <strong>If you are a developer, I highly recommend checking your app for this behavior—fix it if it’s there, celebrate if it’s not.</strong></p><h1 id="Case-1-NetEase-News"><a href="#Case-1-NetEase-News" class="headerlink" title="Case 1: NetEase News"></a>Case 1: NetEase News</h1><p>After using NetEase News and returning to the home screen, we captured a Systrace while swiping. Even in the background, the app is consistently firing <code>doFrame</code> operations (see the red box below).</p><p><img src="/en/images/15718769486548.jpg"></p><p>Zooming in on a single <code>doFrame</code>, we see that while <code>input</code> and <code>traversal</code> (layout&#x2F;draw) are skipped, the <code>animation</code> callback is executing every single frame.</p><p><img src="/en/images/15718769576130.jpg"></p><p>Analysis of the CPU usage shows that the NetEase News process is one of the top consumers of the foreground CPU budget while in the background. This is a clear case of battery drain.</p><p>Further inspection using Method Trace reveals that the issue stems from the <a href="https://airbnb.design/lottie/">Lottie</a> animation library by Airbnb. The animation was set to loop but was never paused when the view became invisible, causing it to trigger <code>onAnimationUpdate</code> indefinitely.</p><p><img src="/en/images/15718769752471.jpg"></p><h1 id="Case-2-QQ-Music"><a href="#Case-2-QQ-Music" class="headerlink" title="Case 2: QQ Music"></a>Case 2: QQ Music</h1><p>Opening QQ Music and then returning to the home screen yields similar results in Systrace and Method Trace.</p><p><img src="/en/images/15718769826711.jpg"></p><p>The Method Trace for QQ Music shows three separate Lottie animations that fail to stop in the background—a slightly more severe case than NetEase News.</p><p><img src="/en/images/15718769926973.jpg"></p><p>Zoomed-in view:</p><p><img src="/en/images/15718770037520.jpg"></p><p>It’s worth noting that this isn’t exclusively a Lottie issue; any standard Android animation can suffer from this if it isn’t properly cleaned up.</p><h1 id="Root-Cause"><a href="#Root-Cause" class="headerlink" title="Root Cause"></a>Root Cause</h1><p>The fundamental problem is that the app fails to pause animations when it becomes invisible. Because the app is backgrounded, the system optimizes away <code>input</code> and <code>draw</code> callbacks, but <code>CALLBACK_ANIMATION</code> continues to fire. Since no actual drawing occurs, the CPU cycles spent calculating animation frames are entirely wasted.</p><h1 id="Development-Recommendation"><a href="#Development-Recommendation" class="headerlink" title="Development Recommendation"></a>Development Recommendation</h1><p>This issue has been discussed in the Lottie GitHub issues.</p><p><strong>Problem Summary from GitHub:</strong></p><blockquote><p>“I noticed quite some CPU usage <strong>when the app is in the background</strong>… It seems looping animations do not pause&#x2F;stop when the <code>LottieAnimationView</code> is off screen or the Activity is paused. This is likely due to cleanup code only being in <code>onDetachedFromWindow()</code>, which isn’t always called when an Activity sleeps or when a view’s visibility changes to <code>GONE</code> or <code>INVISIBLE</code>.”</p></blockquote><p><strong>The Solution:</strong><br>Override <code>onVisibilityChanged</code> in your view or listen to life-cycle events in your Activity&#x2F;Fragment to explicitly pause animations.</p><figure class="highlight java"><table><tr><td class="gutter"><pre><span class="line">1</span><br><span class="line">2</span><br><span class="line">3</span><br><span class="line">4</span><br><span class="line">5</span><br><span class="line">6</span><br><span class="line">7</span><br><span class="line">8</span><br><span class="line">9</span><br><span class="line">10</span><br><span class="line">11</span><br><span class="line">12</span><br><span class="line">13</span><br><span class="line">14</span><br></pre></td><td class="code"><pre><span class="line"><span class="meta">@Override</span></span><br><span class="line"><span class="keyword">protected</span> <span class="keyword">void</span> <span class="title function_">onVisibilityChanged</span><span class="params">(<span class="meta">@NonNull</span> View changedView, <span class="type">int</span> visibility)</span> &#123;</span><br><span class="line">    <span class="built_in">super</span>.onVisibilityChanged(changedView, visibility);</span><br><span class="line">    <span class="keyword">if</span> (visibility == VISIBLE &amp;&amp; wasAnimatingWhenVisibilityChanged) &#123;</span><br><span class="line">        resumeAnimation();</span><br><span class="line">    &#125; <span class="keyword">else</span> &#123;</span><br><span class="line">        <span class="keyword">if</span> (isAnimating()) &#123;</span><br><span class="line">            wasAnimatingWhenVisibilityChanged = <span class="literal">true</span>;</span><br><span class="line">            pauseAnimation();</span><br><span class="line">        &#125; <span class="keyword">else</span> &#123;</span><br><span class="line">            wasAnimatingWhenVisibilityChanged = <span class="literal">false</span>;</span><br><span class="line">        &#125;</span><br><span class="line">    &#125;</span><br><span class="line">&#125;</span><br></pre></td></tr></table></figure><p>In short: <strong>When your app is invisible, call <code>pauseAnimation()</code> on everything!!</strong></p><hr><h1 id="About-Me-amp-amp-Blog"><a href="#About-Me-amp-amp-Blog" class="headerlink" title="About Me &amp;&amp; Blog"></a>About Me &amp;&amp; Blog</h1><p>(Links and introduction)</p>]]></content>
    
    
    <summary type="html">&lt;p&gt;When an Android app moves to the background, it’s not unusual for it to keep performing work as long as the process isn’t killed—that’s just the nature of Android. However, some apps continue to run “zombie animations”—animations that are completely invisible to the user yet consume precious CPU cycles and battery. When users discover this, the result is often a manual kill, an OS-level background restriction, or an outright uninstallation.&lt;/p&gt;
&lt;p&gt;Most developers never notice this issue. However, if you use &lt;a href=&quot;https://www.androidperformance.com/en/2019/05/28/Android-Systrace-About/&quot;&gt;Systrace&lt;/a&gt; regularly, you can easily spot it. If you open several apps, return to the home screen, and capture a trace while swiping between launcher pages, you’ll often see background apps still firing animation callbacks.&lt;/p&gt;
&lt;p&gt;“Zombie animations” occur when an app, despite being invisible, continues to push &lt;code&gt;CALLBACK_ANIMATION&lt;/code&gt; requests to the &lt;a href=&quot;https://www.androidperformance.com/en/2019/10/22/Android-Choreographer/&quot;&gt;Choreographer&lt;/a&gt;. Every app is different, but the root cause is usually a missing &lt;code&gt;pause&lt;/code&gt; or &lt;code&gt;stop&lt;/code&gt; call.&lt;/p&gt;</summary>


    <category term="Android" scheme="https://androidperformance.com/en/categories/Android/"/>
    
    
    <category term="Android" scheme="https://androidperformance.com/en/tags/Android/"/>
    
    <category term="Systrace" scheme="https://androidperformance.com/en/tags/Systrace/"/>
    
    <category term="Startup" scheme="https://androidperformance.com/en/tags/Startup/"/>
    
    <category term="Java" scheme="https://androidperformance.com/en/tags/Java/"/>
    
    <category term="Framework" scheme="https://androidperformance.com/en/tags/Framework/"/>
    
  </entry>
  
  <entry>
    <title>Detailed Explanation of Android Rendering Mechanism Based on Choreographer</title>
    <link href="https://androidperformance.com/en/2019/10/22/Android-Choreographer/"/>
    <id>https://androidperformance.com/en/2019/10/22/Android-Choreographer/</id>
    <published>2019-10-22T10:55:11.000Z</published>
    <updated>2026-05-10T23:29:51.054Z</updated>
    
    <content type="html"><![CDATA[<p>This article introduces <code>Choreographer</code>, a class that app developers rarely encounter but is crucial in the Android Framework rendering pipeline. It covers the background of <code>Choreographer</code>‘s introduction, an overview, source code analysis, its relationship with <code>MessageQueue</code>, its use in APM, and optimization ideas from mobile manufacturers.</p><p><code>Choreographer</code> was introduced to coordinate with Vsync, providing a stable timing for handling Messages in app rendering. When Vsync arrives, the system adjusts the Vsync signal period to control the timing of drawing operations for each frame. Most phones currently have a 60Hz refresh rate (16.6ms). To match this, the system sets the Vsync period to 16.6ms, waking <code>Choreographer</code> every period to perform app drawing—this is its primary role. Understanding <code>Choreographer</code> also helps developers grasp the principles of frame execution and deepens knowledge of Message, Handler, Looper, MessageQueue, Measure, Layout, and Draw.</p><span id="more"></span><p>This is the eighth article in the Systrace series, providing a brief introduction to <code>Choreographer</code> within Systrace.</p><p>The <strong>purpose</strong> of this series is to view the overall operation of the Android system from a different perspective using Systrace, while also providing an alternative angle for learning the Framework. Perhaps you’ve read many articles about the Framework but can never remember the code, or you’re unclear about the execution flow. Maybe from Systrace’s graphical perspective, you can gain a deeper understanding.</p><h1 id="Series-Article-Index"><a href="#Series-Article-Index" class="headerlink" title="Series Article Index"></a>Series Article Index</h1><ol><li><a href="https://www.androidperformance.com/en/2019/05/28/Android-Systrace-About/">Introduction to Systrace</a></li><li><a href="https://www.androidperformance.com/en/2019/07/23/Android-Systrace-Pre/">Systrace Basics - Prerequisites for Systrace</a></li><li><a href="https://www.androidperformance.com/en/2019/05/27/why-60-fps/">Systrace Basics - Why 60 fps?</a></li><li><a href="https://www.androidperformance.com/en/2019/06/29/Android-Systrace-SystemServer/">Android Systrace Basics - SystemServer Explained</a></li><li><a href="https://www.androidperformance.com/en/2020/02/14/Android-Systrace-SurfaceFlinger/">Systrace Basics - SurfaceFlinger Explained</a></li><li><a href="https://www.androidperformance.com/en/2019/11/04/Android-Systrace-Input/">Systrace Basics - Input Explained</a></li><li><a href="https://www.androidperformance.com/en/2019/12/01/Android-Systrace-Vsync/">Systrace Basics - Vsync Explained</a></li><li><a href="https://www.androidperformance.com/en/2019/10/22/Android-Choreographer/">Systrace Basics - Vsync-App: Detailed Explanation of Choreographer-Based Rendering Mechanism</a></li><li><a href="https://www.androidperformance.com/en/2019/11/06/Android-Systrace-MainThread-And-RenderThread/">Systrace Basics - MainThread and RenderThread Explained</a></li><li><a href="https://www.androidperformance.com/en/2019/12/15/Android-Systrace-Triple-Buffer">Systrace Basics - Triple Buffer Explained</a></li><li><a href="https://www.androidperformance.com/en/2019/12/21/Android-Systrace-CPU">Systrace Basics - CPU Info Explained</a></li><li><a href="https://www.androidperformance.com/en/2021/04/24/android-systrace-smooth-in-action-1/">Systrace Smoothness in Action 1: Understanding Jank Principles</a></li><li><a href="https://www.androidperformance.com/en/2021/04/24/android-systrace-smooth-in-action-2/">Systrace Smoothness in Action 2: Case Analysis - MIUI Launcher Scroll Jank Analysis</a></li><li><a href="https://www.androidperformance.com/en/2021/04/24/android-systrace-smooth-in-action-3/">Systrace Smoothness in Action 3: FAQs During Jank Analysis</a></li><li><a href="https://www.androidperformance.com/en/2021/09/13/android-systrace-Responsiveness-in-action-1/">Systrace Responsiveness in Action 1: Understanding Responsiveness Principles</a></li><li><a href="https://www.androidperformance.com/en/2021/09/13/android-systrace-Responsiveness-in-action-2/">Systrace Responsiveness in Action 2: Responsiveness Analysis - Using App Startup as an Example</a></li><li><a href="https://www.androidperformance.com/en/2021/09/13/android-systrace-Responsiveness-in-action-3/">Systrace Responsiveness in Action 3: Extended Knowledge on Responsiveness</a></li><li><a href="https://www.androidperformance.com/en/2022/01/21/android-systrace-cpu-state-runnable/">Systrace Thread CPU State Analysis Tips - Runnable</a></li><li><a href="https://www.androidperformance.com/en/2022/03/13/android-systrace-cpu-state-running/">Systrace Thread CPU State Analysis Tips - Running</a></li><li><a href="https://www.androidperformance.com/en/2022/03/13/android-systrace-cpu-state-sleep/">Systrace Thread CPU State Analysis Tips - Sleep and Uninterruptible Sleep</a></li></ol><h1 id="Essence-of-the-Main-Thread-Mechanism"><a href="#Essence-of-the-Main-Thread-Mechanism" class="headerlink" title="Essence of the Main Thread Mechanism"></a>Essence of the Main Thread Mechanism</h1><p>This Choreographer article maps to <a href="https://www.androidperformance.com/en/2025/03/26/Android-Perfetto-05-Chorergrapher/">Perfetto 5: Choreographer-based rendering flow</a>. The core conclusion still holds: the Android main thread does not render continuously; it waits in the MessageQueue, and when Vsync arrives, Choreographer organizes INPUT, ANIMATION, TRAVERSAL, and COMMIT into one frame.</p><p>When reading this flow in Perfetto today, the entry point moves from Systrace <code>doFrame</code> screenshots to the app main-thread track, Choreographer slices, Frame Timeline, and RenderThread tracks. The workflow should also change: first locate the problematic frame, then check whether Input, Animation, Traversal, Commit, or RenderThread sync&#x2F;submit exceeded budget. If the main thread was Sleep or Runnable, continue with CPU and Binder tracks to find the wait reason.</p><p>Before discussing <code>Choreographer</code>, let’s clarify the essence of the Android main thread: it’s effectively a Message processing loop. All operations, including frame rendering, are sent as Messages to the main thread’s <code>MessageQueue</code>. The queue processes a message and waits for the next, as shown:</p><p><strong>MethodTrace Illustration</strong></p><p><img src="/en/images/15717420275540.jpg"></p><p><strong>Systrace Illustration</strong></p><p><img src="/en/images/15717420373518.jpg"></p><h2 id="Evolution"><a href="#Evolution" class="headerlink" title="Evolution"></a>Evolution</h2><p>In Android versions before Vsync, Messages for rendering frames had no gaps; as soon as one frame finished drawing, the next frame’s Message was processed. This led to unstable frame rates that fluctuated unpredictably:</p><p><strong>MethodTrace Illustration</strong></p><p><img src="/en/images/15717420453069.jpg"></p><p><strong>Systrace Illustration</strong></p><p><img src="/en/images/15717420572997.jpg"></p><p>The bottleneck here was <code>dequeueBuffer</code>. Because screens have a fixed refresh cycle and <code>SurfaceFlinger</code> (SF) consumes <code>Front Buffer</code> at a constant rate, SF also consumes <code>App Buffers</code> at a constant rate. Apps would get stuck at <code>dequeueBuffer</code>, resulting in unstable buffer acquisition and frequent jank.</p><p>For users, a stable frame rate is a better experience. For example, a stable 50 fps feels smoother than one that fluctuates wildly between 60 and 40 fps.</p><p>Android’s evolution introduced <strong>Vsync + TripleBuffer + Choreographer</strong>, aiming to provide a stable frame rate mechanism that allows software and hardware to operate at a synchronized frequency.</p><h2 id="Introducing-Choreographer"><a href="#Introducing-Choreographer" class="headerlink" title="Introducing Choreographer"></a>Introducing Choreographer</h2><p><code>Choreographer</code> coordinates with Vsync to provide a stable Message processing timing. When Vsync arrives, the system adjusts the signal period to control when each frame is drawn. Vsync typically uses a 16.6ms (60 fps) period to match the 60Hz refresh rate of most phone screens. Every 16.6ms, the Vsync signal wakes <code>Choreographer</code> to perform app drawing. If the app renders within this window every cycle, it achieves 60 fps, appearing very smooth.</p><p><img src="/en/images/15722752299458.jpg"></p><p>With 90Hz screens becoming common, the Vsync period has dropped from 16.6ms to 11.1ms, requiring faster task completion and higher performance. See: <a href="https://www.androidperformance.com/en/2019/05/15/90hz-on-android/">A New Smooth Experience: A Talk on 90Hz</a>.</p><h1 id="Choreographer-Overview"><a href="#Choreographer-Overview" class="headerlink" title="Choreographer Overview"></a>Choreographer Overview</h1><p><code>Choreographer</code> acts as a bridge in the Android rendering pipeline:</p><ol><li><strong>Upper side</strong>: It receives and processes app update messages and callbacks, handling them collectively when Vsync arrives. This includes Input events, Animation logic, and Traversal (measure, layout, draw), while also detecting dropped frames and recording callback durations.</li><li><strong>Lower side</strong>: It requests and receives Vsync signals, handling event callbacks (via <code>FrameDisplayEventReceiver.onVsync</code>) and scheduling Vsync (<code>FrameDisplayEventReceiver.scheduleVsync</code>).</li></ol><p><code>Choreographer</code> is a vital “utility player.” The <strong>Choreographer + SurfaceFlinger + Vsync + TripleBuffer</strong> stack ensures Android apps run at a stable frame rate (20, 90, or 60 fps), reducing the discomfort of frame fluctuations.</p><p>Understanding <code>Choreographer</code> also clarifies the fundamentals of frame execution and deepens knowledge of <strong>Message, Handler, Looper, MessageQueue, Input, Animation, Measure, Layout, and Draw</strong>. Many <strong>APM</strong> tools combine <strong>Choreographer (using FrameCallback + FrameInfo)</strong> + <strong>MessageQueue (using IdleHandler)</strong> + <strong>Looper (with custom MessageLogging)</strong> to optimize performance monitoring.</p><p>While diagrams are helpful, I prefer using <strong>Systrace</strong> and <strong>MethodTrace</strong> to show system operations (CPU, SurfaceFlinger, SystemServer, Apps) from left to right. Familiarity with the code allows you to map Systrace directly to actual phone behavior. This article will primarily use Systrace.</p><h2 id="Choreographer-Workflow-from-a-Systrace-Perspective"><a href="#Choreographer-Workflow-from-a-Systrace-Perspective" class="headerlink" title="Choreographer Workflow from a Systrace Perspective"></a>Choreographer Workflow from a Systrace Perspective</h2><p>Using Launcher scrolling as an example, here is a complete preview of the App process. Each green frame represents a frame that finally appears on the screen.</p><ol><li>Each gray and white bar is a Vsync period (16.6ms).</li><li>Frame processing flow: Vsync signal callback -&gt; UI Thread -&gt; RenderThread -&gt; SurfaceFlinger (not shown).</li><li>UI Thread and RenderThread together complete an app’s frame rendering. The rendered buffer is sent to SurfaceFlinger for composition, then displayed.</li><li>Launcher scrolling frames are very short (Ui Thread + RenderThread time), but still wait for the next Vsync to begin processing.</li></ol><p><img src="/en/images/15717420793673.jpg"></p><p>Zooming into the UI Thread for a single frame, we see <code>Choreogrepher</code>‘s position and how it organizes the frame:</p><p><img src="/en/images/15717420863795.jpg"></p><h2 id="Choreographer-Workflow"><a href="#Choreographer-Workflow" class="headerlink" title="Choreographer Workflow"></a>Choreographer Workflow</h2><ol><li><strong>Initialize Choreographer</strong><ol><li>Initialize <code>FrameHandler</code>, binding it to the Looper.</li><li>Initialize <code>FrameDisplayEventReceiver</code> to communicate with SurfaceFlinger for Vsync.</li><li>Initialize <code>CallBackQueues</code>.</li></ol></li><li>SurfaceFlinger’s <code>appEventThread</code> sends Vsync; <code>Choreographer</code> calls <code>FrameDisplayEventReceiver.onVsync</code>, entering the main processing function <code>doFrame</code>.</li><li><code>Choreographer.doFrame</code> calculates dropped frames.</li><li>Processes the first callback: <strong>input</strong>.</li><li>Processes the second callback: <strong>animation</strong>.</li><li>Processes the third callback: <strong>insets animation</strong>.</li><li>Processes the fourth callback: <strong>traversal</strong>.<ol><li><code>traversal-draw</code> synchronizes UIThread and RenderThread data.</li></ol></li><li>Processes the fifth callback: <strong>commit?</strong></li><li><code>RenderThread</code> processes draw commands and sends them to the GPU.</li><li>Calls <code>swapBuffer</code> to submit to SurfaceFlinger for composition. (The buffer isn’t truly finished until the CPU completes; newer Systrace versions use GPU fences to mark this).</li></ol><p><strong>After step 1, the system loops through steps 2-9.</strong></p><p>Here is the corresponding MethodTrace (detailed view following):</p><p><img src="/en/images/15717420948412.jpg"></p><p>Now, let’s examine the implementation via source code.</p><h1 id="Source-Code-Analysis"><a href="#Source-Code-Analysis" class="headerlink" title="Source Code Analysis"></a>Source Code Analysis</h1><p>The following analysis covers important logic, omitting less relevant parts like Native interactions with SurfaceFlinger.</p><h2 id="Choreographer-Initialization"><a href="#Choreographer-Initialization" class="headerlink" title="Choreographer Initialization"></a>Choreographer Initialization</h2><h3 id="Singleton-Initialization"><a href="#Singleton-Initialization" class="headerlink" title="Singleton Initialization"></a>Singleton Initialization</h3><figure class="highlight java"><table><tr><td class="gutter"><pre><span class="line">1</span><br><span class="line">2</span><br><span class="line">3</span><br><span class="line">4</span><br><span class="line">5</span><br><span class="line">6</span><br><span class="line">7</span><br><span class="line">8</span><br><span class="line">9</span><br><span class="line">10</span><br><span class="line">11</span><br><span class="line">12</span><br><span class="line">13</span><br><span class="line">14</span><br><span class="line">15</span><br><span class="line">16</span><br></pre></td><td class="code"><pre><span class="line"><span class="comment">// Thread local storage for the choreographer.</span></span><br><span class="line"><span class="keyword">private</span> <span class="keyword">static</span> <span class="keyword">final</span> ThreadLocal&lt;Choreographer&gt; sThreadInstance =</span><br><span class="line">        <span class="keyword">new</span> <span class="title class_">ThreadLocal</span>&lt;Choreographer&gt;() &#123;</span><br><span class="line">    <span class="meta">@Override</span></span><br><span class="line">    <span class="keyword">protected</span> Choreographer <span class="title function_">initialValue</span><span class="params">()</span> &#123;</span><br><span class="line">        <span class="comment">// Get current thread Looper</span></span><br><span class="line">        <span class="type">Looper</span> <span class="variable">looper</span> <span class="operator">=</span> Looper.myLooper();</span><br><span class="line">        ......</span><br><span class="line">        <span class="comment">// Construct Choreographer object</span></span><br><span class="line">        <span class="type">Choreographer</span> <span class="variable">choreographer</span> <span class="operator">=</span> <span class="keyword">new</span> <span class="title class_">Choreographer</span>(looper, VSYNC_SOURCE_APP);</span><br><span class="line">        <span class="keyword">if</span> (looper == Looper.getMainLooper()) &#123;</span><br><span class="line">            mMainInstance = choreographer;</span><br><span class="line">        &#125;</span><br><span class="line">        <span class="keyword">return</span> choreographer;</span><br><span class="line">    &#125;</span><br><span class="line">&#125;;</span><br></pre></td></tr></table></figure><h3 id="Choreographer-Constructor"><a href="#Choreographer-Constructor" class="headerlink" title="Choreographer Constructor"></a>Choreographer Constructor</h3><figure class="highlight java"><table><tr><td class="gutter"><pre><span class="line">1</span><br><span class="line">2</span><br><span class="line">3</span><br><span class="line">4</span><br><span class="line">5</span><br><span class="line">6</span><br><span class="line">7</span><br><span class="line">8</span><br><span class="line">9</span><br><span class="line">10</span><br><span class="line">11</span><br><span class="line">12</span><br><span class="line">13</span><br><span class="line">14</span><br><span class="line">15</span><br><span class="line">16</span><br><span class="line">17</span><br></pre></td><td class="code"><pre><span class="line"><span class="keyword">private</span> <span class="title function_">Choreographer</span><span class="params">(Looper looper, <span class="type">int</span> vsyncSource)</span> &#123;</span><br><span class="line">    mLooper = looper;</span><br><span class="line">    <span class="comment">// 1. Initialize FrameHandler</span></span><br><span class="line">    mHandler = <span class="keyword">new</span> <span class="title class_">FrameHandler</span>(looper);</span><br><span class="line">    <span class="comment">// 2. Initialize DisplayEventReceiver</span></span><br><span class="line">    mDisplayEventReceiver = USE_VSYNC</span><br><span class="line">            ? <span class="keyword">new</span> <span class="title class_">FrameDisplayEventReceiver</span>(looper, vsyncSource)</span><br><span class="line">            : <span class="literal">null</span>;</span><br><span class="line">    mLastFrameTimeNanos = Long.MIN_VALUE;</span><br><span class="line">    mFrameIntervalNanos = (<span class="type">long</span>)(<span class="number">1000000000</span> / getRefreshRate());</span><br><span class="line">    <span class="comment">// 3. Initialize CallbacksQueues</span></span><br><span class="line">    mCallbackQueues = <span class="keyword">new</span> <span class="title class_">CallbackQueue</span>[CALLBACK_LAST + <span class="number">1</span>];</span><br><span class="line">    <span class="keyword">for</span> (<span class="type">int</span> <span class="variable">i</span> <span class="operator">=</span> <span class="number">0</span>; i &lt;= CALLBACK_LAST; i++) &#123;</span><br><span class="line">        mCallbackQueues[i] = <span class="keyword">new</span> <span class="title class_">CallbackQueue</span>();</span><br><span class="line">    &#125;</span><br><span class="line">    ......</span><br><span class="line">&#125;</span><br></pre></td></tr></table></figure><h3 id="FrameHandler"><a href="#FrameHandler" class="headerlink" title="FrameHandler"></a>FrameHandler</h3><figure class="highlight java"><table><tr><td class="gutter"><pre><span class="line">1</span><br><span class="line">2</span><br><span class="line">3</span><br><span class="line">4</span><br><span class="line">5</span><br><span class="line">6</span><br><span class="line">7</span><br><span class="line">8</span><br><span class="line">9</span><br><span class="line">10</span><br><span class="line">11</span><br><span class="line">12</span><br><span class="line">13</span><br><span class="line">14</span><br><span class="line">15</span><br><span class="line">16</span><br></pre></td><td class="code"><pre><span class="line"><span class="keyword">private</span> <span class="keyword">final</span> <span class="keyword">class</span> <span class="title class_">FrameHandler</span> <span class="keyword">extends</span> <span class="title class_">Handler</span> &#123;</span><br><span class="line">    ......</span><br><span class="line">    <span class="keyword">public</span> <span class="keyword">void</span> <span class="title function_">handleMessage</span><span class="params">(Message msg)</span> &#123;</span><br><span class="line">        <span class="keyword">switch</span> (msg.what) &#123;</span><br><span class="line">            <span class="keyword">case</span> MSG_DO_FRAME: <span class="comment">// Start rendering the next frame</span></span><br><span class="line">                doFrame(System.nanoTime(), <span class="number">0</span>);</span><br><span class="line">                <span class="keyword">break</span>;</span><br><span class="line">            <span class="keyword">case</span> MSG_DO_SCHEDULE_VSYNC: <span class="comment">// Request Vsync</span></span><br><span class="line">                doScheduleVsync();</span><br><span class="line">                <span class="keyword">break</span>;</span><br><span class="line">            <span class="keyword">case</span> MSG_DO_SCHEDULE_CALLBACK: <span class="comment">// Process Callback</span></span><br><span class="line">                doScheduleCallback(msg.arg1);</span><br><span class="line">                <span class="keyword">break</span>;</span><br><span class="line">        &#125;</span><br><span class="line">    &#125;</span><br><span class="line">&#125;</span><br></pre></td></tr></table></figure><h3 id="Choreographer-Initialization-Chain"><a href="#Choreographer-Initialization-Chain" class="headerlink" title="Choreographer Initialization Chain"></a>Choreographer Initialization Chain</h3><p>During Activity startup, after <code>onResume</code>, <code>Activity.makeVisible()</code> is called, then <code>addView()</code>, eventually calling:</p><figure class="highlight java"><table><tr><td class="gutter"><pre><span class="line">1</span><br><span class="line">2</span><br><span class="line">3</span><br><span class="line">4</span><br><span class="line">5</span><br><span class="line">6</span><br><span class="line">7</span><br><span class="line">8</span><br><span class="line">9</span><br></pre></td><td class="code"><pre><span class="line">ActivityThread.handleResumeActivity(IBinder, <span class="type">boolean</span>, <span class="type">boolean</span>, String) (android.app)</span><br><span class="line">--&gt;WindowManagerImpl.addView(View, LayoutParams) (android.view)</span><br><span class="line">  --&gt;WindowManagerGlobal.addView(View, LayoutParams, Display, Window) (android.view)</span><br><span class="line">    --&gt;ViewRootImpl.ViewRootImpl(Context, Display) (android.view)</span><br><span class="line">    <span class="keyword">public</span> <span class="title function_">ViewRootImpl</span><span class="params">(Context context, Display display)</span> &#123;</span><br><span class="line">        ......</span><br><span class="line">        mChoreographer = Choreographer.getInstance();</span><br><span class="line">        ......</span><br><span class="line">    &#125;</span><br></pre></td></tr></table></figure><h2 id="FrameDisplayEventReceiver-Overview"><a href="#FrameDisplayEventReceiver-Overview" class="headerlink" title="FrameDisplayEventReceiver Overview"></a>FrameDisplayEventReceiver Overview</h2><p><code>FrameDisplayEventReceiver</code> handles Vsync registration, requests, and reception. It inherits from <code>DisplayEventReceiver</code> and has three key methods:</p><ol><li><code>onVsync</code> – Vsync signal callback</li><li><code>run</code> – Executes <code>doFrame</code></li><li><code>scheduleVsync</code> – Requests the Vsync signal</li></ol><figure class="highlight java"><table><tr><td class="gutter"><pre><span class="line">1</span><br><span class="line">2</span><br><span class="line">3</span><br><span class="line">4</span><br><span class="line">5</span><br><span class="line">6</span><br><span class="line">7</span><br><span class="line">8</span><br><span class="line">9</span><br><span class="line">10</span><br><span class="line">11</span><br><span class="line">12</span><br><span class="line">13</span><br><span class="line">14</span><br><span class="line">15</span><br><span class="line">16</span><br><span class="line">17</span><br><span class="line">18</span><br><span class="line">19</span><br><span class="line">20</span><br><span class="line">21</span><br><span class="line">22</span><br><span class="line">23</span><br></pre></td><td class="code"><pre><span class="line"><span class="keyword">private</span> <span class="keyword">final</span> <span class="keyword">class</span> <span class="title class_">FrameDisplayEventReceiver</span> <span class="keyword">extends</span> <span class="title class_">DisplayEventReceiver</span> <span class="keyword">implements</span> <span class="title class_">Runnable</span> &#123;</span><br><span class="line">    ......</span><br><span class="line">    <span class="meta">@Override</span></span><br><span class="line">    <span class="keyword">public</span> <span class="keyword">void</span> <span class="title function_">onVsync</span><span class="params">(<span class="type">long</span> timestampNanos, <span class="type">long</span> physicalDisplayId, <span class="type">int</span> frame)</span> &#123;</span><br><span class="line">        ......</span><br><span class="line">        mTimestampNanos = timestampNanos;</span><br><span class="line">        mFrame = frame;</span><br><span class="line">        <span class="type">Message</span> <span class="variable">msg</span> <span class="operator">=</span> Message.obtain(mHandler, <span class="built_in">this</span>);</span><br><span class="line">        msg.setAsynchronous(<span class="literal">true</span>);</span><br><span class="line">        mHandler.sendMessageAtTime(msg, timestampNanos / TimeUtils.NANOS_PER_MS);</span><br><span class="line">    &#125;</span><br><span class="line">    <span class="meta">@Override</span></span><br><span class="line">    <span class="keyword">public</span> <span class="keyword">void</span> <span class="title function_">run</span><span class="params">()</span> &#123;</span><br><span class="line">        mHavePendingVsync = <span class="literal">false</span>;</span><br><span class="line">        doFrame(mTimestampNanos, mFrame);</span><br><span class="line">    &#125;</span><br><span class="line"></span><br><span class="line">    <span class="keyword">public</span> <span class="keyword">void</span> <span class="title function_">scheduleVsync</span><span class="params">()</span> &#123;</span><br><span class="line">        ......</span><br><span class="line">        nativeScheduleVsync(mReceiverPtr);</span><br><span class="line">        ......</span><br><span class="line">    &#125;</span><br><span class="line">&#125;</span><br></pre></td></tr></table></figure><h2 id="Vsync-Registration-in-Choreographer"><a href="#Vsync-Registration-in-Choreographer" class="headerlink" title="Vsync Registration in Choreographer"></a>Vsync Registration in Choreographer</h2><p>The <code>FrameDisplayEventReceiver.onVsync</code> inner class receives Vsync callbacks and notifies the UIThread. It achieves this by listening to file descriptors initialized as follows:</p><p><code>android/view/Choreographer.java</code></p><figure class="highlight java"><table><tr><td class="gutter"><pre><span class="line">1</span><br><span class="line">2</span><br><span class="line">3</span><br><span class="line">4</span><br><span class="line">5</span><br><span class="line">6</span><br><span class="line">7</span><br></pre></td><td class="code"><pre><span class="line"><span class="keyword">private</span> <span class="title function_">Choreographer</span><span class="params">(Looper looper, <span class="type">int</span> vsyncSource)</span> &#123;</span><br><span class="line">    mLooper = looper;</span><br><span class="line">    mDisplayEventReceiver = USE_VSYNC</span><br><span class="line">            ? <span class="keyword">new</span> <span class="title class_">FrameDisplayEventReceiver</span>(looper, vsyncSource)</span><br><span class="line">            : <span class="literal">null</span>;</span><br><span class="line">    ......</span><br><span class="line">&#125;</span><br></pre></td></tr></table></figure><p><code>android/view/Choreographer.java</code></p><figure class="highlight java"><table><tr><td class="gutter"><pre><span class="line">1</span><br><span class="line">2</span><br><span class="line">3</span><br></pre></td><td class="code"><pre><span class="line"><span class="keyword">public</span> <span class="title function_">FrameDisplayEventReceiver</span><span class="params">(Looper looper, <span class="type">int</span> vsyncSource)</span> &#123;</span><br><span class="line">    <span class="built_in">super</span>(looper, vsyncSource);</span><br><span class="line">&#125;</span><br></pre></td></tr></table></figure><p><code>android/view/DisplayEventReceiver.java</code></p><figure class="highlight java"><table><tr><td class="gutter"><pre><span class="line">1</span><br><span class="line">2</span><br><span class="line">3</span><br><span class="line">4</span><br><span class="line">5</span><br><span class="line">6</span><br></pre></td><td class="code"><pre><span class="line"><span class="keyword">public</span> <span class="title function_">DisplayEventReceiver</span><span class="params">(Looper looper, <span class="type">int</span> vsyncSource)</span> &#123;</span><br><span class="line">    ......</span><br><span class="line">    mMessageQueue = looper.getQueue();</span><br><span class="line">    mReceiverPtr = nativeInit(<span class="keyword">new</span> <span class="title class_">WeakReference</span>&lt;DisplayEventReceiver&gt;(<span class="built_in">this</span>), mMessageQueue,</span><br><span class="line">            vsyncSource);</span><br><span class="line">&#125;</span><br></pre></td></tr></table></figure><p><code>nativeInit</code> uses a <code>BitTube</code> (essentially a socket pair) to pass and request Vsync events. When SurfaceFlinger receives Vsync, its <code>appEventThread</code> sends the event through <code>BitTube</code> to <code>DisplayEventDispatcher</code>, which then triggers <code>Choreographer.FrameDisplayEventReceiver.onVsync</code>, starting frame drawing:</p><p><img src="/en/images/15717421215251.jpg"></p><h2 id="Logic-for-Processing-One-Frame"><a href="#Logic-for-Processing-One-Frame" class="headerlink" title="Logic for Processing One Frame"></a>Logic for Processing One Frame</h2><p>The core logic resides in <code>Choreographer.doFrame</code>. <code>FrameDisplayEventReceiver.onVsync</code> posts itself, and its <code>run</code> method calls <code>doFrame</code>:</p><p><code>android/view/Choreographer.java</code></p><figure class="highlight java"><table><tr><td class="gutter"><pre><span class="line">1</span><br><span class="line">2</span><br><span class="line">3</span><br><span class="line">4</span><br><span class="line">5</span><br><span class="line">6</span><br><span class="line">7</span><br><span class="line">8</span><br><span class="line">9</span><br><span class="line">10</span><br><span class="line">11</span><br><span class="line">12</span><br></pre></td><td class="code"><pre><span class="line"><span class="keyword">public</span> <span class="keyword">void</span> <span class="title function_">onVsync</span><span class="params">(<span class="type">long</span> timestampNanos, <span class="type">long</span> physicalDisplayId, <span class="type">int</span> frame)</span> &#123;</span><br><span class="line">    ......</span><br><span class="line">    mTimestampNanos = timestampNanos;</span><br><span class="line">    mFrame = frame;</span><br><span class="line">    <span class="type">Message</span> <span class="variable">msg</span> <span class="operator">=</span> Message.obtain(mHandler, <span class="built_in">this</span>);</span><br><span class="line">    msg.setAsynchronous(<span class="literal">true</span>);</span><br><span class="line">    mHandler.sendMessageAtTime(msg, timestampNanos / TimeUtils.NANOS_PER_MS);</span><br><span class="line">&#125;</span><br><span class="line"><span class="keyword">public</span> <span class="keyword">void</span> <span class="title function_">run</span><span class="params">()</span> &#123;</span><br><span class="line">    mHavePendingVsync = <span class="literal">false</span>;</span><br><span class="line">    doFrame(mTimestampNanos, mFrame);</span><br><span class="line">&#125;</span><br></pre></td></tr></table></figure><p><code>doFrame</code> performs three main tasks:</p><ol><li>Calculates dropped frame logic.</li><li>Records frame drawing information.</li><li>Executes <code>CALLBACK_INPUT</code>, <code>CALLBACK_ANIMATION</code>, <code>CALLBACK_INSETS_ANIMATION</code>, <code>CALLBACK_TRAVERSAL</code>, and <code>CALLBACK_COMMIT</code>.</li></ol><h3 id="Dropped-Frame-Logic"><a href="#Dropped-Frame-Logic" class="headerlink" title="Dropped Frame Logic"></a>Dropped Frame Logic</h3><figure class="highlight java"><table><tr><td class="gutter"><pre><span class="line">1</span><br><span class="line">2</span><br><span class="line">3</span><br><span class="line">4</span><br><span class="line">5</span><br><span class="line">6</span><br><span class="line">7</span><br><span class="line">8</span><br><span class="line">9</span><br><span class="line">10</span><br><span class="line">11</span><br><span class="line">12</span><br><span class="line">13</span><br><span class="line">14</span><br><span class="line">15</span><br><span class="line">16</span><br><span class="line">17</span><br><span class="line">18</span><br></pre></td><td class="code"><pre><span class="line"><span class="keyword">void</span> <span class="title function_">doFrame</span><span class="params">(<span class="type">long</span> frameTimeNanos, <span class="type">int</span> frame)</span> &#123;</span><br><span class="line">    <span class="keyword">final</span> <span class="type">long</span> startNanos;</span><br><span class="line">    <span class="keyword">synchronized</span> (mLock) &#123;</span><br><span class="line">        ......</span><br><span class="line">        <span class="type">long</span> <span class="variable">intendedFrameTimeNanos</span> <span class="operator">=</span> frameTimeNanos;</span><br><span class="line">        startNanos = System.nanoTime();</span><br><span class="line">        <span class="keyword">final</span> <span class="type">long</span> <span class="variable">jitterNanos</span> <span class="operator">=</span> startNanos - frameTimeNanos;</span><br><span class="line">        <span class="keyword">if</span> (jitterNanos &gt;= mFrameIntervalNanos) &#123;</span><br><span class="line">            <span class="keyword">final</span> <span class="type">long</span> <span class="variable">skippedFrames</span> <span class="operator">=</span> jitterNanos / mFrameIntervalNanos;</span><br><span class="line">            <span class="keyword">if</span> (skippedFrames &gt;= SKIPPED_FRAME_WARNING_LIMIT) &#123;</span><br><span class="line">                Log.i(TAG, <span class="string">&quot;Skipped &quot;</span> + skippedFrames + <span class="string">&quot; frames!  &quot;</span></span><br><span class="line">                        + <span class="string">&quot;The application may be doing too much work on its main thread.&quot;</span>);</span><br><span class="line">            &#125;</span><br><span class="line">        &#125;</span><br><span class="line">        ......</span><br><span class="line">    &#125;</span><br><span class="line">    ......</span><br><span class="line">&#125;</span><br></pre></td></tr></table></figure><p>Dropped frame detection uses the difference between when Vsync was supposed to arrive (<code>start_time</code>) and when <code>doFrame</code> actually executes (<code>end_time</code>). This jitter represents the delay, or dropped frames:</p><p><img src="/en/images/15717421364722.jpg"></p><p>Actual Systrace example of dropped frames:</p><p><img src="/en/images/15717421441350.jpg"></p><p>Note: This method calculates jitter for the <em>previous</em> frame, meaning some dropped frames might be missed.</p><h3 id="Recording-Frame-Drawing-Info"><a href="#Recording-Frame-Drawing-Info" class="headerlink" title="Recording Frame Drawing Info"></a>Recording Frame Drawing Info</h3><p><code>FrameInfo</code> records key node times (visible via <code>dumpsys gfxinfo</code>). <code>hwui</code> records the remaining parts.</p><figure class="highlight java"><table><tr><td class="gutter"><pre><span class="line">1</span><br><span class="line">2</span><br><span class="line">3</span><br><span class="line">4</span><br><span class="line">5</span><br><span class="line">6</span><br><span class="line">7</span><br><span class="line">8</span><br><span class="line">9</span><br><span class="line">10</span><br><span class="line">11</span><br><span class="line">12</span><br><span class="line">13</span><br><span class="line">14</span><br><span class="line">15</span><br><span class="line">16</span><br><span class="line">17</span><br><span class="line">18</span><br><span class="line">19</span><br><span class="line">20</span><br><span class="line">21</span><br><span class="line">22</span><br><span class="line">23</span><br><span class="line">24</span><br><span class="line">25</span><br><span class="line">26</span><br><span class="line">27</span><br><span class="line">28</span><br><span class="line">29</span><br><span class="line">30</span><br><span class="line">31</span><br><span class="line">32</span><br><span class="line">33</span><br><span class="line">34</span><br><span class="line">35</span><br><span class="line">36</span><br><span class="line">37</span><br><span class="line">38</span><br></pre></td><td class="code"><pre><span class="line"><span class="comment">// Various flags set to provide extra metadata about the current frame</span></span><br><span class="line"><span class="keyword">private</span> <span class="keyword">static</span> <span class="keyword">final</span> <span class="type">int</span> <span class="variable">FLAGS</span> <span class="operator">=</span> <span class="number">0</span>;</span><br><span class="line"></span><br><span class="line"><span class="comment">// Is this the first-draw following a window layout?</span></span><br><span class="line"><span class="keyword">public</span> <span class="keyword">static</span> <span class="keyword">final</span> <span class="type">long</span> <span class="variable">FLAG_WINDOW_LAYOUT_CHANGED</span> <span class="operator">=</span> <span class="number">1</span>;</span><br><span class="line"></span><br><span class="line"><span class="comment">// A renderer associated with just a Surface, not with a ViewRootImpl instance.</span></span><br><span class="line"><span class="keyword">public</span> <span class="keyword">static</span> <span class="keyword">final</span> <span class="type">long</span> <span class="variable">FLAG_SURFACE_CANVAS</span> <span class="operator">=</span> <span class="number">1</span> &lt;&lt; <span class="number">2</span>;</span><br><span class="line"></span><br><span class="line"><span class="meta">@LongDef(flag = true, value = &#123;</span></span><br><span class="line"><span class="meta">        FLAG_WINDOW_LAYOUT_CHANGED, FLAG_SURFACE_CANVAS &#125;)</span></span><br><span class="line"><span class="meta">@Retention(RetentionPolicy.SOURCE)</span></span><br><span class="line"><span class="keyword">public</span> <span class="meta">@interface</span> FrameInfoFlags &#123;&#125;</span><br><span class="line"></span><br><span class="line"><span class="comment">// The intended vsync time, unadjusted by jitter</span></span><br><span class="line"><span class="keyword">private</span> <span class="keyword">static</span> <span class="keyword">final</span> <span class="type">int</span> <span class="variable">INTENDED_VSYNC</span> <span class="operator">=</span> <span class="number">1</span>;</span><br><span class="line"></span><br><span class="line"><span class="comment">// Jitter-adjusted vsync time, this is what was used as input into the</span></span><br><span class="line"><span class="comment">// animation &amp; drawing system</span></span><br><span class="line"><span class="keyword">private</span> <span class="keyword">static</span> <span class="keyword">final</span> <span class="type">int</span> <span class="variable">VSYNC</span> <span class="operator">=</span> <span class="number">2</span>;</span><br><span class="line"></span><br><span class="line"><span class="comment">// The time of the oldest input event</span></span><br><span class="line"><span class="keyword">private</span> <span class="keyword">static</span> <span class="keyword">final</span> <span class="type">int</span> <span class="variable">OLDEST_INPUT_EVENT</span> <span class="operator">=</span> <span class="number">3</span>;</span><br><span class="line"></span><br><span class="line"><span class="comment">// The time of the newest input event</span></span><br><span class="line"><span class="keyword">private</span> <span class="keyword">static</span> <span class="keyword">final</span> <span class="type">int</span> <span class="variable">NEWEST_INPUT_EVENT</span> <span class="operator">=</span> <span class="number">4</span>;</span><br><span class="line"></span><br><span class="line"><span class="comment">// When input event handling started</span></span><br><span class="line"><span class="keyword">private</span> <span class="keyword">static</span> <span class="keyword">final</span> <span class="type">int</span> <span class="variable">HANDLE_INPUT_START</span> <span class="operator">=</span> <span class="number">5</span>;</span><br><span class="line"></span><br><span class="line"><span class="comment">// When animation evaluations started</span></span><br><span class="line"><span class="keyword">private</span> <span class="keyword">static</span> <span class="keyword">final</span> <span class="type">int</span> <span class="variable">ANIMATION_START</span> <span class="operator">=</span> <span class="number">6</span>;</span><br><span class="line"></span><br><span class="line"><span class="comment">// When ViewRootImpl#performTraversals() started</span></span><br><span class="line"><span class="keyword">private</span> <span class="keyword">static</span> <span class="keyword">final</span> <span class="type">int</span> <span class="variable">PERFORM_TRAVERSALS_START</span> <span class="operator">=</span> <span class="number">7</span>;</span><br><span class="line"></span><br><span class="line"><span class="comment">// When View:draw() started</span></span><br><span class="line"><span class="keyword">private</span> <span class="keyword">static</span> <span class="keyword">final</span> <span class="type">int</span> <span class="variable">DRAW_START</span> <span class="operator">=</span> <span class="number">8</span>;</span><br></pre></td></tr></table></figure><p><code>doFrame</code> records times from Vsync to <code>markPerformTraversalsStart</code>:</p><figure class="highlight java"><table><tr><td class="gutter"><pre><span class="line">1</span><br><span class="line">2</span><br><span class="line">3</span><br><span class="line">4</span><br><span class="line">5</span><br><span class="line">6</span><br><span class="line">7</span><br><span class="line">8</span><br><span class="line">9</span><br><span class="line">10</span><br><span class="line">11</span><br><span class="line">12</span><br><span class="line">13</span><br></pre></td><td class="code"><pre><span class="line"><span class="keyword">void</span> <span class="title function_">doFrame</span><span class="params">(<span class="type">long</span> frameTimeNanos, <span class="type">int</span> frame)</span> &#123;</span><br><span class="line">    ......</span><br><span class="line">    mFrameInfo.setVsync(intendedFrameTimeNanos, frameTimeNanos);</span><br><span class="line">    <span class="comment">// Process CALLBACK_INPUT Callbacks</span></span><br><span class="line">    mFrameInfo.markInputHandlingStart();</span><br><span class="line">    <span class="comment">// Process CALLBACK_ANIMATION Callbacks</span></span><br><span class="line">    mFrameInfo.markAnimationsStart();</span><br><span class="line">    <span class="comment">// Process CALLBACK_INSETS_ANIMATION Callbacks</span></span><br><span class="line">    <span class="comment">// Process CALLBACK_TRAVERSAL Callbacks</span></span><br><span class="line">    mFrameInfo.markPerformTraversalsStart();</span><br><span class="line">    <span class="comment">// Process CALLBACK_COMMIT Callbacks</span></span><br><span class="line">    ......</span><br><span class="line">&#125;</span><br></pre></td></tr></table></figure><h3 id="Executing-Callbacks"><a href="#Executing-Callbacks" class="headerlink" title="Executing Callbacks"></a>Executing Callbacks</h3><figure class="highlight java"><table><tr><td class="gutter"><pre><span class="line">1</span><br><span class="line">2</span><br><span class="line">3</span><br><span class="line">4</span><br><span class="line">5</span><br><span class="line">6</span><br><span class="line">7</span><br><span class="line">8</span><br><span class="line">9</span><br><span class="line">10</span><br><span class="line">11</span><br><span class="line">12</span><br><span class="line">13</span><br><span class="line">14</span><br></pre></td><td class="code"><pre><span class="line"><span class="keyword">void</span> <span class="title function_">doFrame</span><span class="params">(<span class="type">long</span> frameTimeNanos, <span class="type">int</span> frame)</span> &#123;</span><br><span class="line">    ......</span><br><span class="line">    <span class="comment">// Process CALLBACK_INPUT Callbacks</span></span><br><span class="line">    doCallbacks(Choreographer.CALLBACK_INPUT, frameTimeNanos);</span><br><span class="line">    <span class="comment">// Process CALLBACK_ANIMATION Callbacks</span></span><br><span class="line">    doCallbacks(Choreographer.CALLBACK_ANIMATION, frameTimeNanos);</span><br><span class="line">    <span class="comment">// Process CALLBACK_INSETS_ANIMATION Callbacks</span></span><br><span class="line">    doCallbacks(Choreographer.CALLBACK_INSETS_ANIMATION, frameTimeNanos);</span><br><span class="line">    <span class="comment">// Process CALLBACK_TRAVERSAL Callbacks</span></span><br><span class="line">    doCallbacks(Choreographer.CALLBACK_TRAVERSAL, frameTimeNanos);</span><br><span class="line">    <span class="comment">// Process CALLBACK_COMMIT Callbacks</span></span><br><span class="line">    doCallbacks(Choreographer.CALLBACK_COMMIT, frameTimeNanos);</span><br><span class="line">    ......</span><br><span class="line">&#125;</span><br></pre></td></tr></table></figure><p><strong>Input Callback Stack</strong></p><p><code>input callback</code> typically executes <code>ViewRootImpl.ConsumeBatchedInputRunnable</code>:</p><p><code>android/view/ViewRootImpl.java</code></p><figure class="highlight java"><table><tr><td class="gutter"><pre><span class="line">1</span><br><span class="line">2</span><br><span class="line">3</span><br><span class="line">4</span><br><span class="line">5</span><br><span class="line">6</span><br><span class="line">7</span><br><span class="line">8</span><br><span class="line">9</span><br><span class="line">10</span><br><span class="line">11</span><br><span class="line">12</span><br><span class="line">13</span><br><span class="line">14</span><br><span class="line">15</span><br><span class="line">16</span><br><span class="line">17</span><br><span class="line">18</span><br></pre></td><td class="code"><pre><span class="line"><span class="keyword">final</span> <span class="keyword">class</span> <span class="title class_">ConsumeBatchedInputRunnable</span> <span class="keyword">implements</span> <span class="title class_">Runnable</span> &#123;</span><br><span class="line">    <span class="meta">@Override</span></span><br><span class="line">    <span class="keyword">public</span> <span class="keyword">void</span> <span class="title function_">run</span><span class="params">()</span> &#123;</span><br><span class="line">        doConsumeBatchedInput(mChoreographer.getFrameTimeNanos());</span><br><span class="line">    &#125;</span><br><span class="line">&#125;</span><br><span class="line"><span class="keyword">void</span> <span class="title function_">doConsumeBatchedInput</span><span class="params">(<span class="type">long</span> frameTimeNanos)</span> &#123;</span><br><span class="line">    <span class="keyword">if</span> (mConsumeBatchedInputScheduled) &#123;</span><br><span class="line">        mConsumeBatchedInputScheduled = <span class="literal">false</span>;</span><br><span class="line">        <span class="keyword">if</span> (mInputEventReceiver != <span class="literal">null</span>) &#123;</span><br><span class="line">            <span class="keyword">if</span> (mInputEventReceiver.consumeBatchedInputEvents(frameTimeNanos)</span><br><span class="line">                    &amp;&amp; frameTimeNanos != -<span class="number">1</span>) &#123;</span><br><span class="line">                scheduleConsumeBatchedInput();</span><br><span class="line">            &#125;</span><br><span class="line">        &#125;</span><br><span class="line">        doProcessInputEvents();</span><br><span class="line">    &#125;</span><br><span class="line">&#125;</span><br></pre></td></tr></table></figure><p>Input events eventually reach <code>DecorView.dispatchTouchEvent</code> for standard event distribution:</p><p><img src="/en/images/15717421837064.jpg"></p><p><strong>Animation Callback Stack</strong></p><p>Commonly used via <code>View.postOnAnimation</code>:</p><figure class="highlight java"><table><tr><td class="gutter"><pre><span class="line">1</span><br><span class="line">2</span><br><span class="line">3</span><br><span class="line">4</span><br><span class="line">5</span><br><span class="line">6</span><br><span class="line">7</span><br><span class="line">8</span><br><span class="line">9</span><br></pre></td><td class="code"><pre><span class="line"><span class="keyword">public</span> <span class="keyword">void</span> <span class="title function_">postOnAnimation</span><span class="params">(Runnable action)</span> &#123;</span><br><span class="line">    <span class="keyword">final</span> <span class="type">AttachInfo</span> <span class="variable">attachInfo</span> <span class="operator">=</span> mAttachInfo;</span><br><span class="line">    <span class="keyword">if</span> (attachInfo != <span class="literal">null</span>) &#123;</span><br><span class="line">        attachInfo.mViewRootImpl.mChoreographer.postCallback(</span><br><span class="line">                Choreographer.CALLBACK_ANIMATION, action, <span class="literal">null</span>);</span><br><span class="line">    &#125; <span class="keyword">else</span> &#123;</span><br><span class="line">        getRunQueue().post(action);</span><br><span class="line">    &#125;</span><br><span class="line">&#125;</span><br></pre></td></tr></table></figure><p>Used for operations like <code>startScroll</code> and <code>Fling</code>:</p><p><img src="/en/images/15717421963577.jpg"></p><p>Here is a fling animation stack:</p><p><img src="/en/images/15717422041938.jpg"></p><p><code>FrameCallback</code> also uses <code>CALLBACK_ANIMATION</code>:</p><figure class="highlight java"><table><tr><td class="gutter"><pre><span class="line">1</span><br><span class="line">2</span><br><span class="line">3</span><br><span class="line">4</span><br><span class="line">5</span><br><span class="line">6</span><br><span class="line">7</span><br><span class="line">8</span><br></pre></td><td class="code"><pre><span class="line"><span class="keyword">public</span> <span class="keyword">void</span> <span class="title function_">postFrameCallbackDelayed</span><span class="params">(FrameCallback callback, <span class="type">long</span> delayMillis)</span> &#123;</span><br><span class="line">    <span class="keyword">if</span> (callback == <span class="literal">null</span>) &#123;</span><br><span class="line">        <span class="keyword">throw</span> <span class="keyword">new</span> <span class="title class_">IllegalArgumentException</span>(<span class="string">&quot;callback must not be null&quot;</span>);</span><br><span class="line">    &#125;</span><br><span class="line"></span><br><span class="line">    postCallbackDelayedInternal(CALLBACK_ANIMATION,</span><br><span class="line">            callback, FRAME_CALLBACK_TOKEN, delayMillis);</span><br><span class="line">&#125;</span><br></pre></td></tr></table></figure><p><strong>Traversal Stack</strong></p><figure class="highlight java"><table><tr><td class="gutter"><pre><span class="line">1</span><br><span class="line">2</span><br><span class="line">3</span><br><span class="line">4</span><br><span class="line">5</span><br><span class="line">6</span><br><span class="line">7</span><br><span class="line">8</span><br><span class="line">9</span><br><span class="line">10</span><br><span class="line">11</span><br><span class="line">12</span><br><span class="line">13</span><br><span class="line">14</span><br><span class="line">15</span><br><span class="line">16</span><br><span class="line">17</span><br><span class="line">18</span><br><span class="line">19</span><br><span class="line">20</span><br><span class="line">21</span><br><span class="line">22</span><br><span class="line">23</span><br><span class="line">24</span><br><span class="line">25</span><br><span class="line">26</span><br><span class="line">27</span><br><span class="line">28</span><br><span class="line">29</span><br><span class="line">30</span><br><span class="line">31</span><br><span class="line">32</span><br><span class="line">33</span><br><span class="line">34</span><br><span class="line">35</span><br><span class="line">36</span><br><span class="line">37</span><br><span class="line">38</span><br><span class="line">39</span><br></pre></td><td class="code"><pre><span class="line"><span class="keyword">void</span> <span class="title function_">scheduleTraversals</span><span class="params">()</span> &#123;</span><br><span class="line">    <span class="keyword">if</span> (!mTraversalScheduled) &#123;</span><br><span class="line">        mTraversalScheduled = <span class="literal">true</span>;</span><br><span class="line">        <span class="comment">// Post SyncBarrier to prioritize</span></span><br><span class="line">        mTraversalBarrier = mHandler.getLooper().getQueue().postSyncBarrier();</span><br><span class="line">        mChoreographer.postCallback(</span><br><span class="line">                Choreographer.CALLBACK_TRAVERSAL, mTraversalRunnable, <span class="literal">null</span>);</span><br><span class="line">    &#125;</span><br><span class="line">&#125;</span><br><span class="line"></span><br><span class="line"><span class="keyword">final</span> <span class="keyword">class</span> <span class="title class_">TraversalRunnable</span> <span class="keyword">implements</span> <span class="title class_">Runnable</span> &#123;</span><br><span class="line">    <span class="meta">@Override</span></span><br><span class="line">    <span class="keyword">public</span> <span class="keyword">void</span> <span class="title function_">run</span><span class="params">()</span> &#123;</span><br><span class="line">        <span class="comment">// Start measure, layout, draw</span></span><br><span class="line">        doTraversal();</span><br><span class="line">    &#125;</span><br><span class="line">&#125;</span><br><span class="line"><span class="keyword">void</span> <span class="title function_">doTraversal</span><span class="params">()</span> &#123;</span><br><span class="line">    <span class="keyword">if</span> (mTraversalScheduled) &#123;</span><br><span class="line">        mTraversalScheduled = <span class="literal">false</span>;</span><br><span class="line">        <span class="comment">// Remove SyncBarrier</span></span><br><span class="line">        mHandler.getLooper().getQueue().removeSyncBarrier(mTraversalBarrier);</span><br><span class="line">        performTraversals();</span><br><span class="line">    &#125;</span><br><span class="line">&#125;</span><br><span class="line"><span class="keyword">private</span> <span class="keyword">void</span> <span class="title function_">performTraversals</span><span class="params">()</span> &#123;</span><br><span class="line">      <span class="comment">// measure</span></span><br><span class="line">      <span class="keyword">if</span> (focusChangedDueToTouchMode || mWidth != host.getMeasuredWidth() || mHeight != host.getMeasuredHeight() || contentInsetsChanged || updatedConfiguration) &#123;</span><br><span class="line">            performMeasure(childWidthMeasureSpec, childHeightMeasureSpec);</span><br><span class="line">      &#125;</span><br><span class="line">      <span class="comment">// layout</span></span><br><span class="line">      <span class="keyword">if</span> (didLayout) &#123;</span><br><span class="line">          performLayout(lp, mWidth, mHeight);</span><br><span class="line">      &#125;</span><br><span class="line">      <span class="comment">// draw</span></span><br><span class="line">      <span class="keyword">if</span> (!cancelDraw &amp;&amp; !newSurface) &#123;</span><br><span class="line">          performDraw();</span><br><span class="line">      &#125;</span><br><span class="line">&#125;</span><br></pre></td></tr></table></figure><p><strong>doTraversal TraceView Example</strong></p><p><img src="/en/images/15717422180571.jpg"></p><h2 id="Requesting-the-Next-Frame’s-Vsync"><a href="#Requesting-the-Next-Frame’s-Vsync" class="headerlink" title="Requesting the Next Frame’s Vsync"></a>Requesting the Next Frame’s Vsync</h2><p>Continuous operations like animations or scrolling need a stable frame output. Every <code>doFrame</code> triggers another Vsync request as needed. <code>invalidate</code> and <code>requestLayout</code> also trigger requests.</p><p><img src="/en/images/15724225347501.jpg"></p><h3 id="ObjectAnimator-Animation-Logic"><a href="#ObjectAnimator-Animation-Logic" class="headerlink" title="ObjectAnimator Animation Logic"></a>ObjectAnimator Animation Logic</h3><p><code>android/animation/ObjectAnimator.java</code></p><figure class="highlight java"><table><tr><td class="gutter"><pre><span class="line">1</span><br><span class="line">2</span><br><span class="line">3</span><br></pre></td><td class="code"><pre><span class="line"><span class="keyword">public</span> <span class="keyword">void</span> <span class="title function_">start</span><span class="params">()</span> &#123;</span><br><span class="line">    <span class="built_in">super</span>.start();</span><br><span class="line">&#125;</span><br></pre></td></tr></table></figure><p><code>android/animation/ValueAnimator.java</code></p><figure class="highlight java"><table><tr><td class="gutter"><pre><span class="line">1</span><br><span class="line">2</span><br><span class="line">3</span><br><span class="line">4</span><br><span class="line">5</span><br><span class="line">6</span><br><span class="line">7</span><br><span class="line">8</span><br><span class="line">9</span><br></pre></td><td class="code"><pre><span class="line"><span class="keyword">private</span> <span class="keyword">void</span> <span class="title function_">start</span><span class="params">(<span class="type">boolean</span> playBackwards)</span> &#123;</span><br><span class="line">    ......</span><br><span class="line">    addAnimationCallback(<span class="number">0</span>);</span><br><span class="line">    ......</span><br><span class="line">&#125;</span><br><span class="line"><span class="keyword">private</span> <span class="keyword">void</span> <span class="title function_">addAnimationCallback</span><span class="params">(<span class="type">long</span> delay)</span> &#123;</span><br><span class="line">    ......</span><br><span class="line">    getAnimationHandler().addAnimationFrameCallback(<span class="built_in">this</span>, delay);</span><br><span class="line">&#125;</span><br></pre></td></tr></table></figure><p><code>android/animation/AnimationHandler.java</code></p><figure class="highlight java"><table><tr><td class="gutter"><pre><span class="line">1</span><br><span class="line">2</span><br><span class="line">3</span><br><span class="line">4</span><br><span class="line">5</span><br><span class="line">6</span><br><span class="line">7</span><br><span class="line">8</span><br><span class="line">9</span><br><span class="line">10</span><br><span class="line">11</span><br><span class="line">12</span><br><span class="line">13</span><br><span class="line">14</span><br><span class="line">15</span><br><span class="line">16</span><br></pre></td><td class="code"><pre><span class="line"><span class="keyword">public</span> <span class="keyword">void</span> <span class="title function_">addAnimationFrameCallback</span><span class="params">(<span class="keyword">final</span> AnimationFrameCallback callback, <span class="type">long</span> delay)</span> &#123;</span><br><span class="line">    <span class="keyword">if</span> (mAnimationCallbacks.size() == <span class="number">0</span>) &#123;</span><br><span class="line">        getProvider().postFrameCallback(mFrameCallback);</span><br><span class="line">    &#125;</span><br><span class="line">    ......</span><br><span class="line">&#125;</span><br><span class="line"></span><br><span class="line"><span class="keyword">private</span> <span class="keyword">final</span> Choreographer.<span class="type">FrameCallback</span> <span class="variable">mFrameCallback</span> <span class="operator">=</span> <span class="keyword">new</span> <span class="title class_">Choreographer</span>.FrameCallback() &#123;</span><br><span class="line">    <span class="meta">@Override</span></span><br><span class="line">    <span class="keyword">public</span> <span class="keyword">void</span> <span class="title function_">doFrame</span><span class="params">(<span class="type">long</span> frameTimeNanos)</span> &#123;</span><br><span class="line">        doAnimationFrame(getProvider().getFrameTime());</span><br><span class="line">        <span class="keyword">if</span> (mAnimationCallbacks.size() &gt; <span class="number">0</span>) &#123;</span><br><span class="line">            getProvider().postFrameCallback(<span class="built_in">this</span>);</span><br><span class="line">        &#125;</span><br><span class="line">    &#125;</span><br><span class="line">&#125;;</span><br></pre></td></tr></table></figure><p>Animation uses the <code>FrameCallback</code> interface to request the next Vsync for every frame:</p><p><img src="/en/images/15717422327935.jpg"></p><h2 id="Source-Code-Summary"><a href="#Source-Code-Summary" class="headerlink" title="Source Code Summary"></a>Source Code Summary</h2><ol><li><strong>Choreographer</strong> is a thread singleton bound to a Looper (usually the app’s main thread).</li><li><strong>DisplayEventReceiver</strong> is an abstract class whose JNI part creates an <code>IDisplayEventConnection</code>. Vsync signals from <code>AppEventThread</code> are passed to <code>onVsync</code>.</li><li><strong>DisplayEventReceiver.scheduleVsync</strong> requests a Vsync interrupt before drawing UI.</li><li><strong>Choreographer.FrameCallback</strong> is called every Vsync, greatly assisting animation implementation by providing fixed timing.</li><li><strong>Choreographer</strong> invokes callbacks set via <code>postCallback</code> when Vsync arrives. Five types are defined:<ol><li><strong>CALLBACK_INPUT</strong>: Input events.</li><li><strong>CALLBACK_ANIMATION</strong>: Animation logic.</li><li><strong>CALLBACK_INSETS_ANIMATION</strong>: Insets animation.</li><li><strong>CALLBACK_TRAVERSAL</strong>: Measure, layout, draw.</li><li><strong>CALLBACK_COMMIT</strong>: trimMemory and frame monitoring.</li></ol></li><li><strong>ListView</strong> item initialization happens within input or animation depending on context.</li><li><strong>CALLBACK_INPUT</strong> and <strong>CALLBACK_ANIMATION</strong> execute before <strong>CALLBACK_TRAVERSAL</strong> because they modify view properties.</li></ol><h1 id="APM-and-Choreographer"><a href="#APM-and-Choreographer" class="headerlink" title="APM and Choreographer"></a>APM and Choreographer</h1><p>Given its position, <code>Choreographer</code> is central to performance monitoring. Analysts use its <code>FrameCallback</code> and <code>FrameInfo</code> interfaces:</p><ol><li><code>FrameCallback.doFrame</code> callbacks.</li><li><code>FrameInfo</code> monitoring (<code>adb shell dumpsys gfxinfo &lt;packagename&gt; framestats</code>).</li><li><code>SurfaceFlinger</code> monitoring (<code>adb shell dumpsys SurfaceFlinger --latency</code>).</li><li><code>SurfaceFlinger PageFlip</code> mechanism (<code>adb service call SurfaceFlinger 1013</code>).</li><li><code>Choreographer</code>‘s dropped frame calculation.</li><li><code>BlockCanary</code> based on <code>Looper</code>.</li></ol><h2 id="Using-FrameCallback-doFrame"><a href="#Using-FrameCallback-doFrame" class="headerlink" title="Using FrameCallback.doFrame"></a>Using FrameCallback.doFrame</h2><figure class="highlight java"><table><tr><td class="gutter"><pre><span class="line">1</span><br><span class="line">2</span><br><span class="line">3</span><br></pre></td><td class="code"><pre><span class="line"><span class="keyword">public</span> <span class="keyword">interface</span> <span class="title class_">FrameCallback</span> &#123;</span><br><span class="line">    <span class="keyword">public</span> <span class="keyword">void</span> <span class="title function_">doFrame</span><span class="params">(<span class="type">long</span> frameTimeNanos)</span>;</span><br><span class="line">&#125;</span><br></pre></td></tr></table></figure><p>Usage:</p><figure class="highlight java"><table><tr><td class="gutter"><pre><span class="line">1</span><br></pre></td><td class="code"><pre><span class="line">Choreographer.getInstance().postFrameCallback(youOwnFrameCallback );</span><br></pre></td></tr></table></figure><p>TinyDancer uses this to calculate FPS.</p><h2 id="Using-FrameInfo"><a href="#Using-FrameInfo" class="headerlink" title="Using FrameInfo"></a>Using FrameInfo</h2><p><code>adb shell dumpsys gfxinfo &lt;packagename&gt; framestats</code> output example:</p><figure class="highlight shell"><table><tr><td class="gutter"><pre><span class="line">1</span><br><span class="line">2</span><br><span class="line">3</span><br><span class="line">4</span><br><span class="line">5</span><br><span class="line">6</span><br><span class="line">7</span><br></pre></td><td class="code"><pre><span class="line">Window: StatusBar</span><br><span class="line">Total frames rendered: 1562</span><br><span class="line">Janky frames: 361 (23.11%)</span><br><span class="line">...</span><br><span class="line">---PROFILEDATA---</span><br><span class="line">Flags,IntendedVsync,Vsync,OldestInputEvent,NewestInputEvent,HandleInputStart,AnimationStart,PerformTraversalsStart,DrawStart,SyncQueued,SyncStart,IssueDrawCommandsStart,SwapBuffers,FrameCompleted,DequeueBufferDuration,QueueBufferDuration,</span><br><span class="line">0,10158314881426,10158314881426,9223372036854775807,0,10158315693363,10158315760759,10158315769821,10158316032165,10158316627842,10158316838988,10158318055915,10158320387269,10158321770654,428000,773000,</span><br></pre></td></tr></table></figure><h2 id="Using-SurfaceFlinger"><a href="#Using-SurfaceFlinger" class="headerlink" title="Using SurfaceFlinger"></a>Using SurfaceFlinger</h2><p>Data is in nanoseconds since boot. Each command returns 128 lines of frame data:</p><ol><li>Refresh period.</li><li>Col 1: App drawing time.</li><li>Col 2: Vsync timestamp before submission to hardware.</li><li>Col 3: Hardware acceptance time (completion).</li></ol><p>Jank is calculated when the <code>jankflag</code> (based on <code>ceil((C - A) / refresh-period)</code>) changes between lines.</p><h2 id="Using-SurfaceFlinger-PageFlip"><a href="#Using-SurfaceFlinger-PageFlip" class="headerlink" title="Using SurfaceFlinger PageFlip"></a>Using SurfaceFlinger PageFlip</h2><figure class="highlight java"><table><tr><td class="gutter"><pre><span class="line">1</span><br><span class="line">2</span><br><span class="line">3</span><br><span class="line">4</span><br><span class="line">5</span><br><span class="line">6</span><br><span class="line">7</span><br></pre></td><td class="code"><pre><span class="line"><span class="type">Parcel</span> <span class="variable">data</span> <span class="operator">=</span> Parcel.obtain();</span><br><span class="line"><span class="type">Parcel</span> <span class="variable">reply</span> <span class="operator">=</span> Parcel.obtain();</span><br><span class="line">data.writeInterfaceToken(<span class="string">&quot;android.ui.ISurfaceComposer&quot;</span>);</span><br><span class="line">mFlinger.transact(<span class="number">1013</span>, data, reply, <span class="number">0</span>);</span><br><span class="line"><span class="keyword">final</span> <span class="type">int</span> <span class="variable">pageFlipCount</span> <span class="operator">=</span> reply.readInt();</span><br><span class="line">...</span><br><span class="line">mFps = (<span class="type">float</span>) (frames * <span class="number">1e9</span> / duration);</span><br></pre></td></tr></table></figure><h2 id="BlockCanary"><a href="#BlockCanary" class="headerlink" title="BlockCanary"></a>BlockCanary</h2><p>Monitors performance by recording time before and after every <code>Looper</code> message:</p><figure class="highlight java"><table><tr><td class="gutter"><pre><span class="line">1</span><br><span class="line">2</span><br><span class="line">3</span><br><span class="line">4</span><br><span class="line">5</span><br><span class="line">6</span><br><span class="line">7</span><br><span class="line">8</span><br><span class="line">9</span><br><span class="line">10</span><br><span class="line">11</span><br><span class="line">12</span><br><span class="line">13</span><br><span class="line">14</span><br><span class="line">15</span><br></pre></td><td class="code"><pre><span class="line"><span class="keyword">public</span> <span class="keyword">static</span> <span class="keyword">void</span> <span class="title function_">loop</span><span class="params">()</span> &#123;</span><br><span class="line">    ...</span><br><span class="line">    <span class="keyword">for</span> (;;) &#123;</span><br><span class="line">        ...</span><br><span class="line">        <span class="keyword">if</span> (logging != <span class="literal">null</span>) &#123;</span><br><span class="line">            logging.println(<span class="string">&quot;&gt;&gt;&gt;&gt;&gt; Dispatching to &quot;</span> + msg.target + <span class="string">&quot; &quot;</span> +</span><br><span class="line">                    msg.callback + <span class="string">&quot;: &quot;</span> + msg.what);</span><br><span class="line">        &#125;</span><br><span class="line">        msg.target.dispatchMessage(msg);</span><br><span class="line">        <span class="keyword">if</span> (logging != <span class="literal">null</span>) &#123;</span><br><span class="line">            logging.println(<span class="string">&quot;&lt;&lt;&lt;&lt;&lt; Finished to &quot;</span> + msg.target + <span class="string">&quot; &quot;</span> + msg.callback);</span><br><span class="line">        &#125;</span><br><span class="line">        ...</span><br><span class="line">    &#125;</span><br><span class="line">&#125;</span><br></pre></td></tr></table></figure><h1 id="MessageQueue-and-Choreographer"><a href="#MessageQueue-and-Choreographer" class="headerlink" title="MessageQueue and Choreographer"></a>MessageQueue and Choreographer</h1><p>Asynchronous messages can bypass <code>SyncBarriers</code>. A Barrier blocks all subsequent synchronous messages until removed. This is used in <code>Choreographer</code> to prioritize <code>Traversal</code> messages:</p><h2 id="SyncBarrier-Example-in-Choreographer"><a href="#SyncBarrier-Example-in-Choreographer" class="headerlink" title="SyncBarrier Example in Choreographer"></a>SyncBarrier Example in Choreographer</h2><p><code>scheduleTraversals</code> posts a SyncBarrier:</p><figure class="highlight java"><table><tr><td class="gutter"><pre><span class="line">1</span><br><span class="line">2</span><br><span class="line">3</span><br><span class="line">4</span><br><span class="line">5</span><br><span class="line">6</span><br><span class="line">7</span><br><span class="line">8</span><br></pre></td><td class="code"><pre><span class="line"><span class="keyword">void</span> <span class="title function_">scheduleTraversals</span><span class="params">()</span> &#123;</span><br><span class="line">    <span class="keyword">if</span> (!mTraversalScheduled) &#123;</span><br><span class="line">        mTraversalScheduled = <span class="literal">true</span>;</span><br><span class="line">        mTraversalBarrier = mHandler.getLooper().getQueue().postSyncBarrier();</span><br><span class="line">        mChoreographer.postCallback(</span><br><span class="line">                Choreographer.CALLBACK_TRAVERSAL, mTraversalRunnable, <span class="literal">null</span>);</span><br><span class="line">    &#125;</span><br><span class="line">&#125;</span><br></pre></td></tr></table></figure><p><code>doTraversal</code> removes it:</p><figure class="highlight java"><table><tr><td class="gutter"><pre><span class="line">1</span><br><span class="line">2</span><br><span class="line">3</span><br><span class="line">4</span><br><span class="line">5</span><br><span class="line">6</span><br><span class="line">7</span><br></pre></td><td class="code"><pre><span class="line"><span class="keyword">void</span> <span class="title function_">doTraversal</span><span class="params">()</span> &#123;</span><br><span class="line">    <span class="keyword">if</span> (mTraversalScheduled) &#123;</span><br><span class="line">        mTraversalScheduled = <span class="literal">false</span>;</span><br><span class="line">        mHandler.getLooper().getQueue().removeSyncBarrier(mTraversalBarrier);</span><br><span class="line">        performTraversals();</span><br><span class="line">    &#125;</span><br><span class="line">&#125;</span><br></pre></td></tr></table></figure>]]></content>
    
    
    <summary type="html">&lt;p&gt;This article introduces &lt;code&gt;Choreographer&lt;/code&gt;, a class that app developers rarely encounter but is crucial in the Android Framework rendering pipeline. It covers the background of &lt;code&gt;Choreographer&lt;/code&gt;‘s introduction, an overview, source code analysis, its relationship with &lt;code&gt;MessageQueue&lt;/code&gt;, its use in APM, and optimization ideas from mobile manufacturers.&lt;/p&gt;
&lt;p&gt;&lt;code&gt;Choreographer&lt;/code&gt; was introduced to coordinate with Vsync, providing a stable timing for handling Messages in app rendering. When Vsync arrives, the system adjusts the Vsync signal period to control the timing of drawing operations for each frame. Most phones currently have a 60Hz refresh rate (16.6ms). To match this, the system sets the Vsync period to 16.6ms, waking &lt;code&gt;Choreographer&lt;/code&gt; every period to perform app drawing—this is its primary role. Understanding &lt;code&gt;Choreographer&lt;/code&gt; also helps developers grasp the principles of frame execution and deepens knowledge of Message, Handler, Looper, MessageQueue, Measure, Layout, and Draw.&lt;/p&gt;</summary>


    <category term="Android" scheme="https://androidperformance.com/en/categories/Android/"/>
    
    
    <category term="Android" scheme="https://androidperformance.com/en/tags/Android/"/>
    
    <category term="Systrace" scheme="https://androidperformance.com/en/tags/Systrace/"/>
    
    <category term="Startup" scheme="https://androidperformance.com/en/tags/Startup/"/>
    
    <category term="Jank" scheme="https://androidperformance.com/en/tags/Jank/"/>
    
    <category term="RenderThread" scheme="https://androidperformance.com/en/tags/RenderThread/"/>
    
  </entry>
  
  <entry>
    <title>Overview of Jank and Frame Drops in Android - Low Memory</title>
    <link href="https://androidperformance.com/en/2019/09/18/Android-Jank-Due-To-Low-Memory/"/>
    <id>https://androidperformance.com/en/2019/09/18/Android-Jank-Due-To-Low-Memory/</id>
    <published>2019-09-18T15:21:26.000Z</published>
    <updated>2026-05-10T23:29:51.056Z</updated>
    
    <content type="html"><![CDATA[<p>In the <a href="https://www.androidperformance.com/en/2019/09/05/Android-Jank-Due-To-System/">Overview of Jank and Frame Drops in Android - System Layer</a> article, we touched upon jank cases caused by low system memory. Since low memory has a significant impact on overall device performance, I’m dedicating this article to exploring those effects in depth.</p><p>As Android versions evolve and apps become more feature-heavy, their memory requirements increase. However, many devices with 4GB of RAM or less are still in use. These users are prone to low memory situations, especially after major system updates or as they install more apps.</p><p>Low memory triggers performance issues categorized by slow responsiveness and jank. Examples include longer app launch times, more frame drops in scrolling, more frequent cold starts as background processes are killed, and increased device temperature. Below, I’ll outline the causes, debugging methods, and potential optimizations for these issues.</p><span id="more"></span><ol start="0"><li><a href="https://www.androidperformance.com/en/2019/09/05/Android-Jank-Debug/">Overview of Jank and Frame Drops in Android - Methodology</a></li><li><a href="https://www.androidperformance.com/en/2019/09/05/Android-Jank-Due-To-System/">Overview of Jank and Frame Drops in Android - System Layer</a></li><li><a href="https://www.androidperformance.com/en/2019/09/05/Android-Jank-Due-To-App/">Overview of Jank and Frame Drops in Android - Application Layer</a></li><li><a href="https://www.androidperformance.com/en/2019/09/18/Android-Jank-Due-To-Low-Memory/">Overview of Jank and Frame Drops in Android - Low Memory</a></li></ol><h1 id="Identifying-Low-Memory"><a href="#Identifying-Low-Memory" class="headerlink" title="Identifying Low Memory"></a>Identifying Low Memory</h1><h2 id="Meminfo-Data"><a href="#Meminfo-Data" class="headerlink" title="Meminfo Data"></a>Meminfo Data</h2><p>The simplest way is using <code>dumpsys meminfo</code>:</p><figure class="highlight bash"><table><tr><td class="gutter"><pre><span class="line">1</span><br><span class="line">2</span><br><span class="line">3</span><br><span class="line">4</span><br><span class="line">5</span><br><span class="line">6</span><br></pre></td><td class="code"><pre><span class="line">adb shell dumpsys meminfo</span><br><span class="line">...</span><br><span class="line">Total RAM: 7,658,060K (status moderate)</span><br><span class="line"> Free RAM:   550,200K ...</span><br><span class="line"> Used RAM: 7,718,091K ...</span><br><span class="line"> ZRAM:     ...</span><br></pre></td></tr></table></figure><p>Signs of low memory:</p><ol><li><code>Free RAM</code> is very low, while <code>Used RAM</code> is very high.</li><li><code>ZRAM</code> usage is high (if enabled).</li></ol><h2 id="LMK-and-kswapd-Activity"><a href="#LMK-and-kswapd-Activity" class="headerlink" title="LMK and kswapd Activity"></a>LMK and kswapd Activity</h2><p>During low memory, the Low Memory Killer Daemon (LMKD) becomes active. You’ll see kill messages in the Kernel Log:</p><figure class="highlight bash"><table><tr><td class="gutter"><pre><span class="line">1</span><br><span class="line">2</span><br><span class="line">3</span><br></pre></td><td class="code"><pre><span class="line">[kswapd0] lowmemorykiller: Killing <span class="string">&#x27;u.mzsyncservice&#x27;</span> (15609) (tgid 15609), adj 906,</span><br><span class="line">to free 28864kB on behalf of <span class="string">&#x27;kswapd0&#x27;</span> ...</span><br><span class="line">cache 258652kB is below <span class="built_in">limit</span> 261272kB <span class="keyword">for</span> oom score 906</span><br></pre></td></tr></table></figure><p>This means <code>kswapd0</code> killed a process because memory fell below the threshold for an OOM score of 900.</p><h2 id="proc-meminfo"><a href="#proc-meminfo" class="headerlink" title="/proc/meminfo"></a><code>/proc/meminfo</code></h2><p>This is how the Linux kernel exposes memory stats. When memory is low, <code>MemFree</code> and <code>MemAvailable</code> will be minimal.</p><h1 id="System-wide-Lag-amp-Slow-Response"><a href="#System-wide-Lag-amp-Slow-Response" class="headerlink" title="System-wide Lag &amp; Slow Response"></a>System-wide Lag &amp; Slow Response</h1><p>When the system is in a low memory state, the entire device feels much more sluggish compared to normal memory conditions. Clicking on apps or launching applications will feel unresponsive or slow.</p><h1 id="Impact-of-Low-Memory-on-Performance"><a href="#Impact-of-Low-Memory-on-Performance" class="headerlink" title="Impact of Low Memory on Performance"></a>Impact of Low Memory on Performance</h1><h2 id="Main-Thread-I-x2F-O-Latency"><a href="#Main-Thread-I-x2F-O-Latency" class="headerlink" title="Main Thread I&#x2F;O Latency"></a>Main Thread I&#x2F;O Latency</h2><p>Low memory causes significant I&#x2F;O issues.</p><ol><li>In a Systrace, this appears as many yellow&#x2F;orange thread states: <code>Uninterruptible Sleep | WakeKill - Block I/O</code>.</li><li>Block sites usually look like: <code>wait_on_page_bit_killable+0x78/0x88</code>.</li></ol><p><strong>The Linux page cache chain sometimes contains pages that aren’t ready (content hasn’t been fully read from disk). If a user accesses such a page, it blocks on <code>wait_on_page_locked_killable</code>. Under heavy I&#x2F;O, these I&#x2F;O operations queue up, leading to long block durations.</strong></p><p>When I&#x2F;O is heavy, app operations involving disk access (loading views, reading files, configs, or odex files) trigger <code>Uninterruptible Sleep</code>, significantly slowing down the app.</p><p><img src="/en/images/15688217911224.jpg"></p><p><img src="/en/images/15688217985878.jpg"></p><h2 id="CPU-Contention"><a href="#CPU-Contention" class="headerlink" title="CPU Contention"></a>CPU Contention</h2><p>Low memory forces the Low Memory Killer to scan and kill processes frequently. <code>kswapd0</code> (a kernel worker thread) wakes up to perform memory reclamation. If memory sticks near low levels, <code>kswapd0</code> remains active, consuming CPU cycles and generating heat.</p><p>If <code>kswapd0</code> or <code>HeapTaskDaemon</code> (which handles JVM memory operations) hogs a big core (e.g., CPU 7), the foreground app’s main thread might compete for that core, leading to missed Vsync.</p><p><code>HeapTaskDaemon</code> also typically runs at high frequency during low memory conditions.</p><p><img src="/en/images/15688218269079.jpg">, performing memory-related operations.</p><h2 id="Process-Death-Restart-Cycles"><a href="#Process-Death-Restart-Cycles" class="headerlink" title="Process Death-Restart Cycles"></a>Process Death-Restart Cycles</h2><p>As LMK kills “Cached” processes, their parent processes or other apps often immediately restart them, leading to a “death-restart” cycle. This puts immense strain on CPU, Memory, and I&#x2F;O.</p><p>For example, below is the result after a Monkey test, where QQ is frequently killed and restarted in a short period:</p><figure class="highlight plaintext"><table><tr><td class="gutter"><pre><span class="line">1</span><br><span class="line">2</span><br><span class="line">3</span><br><span class="line">4</span><br><span class="line">5</span><br><span class="line">6</span><br><span class="line">7</span><br><span class="line">8</span><br><span class="line">9</span><br><span class="line">10</span><br><span class="line">11</span><br><span class="line">12</span><br><span class="line">13</span><br><span class="line">14</span><br><span class="line">15</span><br><span class="line">16</span><br><span class="line">17</span><br><span class="line">18</span><br><span class="line">19</span><br><span class="line">20</span><br><span class="line">21</span><br><span class="line">22</span><br><span class="line">23</span><br><span class="line">24</span><br><span class="line">25</span><br><span class="line">26</span><br><span class="line">27</span><br><span class="line">28</span><br><span class="line">29</span><br><span class="line">30</span><br><span class="line">31</span><br><span class="line">32</span><br><span class="line">33</span><br><span class="line">34</span><br><span class="line">35</span><br><span class="line">36</span><br></pre></td><td class="code"><pre><span class="line">07-23 14:32:16.932  1435  1510 I am_proc_start: [0,30387,10145,com.tencent.mobileqq,restart,com.tencent.mobileqq]</span><br><span class="line">07-23 14:32:16.969  1435  3420 I am_proc_bound: [0,30387,com.tencent.mobileqq]</span><br><span class="line">07-23 14:32:16.979  1435  3420 I am_kill : [0,30387,com.tencent.mobileqq,901,empty #3]</span><br><span class="line">07-23 14:32:16.996  1435  3420 I am_proc_died: [0,30387,com.tencent.mobileqq,901,18]</span><br><span class="line">07-23 14:32:17.028  1435  1510 I am_proc_start: [0,30400,10145,com.tencent.mobileqq,restart,com.tencent.mobileqq]</span><br><span class="line">07-23 14:32:17.054  1435  3420 I am_proc_bound: [0,30400,com.tencent.mobileqq]</span><br><span class="line">07-23 14:32:17.064  1435  3420 I am_kill : [0,30400,com.tencent.mobileqq,901,empty #3]</span><br><span class="line">07-23 14:32:17.082  1435  3420 I am_proc_died: [0,30400,com.tencent.mobileqq,901,18]</span><br><span class="line">07-23 14:32:17.114  1435  1510 I am_proc_start: [0,30413,10145,com.tencent.mobileqq,restart,com.tencent.mobileqq]</span><br><span class="line">07-23 14:32:17.139  1435  3420 I am_proc_bound: [0,30413,com.tencent.mobileqq]</span><br><span class="line">07-23 14:32:17.149  1435  3420 I am_kill : [0,30413,com.tencent.mobileqq,901,empty #3]</span><br><span class="line">07-23 14:32:17.166  1435  3420 I am_proc_died: [0,30413,com.tencent.mobileqq,901,18]</span><br><span class="line">07-23 14:32:17.202  1435  1510 I am_proc_start: [0,30427,10145,com.tencent.mobileqq,restart,com.tencent.mobileqq]</span><br><span class="line">07-23 14:32:17.216  1435  3420 I am_proc_bound: [0,30427,com.tencent.mobileqq]</span><br><span class="line">07-23 14:32:17.226  1435  3420 I am_kill : [0,30427,com.tencent.mobileqq,901,empty #3]</span><br><span class="line">07-23 14:32:17.249  1435  3420 I am_proc_died: [0,30427,com.tencent.mobileqq,901,18]</span><br><span class="line">07-23 14:32:17.278  1435  1510 I am_proc_start: [0,30440,10145,com.tencent.mobileqq,restart,com.tencent.mobileqq]</span><br><span class="line">07-23 14:32:17.299  1435  3420 I am_proc_bound: [0,30440,com.tencent.mobileqq]</span><br><span class="line">07-23 14:32:17.309  1435  3420 I am_kill : [0,30440,com.tencent.mobileqq,901,empty #3]</span><br><span class="line">07-23 14:32:17.329  1435  2116 I am_proc_died: [0,30440,com.tencent.mobileqq,901,18]</span><br><span class="line">07-23 14:32:17.362  1435  1510 I am_proc_start: [0,30453,10145,com.tencent.mobileqq,restart,com.tencent.mobileqq]</span><br><span class="line">07-23 14:32:17.387  1435  2116 I am_proc_bound: [0,30453,com.tencent.mobileqq]</span><br><span class="line">07-23 14:32:17.398  1435  2116 I am_kill : [0,30453,com.tencent.mobileqq,901,empty #3]</span><br><span class="line">07-23 14:32:17.420  1435  2116 I am_proc_died: [0,30453,com.tencent.mobileqq,901,18]</span><br><span class="line">07-23 14:32:17.447  1435  1510 I am_proc_start: [0,30466,10145,com.tencent.mobileqq,restart,com.tencent.mobileqq]</span><br><span class="line">07-23 14:32:17.474  1435  2116 I am_proc_bound: [0,30466,com.tencent.mobileqq]</span><br><span class="line">07-23 14:32:17.484  1435  2116 I am_kill : [0,30466,com.tencent.mobileqq,901,empty #3]</span><br><span class="line">07-23 14:32:17.507  1435  2116 I am_proc_died: [0,30466,com.tencent.mobileqq,901,18]</span><br><span class="line">07-23 14:32:17.533  1435  1510 I am_proc_start: [0,30479,10145,com.tencent.mobileqq,restart,com.tencent.mobileqq]</span><br><span class="line">07-23 14:32:17.556  1435  2116 I am_proc_bound: [0,30479,com.tencent.mobileqq]</span><br><span class="line">07-23 14:32:17.566  1435  2116 I am_kill : [0,30479,com.tencent.mobileqq,901,empty #3]</span><br><span class="line">07-23 14:32:17.587  1435  2116 I am_proc_died: [0,30479,com.tencent.mobileqq,901,18]</span><br><span class="line">07-23 14:32:17.613  1435  1510 I am_proc_start: [0,30492,10145,com.tencent.mobileqq,restart,com.tencent.mobileqq]</span><br><span class="line">07-23 14:32:17.636  1435  2116 I am_proc_bound: [0,30492,com.tencent.mobileqq]</span><br><span class="line">07-23 14:32:17.646  1435  2116 I am_kill : [0,30492,com.tencent.mobileqq,901,empty #3]</span><br><span class="line">07-23 14:32:17.667  1435  2116 I am_proc_died: [0,30492,com.tencent.mobileqq,901,18]</span><br></pre></td></tr></table></figure><p>The corresponding Systrace - SystemServer shows AM (Activity Manager) frequently killing and restarting QQ:<br><img src="/en/images/15688220198874.jpg"></p><p>The Kernel section of this trace also shows busy CPU activity:<br><img src="/en/images/15688220915505.jpg"></p><h2 id="Memory-Reclamation-and-I-x2F-O-Triggers"><a href="#Memory-Reclamation-and-I-x2F-O-Triggers" class="headerlink" title="Memory Reclamation and I&#x2F;O Triggers"></a>Memory Reclamation and I&#x2F;O Triggers</h2><p>When operations slow down over time, it’s often due to memory reclamation (Fast Path, kswapd, Direct Reclaim, LMK).</p><ul><li>Reclaiming anonymous pages involves swapping them out.</li><li>Reclaiming file-backed pages involves writing back and clearing them.<br>Both actions, especially those involving files, increase the probability of block I&#x2F;O.</li></ul><p>A common scenario: reopening a recent app feels slow because of a <code>do_page_fault</code>. If the memory was swapped out, it must be swapped in. If it was a regular file, it must be read into the page cache from disk.</p><p><code>do_page_fault</code> → <code>lock_page_or_retry</code> → <code>wait_on_page_bit_killable</code> checks if the page has the <code>PG_locked</code> flag set. If set, it blocks until <code>PG_locked</code> is cleared. The <code>PG_locked</code> flag is cleared only when writeback starts or I&#x2F;O read completes. The readahead to pagecache functionality also affects block I&#x2F;O - if too large, it increases blocking probability.</p><h1 id="Case-Study-App-Startup-Under-Low-Memory"><a href="#Case-Study-App-Startup-Under-Low-Memory" class="headerlink" title="Case Study: App Startup Under Low Memory"></a>Case Study: App Startup Under Low Memory</h1><p>Below is a trace of an app’s cold start under low memory, from <code>bindApplication</code> to the first frame (total 2s).</p><h2 id="Low-Memory-Startup"><a href="#Low-Memory-Startup" class="headerlink" title="Low Memory Startup"></a>Low Memory Startup</h2><ul><li>Total time: 2s.</li><li><code>Uninterruptible Sleep</code> (I&#x2F;O block) took ~750ms (vs ~130ms normally).</li><li><code>Running</code> time was ~600ms (similar to normal).</li><li>CPU activity: Many <code>kworker</code> and <code>kswapd0</code> threads were active alongside the app.</li></ul><h2 id="Normal-Memory-Startup"><a href="#Normal-Memory-Startup" class="headerlink" title="Normal Memory Startup"></a>Normal Memory Startup</h2><ul><li>Total time: 1.22s.</li><li><code>Uninterruptible Sleep</code> totaled only 130ms.</li><li>CPU activity: Very few memory&#x2F;IO-related threads beyond <code>HeapTaskDaemon</code>.</li></ul><p><img src="/en/images/15688228638217.jpg"></p><p>Looking at CPU usage during this period, besides <code>HeapTaskDaemon</code> running more frequently, very few other memory and I&#x2F;O related processes are active.</p><p><img src="/en/images/15688228721814.jpg"></p><h1 id="Optimization-Strategies"><a href="#Optimization-Strategies" class="headerlink" title="Optimization Strategies"></a>Optimization Strategies</h1><p>Optimizing for low memory requires balancing system control and user experience. Managing third-party apps—many of which use aggressive keep-alive and background services—is crucial.</p><ol><li><strong>Tune <code>extra_free_kbytes</code></strong>: Increase the threshold for memory reclamation.</li><li><strong>Increase Disk I&#x2F;O Speeds</strong>: Use UFS 3.0 or better storage hardware.</li><li><strong>Optimize <code>read_ahead_kb</code></strong>: Avoid excessively high values that increase block probability.</li><li><strong>Cgroup blkio</strong>: Use cgroups to limit background I&#x2F;O, prioritizing foreground responsiveness.</li><li><strong>Proactive Reclamation</strong>: Reclaim memory before the user interacts with the app.</li><li><strong>LMK Efficiency</strong>: Ensure LMK kills the most effective targets to avoid “death-restart” loops.</li><li><strong>Refine <code>swappiness</code></strong>: Balance anonymous page swapping vs. file cache clearing.</li><li><strong>OEM Policies</strong>: Implement more aggressive process management on low-RAM devices.</li><li><strong>User Education</strong>: Suggest restarting the phone or clearing background apps when memory is critically low.</li><li><strong>Strategy</strong>: Alert users (or not alert users) to kill unnecessary background processes when memory is insufficient</li><li><strong>Strategy</strong>: Prompt users to restart the phone when memory is severely insufficient and cannot recover</li></ol><h1 id="References"><a href="#References" class="headerlink" title="References"></a>References</h1><ol><li><a href="https://blog.csdn.net/qkhhyga2016/article/details/79540119">https://blog.csdn.net/qkhhyga2016/article/details/79540119</a></li><li><a href="https://blog.csdn.net/zsj100213/article/details/82427527">https://blog.csdn.net/zsj100213/article/details/82427527</a></li></ol><h1 id="About-Me-amp-amp-Blog"><a href="#About-Me-amp-amp-Blog" class="headerlink" title="About Me &amp;&amp; Blog"></a>About Me &amp;&amp; Blog</h1><p>Below are personal introductions and related links. Looking forward to exchanging ideas with fellow professionals - when three people walk together, one must be my teacher!</p><ol><li><strong><a href="https://www.androidperformance.com/about/">Blogger’s Personal Introduction</a></strong>: Contains personal WeChat and WeChat group links.</li><li><strong><a href="https://androidperformance.com/2019/12/01/BlogMap/">Blog Content Navigation</a></strong>: A navigation of personal blog content.</li><li><strong><a href="https://androidperformance.com/2018/05/07/Android-performance-optimization-skills-and-tools/">Personally Organized and Collected Excellent Blog Articles - Android Performance Optimization Must-Knows</a></strong>: Welcome self-recommendations and recommendations (private WeChat chat is fine)</li><li><strong><a href="https://www.androidperformance.com/2023/12/30/the-performance/">Android Performance Optimization Knowledge Planet</a></strong>: Welcome to join, thank you for your support!</li></ol><blockquote><p><strong>One person can walk faster, but a group of people can walk farther</strong></p></blockquote><p><img src="/en/images/WechatIMG581.webp" alt="WeChat Scan QR Code"></p>]]></content>
    
    
    <summary type="html">&lt;p&gt;In the &lt;a href=&quot;https://www.androidperformance.com/en/2019/09/05/Android-Jank-Due-To-System/&quot;&gt;Overview of Jank and Frame Drops in Android - System Layer&lt;/a&gt; article, we touched upon jank cases caused by low system memory. Since low memory has a significant impact on overall device performance, I’m dedicating this article to exploring those effects in depth.&lt;/p&gt;
&lt;p&gt;As Android versions evolve and apps become more feature-heavy, their memory requirements increase. However, many devices with 4GB of RAM or less are still in use. These users are prone to low memory situations, especially after major system updates or as they install more apps.&lt;/p&gt;
&lt;p&gt;Low memory triggers performance issues categorized by slow responsiveness and jank. Examples include longer app launch times, more frame drops in scrolling, more frequent cold starts as background processes are killed, and increased device temperature. Below, I’ll outline the causes, debugging methods, and potential optimizations for these issues.&lt;/p&gt;</summary>


    <category term="Android" scheme="https://androidperformance.com/en/categories/Android/"/>
    
    
    <category term="Android" scheme="https://androidperformance.com/en/tags/Android/"/>
    
    <category term="Startup" scheme="https://androidperformance.com/en/tags/Startup/"/>
    
    <category term="Jank" scheme="https://androidperformance.com/en/tags/Jank/"/>
    
    <category term="Memory" scheme="https://androidperformance.com/en/tags/Memory/"/>
    
    <category term="Linux" scheme="https://androidperformance.com/en/tags/Linux/"/>
    
  </entry>
  
  <entry>
    <title>Case Study: Debugging the Android Launcher Kill Problem</title>
    <link href="https://androidperformance.com/en/2019/09/17/Android-Kill-Background-App-Debug/"/>
    <id>https://androidperformance.com/en/2019/09/17/Android-Kill-Background-App-Debug/</id>
    <published>2019-09-17T10:58:11.000Z</published>
    <updated>2026-05-10T23:29:51.056Z</updated>
    
    <content type="html"><![CDATA[<p>This article was inspired by a real-world bug I encountered. While the issue itself wasn’t particularly “hard,” the analysis process—the tools used, the investigative logic, and some clever tips I learned from a colleague—made it a perfect candidate for a case study.</p><p>I’ve used a variety of tools mentioned in my <a href="https://www.androidperformance.com/en/2019/09/05/Android-Jank-Debug/">Android Performance Optimization Methodology</a>, including:</p><ul><li>Reproduction Video</li><li>Event Log</li><li>AS Source&#x2F;Debug</li><li>AS Profiler</li><li>Systrace</li><li>Dumpsys</li><li>Unix <code>ps</code> utility</li></ul><p>My goal is to document this process for myself and to share a universal troubleshooting workflow that might help others. If you have your own debugging tips, feel free to join our discussion group!</p><span id="more"></span><h1 id="The-Phenomenon"><a href="#The-Phenomenon" class="headerlink" title="The Phenomenon"></a>The Phenomenon</h1><p>Testing reported a classic performance bug: <strong>“Slow loading of icons when returning to the home screen.”</strong> They provided a video, logs, and a Systrace.</p><h1 id="The-Analysis"><a href="#The-Analysis" class="headerlink" title="The Analysis"></a>The Analysis</h1><h2 id="1-Zeroing-in-on-the-Time"><a href="#1-Zeroing-in-on-the-Time" class="headerlink" title="1. Zeroing in on the Time"></a>1. Zeroing in on the Time</h2><ol><li><strong>Reproduction Video</strong>: I watched the video to find the exact minute the issue occurred.</li><li><strong>Event Log</strong>: I cross-referenced the video time with the Event Log to find the precise second.</li><li><strong>Operation Reconstruction</strong>: By reading the Event and Main logs, I reconstructed the user’s actions. Every time the app <code>com.jx.cmcc.ict.ibelieve</code> was launched, the Launcher was killed.</li></ol><figure class="highlight plaintext"><table><tr><td class="gutter"><pre><span class="line">1</span><br><span class="line">2</span><br><span class="line">3</span><br><span class="line">4</span><br><span class="line">5</span><br><span class="line">6</span><br><span class="line">7</span><br><span class="line">8</span><br><span class="line">9</span><br><span class="line">10</span><br><span class="line">11</span><br><span class="line">12</span><br><span class="line">13</span><br></pre></td><td class="code"><pre><span class="line">EventLog Snippet:</span><br><span class="line">// App Launch: com.jx.cmcc.ict.ibelieve</span><br><span class="line">09-10 10:14:48.877 ... I am_set_resumed_activity: [0,com.jx.cmcc.ict.ibelieve/.ui.MainTabActivity,...]</span><br><span class="line"></span><br><span class="line">// LAUNCHER IS KILLED HERE</span><br><span class="line">09-10 10:14:48.903 ... I am_kill : [0,13509,com.meizu.flyme.launcher,600,kill background]</span><br><span class="line"></span><br><span class="line">// Returning to Launcher</span><br><span class="line">09-10 10:14:51.990 ... I am_pause_activity: [0, ...MainTabActivity]</span><br><span class="line"></span><br><span class="line">// Re-creating Launcher Process</span><br><span class="line">09-10 10:14:52.025 ... I am_proc_start: [0,14013,10021,com.meizu.flyme.launcher,activity,...]</span><br><span class="line">09-10 10:14:52.437 ... I am_activity_launch_time: [0, ...Launcher,413,413]</span><br></pre></td></tr></table></figure><p><strong>Initial Conclusion</strong>: The “slow loading” reported by testing is because the <strong>Launcher process was killed in the background</strong>. When the user returns to the home screen, the Launcher has to perform a cold start. While the log says 413ms for the Activity launch, the total time until icons appear is much longer (~2s) because it has to reload all content from the database.</p><h2 id="2-Investigating-the-Kill-Reason"><a href="#2-Investigating-the-Kill-Reason" class="headerlink" title="2. Investigating the Kill Reason"></a>2. Investigating the Kill Reason</h2><p>The log says: <code>am_kill : [..., kill background]</code>.<br>In the AOSP source code, <code>kill background</code> as a reason is issued specifically in <code>AMS.killBackgroundProcesses</code>.</p><figure class="highlight java"><table><tr><td class="gutter"><pre><span class="line">1</span><br><span class="line">2</span><br><span class="line">3</span><br><span class="line">4</span><br><span class="line">5</span><br><span class="line">6</span><br><span class="line">7</span><br></pre></td><td class="code"><pre><span class="line"><span class="comment">// ActivityManagerService.java</span></span><br><span class="line"><span class="keyword">public</span> <span class="keyword">void</span> <span class="title function_">killBackgroundProcesses</span><span class="params">(<span class="keyword">final</span> String packageName, <span class="type">int</span> userId)</span> &#123;</span><br><span class="line">    <span class="keyword">synchronized</span> (<span class="built_in">this</span>) &#123;</span><br><span class="line">        killPackageProcessesLocked(packageName, appId, targetUserId,</span><br><span class="line">                ProcessList.SERVICE_ADJ, <span class="literal">false</span>, <span class="literal">true</span>, <span class="literal">true</span>, <span class="literal">false</span>, <span class="string">&quot;kill background&quot;</span>);</span><br><span class="line">    &#125;</span><br><span class="line">&#125;</span><br></pre></td></tr></table></figure><p>This method is exposed to third-party apps via <code>ActivityManager.killBackgroundProcesses(packageName)</code>.</p><h2 id="3-Debugging-SystemServer"><a href="#3-Debugging-SystemServer" class="headerlink" title="3. Debugging SystemServer"></a>3. Debugging SystemServer</h2><p>We need to catch which app is calling this method. I set a breakpoint in <code>ActivityManagerService.killBackgroundProcesses</code> inside the <code>system_process</code> process.</p><ol><li>Attach the debugger to <code>system_process</code>.</li><li>Launch the suspicious app.</li><li>The breakpoint hits! I use the expression evaluator to find the caller PID: <code>getRealCallingPid()</code>.<ul><li><strong>Result</strong>: 29771.</li></ul></li><li>Checking <code>ps -A | grep 29771</code>: It’s <code>com.jx.cmcc.ict.ibelieve</code>.</li></ol><h2 id="4-Debugging-the-App"><a href="#4-Debugging-the-App" class="headerlink" title="4. Debugging the App"></a>4. Debugging the App</h2><p>To confirm, I attached a debugger to the app process itself. Since I don’t have its source, I placed a breakpoint in the public SDK method <code>android.app.ActivityManager.killBackgroundProcesses</code>.</p><p>Every time I log into the app and go back to the home screen, the breakpoint hits. The app is actively killing the background environment.</p><h2 id="5-Identifying-the-Root-Code-using-AS-Profiler"><a href="#5-Identifying-the-Root-Code-using-AS-Profiler" class="headerlink" title="5. Identifying the Root Code using AS Profiler"></a>5. Identifying the Root Code using AS Profiler</h2><p>Using the <strong>Android Studio Profiler</strong> (CPU -&gt; Trace Java Methods), I recorded a trace while the app was running. After stopping the record, I searched the call stack for <code>killBackgroundProcesses</code>.</p><p>The trace showed that inside its <code>loadComplete</code> callback, the app explicitly calls its own <code>killBackground</code> utility method. (This is where the app developer would go to fix the bug).</p><h2 id="6-Permission-Analysis"><a href="#6-Permission-Analysis" class="headerlink" title="6. Permission Analysis"></a>6. Permission Analysis</h2><p><code>killBackgroundProcesses</code> requires the <code>Manifest.permission.KILL_BACKGROUND_PROCESSES</code> permission.<br>Checking <code>dumpsys package com.jx.cmcc.ict.ibelieve</code>:</p><figure class="highlight plaintext"><table><tr><td class="gutter"><pre><span class="line">1</span><br><span class="line">2</span><br></pre></td><td class="code"><pre><span class="line">install permissions:</span><br><span class="line">  android.permission.KILL_BACKGROUND_PROCESSES: granted=true</span><br></pre></td></tr></table></figure><p>This is a <strong>“normal”</strong> level permission. This means any app can request it in the manifest and the system will grant it automatically without a user prompt. In this case, a developer used it—either accidentally or over-zealously—to “clean up” memory, but accidentally nuked the launcher in the process.</p><h2 id="7-Can-Systrace-find-the-Culprit"><a href="#7-Can-Systrace-find-the-Culprit" class="headerlink" title="7. Can Systrace find the Culprit?"></a>7. Can Systrace find the Culprit?</h2><p>Yes. If you trace the <code>killProcessGroup</code> event in the <code>system_server</code> process, you can look for the “Waking From” thread.</p><ol><li>Find <code>killProcessGroup</code> in <code>system_server</code>.</li><li>Follow the wakeup chain back.</li><li>It leads back to a Binder thread in <code>system_server</code>, which was triggered by the main thread of PID 7289 (<code>com.jx.cmcc.ict.ibelieve</code>).</li></ol><h1 id="Conclusion"><a href="#Conclusion" class="headerlink" title="Conclusion"></a>Conclusion</h1><p>This issue was caused by an app requesting a powerful permission and using it incorrectly. It shows that even a “simple” app can severely degrade the OS experience if it plays loose with system-level APIs.</p><p>Interestingly, Google allows the <code>KILL_BACKGROUND_PROCESSES</code> permission at the “normal” level. Given it affects the lifecycle of other apps, one might argue it should be a more restricted permission.</p><hr><h1 id="About-Me-amp-amp-Blog"><a href="#About-Me-amp-amp-Blog" class="headerlink" title="About Me &amp;&amp; Blog"></a>About Me &amp;&amp; Blog</h1><p>(Links and introduction)</p>]]></content>
    
    
    <summary type="html">&lt;p&gt;This article was inspired by a real-world bug I encountered. While the issue itself wasn’t particularly “hard,” the analysis process—the tools used, the investigative logic, and some clever tips I learned from a colleague—made it a perfect candidate for a case study.&lt;/p&gt;
&lt;p&gt;I’ve used a variety of tools mentioned in my &lt;a href=&quot;https://www.androidperformance.com/en/2019/09/05/Android-Jank-Debug/&quot;&gt;Android Performance Optimization Methodology&lt;/a&gt;, including:&lt;/p&gt;
&lt;ul&gt;
&lt;li&gt;Reproduction Video&lt;/li&gt;
&lt;li&gt;Event Log&lt;/li&gt;
&lt;li&gt;AS Source&amp;#x2F;Debug&lt;/li&gt;
&lt;li&gt;AS Profiler&lt;/li&gt;
&lt;li&gt;Systrace&lt;/li&gt;
&lt;li&gt;Dumpsys&lt;/li&gt;
&lt;li&gt;Unix &lt;code&gt;ps&lt;/code&gt; utility&lt;/li&gt;
&lt;/ul&gt;
&lt;p&gt;My goal is to document this process for myself and to share a universal troubleshooting workflow that might help others. If you have your own debugging tips, feel free to join our discussion group!&lt;/p&gt;</summary>


    <category term="Android" scheme="https://androidperformance.com/en/categories/Android/"/>
    
    
    <category term="Android" scheme="https://androidperformance.com/en/tags/Android/"/>
    
    <category term="Systrace" scheme="https://androidperformance.com/en/tags/Systrace/"/>
    
    <category term="Startup" scheme="https://androidperformance.com/en/tags/Startup/"/>
    
    <category term="Jank" scheme="https://androidperformance.com/en/tags/Jank/"/>
    
    <category term="Memory" scheme="https://androidperformance.com/en/tags/Memory/"/>
    
  </entry>
  
  <entry>
    <title>Overview of Jank and Frame Drops in Android - Application Layer</title>
    <link href="https://androidperformance.com/en/2019/09/05/Android-Jank-Due-To-App/"/>
    <id>https://androidperformance.com/en/2019/09/05/Android-Jank-Due-To-App/</id>
    <published>2019-09-05T12:35:42.000Z</published>
    <updated>2026-05-10T23:29:51.056Z</updated>
    
    <content type="html"><![CDATA[<p>In the <a href="https://www.androidperformance.com/en/2019/09/05/Android-Jank-Due-To-System/">Overview of Jank and Frame Drops in Android - System Layer</a> article, we listed causes of jank originating from the system. In this article, we focus on causes stemming from the App itself. When you encounter lag, before blaming the phone manufacturer, consider if it’s the App’s own inefficiency.</p><span id="more"></span><p>Jank issues are a top priority for both phone manufacturers and app developers, often handled by dedicated “Performance” or “Stability” teams. Third-party tools like Tencent’s Matrix are excellent, but manufacturers often have proprietary solutions with deeper system access through source code modification.</p><p>Smoothness refers to frame drops. If the screen fails to refresh at 60 FPS (or the target refresh rate) and only hits 55, the user perceives this as jank. Frame rate fluctuations are especially noticeable.</p><p>This series includes:<br>0. <a href="https://www.androidperformance.com/en/2019/09/05/Android-Jank-Debug/">Overview of Jank and Frame Drops in Android - Methodology</a></p><ol><li><a href="https://www.androidperformance.com/en/2019/09/05/Android-Jank-Due-To-System/">Overview of Jank and Frame Drops in Android - System Layer</a></li><li><a href="https://www.androidperformance.com/en/2019/09/05/Android-Jank-Due-To-App/">Overview of Jank and Frame Drops in Android - Application Layer</a></li><li><a href="https://www.androidperformance.com/en/2019/09/18/Android-Jank-Due-To-Low-Memory/">Overview of Jank and Frame Drops in Android - Low Memory</a></li></ol><h1 id="Application-Side-Performance-Issues"><a href="#Application-Side-Performance-Issues" class="headerlink" title="Application-Side Performance Issues"></a>Application-Side Performance Issues</h1><p>As noted in the system-layer article, many of these cases can be identified using Systrace. If you’re unfamiliar, see the <a href="https://www.androidperformance.com/en/2019/05/26/Android_Systrace_0/">Systrace Series</a>. Systrace provides a global view of the system’s operating state.</p><h2 id="1-App-Main-Thread-Execution-Overhead"><a href="#1-App-Main-Thread-Execution-Overhead" class="headerlink" title="1. App Main Thread Execution Overhead"></a>1. App Main Thread Execution Overhead</h2><p>Operations like Input processing, Animation execution, Measure, Layout, Draw, and <code>decodeBitmap</code> on the main thread can cause jank if they exceed the frame budget.</p><h3 id="Measure-x2F-Layout-Overhead"><a href="#Measure-x2F-Layout-Overhead" class="headerlink" title="Measure &#x2F; Layout Overhead"></a>Measure &#x2F; Layout Overhead</h3><p>If the view hierarchy is too complex, <code>onMeasure</code> and <code>onLayout</code> can take a significant amount of time, delaying the frame.</p><h3 id="Draw-Overhead"><a href="#Draw-Overhead" class="headerlink" title="Draw Overhead"></a>Draw Overhead</h3><p>Complex custom drawing or heavy canvas operations contribute to main thread latency.</p><h3 id="Animation-Callback-Overhead"><a href="#Animation-Callback-Overhead" class="headerlink" title="Animation Callback Overhead"></a>Animation Callback Overhead</h3><p>Long-running logic within <code>Animation</code> callbacks or <code>Choreographer</code> frames will delay the start of the rendering pipeline.</p><h3 id="View-Initialization-Overhead-PlayStore-Example"><a href="#View-Initialization-Overhead-PlayStore-Example" class="headerlink" title="View Initialization Overhead (PlayStore Example)"></a>View Initialization Overhead (PlayStore Example)</h3><p>Inflating complex XML layouts on the main thread is a common source of jank during navigation.</p><h3 id="List-Item-Initialization-Overhead-WeChat-Example"><a href="#List-Item-Initialization-Overhead-WeChat-Example" class="headerlink" title="List Item Initialization Overhead (WeChat Example)"></a>List Item Initialization Overhead (WeChat Example)</h3><p>Inefficient <code>getView</code> or <code>onBindViewHolder</code> implementations in lists lead to stutter during scrolling.</p><h3 id="decodeBitmap-Overhead"><a href="#decodeBitmap-Overhead" class="headerlink" title="decodeBitmap Overhead"></a>decodeBitmap Overhead</h3><p>Decoding large images on the main thread is a classic performance anti-pattern.</p><h2 id="2-uploadBitmap-Overhead"><a href="#2-uploadBitmap-Overhead" class="headerlink" title="2. uploadBitmap Overhead"></a>2. uploadBitmap Overhead</h2><p>This refers to uploading a bitmap to the GPU (texture upload). Large bitmaps or textures that change every frame increase RenderThread workload significantly.</p><h2 id="3-BuildDrawingCache-Overhead"><a href="#3-BuildDrawingCache-Overhead" class="headerlink" title="3. BuildDrawingCache Overhead"></a>3. BuildDrawingCache Overhead</h2><p>Frequent calls to <code>buildDrawingCache</code> can cause the main thread to exceed the Vsync period. WeChat’s dynamic stickers sometimes suffer from this.</p><h2 id="4-Software-Rendering-vs-Hardware-Rendering"><a href="#4-Software-Rendering-vs-Hardware-Rendering" class="headerlink" title="4. Software Rendering vs. Hardware Rendering"></a>4. Software Rendering vs. Hardware Rendering</h2><p>If an Activity explicitly disables hardware acceleration, drawing falls back to Skia on the CPU. This significantly increases UI Thread load and almost always results in lag. For more, see <a href="https://www.androidperformance.com/en/2019/07/27/Android-Hardware-Layer/">Detailed Explanation of Hardware Layer in Android</a>.</p><h2 id="5-Main-Thread-Binder-Latency"><a href="#5-Main-Thread-Binder-Latency" class="headerlink" title="5. Main Thread Binder Latency"></a>5. Main Thread Binder Latency</h2><p>During Activity Resume, communicating with AMS requires the AMS lock. If the background is busy, waiting for this lock can cause delays, especially during multi-tasking gestures.</p><h2 id="6-Uneven-Game-Content-Drawing-SurfaceView"><a href="#6-Uneven-Game-Content-Drawing-SurfaceView" class="headerlink" title="6. Uneven Game Content Drawing (SurfaceView)"></a>6. Uneven Game Content Drawing (SurfaceView)</h2><p>In games, even if SF is ready, the game engine might deliver frames unevenly. If a game frame misses the SF Vsync window, it will be dropped.</p><h2 id="7-WebView-Inefficiency"><a href="#7-WebView-Inefficiency" class="headerlink" title="7. WebView Inefficiency"></a>7. WebView Inefficiency</h2><p>Complex web pages in a WebView often exhibit poor performance since the WebView’s rendering can be heavier than native components.</p><h2 id="8-Refresh-Rate-Mismatch"><a href="#8-Refresh-Rate-Mismatch" class="headerlink" title="8. Refresh Rate Mismatch"></a>8. Refresh Rate Mismatch</h2><p>A mismatch between the screen’s refresh rate and the content’s FPS can cause a lack of fluidity, such as 60 FPS animations on a 90 Hz screen.</p><h2 id="9-Incompatibility-with-High-Refresh-Rates"><a href="#9-Incompatibility-with-High-Refresh-Rates" class="headerlink" title="9. Incompatibility with High Refresh Rates"></a>9. Incompatibility with High Refresh Rates</h2><p>Apps designed for 60 FPS machines (16.6ms budget) might struggle on 90 Hz or 120 Hz screens (11.1ms or 8.3ms budget). If drawing takes 14ms, it’s fine for 60Hz but will stutter on 90Hz.</p><h2 id="10-Main-Thread-I-x2F-O-Operations"><a href="#10-Main-Thread-I-x2F-O-Operations" class="headerlink" title="10. Main Thread I&#x2F;O Operations"></a>10. Main Thread I&#x2F;O Operations</h2><p>Classic issues include performing database queries or using <code>SharedPreferences.commit()</code> (which is synchronous) instead of <code>apply()</code> on the main thread.</p><h2 id="11-WebView-x2F-Main-Thread-Interaction"><a href="#11-WebView-x2F-Main-Thread-Interaction" class="headerlink" title="11. WebView&#x2F;Main Thread Interaction"></a>11. WebView&#x2F;Main Thread Interaction</h2><p>Synchronization issues or heavy JS-to-Native bridges between a WebView and the main thread can cause freezing.</p><h2 id="12-RenderThread-Overhead"><a href="#12-RenderThread-Overhead" class="headerlink" title="12. RenderThread Overhead"></a>12. RenderThread Overhead</h2><p>If the <code>RenderThread</code> itself is overloaded (too many GPU commands), the total frame time will exceed the Vsync interval. This also blocks the main thread’s next <code>sync</code> operation.</p><h2 id="13-Multiple-RenderThreads-Synchronization"><a href="#13-Multiple-RenderThreads-Synchronization" class="headerlink" title="13. Multiple RenderThreads Synchronization"></a>13. Multiple RenderThreads Synchronization</h2><p>Some apps spawn multiple <code>RenderThreads</code>. Synchronizing these threads can sometimes incur significant overhead, blocking the main thread.</p><h1 id="Summary"><a href="#Summary" class="headerlink" title="Summary"></a>Summary</h1><p>Android is an evolving platform, but its openness means app quality varies wildly. Unlike the tightly controlled App Store, Android apps come from many sources with varying levels of quality control.</p><p>Large companies usually prioritize performance, but feature bloat (like WeChat’s memory footprint or QQ’s increasing complexity) still leads to issues. Smaller devs might lack the resources for deep optimization. Furthermore, “black tech” tactics like aggressive keep-alive, mutual wake-ups, and heavy background tasks degrade the overall user experience.</p><p>When we find app-specific performance flaws that persist across different hardware, we often reach out to the developers to collaborate on a fix.</p><p>For more details on what OEMs do, see: <a href="https://www.zhihu.com/question/335226118/answer/751587534">What do phone manufacturers actually do when they say they are optimizing Android?</a></p><p>This series includes:<br>0. <a href="https://www.androidperformance.com/en/2019/09/05/Android-Jank-Debug/">Overview of Jank and Frame Drops in Android - Methodology</a></p><ol><li><a href="https://www.androidperformance.com/en/2019/09/05/Android-Jank-Due-To-System/">Overview of Jank and Frame Drops in Android - System Layer</a></li><li><a href="https://www.androidperformance.com/en/2019/09/05/Android-Jank-Due-To-App/">Overview of Jank and Frame Drops in Android - Application Layer</a></li><li><a href="https://www.androidperformance.com/en/2019/12/01/Android-Jank-Due-To-Low-Memory/">Overview of Jank and Frame Drops in Android - Low Memory</a></li></ol><h1 id="About-Me-amp-amp-Blog"><a href="#About-Me-amp-amp-Blog" class="headerlink" title="About Me &amp;&amp; Blog"></a>About Me &amp;&amp; Blog</h1><p>(Links and introduction)</p>]]></content>
    
    
    <summary type="html">&lt;p&gt;In the &lt;a href=&quot;https://www.androidperformance.com/en/2019/09/05/Android-Jank-Due-To-System/&quot;&gt;Overview of Jank and Frame Drops in Android - System Layer&lt;/a&gt; article, we listed causes of jank originating from the system. In this article, we focus on causes stemming from the App itself. When you encounter lag, before blaming the phone manufacturer, consider if it’s the App’s own inefficiency.&lt;/p&gt;</summary>


    <category term="Android" scheme="https://androidperformance.com/en/categories/Android/"/>
    
    
    <category term="Android" scheme="https://androidperformance.com/en/tags/Android/"/>
    
    <category term="Systrace" scheme="https://androidperformance.com/en/tags/Systrace/"/>
    
    <category term="Jank" scheme="https://androidperformance.com/en/tags/Jank/"/>
    
    <category term="Memory" scheme="https://androidperformance.com/en/tags/Memory/"/>
    
    <category term="Performance" scheme="https://androidperformance.com/en/tags/Performance/"/>
    
  </entry>
  
  <entry>
    <title>Overview of Jank and Frame Drops in Android - System Layer</title>
    <link href="https://androidperformance.com/en/2019/09/05/Android-Jank-Due-To-System/"/>
    <id>https://androidperformance.com/en/2019/09/05/Android-Jank-Due-To-System/</id>
    <published>2019-09-05T12:35:35.000Z</published>
    <updated>2026-05-10T23:29:51.056Z</updated>
    
    <content type="html"><![CDATA[<p>In the <a href="https://www.androidperformance.com/en/2019/09/05/Android-Jank-Due-To-App/">Overview of Jank and Frame Drops in Android - Application Layer</a> article, we listed causes of jank originating from the app itself. In this article, we focus on causes stemming from the Android platform. Due to differences in hardware performance, feature implementations, and engineering capabilities among Android OEMs, system quality varies significantly. Here, we’ll categorize performance issues caused by system hardware and software.</p><span id="more"></span><p>Jank issues are a top priority for both phone manufacturers and app developers, often handled by dedicated “Performance” or “Stability” teams. Third-party tools like Tencent’s Matrix are excellent, but manufacturers often have proprietary solutions with deeper system access through source code modification.</p><p>Smoothness refers to frame drops. If the screen fails to refresh at 60 FPS (or the target refresh rate) and only hits 55, the user perceives this as jank. Frame rate fluctuations are especially noticeable.</p><p>This series includes:<br>0. <a href="https://www.androidperformance.com/en/2019/09/05/Android-Jank-Debug/">Overview of Jank and Frame Drops in Android - Methodology</a></p><ol><li><a href="https://www.androidperformance.com/en/2019/09/05/Android-Jank-Due-To-System/">Overview of Jank and Frame Drops in Android - System Layer</a></li><li><a href="https://www.androidperformance.com/en/2019/09/05/Android-Jank-Due-To-App/">Overview of Jank and Frame Drops in Android - Application Layer</a></li><li><a href="https://www.androidperformance.com/en/2019/09/18/Android-Jank-Due-To-Low-Memory/">Overview of Jank and Frame Drops in Android - Low Memory</a></li></ol><h1 id="System-Level-Performance-Case-Studies"><a href="#System-Level-Performance-Case-Studies" class="headerlink" title="System-Level Performance Case Studies"></a>System-Level Performance Case Studies</h1><p>Below are actual cases of jank caused by Android platform issues. Some issues are caught during development, while others only emerge after long-term use or in specific scenarios.</p><p>Many of these cases are visible in Systrace. If you’re unfamiliar, see the <a href="https://www.androidperformance.com/en/2019/05/26/Android_Systrace_0/">Systrace Series</a>. Systrace provides a global view of the system’s operating state.</p><h2 id="1-SurfaceFlinger-Main-Thread-Overhead"><a href="#1-SurfaceFlinger-Main-Thread-Overhead" class="headerlink" title="1. SurfaceFlinger Main Thread Overhead"></a>1. SurfaceFlinger Main Thread Overhead</h2><p>SurfaceFlinger handles surface composition. If its main thread exceeds the timing threshold, frame drops occur. This also delays HWC Service and CRTC, and blocks app Binder calls like <code>dequeueBuffer</code> and <code>queueBuffer</code>.</p><p>(Example Systraces show SF main thread timeouts leading to yellow&#x2F;dropped frames in apps).</p><h2 id="2-Under-Screen-Ambient-Light-Sensor-Screenshots"><a href="#2-Under-Screen-Ambient-Light-Sensor-Screenshots" class="headerlink" title="2. Under-Screen Ambient Light Sensor Screenshots"></a>2. Under-Screen Ambient Light Sensor Screenshots</h2><p>Some phones use under-screen sensors. If the implementation requires frequent screenshots to distinguish light changes, the screenshot operation can block the SurfaceFlinger main thread, causing jank.</p><h2 id="3-HWC-Service-Execution-Overhead"><a href="#3-HWC-Service-Execution-Overhead" class="headerlink" title="3. HWC Service Execution Overhead"></a>3. HWC Service Execution Overhead</h2><p>If the HWC Service is slow, SurfaceFlinger might fail to compose the next frame, blocking app <code>dequeueBuffer</code> and <code>setTransactionState</code> calls.</p><h2 id="4-CRTC-Execution-Overhead"><a href="#4-CRTC-Execution-Overhead" class="headerlink" title="4. CRTC Execution Overhead"></a>4. CRTC Execution Overhead</h2><p>Slow CRTC (Display Controller) execution similarly prevents SurfaceFlinger composition and blocks app Binder returns.</p><h2 id="5-CPU-Scheduling-Issues"><a href="#5-CPU-Scheduling-Issues" class="headerlink" title="5. CPU Scheduling Issues"></a>5. CPU Scheduling Issues</h2><h3 id="Critical-Tasks-on-Small-Cores"><a href="#Critical-Tasks-on-Small-Cores" class="headerlink" title="Critical Tasks on Small Cores"></a>Critical Tasks on Small Cores</h3><p>If <code>RenderThread</code> is scheduled on a small core with lower performance, execution time increases, causing jank.</p><h3 id="Low-Priority-and-Slice-Delays"><a href="#Low-Priority-and-Slice-Delays" class="headerlink" title="Low Priority and Slice Delays"></a>Low Priority and Slice Delays</h3><p>Tasks that are low priority to the Linux scheduler might be critical to the user (e.g., interacting with the app’s main thread). Delay in getting CPU time leads to lag.</p><h3 id="Preemption-by-RT-Processes"><a href="#Preemption-by-RT-Processes" class="headerlink" title="Preemption by RT Processes"></a>Preemption by RT Processes</h3><p>App MainThread or RenderThread being preempted by Real-Time (RT) processes causes responsiveness issues. Google has considered making App threads RT during startup, but this can actually slow down startup due to system contention.</p><h3 id="Core-Binding-and-Migration"><a href="#Core-Binding-and-Migration" class="headerlink" title="Core Binding and Migration"></a>Core Binding and Migration</h3><p>Issues occur when tasks that need big cores run on small ones, or vice versa. Incorrectly binding a task to a specific busy core can also cause failure (e.g., CTS failures due to core 7 being hogged by <code>RenderThread</code>).</p><h2 id="6-Thermal-Throttling"><a href="#6-Thermal-Throttling" class="headerlink" title="6. Thermal Throttling"></a>6. Thermal Throttling</h2><p>Thermal protection is a hardware-level safety measure. Overheating triggers CPU&#x2F;GPU frequency caps to cool down the device, which inevitably impacts smoothness. If your phone is hot and laggy, it’s a protection mechanism.</p><h2 id="7-High-Background-Activity"><a href="#7-High-Background-Activity" class="headerlink" title="7. High Background Activity"></a>7. High Background Activity</h2><p>Too many background processes hog CPU, I&#x2F;O, and Memory, making the system “busy.”</p><h3 id="CPU-Saturation"><a href="#CPU-Saturation" class="headerlink" title="CPU Saturation"></a>CPU Saturation</h3><p><code>dumpsys cpuinfo</code> reveals high overall usage.</p><h3 id="Runnable-Thread-States"><a href="#Runnable-Thread-States" class="headerlink" title="Runnable Thread States"></a>Runnable Thread States</h3><p>If a thread is in <code>Runnable</code> state but the scheduler can’t find time for it, it misses Vsync, causing jank.</p><h3 id="Irrelevant-Active-Processes"><a href="#Irrelevant-Active-Processes" class="headerlink" title="Irrelevant Active Processes"></a>Irrelevant Active Processes</h3><p>Processes unrelated to the current foreground app (system or third-party) compete for resources and delay App MainThread scheduling.</p><h3 id="Memory-Reclamation-Overhead"><a href="#Memory-Reclamation-Overhead" class="headerlink" title="Memory Reclamation Overhead"></a>Memory Reclamation Overhead</h3><p>When memory is low, <code>HeapTaskDaemon</code> and <code>kswapd0</code> hog CPU to reclaim memory, starving other processes.</p><h3 id="System-Lock-Contention"><a href="#System-Lock-Contention" class="headerlink" title="System Lock Contention"></a>System Lock Contention</h3><p><code>system_server</code> AMS and WMS locks can become massive bottlenecks. If these locks are held too long, app Binder requests enter a wait state, causing jank in animations and interactions.</p><h2 id="8-Excessive-Layers"><a href="#8-Excessive-Layers" class="headerlink" title="8. Excessive Layers"></a>8. Excessive Layers</h2><p>In Android P+, Layer computation happens in the SF main thread. If there are too many background layers, <code>rebuildLayerStacks</code> takes too long, slowing down SurfaceFlinger. Clearing background tasks helps.</p><h2 id="9-Uneven-Input-Reporting"><a href="#9-Uneven-Input-Reporting" class="headerlink" title="9. Uneven Input Reporting"></a>9. Uneven Input Reporting</h2><p>If input events (touch&#x2F;gestures) are reported unevenly or not at all, the main thread won’t draw, appearing as jank in scrolling.</p><h2 id="10-LMK-Resource-Competition"><a href="#10-LMK-Resource-Competition" class="headerlink" title="10. LMK Resource Competition"></a>10. LMK Resource Competition</h2><p>Low Memory Killer (LMK) activity consumes resources. Processes being killed and immediately restarted by their parent create a “death-restart cycle” that drains CPU. Frequent GCs and heavy I&#x2F;O (swapping) further deteriorate performance.</p><h2 id="11-Low-Memory-I-x2F-O-Latency"><a href="#11-Low-Memory-I-x2F-O-Latency" class="headerlink" title="11. Low Memory I&#x2F;O Latency"></a>11. Low Memory I&#x2F;O Latency</h2><p>Low memory leads to increased disk I&#x2F;O (swapping&#x2F;paging). Since disk I&#x2F;O is slow, main threads often enter “Uninterruptible Sleep” (State D), causing jank in list scrolling and app startup.</p><h2 id="12-GPU-Composition-Overhead"><a href="#12-GPU-Composition-Overhead" class="headerlink" title="12. GPU Composition Overhead"></a>12. GPU Composition Overhead</h2><p>When SurfaceFlinger falls back to GPU composition, its main thread execution time spikes, potentially missing Vsync.</p><h2 id="13-KSWAPD-on-Big-Cores"><a href="#13-KSWAPD-on-Big-Cores" class="headerlink" title="13. KSWAPD on Big Cores"></a>13. KSWAPD on Big Cores</h2><p>Under heavy memory pressure, <code>kswapd</code> might hog big cores, causing thermal throttling or preempting critical app threads.</p><h2 id="14-Uneven-SurfaceFlinger-Vsync"><a href="#14-Uneven-SurfaceFlinger-Vsync" class="headerlink" title="14. Uneven SurfaceFlinger Vsync"></a>14. Uneven SurfaceFlinger Vsync</h2><p>If the interval between SF Vsyncs becomes inconsistent (due to SF or HWC bugs), the user perceives uneven, stuttery motion.</p><h2 id="15-Accessibility-Services"><a href="#15-Accessibility-Services" class="headerlink" title="15. Accessibility Services"></a>15. Accessibility Services</h2><p>Third-party apps using Accessibility Services to monitor input events can disrupt <code>InputDispatcher</code> behavior, delaying event delivery to the app’s main thread.</p><h1 id="Summary"><a href="#Summary" class="headerlink" title="Summary"></a>Summary</h1><p>Android is a constantly evolving system. Each version solves many performance issues but might introduce new ones. OEMs add substantial custom code, which further impacts performance.</p><p>The cases above are just the tip of the iceberg. This is why manufacturers are investing heavily in optimization—from hardware&#x2F;kernel levels to dynamic system policies and AI-driven behavior learning. Those who neglect quality for pure design often lose their market share.</p><p>For more details on what OEMs do, see: <a href="https://www.zhihu.com/question/335226118/answer/751587534">What do phone manufacturers actually do when they say they are optimizing Android?</a></p><p>This series continues:<br>0. <a href="https://www.androidperformance.com/en/2019/09/05/Android-Jank-Debug/">Overview of Jank and Frame Drops in Android - Methodology</a></p><ol><li><a href="https://www.androidperformance.com/en/2019/09/05/Android-Jank-Due-To-System/">Overview of Jank and Frame Drops in Android - System Layer</a></li><li><a href="https://www.androidperformance.com/en/2019/09/05/Android-Jank-Due-To-App/">Overview of Jank and Frame Drops in Android - Application Layer</a></li><li><a href="https://www.androidperformance.com/en/2019/09/18/Android-Jank-Due-To-Low-Memory/">Overview of Jank and Frame Drops in Android - Low Memory</a></li></ol><h1 id="About-Me-amp-amp-Blog"><a href="#About-Me-amp-amp-Blog" class="headerlink" title="About Me &amp;&amp; Blog"></a>About Me &amp;&amp; Blog</h1><p>(Links and introduction)</p>]]></content>
    
    
    <summary type="html">&lt;p&gt;In the &lt;a href=&quot;https://www.androidperformance.com/en/2019/09/05/Android-Jank-Due-To-App/&quot;&gt;Overview of Jank and Frame Drops in Android - Application Layer&lt;/a&gt; article, we listed causes of jank originating from the app itself. In this article, we focus on causes stemming from the Android platform. Due to differences in hardware performance, feature implementations, and engineering capabilities among Android OEMs, system quality varies significantly. Here, we’ll categorize performance issues caused by system hardware and software.&lt;/p&gt;</summary>


    <category term="Android" scheme="https://androidperformance.com/en/categories/Android/"/>
    
    
    <category term="Android" scheme="https://androidperformance.com/en/tags/Android/"/>
    
    <category term="Systrace" scheme="https://androidperformance.com/en/tags/Systrace/"/>
    
    <category term="Startup" scheme="https://androidperformance.com/en/tags/Startup/"/>
    
    <category term="Memory" scheme="https://androidperformance.com/en/tags/Memory/"/>
    
    <category term="Performance" scheme="https://androidperformance.com/en/tags/Performance/"/>
    
  </entry>
  
  <entry>
    <title>Overview of Jank and Frame Drops in Android - Methodology</title>
    <link href="https://androidperformance.com/en/2019/09/05/Android-Jank-Debug/"/>
    <id>https://androidperformance.com/en/2019/09/05/Android-Jank-Debug/</id>
    <published>2019-09-05T04:56:42.000Z</published>
    <updated>2026-05-10T23:29:51.056Z</updated>
    
    <content type="html"><![CDATA[<p>Jank issues in Android are taken very seriously by both smartphone manufacturers and app developers. Internal teams, often called “Performance” or “Stability” groups, are typically dedicated to optimizing these experiences.</p><p>Currently, excellent third-party performance monitoring tools like Tencent’s Matrix are available. Phone manufacturers also have proprietary solutions. Since they can modify source code and bypass certain permission hurdles, manufacturers can access deeper system data, making analysis more efficient.</p><span id="more"></span><p>When we talk about smoothness, we are essentially talking about frame drops during operation. If a screen needs to refresh at 60 frames per second (FPS) but only manages 55, the user perceives this as a “jank” or “stutter.” Sudden fluctuations in frame rate are particularly noticeable. Reasons for frame drops range from hardware and system software issues to inefficiencies within the app itself.</p><p>This series is divided into four articles to explore these causes:</p><ol start="0"><li><a href="https://www.androidperformance.com/en/2019/09/05/Android-Jank-Debug/">Overview of Jank and Frame Drops in Android - Methodology</a></li><li><a href="https://www.androidperformance.com/en/2019/09/05/Android-Jank-Due-To-System/">Overview of Jank and Frame Drops in Android - System Layer</a></li><li><a href="https://www.androidperformance.com/en/2019/09/05/Android-Jank-Due-To-App/">Overview of Jank and Frame Drops in Android - Application Layer</a></li><li><a href="https://www.androidperformance.com/en/2019/09/18/Android-Jank-Due-To-Low-Memory/">Overview of Jank and Frame Drops in Android - Low Memory</a></li></ol><p>The methodology of locating the scenario first and then assigning responsibility to App, System, Kernel, or Display still applies, but the tool entry points should be updated. Replace Systrace with Perfetto&#x2F;System Trace and use Frame Timeline as the first jank signal. Replace MethodTrace&#x2F;TraceView with Android Studio CPU Profiler, sampled call stacks, and Perfetto custom trace sections. MAT is only appropriate for offline Java heap analysis; memory pressure needs Android Studio Memory Profiler, <code>dumpsys meminfo</code>, LMK&#x2F;Vitals, and Perfetto evidence. For field trends, start with Android Vitals, JankStats, or your APM, then replay suspicious scenarios with Macrobenchmark <code>FrameTimingMetric</code>.</p><h1 id="1-Overview-of-Smoothness-Work"><a href="#1-Overview-of-Smoothness-Work" class="headerlink" title="1. Overview of Smoothness Work"></a>1. Overview of Smoothness Work</h1><p>As a member of a manufacturer’s optimization group, I should briefly describe our workflow. Many factors can cause jank in Android, but testing and users experience it most directly as dropped frames in the foreground app. Since they often can’t pinpoint the root cause, they report it to us as a general bug. We act as “jank interfaces,” analyzing the cause and assigning the bug to the relevant team: Framework, App, Multimedia, Display, BSP, etc.</p><p>We rarely solve the technical bug ourselves. Instead, we use specialized tools combined with <strong>source code</strong> to locate issues. Our primary tools include:</p><ol><li><strong>Systrace&#x2F;strace&#x2F;ftrace</strong>: For a global system-level overview.</li><li><strong>MethodTrace</strong>: For a detailed view of per-process function call stacks.</li><li><strong>Android Studio Profiler</strong>.</li><li><strong>MAT</strong>: For analyzing memory issues.</li><li><strong>Logs</strong>: Comprehensive log reports including Main, System, Event, Kernel, and Crash logs, as well as proprietary Power&#x2F;Performance logs and incident recordings (screenshots&#x2F;videos).</li><li><strong>Reproduction Videos</strong>.</li><li><strong>Local Reproductions</strong>.</li></ol><p>Identifying the root cause requires proficiency in App development, Android Framework, Display systems, and Linux Kernel, along with mastery of the corresponding tools and scenarios.</p><h1 id="2-Analysis-Tools-and-Workflows"><a href="#2-Analysis-Tools-and-Workflows" class="headerlink" title="2. Analysis Tools and Workflows"></a>2. Analysis Tools and Workflows</h1><p>When data hooks are incomplete, we rely heavily on Systrace for a global perspective:</p><ol><li><strong>Systrace Analysis</strong><ul><li>Identify the target App.</li><li>Use the App Main Thread and SurfaceFlinger Main Thread info to locate the “scene of the jank.”</li><li>Deep dive into Systrace. This requires knowing how Systrace modules correspond to user-perceived lag, understanding inter-module interaction, Binder calls, and Kernel info (see the <a href="https://www.androidperformance.com/en/2019/05/26/Android_Systrace_0/">Systrace Series</a>).</li><li>If the App Main Thread is heavy, analyze the app logic.</li><li>If it’s a System issue, analyze <code>system_server</code>, <code>SurfaceFlinger</code>, HWC, CRTC, CPU, etc.</li></ul></li><li><strong>MethodTrace + Source Code</strong><ul><li>After identifying the cause with Systrace, use MethodTrace to see per-process function stacks and map them back to the code.</li><li>Use Android Studio for breakpoint debugging in App or Framework code to verify if behavior matches expectations.</li></ul></li><li><strong>Log Analysis</strong><ul><li>Even if logs don’t directly show the “jank,” they are crucial for system context:</li><li>Screenshots to confirm timing and UI state.</li><li><code>dumpsys meminfo</code> and <code>dumpsys cpuinfo</code>.</li><li>“Slow dispatch” and “Slow delivery” Looper warnings.</li><li><code>EventLog</code> to reconstruct user operations leading to the event.</li></ul></li><li><strong>Local Reproduction</strong><ul><li>High-speed video recording to observe fine details.</li><li>Filtering logs for anomalies.</li><li>Capturing multiple Systraces to confirm consistency.</li></ul></li><li><strong>System-wide State Check</strong><ul><li><code>adb shell dumpsys activity oom</code></li><li><code>adb shell dumpsys meminfo</code></li><li><code>adb shell cat /proc/buddyinfo</code> (Memory fragmentation)</li><li><code>adb shell dumpsys cpuinfo</code></li><li><code>adb shell dumpsys input</code></li><li><code>adb shell dumpsys window</code></li></ul></li></ol><h1 id="3-Data-Driven-Analysis"><a href="#3-Data-Driven-Analysis" class="headerlink" title="3. Data-Driven Analysis"></a>3. Data-Driven Analysis</h1><p>Due to the unreliability of user reports and the limits of internal testing, system&#x2F;app performance hooks are vital. They allow for large-scale trend analysis without active user participation.</p><p>Most major Chinese phone and app manufacturers have their own APM (Application Performance Management) platforms. For example, Tencent’s Matrix monitors various metrics that other app developers can integrate.</p><p>Manufacturers, with their source code access, collect even deeper data: CPU load, I&#x2F;O load, Memory pressure, FSync times, Exception monitoring, Thermal monitoring, and Storage health. Each category might have dozens of sub-metrics. Analyzing this high-dimensional data requires experienced teams to define metrics and derive actionable insights.</p><p>The subsequent optimization work tests a company’s R&amp;D strength. High-tier manufacturers optimize at the hardware-software boundary (resource allocation), while others focus on scenario-based resource policies.</p><h1 id="4-Summary"><a href="#4-Summary" class="headerlink" title="4. Summary"></a>4. Summary</h1><p>This has been a high-level overview of analysis methodologies for smoothness issues, primarily from a Framework&#x2F;App perspective. Kernel teams likely have a different, deeper vantage point.</p><p>Android phone manufacturers can be categorized by their technical depth:</p><ol><li><strong>Apple</strong>: Inhouse chips, OS, and ecosystem. They have the tightest control from hardware to app layers.</li><li><strong>Samsung &amp; Huawei</strong>: Inhouse chips&#x2F;core components but sharing the Android OS&#x2F;ecosystem. They can perform Chip-to-OS integration.</li><li><strong>Other Top Android OEMs</strong>: Rely on different SoCs (Qualcomm, MediaTek). Their optimizations are often software-policy-based since they don’t always control the deepest chip layers.</li></ol><p>This is just the first part of our smoothness series. Stay tuned for more.</p><ol start="0"><li><a href="https://www.androidperformance.com/en/2019/09/05/Android-Jank-Debug/">Overview of Jank and Frame Drops in Android - Methodology</a></li><li><a href="https://www.androidperformance.com/en/2019/09/05/Android-Jank-Due-To-System/">Overview of Jank and Frame Drops in Android - System Layer</a></li><li><a href="https://www.androidperformance.com/en/2019/09/05/Android-Jank-Due-To-App/">Overview of Jank and Frame Drops in Android - Application Layer</a></li></ol><h1 id="About-Me-amp-amp-Blog"><a href="#About-Me-amp-amp-Blog" class="headerlink" title="About Me &amp;&amp; Blog"></a>About Me &amp;&amp; Blog</h1><p>(Links and introduction)</p>]]></content>
    
    
    <summary type="html">&lt;p&gt;Jank issues in Android are taken very seriously by both smartphone manufacturers and app developers. Internal teams, often called “Performance” or “Stability” groups, are typically dedicated to optimizing these experiences.&lt;/p&gt;
&lt;p&gt;Currently, excellent third-party performance monitoring tools like Tencent’s Matrix are available. Phone manufacturers also have proprietary solutions. Since they can modify source code and bypass certain permission hurdles, manufacturers can access deeper system data, making analysis more efficient.&lt;/p&gt;</summary>


    <category term="Android" scheme="https://androidperformance.com/en/categories/Android/"/>
    
    
    <category term="Android" scheme="https://androidperformance.com/en/tags/Android/"/>
    
    <category term="Systrace" scheme="https://androidperformance.com/en/tags/Systrace/"/>
    
    <category term="Jank" scheme="https://androidperformance.com/en/tags/Jank/"/>
    
    <category term="Memory" scheme="https://androidperformance.com/en/tags/Memory/"/>
    
    <category term="Performance" scheme="https://androidperformance.com/en/tags/Performance/"/>
    
  </entry>
  
  <entry>
    <title>A Detailed Guide to Activity Launch Modes in Android</title>
    <link href="https://androidperformance.com/en/2019/09/01/Android-Activity-Lunch-Mode/"/>
    <id>https://androidperformance.com/en/2019/09/01/Android-Activity-Lunch-Mode/</id>
    <published>2019-09-01T04:37:47.000Z</published>
    <updated>2026-05-10T23:29:51.053Z</updated>
    
    <content type="html"><![CDATA[<p>Android Activities have several critical launch modes: <code>standard</code>, <code>singleTop</code>, <code>singleTask</code>, and <code>singleInstance</code>. Each serves a specific architectural purpose. In this post, I’ll demonstrate their behaviors using a demo and visualizing the Activity Stack at each step.</p><p>An Activity Stack is a Last-In-First-Out (LIFO) data structure. Paying attention to the “Stack Content” column in the examples below will help you grasp how these modes differ in practice.</p><p>The demo code is available on GitLab: <a href="https://github.com/Gracker/AndroidLaunchModeTest">AndroidLaunchModeTest</a>.</p><span id="more"></span><h1 id="standard-Mode"><a href="#standard-Mode" class="headerlink" title="standard Mode"></a>standard Mode</h1><figure class="highlight xml"><table><tr><td class="gutter"><pre><span class="line">1</span><br></pre></td><td class="code"><pre><span class="line">android:launchMode=&quot;standard&quot;</span><br></pre></td></tr></table></figure><p>The default mode. A new instance of the Activity is created every time it is started.</p><p><strong>Test Trace:</strong></p><ol><li><strong>Launch MainActivity</strong><ul><li><strong>Stack</strong>: <code>MainActivity</code></li></ul></li><li><strong>Launch StandardActivity</strong><ul><li><strong>Stack</strong>: <code>StandardActivity</code> -&gt; <code>MainActivity</code></li></ul></li><li><strong>Launch StandardActivity again</strong><ul><li><strong>Stack</strong>: <code>StandardActivity</code> (new) -&gt; <code>StandardActivity</code> -&gt; <code>MainActivity</code></li></ul></li></ol><hr><h1 id="singleTop-Mode"><a href="#singleTop-Mode" class="headerlink" title="singleTop Mode"></a>singleTop Mode</h1><figure class="highlight xml"><table><tr><td class="gutter"><pre><span class="line">1</span><br></pre></td><td class="code"><pre><span class="line">android:launchMode=&quot;singleTop&quot;</span><br></pre></td></tr></table></figure><p>If an instance of the Activity already exists at the <strong>top</strong> of the current stack, the system routes the intent to that instance via <code>onNewIntent()</code>. Otherwise, a new instance is created.</p><p><strong>Test 1: singleTopActivity is NOT at the top</strong></p><ol><li><strong>MainActivity</strong> -&gt; <strong>StandardActivity</strong><ul><li><strong>Stack</strong>: <code>StandardAntivity</code>, <code>MainActivity</code></li></ul></li><li><strong>Launch singleTopActivity</strong><ul><li><strong>Stack</strong>: <code>singleTopActivity</code>, <code>StandardActivity</code>, <code>MainActivity</code></li></ul></li><li><strong>Launch StandardActivity</strong><ul><li><strong>Stack</strong>: <code>StandardActivity</code>, <code>singleTopActivity</code>, <code>StandardActivity</code>, <code>MainActivity</code></li></ul></li><li><strong>Launch singleTopActivity</strong><ul><li><strong>Stack</strong>: <code>singleTopActivity</code> (new), <code>StandardActivity</code>, <code>singleTopActivity</code>, <code>StandardActivity</code>, <code>MainActivity</code></li><li><em>Note: Because <code>StandardActivity</code> was at the top, a new instance was created.</em></li></ul></li></ol><p><strong>Test 2: singleTopActivity IS at the top</strong></p><ol><li><strong>Stack</strong>: <code>singleTopActivity</code>, <code>StandardActivity</code>, <code>MainActivity</code></li><li><strong>Launch singleTopActivity again</strong><ul><li><strong>Stack</strong>: <code>singleTopActivity</code> (reused), <code>StandardActivity</code>, <code>MainActivity</code></li><li><em>Note: <code>am_new_intent</code> is triggered instead of <code>onCreate</code>.</em></li></ul></li></ol><hr><h1 id="singleTask-Mode"><a href="#singleTask-Mode" class="headerlink" title="singleTask Mode"></a>singleTask Mode</h1><figure class="highlight xml"><table><tr><td class="gutter"><pre><span class="line">1</span><br></pre></td><td class="code"><pre><span class="line">android:launchMode=&quot;singleTask&quot;</span><br></pre></td></tr></table></figure><ol><li><strong>Task Reuse</strong>: If an instance exists anywhere in the task, the system brings it to the front and calls <code>onNewIntent()</code>.</li><li><strong>Clear-Top</strong>: All Activities sitting on top of the reused <code>singleTask</code> Activity are destroyed.</li><li><strong>Affinity</strong>: By default, it stays in the same task. If <code>taskAffinity</code> is specified, it might start in a new task.</li></ol><p><strong>Test 1: singleTask (Default Affinity)</strong></p><ol><li><strong>Stack</strong>: <code>StandardActivity</code>, <code>singleTaskActivity</code>, <code>StandardActivity</code>, <code>MainActivity</code></li><li><strong>Launch singleTaskActivity</strong><ul><li><strong>Stack</strong>: <code>singleTaskActivity</code> (reused), <code>StandardActivity</code>, <code>MainActivity</code></li><li><em>Note: The intermediate <code>StandardActivity</code> was cleared.</em></li></ul></li></ol><p><strong>Test 2: singleTask (With taskAffinity)</strong><br>If <code>android:taskAffinity=&quot;&quot;</code> is set, <code>singleTask</code> will launch into a new task.</p><ol><li><strong>Launch singleTaskWithAffinity</strong><ul><li><strong>Task 1</strong>: <code>singleTaskWithAffinity</code></li><li><strong>Task 0</strong>: <code>StandardActivity</code>, <code>MainActivity</code></li></ul></li><li><strong>Launch StandardActivity (from Task 1)</strong><ul><li><strong>Task 1</strong>: <code>StandardActivity</code>, <code>singleTaskWithAffinity</code></li></ul></li><li><strong>Launch singleTaskWithAffinity again</strong><ul><li><strong>Task 1</strong>: <code>singleTaskWithAffinity</code> (reused)</li><li><em>Note: Both activities exist in separate stacks&#x2F;tasks in the Recent Apps view.</em></li></ul></li></ol><hr><h1 id="singleInstance-Mode"><a href="#singleInstance-Mode" class="headerlink" title="singleInstance Mode"></a>singleInstance Mode</h1><figure class="highlight xml"><table><tr><td class="gutter"><pre><span class="line">1</span><br></pre></td><td class="code"><pre><span class="line">android:launchMode=&quot;singleInstance&quot;</span><br></pre></td></tr></table></figure><p>As the name suggests, this is a truly unique instance. The system creates a dedicated task for this Activity, and it is the <strong>only</strong> Activity in that task.</p><p><strong>Test 1: singleInstance (Default Affinity)</strong></p><ol><li><strong>Stack 0</strong>: <code>StandardActivity</code>, <code>MainActivity</code></li><li><strong>Launch singleInstanceActivity</strong><ul><li><strong>Stack 1</strong>: <code>singleInstanceActivity</code></li><li><strong>Stack 0</strong>: <code>StandardActivity</code>, <code>MainActivity</code></li></ul></li><li><strong>Launch StandardActivity (from Stack 1)</strong><ul><li><strong>Stack 1</strong>: <code>singleInstanceActivity</code></li><li><strong>Stack 0</strong>: <code>StandardActivity</code> (new), <code>StandardActivity</code>, <code>MainActivity</code></li><li><em>Note: The new Activity is pushed back to the previous “home” task, leaving <code>singleInstanceActivity</code> alone in its task.</em></li></ul></li></ol><p><strong>Summary:</strong></p><ul><li><code>singleInstance</code> creates a new task but doesn’t necessarily show up as a separate item in “Recents” unless a unique <code>taskAffinity</code> is also set.</li><li>It is globally unique.</li></ul><hr><h1 id="Key-Concepts"><a href="#Key-Concepts" class="headerlink" title="Key Concepts"></a>Key Concepts</h1><h3 id="TaskAffinity"><a href="#TaskAffinity" class="headerlink" title="TaskAffinity"></a>TaskAffinity</h3><p>The task an Activity “prefers” to belong to. Activities with the same affinity belong to the same parent task. Defaults to the package name. Used with <code>singleTask</code> or <code>allowTaskReparenting</code>.</p><h3 id="Relationships-ActivityRecord-TaskRecord-ActivityStack"><a href="#Relationships-ActivityRecord-TaskRecord-ActivityStack" class="headerlink" title="Relationships: ActivityRecord, TaskRecord, ActivityStack"></a>Relationships: ActivityRecord, TaskRecord, ActivityStack</h3><ol><li><strong>ActivityRecord</strong>: Represents a single Activity instance. One Activity defined in XML can have multiple <code>ActivityRecords</code> if started multiple times.</li><li><strong>TaskRecord</strong>: A “task” or “stack” of <code>ActivityRecords</code> (LIFO).</li><li><strong>ActivityStack</strong>: Manages multiple <code>TaskRecords</code>. Usually, a system has a “Home Stack” and an “App Stack.”</li></ol><h3 id="Activity-Types"><a href="#Activity-Types" class="headerlink" title="Activity Types"></a>Activity Types</h3><ul><li><strong>ACTIVITY_TYPE_STANDARD</strong>: Your typical app Activity.</li><li><strong>ACTIVITY_TYPE_HOME</strong>: The Launcher.</li><li><strong>ACTIVITY_TYPE_RECENTS</strong>: The Overview screen.</li><li><strong>ACTIVITY_TYPE_ASSISTANT</strong>: Voice assistants.</li></ul><hr><h1 id="About-Me-amp-amp-Blog"><a href="#About-Me-amp-amp-Blog" class="headerlink" title="About Me &amp;&amp; Blog"></a>About Me &amp;&amp; Blog</h1><p>(Links and introduction)</p>]]></content>
    
    
    <summary type="html">&lt;p&gt;Android Activities have several critical launch modes: &lt;code&gt;standard&lt;/code&gt;, &lt;code&gt;singleTop&lt;/code&gt;, &lt;code&gt;singleTask&lt;/code&gt;, and &lt;code&gt;singleInstance&lt;/code&gt;. Each serves a specific architectural purpose. In this post, I’ll demonstrate their behaviors using a demo and visualizing the Activity Stack at each step.&lt;/p&gt;
&lt;p&gt;An Activity Stack is a Last-In-First-Out (LIFO) data structure. Paying attention to the “Stack Content” column in the examples below will help you grasp how these modes differ in practice.&lt;/p&gt;
&lt;p&gt;The demo code is available on GitLab: &lt;a href=&quot;https://github.com/Gracker/AndroidLaunchModeTest&quot;&gt;AndroidLaunchModeTest&lt;/a&gt;.&lt;/p&gt;</summary>


    <category term="Android" scheme="https://androidperformance.com/en/categories/Android/"/>
    
    
    <category term="Android" scheme="https://androidperformance.com/en/tags/Android/"/>
    
    <category term="Systrace" scheme="https://androidperformance.com/en/tags/Systrace/"/>
    
    <category term="Startup" scheme="https://androidperformance.com/en/tags/Startup/"/>
    
    <category term="Performance" scheme="https://androidperformance.com/en/tags/Performance/"/>
    
    <category term="Tools" scheme="https://androidperformance.com/en/tags/Tools/"/>
    
  </entry>
  
  <entry>
    <title>Detailed Explanation of Hardware Layer in Android</title>
    <link href="https://androidperformance.com/en/2019/07/27/Android-Hardware-Layer-NEW/"/>
    <id>https://androidperformance.com/en/2019/07/27/Android-Hardware-Layer-NEW/</id>
    <published>2019-07-27T06:09:13.000Z</published>
    <updated>2026-05-10T23:29:51.054Z</updated>
    
    <content type="html"><![CDATA[<h1 id="Hardware-Acceleration-vs-Software-Acceleration"><a href="#Hardware-Acceleration-vs-Software-Acceleration" class="headerlink" title="Hardware Acceleration vs Software Acceleration"></a>Hardware Acceleration vs Software Acceleration</h1><p>Many people confuse hardware acceleration and Hardware Layer in Android, thinking that enabling hardware acceleration means enabling Hardware Layer. So before discussing Hardware Layer, let’s first talk about hardware acceleration.</p><p>For more detailed articles about hardware acceleration, I recommend these three:</p><ol><li><a href="https://www.mtyun.com/library/hardware-accelerate">Introduction to Android Hardware Acceleration Principles and Implementation</a></li><li><a href="https://juejin.im/post/5a1f7b3e6fb9a0451b0451bb">Understanding Android Hardware Acceleration for Beginners</a></li><li><a href="https://developer.android.google.cn/guide/topics/graphics/hardware-accel">Official Documentation: Hardware acceleration</a></li></ol><p>Hardware acceleration, actually should be called GPU acceleration. The difference between hardware and software acceleration mainly lies in whether graphics drawing is handled by GPU or CPU. If by GPU, it’s considered hardware accelerated drawing; otherwise, it’s software drawing.</p><p>Current Android versions have hardware acceleration enabled by default. If your App doesn’t have special declarations, hardware acceleration is enabled by default.</p><p>The above three articles provide deeper explanations at code and principle levels. Here I’ll demonstrate the difference between App drawing under hardware acceleration and software acceleration from a Systrace perspective.</p><h2 id="Hardware-Accelerated-App-Performance"><a href="#Hardware-Accelerated-App-Performance" class="headerlink" title="Hardware Accelerated App Performance"></a>Hardware Accelerated App Performance</h2><p>Since hardware acceleration is default, let’s take the most common desktop scrolling as an example to see how a hardware accelerated App performs in Systrace.</p><p>Under hardware acceleration, the App has both main thread and render thread; one frame’s drawing is executed cooperatively by both threads.<br><img src="/en/images/15642078929850.jpg"></p><p>Let’s zoom in on Systrace to see how each frame’s main thread and render thread work, and when GPU intervenes to achieve “acceleration.”<br><img src="/en/images/15642079103161.jpg"></p><p>GPU’s actual intervention occurs in some operations within the RenderThread.</p><h2 id="Software-Accelerated-App-Performance"><a href="#Software-Accelerated-App-Performance" class="headerlink" title="Software Accelerated App Performance"></a>Software Accelerated App Performance</h2><p>Correspondingly, let’s find an App for software acceleration demonstration: China UnionPay.</p><p>First, a panoramic view shows that under software rendering, there’s only main thread, no render thread; all rendering work completes on the main thread. Also visible is that under software rendering, each frame’s execution time is very long, exceeding one Vsync cycle, so scrolling feels jerky and uncomfortable. <a href="https://github.com/Gracker/Android_HardwareLayer_Example/blob/master/Systrace/%E8%BD%AF%E4%BB%B6%E6%B8%B2%E6%9F%93%E7%A4%BA%E4%BE%8B-%E4%BA%91%E9%97%AA%E4%BB%98.html">Systrace Download</a><br><img src="/en/images/15642079446767.jpg"></p><p>Let’s zoom in on Systrace to see how each frame’s main thread works.<br><img src="/en/images/15642079799345.jpg"></p><h2 id="Summary"><a href="#Summary" class="headerlink" title="Summary"></a>Summary</h2><p>Through the above comparison and reading the recommended three articles, you should clearly understand the difference between hardware rendering and software rendering. Here’s a summary:</p><ol><li>Under hardware rendering, the app has both main thread and render thread; under software rendering, the app only has main thread, no render thread.</li><li>Under hardware rendering, the app’s final drawing is achieved with GPU assistance; under software rendering, the app’s final drawing is achieved using CPU (calling skia library).</li><li>Under hardware rendering, App performance is superior to software rendering.</li><li>Since some APIs don’t support hardware rendering, only software rendering can be used. When developing Apps, such APIs should be avoided as much as possible (support status can be directly checked in Android official documentation: <a href="https://developer.android.google.cn/guide/topics/graphics/hardware-accel">https://developer.android.google.cn/guide/topics/graphics/hardware-accel</a>).</li></ol><h1 id="Software-Layer-VS-Hardware-Layer"><a href="#Software-Layer-VS-Hardware-Layer" class="headerlink" title="Software Layer VS Hardware Layer"></a>Software Layer VS Hardware Layer</h1><p>Having discussed hardware rendering, let’s talk about Software Layer and Hardware Layer. These two concepts mainly refer to Views and have no direct relationship with whether the App is hardware or software rendered at that moment (but there is dependency, explained later).</p><p>A View’s layerType has three states (English below is official documentation; read English first, then I’ll explain):</p><ol><li>LAYER_TYPE_NONE: Indicates that the view does not have a layer.</li><li>LAYER_TYPE_SOFTWARE: Indicates that the view has a software layer. A software layer is backed by a and causes the view to be rendered using Android’s software rendering pipeline, even if hardware acceleration is enabled.</li><li>LAYER_TYPE_HARDWARE: Indicates that the view has a hardware layer. A hardware layer is backed by a hardware specific texture (generally Frame Buffer Objects or FBO on OpenGL hardware) and causes the view to be rendered using Android’s hardware rendering pipeline, but only if hardware acceleration is turned on for the view hierarchy. When hardware acceleration is turned off, hardware layers behave exactly as LAYER_TYPE_SOFTWARE.</li></ol><h2 id="LAYER-TYPE-NONE"><a href="#LAYER-TYPE-NONE" class="headerlink" title="LAYER_TYPE_NONE"></a>LAYER_TYPE_NONE</h2><p>By default, all Views have this layerType. In this case, this View doesn’t undergo any special processing; it proceeds as usual.</p><h2 id="LAYER-TYPE-SOFTWARE"><a href="#LAYER-TYPE-SOFTWARE" class="headerlink" title="LAYER_TYPE_SOFTWARE"></a>LAYER_TYPE_SOFTWARE</h2><p>Software layerType indicates this View has a software-implemented Layer. How is it software-implemented? Essentially, it converts this View into a Bitmap object under certain conditions.</p><figure class="highlight java"><table><tr><td class="gutter"><pre><span class="line">1</span><br><span class="line">2</span><br><span class="line">3</span><br></pre></td><td class="code"><pre><span class="line">android/view/View.java</span><br><span class="line"> <span class="type">Bitmap</span> <span class="variable">bitmap</span> <span class="operator">=</span> createBitmap(mResources.getDisplayMetrics(),</span><br><span class="line">        width, height, quality);</span><br></pre></td></tr></table></figure><h4 id="Software-layer-functions"><a href="#Software-layer-functions" class="headerlink" title="Software layer functions:"></a>Software layer functions:</h4><ol><li>When the application is not using hardware acceleration, a software layer is useful to apply a specific color filter and&#x2F;or blending mode and&#x2F;or translucency to a view and all its children. (When the application is not using hardware acceleration, Software layer can be used to apply specific color filters, blending modes, or translucency to View and all its child Views.)</li><li>When the application is using hardware acceleration, a software layer is useful to render drawing primitives not supported by the hardware accelerated pipeline. It can also be used to cache a complex view tree into a texture and reduce the complexity of drawing operations. For instance, when animating a complex view tree with a translation, a software layer can be used to render the view tree only once. (When the application is using hardware acceleration, software layer can be used to render drawing primitives not supported by hardware accelerated pipeline. It can also cache complex view trees into textures, reducing drawing operation complexity. For example, when animating complex view trees with translation, software layer can render the view tree only once.)</li><li>Software layers should be avoided when the affected view tree updates often. Every update will require to re-render the software layer, which can potentially be slow (particularly when hardware acceleration is turned on since the layer will have to be uploaded into a hardware texture after every update). (When affected view trees update frequently, software layers should be avoided. Each update requires re-rendering the software layer, which can be slow (especially when hardware acceleration is enabled, as the layer must be uploaded to hardware texture after each update).)</li></ol><h2 id="LAYER-TYPE-HARDWARE"><a href="#LAYER-TYPE-HARDWARE" class="headerlink" title="LAYER_TYPE_HARDWARE"></a>LAYER_TYPE_HARDWARE</h2><p>Hardware layerType indicates this View has a hardware-implemented Layer. From the first section, we know “hardware” here refers to GPU, so hardware-implemented Layer, as the name suggests, is implemented via GPU, typically Frame Buffer Objects or FBO (off-screen rendering Buffer) on OpenGL hardware.</p><p>Note: Hardware layerType depends on hardware acceleration. If hardware acceleration is enabled, then FBO or frame buffer exists; if hardware acceleration is disabled, even if you set a View’s LayerType as Hardware Layer, it will be processed as Software Layer.</p><h3 id="Hardware-layer-functions"><a href="#Hardware-layer-functions" class="headerlink" title="Hardware layer functions:"></a>Hardware layer functions:</h3><ol><li>A hardware layer is useful to apply a specific color filter and&#x2F;or blending mode and&#x2F;or translucency to a view and all its children. (Hardware layer can be used to apply specific color filters and&#x2F;or blending modes and&#x2F;or translucency to view and all its child views.)</li><li>A hardware layer can be used to cache a complex view tree into a texture and reduce the complexity of drawing operations. For instance, when animating a complex view tree with a translation, a hardware layer can be used to render the view tree only once. (Hardware layer can be used to cache complex view trees into textures, reducing drawing operation complexity. For example, when animating complex view trees with translation, hardware layer can render the view tree only once; this is the main point.)</li><li>A hardware layer can also be used to increase the rendering quality when rotation transformations are applied on a view. It can also be used to prevent potential clipping issues when applying 3D transforms on a view. (When rotation transformations are applied on a view, hardware layer can also improve rendering quality. It can also prevent potential clipping issues when applying 3D transforms on a view.)</li></ol><p>Setting Hardware Layer helps performance for alpha, translation, scale, rotation property animations (similarly, setting Software Layer has the same effect; detailed explanation in following small example section). Specific usage as follows:</p><p>Before animation starts, set LayerType to LAYER_TYPE_HARDWARE (code from official example):</p><figure class="highlight java"><table><tr><td class="gutter"><pre><span class="line">1</span><br><span class="line">2</span><br></pre></td><td class="code"><pre><span class="line">view.setLayerType(View.LAYER_TYPE_HARDWARE, <span class="literal">null</span>);</span><br><span class="line">ObjectAnimator.ofFloat(view, <span class="string">&quot;rotationY&quot;</span>, <span class="number">180</span>).start();</span><br></pre></td></tr></table></figure>]]></content>


    <summary type="html">&lt;h1 id=&quot;Hardware-Acceleration-vs-Software-Acceleration&quot;&gt;&lt;a href=&quot;#Hardware-Acceleration-vs-Software-Acceleration&quot; class=&quot;headerlink&quot; title=&quot;</summary>


    <category term="Android" scheme="https://androidperformance.com/en/categories/Android/"/>
    
    
    <category term="Android" scheme="https://androidperformance.com/en/tags/Android/"/>
    
    <category term="Systrace" scheme="https://androidperformance.com/en/tags/Systrace/"/>
    
    <category term="Performance" scheme="https://androidperformance.com/en/tags/Performance/"/>
    
    <category term="Tools" scheme="https://androidperformance.com/en/tags/Tools/"/>
    
    <category term="RenderThread" scheme="https://androidperformance.com/en/tags/RenderThread/"/>
    
  </entry>
  
  <entry>
    <title>A Deep Dive into Hardware Layers in Android</title>
    <link href="https://androidperformance.com/en/2019/07/27/Android-Hardware-Layer/"/>
    <id>https://androidperformance.com/en/2019/07/27/Android-Hardware-Layer/</id>
    <published>2019-07-27T06:09:13.000Z</published>
    <updated>2026-05-10T23:29:51.054Z</updated>
    
    <content type="html"><![CDATA[<h1 id="Hardware-Acceleration-vs-Software-Acceleration"><a href="#Hardware-Acceleration-vs-Software-Acceleration" class="headerlink" title="Hardware Acceleration vs. Software Acceleration"></a>Hardware Acceleration vs. Software Acceleration</h1><p>Many people confuse “hardware acceleration” with “Hardware Layer” in Android, assuming that enabling hardware acceleration means enabling Hardware Layer. So before we talk about Hardware Layer, let’s first talk about hardware acceleration.</p><p>For more detailed articles about hardware acceleration, I recommend these three:</p><ol><li><a href="https://www.mtyun.com/library/hardware-accelerate">Android Hardware Acceleration Principles and Implementation</a></li><li><a href="https://juejin.im/post/5a1f7b3e6fb9a0451b0451bb">Understanding Android Hardware Acceleration for Beginners</a></li><li><a href="https://developer.android.google.cn/guide/topics/graphics/hardware-accel">Official Documentation: Hardware Acceleration</a></li></ol><p>Hardware acceleration should actually be called GPU acceleration. The main difference between software and hardware acceleration is whether the graphics rendering is handled by the GPU or CPU. If it’s handled by the GPU, it’s considered hardware-accelerated rendering; otherwise, it’s software rendering.</p><p>In current Android versions, hardware acceleration is enabled by default. If your app doesn’t explicitly declare otherwise, hardware acceleration is turned on by default.</p><p>The three articles above introduce hardware acceleration in detail at both the code level and principle level. Here, I’ll show you from the perspective of Systrace the differences between hardware-accelerated and software-accelerated app rendering.</p><h2 id="Hardware-Accelerated-App-Performance"><a href="#Hardware-Accelerated-App-Performance" class="headerlink" title="Hardware-Accelerated App Performance"></a>Hardware-Accelerated App Performance</h2><p>Since hardware acceleration is enabled by default, let’s take the most common scenario of scrolling the home screen as an example to see how a hardware-accelerated app appears in Systrace.</p><p>In hardware-accelerated mode, the app has both a main thread and a render thread. A frame’s rendering is executed cooperatively by the main thread and the render thread.</p><p><img src="/en/images/15642078929850.jpg" alt="Hardware Accelerated App"></p><p>Let’s zoom in on the Systrace to see how the main thread and render thread work together for each frame, and when the GPU actually intervenes to implement “acceleration.”</p><p><img src="/en/images/15642079103161.jpg" alt="Hardware Accelerated Zoomed"></p><p>The GPU’s actual intervention occurs during certain operations in the RenderThread.</p><h2 id="Software-Accelerated-App-Performance"><a href="#Software-Accelerated-App-Performance" class="headerlink" title="Software-Accelerated App Performance"></a>Software-Accelerated App Performance</h2><p>Correspondingly, let’s find an app for software-accelerated demonstration: Yun Shan Fu (Cloud Flash Pay).</p><p>First, let’s look at a panoramic view. You can see that under software rendering, there’s only a main thread and no render thread. All rendering work is completed on the main thread. At the same time, you can see that under software rendering, the execution time of each frame is very long, exceeding one Vsync period, so when scrolling, it stutters frame by frame, which is very uncomfortable. <a href="https://github.com/Gracker/Android_HardwareLayer_Example/blob/master/Systrace/%E8%BD%AF%E4%BB%B6%E6%B8%B2%E6%9F%93%E7%A4%BE%E8%AF%97%E9%97%AE%E4%BB%98%E4%BB%98.html">Download Systrace</a></p><p><img src="/en/images/15642079446767.jpg" alt="Software Rendering"></p><p>Let’s zoom in on the Systrace to see how the main thread works for each frame.</p><p><img src="/en/images/15642079799345.jpg" alt="Software Rendering Zoomed"></p><h2 id="Summary"><a href="#Summary" class="headerlink" title="Summary"></a>Summary</h2><p>From the comparison above and by reading the three recommended articles, you should have a clear understanding of the difference between hardware rendering and software rendering. Let’s summarize here:</p><ol><li>In hardware rendering mode, the app has both a main thread and a render thread; in software rendering mode, the app has only a main thread and no render thread.</li><li>In hardware rendering mode, the app’s final rendering is implemented with the help of the GPU; in software rendering mode, the app’s final rendering is implemented using the CPU (calling the Skia library).</li><li>In hardware rendering mode, the app’s performance is superior to software rendering.</li><li>Since some APIs are not supported by hardware rendering, they can only use software rendering. When doing app development, you should try to avoid using such APIs (you can check the support status directly in Android official documentation: <a href="https://developer.android.google.cn/guide/topics/graphics/hardware-accel">https://developer.android.google.cn/guide/topics/graphics/hardware-accel</a>)</li></ol><hr><h1 id="Software-Layer-vs-Hardware-Layer"><a href="#Software-Layer-vs-Hardware-Layer" class="headerlink" title="Software Layer vs. Hardware Layer"></a>Software Layer vs. Hardware Layer</h1><p>After finishing with hardware rendering, let’s talk about Software Layer and Hardware Layer. These two concepts mainly refer to Views and are not directly related to whether the app is using hardware rendering or software rendering at this time (though there is a dependency relationship, which will be discussed later).</p><p>A View’s layerType has three states (the English text is from official documentation, let’s read the English first and then I’ll explain):</p><ol><li><code>LAYER_TYPE_NONE</code>: Indicates that the view does not have a layer.</li><li><code>LAYER_TYPE_SOFTWARE</code>: Indicates that the view has a software layer. A software layer is backed by a Bitmap and causes the view to be rendered using Android’s software rendering pipeline, even if hardware acceleration is enabled.</li><li><code>LAYER_TYPE_HARDWARE</code>: Indicates that the view has a hardware layer. A hardware layer is backed by a hardware-specific texture (generally Frame Buffer Objects or FBO on OpenGL hardware) and causes the view to be rendered using Android’s hardware rendering pipeline, but only if hardware acceleration is turned on for the view hierarchy. When hardware acceleration is turned off, hardware layers behave exactly as <code>LAYER_TYPE_SOFTWARE</code>.</li></ol><h2 id="LAYER-TYPE-NONE"><a href="#LAYER-TYPE-NONE" class="headerlink" title="LAYER_TYPE_NONE"></a>LAYER_TYPE_NONE</h2><p>By default, all Views have this layerType. In this case, the View doesn’t receive any special handling and goes through the normal rendering pipeline.</p><h2 id="LAYER-TYPE-SOFTWARE"><a href="#LAYER-TYPE-SOFTWARE" class="headerlink" title="LAYER_TYPE_SOFTWARE"></a>LAYER_TYPE_SOFTWARE</h2><p>Software layerType indicates that this View has a software-implemented Layer. How is it implemented in software? Essentially, this View is converted into a Bitmap object based on certain conditions.</p><figure class="highlight java"><table><tr><td class="gutter"><pre><span class="line">1</span><br><span class="line">2</span><br><span class="line">3</span><br></pre></td><td class="code"><pre><span class="line">android/view/View.java</span><br><span class="line"><span class="type">Bitmap</span> <span class="variable">bitmap</span> <span class="operator">=</span> createBitmap(mResources.getDisplayMetrics(),</span><br><span class="line">    width, height, quality);</span><br></pre></td></tr></table></figure><h3 id="The-role-of-Software-layer"><a href="#The-role-of-Software-layer" class="headerlink" title="The role of Software layer:"></a>The role of Software layer:</h3><ol><li><p><strong>When the application is not using hardware acceleration</strong>, a software layer is useful to apply a specific color filter and&#x2F;or blending mode and&#x2F;or alpha to a view and all its children.</p></li><li><p><strong>When the application is using hardware acceleration</strong>, a software layer is useful to render drawing primitives not supported by the hardware-accelerated pipeline. It can also be used to cache a complex view tree into a texture and reduce the complexity of drawing operations. For instance, when animating a complex view tree with a translation, a software layer can be used to render the view tree only once.</p></li><li><p><strong>Software layers should be avoided when the affected view tree updates often</strong>. Every update will require re-rendering the software layer, which can potentially be slow (particularly when hardware acceleration is turned on since the layer will have to be uploaded into a hardware texture after every update).</p></li></ol><h2 id="LAYER-TYPE-HARDWARE"><a href="#LAYER-TYPE-HARDWARE" class="headerlink" title="LAYER_TYPE_HARDWARE"></a>LAYER_TYPE_HARDWARE</h2><p>Hardware layerType indicates that this View has a hardware-implemented Layer. From the first section, we know that “hardware” here refers to the GPU, so the hardware-implemented Layer is implemented through the GPU, typically Frame Buffer Objects (FBO) on OpenGL hardware (off-screen rendering buffer).</p><p><strong>Note</strong>: Here, Hardware layerType depends on hardware acceleration. If hardware acceleration is enabled, then there will be FBO or frame buffer; if hardware acceleration is disabled, then even if you set a View’s LayerType to Hardware Layer, it will be processed as a Software Layer.</p><h3 id="The-role-of-Hardware-layer"><a href="#The-role-of-Hardware-layer" class="headerlink" title="The role of Hardware layer:"></a>The role of Hardware layer:</h3><ol><li><p><strong>A hardware layer is useful to apply a specific color filter and&#x2F;or blending mode and&#x2F;or alpha to a view and all its children.</strong></p></li><li><p><strong>A hardware layer can be used to cache a complex view tree into a texture and reduce the complexity of drawing operations.</strong> For instance, when animating a complex view tree with a translation, a hardware layer can be used to render the view tree only once (this is the most important point).</p></li><li><p><strong>A hardware layer can also be used to increase rendering quality when rotation transformations are applied on a view.</strong> It can also be used to prevent potential clipping issues when applying 3D transforms on a view.</p></li></ol><p>Setting Hardware Layer is helpful for the performance of alpha, translation, scale, and rotation property animations (similarly, setting Software Layer has the same effect, and the following examples will have detailed explanations). Specific usage is as follows:</p><p>Before the animation starts, set the LayerType to <code>LAYER_TYPE_HARDWARE</code> (the code is from the official example).</p><figure class="highlight java"><table><tr><td class="gutter"><pre><span class="line">1</span><br><span class="line">2</span><br></pre></td><td class="code"><pre><span class="line">view.setLayerType(View.LAYER_TYPE_HARDWARE, <span class="literal">null</span>);</span><br><span class="line">ObjectAnimator.ofFloat(view, <span class="string">&quot;rotationY&quot;</span>, <span class="number">180</span>).start();</span><br></pre></td></tr></table></figure><p>When the animation ends, reset it to <code>LAYER_TYPE_NONE</code> (the code is from the official example):</p><figure class="highlight java"><table><tr><td class="gutter"><pre><span class="line">1</span><br><span class="line">2</span><br><span class="line">3</span><br><span class="line">4</span><br><span class="line">5</span><br><span class="line">6</span><br><span class="line">7</span><br><span class="line">8</span><br><span class="line">9</span><br></pre></td><td class="code"><pre><span class="line">view.setLayerType(View.LAYER_TYPE_HARDWARE, <span class="literal">null</span>);</span><br><span class="line"><span class="type">ObjectAnimator</span> <span class="variable">anim</span> <span class="operator">=</span> ObjectAnimator.ofFloat(view, <span class="string">&quot;rotationY&quot;</span>, <span class="number">180</span>);</span><br><span class="line">anim.addListener(<span class="keyword">new</span> <span class="title class_">AnimatorListenerAdapter</span>() &#123;</span><br><span class="line">    <span class="meta">@Override</span></span><br><span class="line">    <span class="keyword">public</span> <span class="keyword">void</span> <span class="title function_">onAnimationEnd</span><span class="params">(Animator animation)</span> &#123;</span><br><span class="line">        view.setLayerType(View.LAYER_TYPE_NONE, <span class="literal">null</span>);</span><br><span class="line">    &#125;</span><br><span class="line">&#125;);</span><br><span class="line">anim.start();</span><br></pre></td></tr></table></figure><p>Due to the characteristics of Hardware Layer, during the property animation (alpha, translation, scale, rotation), only the View’s properties are updated, without destroying and rebuilding the FBO every frame, so its animation performance will be greatly improved. Of course, note that during the property animation (for example, in the AnimationUpdate callback), you should not do other things besides the above property updates, such as adding&#x2F;removing child Views, modifying the View’s display content, etc., as this will make the FBO ineffective and instead make the performance worse.</p><h2 id="Summary-1"><a href="#Summary-1" class="headerlink" title="Summary"></a>Summary</h2><ol><li><p>From the description of Hardware Layer and Software Layer above, we can see that Software Layer is a supplement to Hardware Layer. If the app is in a situation where it cannot use Hardware Layer, then Software Layer will come into play. Implementations of APIs not supported by Hardware Layer also need to use Software Layer to achieve.</p></li><li><p>Both Software Layer and Hardware Layer can perform operations on Views, such as color filters, blending modes, etc.</p></li><li><p>Both Software Layer and Hardware Layer are helpful for the performance of alpha, translation, scale, rotation, and pivot property animations. This is also the most frequent optimization for Software Layer and Hardware Layer use (which is what we commonly say: when doing the above animations, set this View’s LayerType to <code>LAYER_TYPE_HARDWARE</code> before the animation starts, and reset the layerType to <code>LAYER_TYPE_NONE</code> after the animation ends. The reason for setting it back is that Hardware Layer uses Video Memory, and after setting it to NONE, this part of the memory used will be reclaimed).</p></li></ol><hr><h1 id="Performance-Problem-Cases-Caused-by-Incorrect-LayerType-Usage"><a href="#Performance-Problem-Cases-Caused-by-Incorrect-LayerType-Usage" class="headerlink" title="Performance Problem Cases Caused by Incorrect LayerType Usage"></a>Performance Problem Cases Caused by Incorrect LayerType Usage</h1><h2 id="Performance-Problems-Caused-by-Incorrect-Software-Layer-Usage"><a href="#Performance-Problems-Caused-by-Incorrect-Software-Layer-Usage" class="headerlink" title="Performance Problems Caused by Incorrect Software Layer Usage"></a>Performance Problems Caused by Incorrect Software Layer Usage</h2><p>When looking at Trace, this situation often appears. We know that the Software Layer generation process essentially creates a Bitmap Cache. The generation of this Cache is very time-consuming. From the Trace below, you can also see that every frame takes longer than one Vsync period.</p><p>The reason why every frame in the Trace below calls <code>buildDrawingCache/SW</code> is that during every frame process, the View’s content was updated, causing the Cache to become invalid. So every frame triggers the destruction of the Cache and rebuilding of the Cache, causing the interface scrolling to stutter.</p><p>The Trace below is the situation of scrolling large images in WeChat Moments. <a href="https://github.com/Gracker/Android_HardwareLayer_Example/blob/master/Systrace/%E4%BD%8D%E6%AD%A3%E7%A1%AE%E4%BD%BF%E7%94%A8SoftwareLayer%E7%A4%BE%E4%BE%8B-%E5%BE%AE%E4%BF%A1%E6%BB%91%E5%8A%A8%E5%8D%8D%E9%A1%BF.html">Trace can be downloaded on GitHub</a></p><p><img src="/en/images/15642082974929.jpg" alt="WeChat Moments Trace"></p><p>Let’s zoom in to see. Every frame is doing a buildDrawingCache operation, indicating that every frame’s cache has become invalid and is being destroyed and rebuilt. The performance is extremely poor, and the stuttering sensation during scrolling is very severe.</p><p><img src="/en/images/15642083215860.jpg" alt="WeChat Moments Zoomed"></p><h3 id="Code-Flow"><a href="#Code-Flow" class="headerlink" title="Code Flow"></a>Code Flow</h3><p>Let’s briefly look at the code flow of <code>LAYER_TYPE_HARDWARE</code>. For a detailed flow, you can look at the recommended articles above.</p><figure class="highlight java"><table><tr><td class="gutter"><pre><span class="line">1</span><br><span class="line">2</span><br><span class="line">3</span><br><span class="line">4</span><br><span class="line">5</span><br><span class="line">6</span><br><span class="line">7</span><br><span class="line">8</span><br><span class="line">9</span><br><span class="line">10</span><br><span class="line">11</span><br><span class="line">12</span><br><span class="line">13</span><br><span class="line">14</span><br><span class="line">15</span><br><span class="line">16</span><br><span class="line">17</span><br></pre></td><td class="code"><pre><span class="line">buildLayer -&gt; buildDrawingCache -&gt; buildDrawingCacheImpl</span><br><span class="line"></span><br><span class="line"><span class="keyword">public</span> <span class="keyword">void</span> <span class="title function_">buildLayer</span><span class="params">()</span> &#123;</span><br><span class="line">    <span class="keyword">if</span> (mLayerType == LAYER_TYPE_NONE) <span class="keyword">return</span>;</span><br><span class="line">    ......</span><br><span class="line">    <span class="keyword">switch</span> (mLayerType) &#123;</span><br><span class="line">        <span class="keyword">case</span> LAYER_TYPE_HARDWARE:  <span class="comment">// Hardware rendering</span></span><br><span class="line">            updateDisplayListIfDirty();</span><br><span class="line">            <span class="keyword">if</span> (attachInfo.mThreadedRenderer != <span class="literal">null</span> &amp;&amp; mRenderNode.isValid()) &#123;</span><br><span class="line">                attachInfo.mThreadedRenderer.buildLayer(mRenderNode);</span><br><span class="line">            &#125;</span><br><span class="line">            <span class="keyword">break</span>;</span><br><span class="line">        <span class="keyword">case</span> LAYER_TYPE_SOFTWARE:</span><br><span class="line">            buildDrawingCache(<span class="literal">true</span>);  <span class="comment">// Software rendering</span></span><br><span class="line">            <span class="keyword">break</span>;</span><br><span class="line">    &#125;</span><br><span class="line">&#125;</span><br></pre></td></tr></table></figure><p>The implementation of <code>buildDrawingCache</code> can be seen where the corresponding Trace is printed:</p><figure class="highlight java"><table><tr><td class="gutter"><pre><span class="line">1</span><br><span class="line">2</span><br><span class="line">3</span><br><span class="line">4</span><br><span class="line">5</span><br><span class="line">6</span><br><span class="line">7</span><br><span class="line">8</span><br><span class="line">9</span><br><span class="line">10</span><br><span class="line">11</span><br><span class="line">12</span><br><span class="line">13</span><br><span class="line">14</span><br></pre></td><td class="code"><pre><span class="line"><span class="keyword">public</span> <span class="keyword">void</span> <span class="title function_">buildDrawingCache</span><span class="params">(<span class="type">boolean</span> autoScale)</span> &#123;</span><br><span class="line">    <span class="keyword">if</span> ((mPrivateFlags &amp; PFLAG_DRAWING_CACHE_VALID) == <span class="number">0</span> || (autoScale ?</span><br><span class="line">            mDrawingCache == <span class="literal">null</span> : mUnscaledDrawingCache == <span class="literal">null</span>)) &#123;</span><br><span class="line">        <span class="keyword">if</span> (Trace.isTagEnabled(Trace.TRACE_TAG_VIEW)) &#123;</span><br><span class="line">            Trace.traceBegin(Trace.TRACE_TAG_VIEW,</span><br><span class="line">                    <span class="string">&quot;buildDrawingCache/SW Layer for &quot;</span> + getClass().getSimpleName());</span><br><span class="line">        &#125;</span><br><span class="line">        <span class="keyword">try</span> &#123;</span><br><span class="line">            buildDrawingCacheImpl(autoScale);</span><br><span class="line">        &#125; <span class="keyword">finally</span> &#123;</span><br><span class="line">            Trace.traceEnd(Trace.TRACE_TAG_VIEW);</span><br><span class="line">        &#125;</span><br><span class="line">    &#125;</span><br><span class="line">&#125;</span><br></pre></td></tr></table></figure><h2 id="Performance-Problems-Caused-by-Incorrect-Hardware-Layer-Usage"><a href="#Performance-Problems-Caused-by-Incorrect-Hardware-Layer-Usage" class="headerlink" title="Performance Problems Caused by Incorrect Hardware Layer Usage"></a>Performance Problems Caused by Incorrect Hardware Layer Usage</h2><p>Incorrect use of Hardware Layer and incorrect use of Software Layer can cause the same performance problems. For example, in the following scenario (desktop opening a folder), due to implementation issues by the developer, multiple folder icons were all set to the Hardware LayerType, causing the RenderThread to be very time-consuming. Moreover, because the content in each frame was changing, every frame’s Hardware Layer became invalid, was destroyed and then rebuilt. So this resulted in the situation shown in the Systrace below.</p><p><a href="https://github.com/Gracker/Android_HardwareLayer_Example/blob/master/Systrace/%E4%BD%8D%E6%AD%A3%E7%A1%AE%E4%BD%BF%E7%94%A8HardwareLayer%E7%A4%BE%E4%BE%8B-%E6%A1%8C%E9%9D%A2%E6%96%87%E4%BB%B6%E5%A4%B9%E6%89%93%E5%BC%80.html">Trace can be downloaded on GitHub</a></p><p><img src="/en/images/15642083692800.jpg" alt="Desktop Folder Trace"></p><p>Let’s zoom in on one frame of the RenderThread to look at.</p><p><img src="/en/images/15642083808990.jpg" alt="RenderThread Zoomed"></p><h2 id="Debugging-Tools"><a href="#Debugging-Tools" class="headerlink" title="Debugging Tools"></a>Debugging Tools</h2><p>We can use the tool in Settings - Accessibility - Developer Options - Show hardware layers updates to track performance problems caused by hardware layer updates.</p><p>When a View renders a Hardware Layer, the entire interface will flash green. Under normal circumstances, it should flash green once when the animation starts (that is, when the Layer rendering is initialized), and there should be no green appearance during subsequent animations. If your View stays green continuously during the entire animation, this is a continuous cache invalidation problem.</p><p>You can also discover the same problem by looking at the Systrace. The two tools can be used together to discover animation performance problems early.</p><h2 id="Summary-2"><a href="#Summary-2" class="headerlink" title="Summary"></a>Summary</h2><ol><li>Remember the usage scenarios for LayerType: View doing alpha, translation, scale, rotation property animations.</li><li>When doing animations, if possible, try to use Hardware Layer more. Remember to set it to None after use. Only consider using Software Layer if there are APIs that the hardware layer doesn’t support.</li><li>If you use <code>setAlpha()</code>, <code>AlphaAnimation</code>, or <code>ObjectAnimator</code> to set the View’s transparency, it will go through an off-screen buffer by default. So if the View you’re operating on is relatively large, you can also set this View’s Type to <code>LAYER_TYPE_HARDWARE</code> (official suggestion).</li><li>In some cases, Hardware Layer might actually need to do a lot of work, not just rendering the view. Caching a layer takes time because this step is divided into two processes: first, the view is rendered into a layer on the GPU, and then, the GPU renders that layer to the window. If the View’s rendering is very simple (for example, a solid color), then setting up a Hardware Layer during initialization might add unnecessary overhead.</li><li>For all caches, there’s a possibility of cache invalidation. When the animation is running, if some place calls <code>View.invalidate()</code>, then the Layer will have to be rendered again from scratch. If it’s continuously invalidated, your Hardware Layer will actually perform worse than not adding any Layer at all (the example below can verify this), because Hardware Layer adds overhead when setting up the cache. If you continuously re-cache the Layer, it will cause a huge burden on performance (the more complex the View doing the animation, the heavier the burden).</li></ol><hr><h1 id="Examples-of-LayerType’s-Impact-on-Animation-Performance"><a href="#Examples-of-LayerType’s-Impact-on-Animation-Performance" class="headerlink" title="Examples of LayerType’s Impact on Animation Performance"></a>Examples of LayerType’s Impact on Animation Performance</h1><h2 id="Example"><a href="#Example" class="headerlink" title="Example"></a>Example</h2><h3 id="Code"><a href="#Code" class="headerlink" title="Code"></a>Code</h3><p>To illustrate the situation mentioned above, let’s use a small example to demonstrate the performance performance under various situations. The code is very simple (code project address: <a href="https://github.com/Gracker/Android_HardwareLayer_Example">https://github.com/Gracker/Android_HardwareLayer_Example</a>). The project’s Systrace folder contains all the examples involved in this article (these are good things, worth collecting).</p><ol><li>Two TextViews: one responsible for starting the animation, one responsible for doing the animation.</li><li>Animation types include <code>TRANSLATION_X</code>, <code>ALPHA</code>, <code>TRANSLATION_Y</code>, <code>SCALE_X</code>, <code>SCALE_Y</code>.</li><li>We will control <code>AnimatorListener</code> and <code>AnimatorUpdateListener</code> to make the animation implementation different:<ol><li>In <code>onAnimationStart</code> and <code>onAnimationEnd</code>, mainly set whether to enable <code>LAYER_TYPE_HARDWARE</code> or <code>LAYER_TYPE_SOFTWARE</code>.</li><li>In <code>onAnimationUpdate</code>, mainly demonstrate what impact it causes if the View’s content is changed during the animation process.</li></ol></li></ol><figure class="highlight java"><table><tr><td class="gutter"><pre><span class="line">1</span><br><span class="line">2</span><br><span class="line">3</span><br><span class="line">4</span><br><span class="line">5</span><br><span class="line">6</span><br><span class="line">7</span><br><span class="line">8</span><br><span class="line">9</span><br><span class="line">10</span><br><span class="line">11</span><br><span class="line">12</span><br><span class="line">13</span><br><span class="line">14</span><br><span class="line">15</span><br><span class="line">16</span><br><span class="line">17</span><br><span class="line">18</span><br><span class="line">19</span><br><span class="line">20</span><br><span class="line">21</span><br><span class="line">22</span><br><span class="line">23</span><br><span class="line">24</span><br><span class="line">25</span><br><span class="line">26</span><br><span class="line">27</span><br><span class="line">28</span><br><span class="line">29</span><br><span class="line">30</span><br><span class="line">31</span><br><span class="line">32</span><br><span class="line">33</span><br><span class="line">34</span><br><span class="line">35</span><br><span class="line">36</span><br><span class="line">37</span><br><span class="line">38</span><br></pre></td><td class="code"><pre><span class="line"><span class="comment">// Set up animation</span></span><br><span class="line">animatorSet = <span class="keyword">new</span> <span class="title class_">AnimatorSet</span>();</span><br><span class="line">objectAnimator1 = ObjectAnimator.ofFloat(animationText, View.TRANSLATION_X, <span class="number">150</span>);</span><br><span class="line">objectAnimator2 = ObjectAnimator.ofFloat(animationText, View.ALPHA, <span class="number">0</span>);</span><br><span class="line">objectAnimator3 = ObjectAnimator.ofFloat(animationText, View.TRANSLATION_Y, <span class="number">150</span>);</span><br><span class="line">objectAnimator4 = ObjectAnimator.ofFloat(animationText, View.SCALE_X, <span class="number">150</span>);</span><br><span class="line">objectAnimator5 = ObjectAnimator.ofFloat(animationText, View.SCALE_Y, <span class="number">150</span>);</span><br><span class="line">animatorSet.playTogether(objectAnimator1, objectAnimator2, objectAnimator3, objectAnimator4, objectAnimator5);</span><br><span class="line">animatorSet.setDuration(<span class="number">500</span>);</span><br><span class="line"></span><br><span class="line"><span class="comment">// Add animation listener</span></span><br><span class="line">objectAnimator1.addListener(<span class="keyword">new</span> <span class="title class_">Animator</span>.AnimatorListener() &#123;</span><br><span class="line">    <span class="meta">@Override</span></span><br><span class="line">    <span class="keyword">public</span> <span class="keyword">void</span> <span class="title function_">onAnimationStart</span><span class="params">(Animator animator)</span> &#123;</span><br><span class="line">        animationText.setLayerType(View.LAYER_TYPE_HARDWARE, <span class="literal">null</span>);</span><br><span class="line">        <span class="comment">// animationText.setLayerType(View.LAYER_TYPE_SOFTWARE, null);</span></span><br><span class="line">    &#125;</span><br><span class="line"></span><br><span class="line">    <span class="meta">@Override</span></span><br><span class="line">    <span class="keyword">public</span> <span class="keyword">void</span> <span class="title function_">onAnimationEnd</span><span class="params">(Animator animator)</span> &#123;</span><br><span class="line">        animationText.setLayerType(View.LAYER_TYPE_NONE, <span class="literal">null</span>);</span><br><span class="line">    &#125;</span><br><span class="line">&#125;);</span><br><span class="line"></span><br><span class="line">objectAnimator1.addUpdateListener(<span class="keyword">new</span> <span class="title class_">ValueAnimator</span>.AnimatorUpdateListener() &#123;</span><br><span class="line">    <span class="meta">@Override</span></span><br><span class="line">    <span class="keyword">public</span> <span class="keyword">void</span> <span class="title function_">onAnimationUpdate</span><span class="params">(ValueAnimator valueAnimator)</span> &#123;</span><br><span class="line">        <span class="comment">// text.setText(String.format(&quot;%s%d&quot;, text.getText().toString(), i));</span></span><br><span class="line">        <span class="comment">// i++;</span></span><br><span class="line">    &#125;</span><br><span class="line">&#125;);</span><br><span class="line"><span class="comment">// Start animation</span></span><br><span class="line">startText.setOnClickListener(<span class="keyword">new</span> <span class="title class_">View</span>.OnClickListener() &#123;</span><br><span class="line">    <span class="meta">@Override</span></span><br><span class="line">    <span class="keyword">public</span> <span class="keyword">void</span> <span class="title function_">onClick</span><span class="params">(View view)</span> &#123;</span><br><span class="line">        animatorSet.start();</span><br><span class="line">    &#125;</span><br><span class="line">&#125;);</span><br></pre></td></tr></table></figure><h3 id="Statistics-Tool-GFXInfo"><a href="#Statistics-Tool-GFXInfo" class="headerlink" title="Statistics Tool: GFXInfo"></a>Statistics Tool: GFXInfo</h3><p>To get accurate data, we use the data obtained from gfxinfo for comparison (adb shell dumpsys gfxinfo).</p><p><img src="/en/images/15642085055284.jpg" alt="GFXInfo Example"></p><p>The gfxInfo records the duration of each frame. We focus on the following indicators:</p><ol><li><strong>Janky Frames</strong>: Number of frames exceeding 16ms (exceeding 16ms doesn’t necessarily cause stuttering, but it increases the risk of stuttering situations occurring).</li><li><strong>Duration frame statistics</strong>: You can see the intervals of most frames, as well as the maximum duration.</li></ol><h2 id="Case-1-Normal-Layer-No-Dynamic-View-Content-Update"><a href="#Case-1-Normal-Layer-No-Dynamic-View-Content-Update" class="headerlink" title="Case 1: Normal Layer + No Dynamic View Content Update"></a>Case 1: Normal Layer + No Dynamic View Content Update</h2><h3 id="Code-1"><a href="#Code-1" class="headerlink" title="Code"></a>Code</h3><figure class="highlight java"><table><tr><td class="gutter"><pre><span class="line">1</span><br><span class="line">2</span><br><span class="line">3</span><br><span class="line">4</span><br><span class="line">5</span><br><span class="line">6</span><br><span class="line">7</span><br><span class="line">8</span><br><span class="line">9</span><br><span class="line">10</span><br><span class="line">11</span><br><span class="line">12</span><br><span class="line">13</span><br><span class="line">14</span><br><span class="line">15</span><br><span class="line">16</span><br><span class="line">17</span><br></pre></td><td class="code"><pre><span class="line">AnimatorListener and AnimatorUpdateListener are not overridden, as follows, everything inside the functions is commented out.</span><br><span class="line"></span><br><span class="line">objectAnimator1.addListener(<span class="keyword">new</span> <span class="title class_">Animator</span>.AnimatorListener() &#123;</span><br><span class="line">    <span class="meta">@Override</span></span><br><span class="line">    <span class="keyword">public</span> <span class="keyword">void</span> <span class="title function_">onAnimationStart</span><span class="params">(Animator animator)</span> &#123;</span><br><span class="line">    &#125;</span><br><span class="line"></span><br><span class="line">    <span class="meta">@Override</span></span><br><span class="line">    <span class="keyword">public</span> <span class="keyword">void</span> <span class="title function_">onAnimationEnd</span><span class="params">(Animator animator)</span> &#123;</span><br><span class="line">    &#125;</span><br><span class="line">&#125;);</span><br><span class="line"></span><br><span class="line">objectAnimator1.addUpdateListener(<span class="keyword">new</span> <span class="title class_">ValueAnimator</span>.AnimatorUpdateListener() &#123;</span><br><span class="line">    <span class="meta">@Override</span></span><br><span class="line">    <span class="keyword">public</span> <span class="keyword">void</span> <span class="title function_">onAnimationUpdate</span><span class="params">(ValueAnimator valueAnimator)</span> &#123;</span><br><span class="line">    &#125;</span><br><span class="line">&#125;);</span><br></pre></td></tr></table></figure><h3 id="Systrace-Phenomenon"><a href="#Systrace-Phenomenon" class="headerlink" title="Systrace Phenomenon"></a>Systrace Phenomenon</h3><p>You can see that there are some yellow frames, and the <code>flush commands</code> method in the render thread executes for a relatively long time. <a href="https://github.com/Gracker/Android_HardwareLayer_Example/blob/master/Systrace/Normal_Layer.html">Download Systrace</a></p><p><img src="/en/images/15642085469278.jpg" alt="Normal Layer Trace"></p><h3 id="gfxInfo-Data"><a href="#gfxInfo-Data" class="headerlink" title="gfxInfo Data"></a>gfxInfo Data</h3><p>You can see that the Janky Frames ratio is 46%, 99th percentile: 32ms, indicating that the performance is relatively poor. At the same time, Number High input latency &#x3D; 30, indicating that the main thread’s load is relatively high.</p><figure class="highlight java"><table><tr><td class="gutter"><pre><span class="line">1</span><br><span class="line">2</span><br><span class="line">3</span><br><span class="line">4</span><br><span class="line">5</span><br><span class="line">6</span><br><span class="line">7</span><br><span class="line">8</span><br><span class="line">9</span><br><span class="line">10</span><br><span class="line">11</span><br><span class="line">12</span><br><span class="line">13</span><br></pre></td><td class="code"><pre><span class="line">Total frames rendered: <span class="number">30</span></span><br><span class="line">Janky frames: <span class="number">14</span> (<span class="number">46.67</span>%)</span><br><span class="line">50th percentile: 16ms</span><br><span class="line">90th percentile: 29ms</span><br><span class="line">95th percentile: 32ms</span><br><span class="line">99th percentile: 32ms</span><br><span class="line">Number Missed Vsync: <span class="number">0</span></span><br><span class="line">Number High input latency: <span class="number">30</span></span><br><span class="line">Number Slow UI thread: <span class="number">0</span></span><br><span class="line">Number Slow bitmap uploads: <span class="number">0</span></span><br><span class="line">Number Slow issue draw commands: <span class="number">0</span></span><br><span class="line">Number Frame deadline missed: <span class="number">0</span></span><br><span class="line">HISTOGRAM: 5ms=<span class="number">0</span> 6ms=<span class="number">0</span> 7ms=<span class="number">0</span> 8ms=<span class="number">0</span> 9ms=<span class="number">0</span> 10ms=<span class="number">2</span> 11ms=<span class="number">2</span> 12ms=<span class="number">5</span> 13ms=<span class="number">1</span> 14ms=<span class="number">2</span> 15ms=<span class="number">1</span> 16ms=<span class="number">3</span> 17ms=<span class="number">2</span> 18ms=<span class="number">0</span> 19ms=<span class="number">0</span> 20ms=<span class="number">0</span> 21ms=<span class="number">1</span> 22ms=<span class="number">1</span> 23ms=<span class="number">1</span> 24ms=<span class="number">1</span> 25ms=<span class="number">2</span> 26ms=<span class="number">2</span> 27ms=<span class="number">0</span> 28ms=<span class="number">1</span> 29ms=<span class="number">1</span> 30ms=<span class="number">0</span> 31ms=<span class="number">0</span> 32ms=<span class="number">2</span> 34ms=<span class="number">0</span> 36ms=<span class="number">0</span> 38ms=<span class="number">0</span> 40ms=<span class="number">0</span></span><br></pre></td></tr></table></figure><h2 id="Case-2-Software-Layer-No-Dynamic-View-Content-Update"><a href="#Case-2-Software-Layer-No-Dynamic-View-Content-Update" class="headerlink" title="Case 2: Software Layer + No Dynamic View Content Update"></a>Case 2: Software Layer + No Dynamic View Content Update</h2><h3 id="Code-2"><a href="#Code-2" class="headerlink" title="Code"></a>Code</h3><figure class="highlight java"><table><tr><td class="gutter"><pre><span class="line">1</span><br><span class="line">2</span><br><span class="line">3</span><br><span class="line">4</span><br><span class="line">5</span><br><span class="line">6</span><br><span class="line">7</span><br><span class="line">8</span><br><span class="line">9</span><br><span class="line">10</span><br><span class="line">11</span><br><span class="line">12</span><br><span class="line">13</span><br><span class="line">14</span><br><span class="line">15</span><br><span class="line">16</span><br><span class="line">17</span><br><span class="line">18</span><br></pre></td><td class="code"><pre><span class="line">objectAnimator1.addListener(<span class="keyword">new</span> <span class="title class_">Animator</span>.AnimatorListener() &#123;</span><br><span class="line">    <span class="meta">@Override</span></span><br><span class="line">    <span class="keyword">public</span> <span class="keyword">void</span> <span class="title function_">onAnimationStart</span><span class="params">(Animator animator)</span> &#123;</span><br><span class="line">        animationText.setLayerType(View.LAYER_TYPE_SOFTWARE, <span class="literal">null</span>);</span><br><span class="line">    &#125;</span><br><span class="line"></span><br><span class="line">    <span class="meta">@Override</span></span><br><span class="line">    <span class="keyword">public</span> <span class="keyword">void</span> <span class="title function_">onAnimationEnd</span><span class="params">(Animator animator)</span> &#123;</span><br><span class="line">        animationText.setLayerType(View.LAYER_TYPE_NONE, <span class="literal">null</span>);</span><br><span class="line">        i = <span class="number">0</span>;</span><br><span class="line">    &#125;</span><br><span class="line">&#125;);</span><br><span class="line"></span><br><span class="line">objectAnimator1.addUpdateListener(<span class="keyword">new</span> <span class="title class_">ValueAnimator</span>.AnimatorUpdateListener() &#123;</span><br><span class="line">    <span class="meta">@Override</span></span><br><span class="line">    <span class="keyword">public</span> <span class="keyword">void</span> <span class="title function_">onAnimationUpdate</span><span class="params">(ValueAnimator valueAnimator)</span> &#123;</span><br><span class="line">    &#125;</span><br><span class="line">&#125;);</span><br></pre></td></tr></table></figure><h3 id="Systrace-Phenomenon-1"><a href="#Systrace-Phenomenon-1" class="headerlink" title="Systrace Phenomenon"></a>Systrace Phenomenon</h3><p>The first frame executes <code>buildDrawingCache/SW Layer for AppCompatTextView</code>, and in the subsequent property animations, this method is not executed anymore. You can see that all frames during the animation are green, indicating that the performance is very good. <a href="https://github.com/Gracker/Android_HardwareLayer_Example/blob/master/Systrace/Software_Layer.html">Download Systrace</a></p><p><img src="/en/images/15642086306643.jpg" alt="Software Layer Trace"></p><h3 id="gfxInfo-Data-1"><a href="#gfxInfo-Data-1" class="headerlink" title="gfxInfo Data"></a>gfxInfo Data</h3><p>You can see that the Janky Frames ratio is 3%, 99th percentile: 16ms, indicating that the performance is very good. At the same time, Number High input latency &#x3D; 0, indicating that the main thread’s load is relatively low.</p><figure class="highlight java"><table><tr><td class="gutter"><pre><span class="line">1</span><br><span class="line">2</span><br><span class="line">3</span><br><span class="line">4</span><br><span class="line">5</span><br><span class="line">6</span><br><span class="line">7</span><br><span class="line">8</span><br><span class="line">9</span><br><span class="line">10</span><br><span class="line">11</span><br><span class="line">12</span><br><span class="line">13</span><br></pre></td><td class="code"><pre><span class="line">Total frames rendered: <span class="number">31</span></span><br><span class="line">Janky frames: <span class="number">1</span> (<span class="number">3.23</span>%)</span><br><span class="line">50th percentile: 9ms</span><br><span class="line">90th percentile: 12ms</span><br><span class="line">95th percentile: 16ms</span><br><span class="line">99th percentile: 16ms</span><br><span class="line">Number Missed Vsync: <span class="number">0</span></span><br><span class="line">Number High input latency: <span class="number">0</span></span><br><span class="line">Number Slow UI thread: <span class="number">1</span></span><br><span class="line">Number Slow bitmap uploads: <span class="number">0</span></span><br><span class="line">Number Slow issue draw commands: <span class="number">0</span></span><br><span class="line">Number Frame deadline missed: <span class="number">1</span></span><br><span class="line">HISTOGRAM: 5ms=<span class="number">2</span> 6ms=<span class="number">2</span> 7ms=<span class="number">4</span> 8ms=<span class="number">3</span> 9ms=<span class="number">5</span> 10ms=<span class="number">11</span> 11ms=<span class="number">0</span> 12ms=<span class="number">1</span> 13ms=<span class="number">0</span> 14ms=<span class="number">1</span> 15ms=<span class="number">0</span> 16ms=<span class="number">2</span> 17ms=<span class="number">0</span> 18ms=<span class="number">0</span> 19ms=<span class="number">0</span> 20ms=<span class="number">0</span> 21ms=<span class="number">0</span> 22ms=<span class="number">0</span> 23ms=<span class="number">0</span> 24ms=<span class="number">0</span> 25ms=<span class="number">0</span> 26ms=<span class="number">0</span> 27ms=<span class="number">0</span> 28ms=<span class="number">0</span> 29ms=<span class="number">0</span> 30ms=<span class="number">0</span> 31ms=<span class="number">0</span> 32ms=<span class="number">0</span> 34ms=<span class="number">0</span> 36ms=<span class="number">0</span> 38ms=<span class="number">0</span> 40ms=<span class="number">0</span></span><br></pre></td></tr></table></figure><h2 id="Case-3-Hardware-Layer-No-Dynamic-View-Content-Update"><a href="#Case-3-Hardware-Layer-No-Dynamic-View-Content-Update" class="headerlink" title="Case 3: Hardware Layer + No Dynamic View Content Update"></a>Case 3: Hardware Layer + No Dynamic View Content Update</h2><h3 id="Code-3"><a href="#Code-3" class="headerlink" title="Code"></a>Code</h3><figure class="highlight java"><table><tr><td class="gutter"><pre><span class="line">1</span><br><span class="line">2</span><br><span class="line">3</span><br><span class="line">4</span><br><span class="line">5</span><br><span class="line">6</span><br><span class="line">7</span><br><span class="line">8</span><br><span class="line">9</span><br><span class="line">10</span><br><span class="line">11</span><br><span class="line">12</span><br><span class="line">13</span><br><span class="line">14</span><br><span class="line">15</span><br><span class="line">16</span><br><span class="line">17</span><br></pre></td><td class="code"><pre><span class="line">objectAnimator1.addListener(<span class="keyword">new</span> <span class="title class_">Animator</span>.AnimatorListener() &#123;</span><br><span class="line">    <span class="meta">@Override</span></span><br><span class="line">    <span class="keyword">public</span> <span class="keyword">void</span> <span class="title function_">onAnimationStart</span><span class="params">(Animator animator)</span> &#123;</span><br><span class="line">        animationText.setLayerType(View.LAYER_TYPE_HARDWARE, <span class="literal">null</span>);</span><br><span class="line">    &#125;</span><br><span class="line"></span><br><span class="line">    <span class="meta">@Override</span></span><br><span class="line">    <span class="keyword">public</span> <span class="keyword">void</span> <span class="title function_">onAnimationEnd</span><span class="params">(Animator animator)</span> &#123;</span><br><span class="line">        animationText.setLayerType(View.LAYER_TYPE_NONE, <span class="literal">null</span>);</span><br><span class="line">    &#125;</span><br><span class="line">&#125;);</span><br><span class="line"></span><br><span class="line">objectAnimator1.addUpdateListener(<span class="keyword">new</span> <span class="title class_">ValueAnimator</span>.AnimatorUpdateListener() &#123;</span><br><span class="line">    <span class="meta">@Override</span></span><br><span class="line">    <span class="keyword">public</span> <span class="keyword">void</span> <span class="title function_">onAnimationUpdate</span><span class="params">(ValueAnimator valueAnimator)</span> &#123;</span><br><span class="line">    &#125;</span><br><span class="line">&#125;);</span><br></pre></td></tr></table></figure><h3 id="Systrace-Phenomenon-2"><a href="#Systrace-Phenomenon-2" class="headerlink" title="Systrace Phenomenon"></a>Systrace Phenomenon</h3><p>You can see that during the animation process, all frames are green, indicating that the performance is very good. <a href="https://github.com/Gracker/Android_HardwareLayer_Example/blob/master/Systrace/Hardware_Layer.html">Download Systrace</a></p><p><img src="/en/images/15642086995840.jpg" alt="Hardware Layer Trace"></p><h3 id="gfxInfo-Data-2"><a href="#gfxInfo-Data-2" class="headerlink" title="gfxInfo Data"></a>gfxInfo Data</h3><p>You can see that the Janky Frames ratio is 0%, 99th percentile: 14ms, indicating that the performance is very good. At the same time, Number High input latency &#x3D; 0, indicating that the main thread’s load is very low.</p><figure class="highlight java"><table><tr><td class="gutter"><pre><span class="line">1</span><br><span class="line">2</span><br><span class="line">3</span><br><span class="line">4</span><br><span class="line">5</span><br><span class="line">6</span><br><span class="line">7</span><br><span class="line">8</span><br><span class="line">9</span><br><span class="line">10</span><br><span class="line">11</span><br><span class="line">12</span><br><span class="line">13</span><br></pre></td><td class="code"><pre><span class="line">Total frames rendered: <span class="number">31</span></span><br><span class="line">Janky frames: <span class="number">0</span> (<span class="number">0.00</span>%)</span><br><span class="line">50th percentile: 7ms</span><br><span class="line">90th percentile: 9ms</span><br><span class="line">95th percentile: 12ms</span><br><span class="line">99th percentile: 14ms</span><br><span class="line">Number Missed Vsync: <span class="number">0</span></span><br><span class="line">Number High input latency: <span class="number">0</span></span><br><span class="line">Number Slow UI thread: <span class="number">0</span></span><br><span class="line">Number Slow bitmap uploads: <span class="number">0</span></span><br><span class="line">Number Slow issue draw commands: <span class="number">0</span></span><br><span class="line">Number Frame deadline missed: <span class="number">0</span></span><br><span class="line">HISTOGRAM: 5ms=<span class="number">3</span> 6ms=<span class="number">2</span> 7ms=<span class="number">15</span> 8ms=<span class="number">7</span> 9ms=<span class="number">2</span> 10ms=<span class="number">0</span> 11ms=<span class="number">0</span> 12ms=<span class="number">1</span> 13ms=<span class="number">0</span> 14ms=<span class="number">1</span> 15ms=<span class="number">0</span> 16ms=<span class="number">0</span> 17ms=<span class="number">0</span> 18ms=<span class="number">0</span> 19ms=<span class="number">0</span> 20ms=<span class="number">0</span> 21ms=<span class="number">0</span> 22ms=<span class="number">0</span> 23ms=<span class="number">0</span> 24ms=<span class="number">0</span> 25ms=<span class="number">0</span> 26ms=<span class="number">0</span> 27ms=<span class="number">0</span> 28ms=<span class="number">0</span> 29ms=<span class="number">0</span> 30ms=<span class="number">0</span> 31ms=<span class="number">0</span> 32ms=<span class="number">0</span> 34ms=<span class="number">0</span> 36ms=<span class="number">0</span> 38ms=<span class="number">0</span> 40ms=<span class="number">0</span></span><br></pre></td></tr></table></figure><h2 id="Case-4-Normal-Layer-Dynamic-View-Content-Update"><a href="#Case-4-Normal-Layer-Dynamic-View-Content-Update" class="headerlink" title="Case 4: Normal Layer + Dynamic View Content Update"></a>Case 4: Normal Layer + Dynamic View Content Update</h2><h3 id="Code-4"><a href="#Code-4" class="headerlink" title="Code"></a>Code</h3><figure class="highlight java"><table><tr><td class="gutter"><pre><span class="line">1</span><br><span class="line">2</span><br><span class="line">3</span><br><span class="line">4</span><br><span class="line">5</span><br><span class="line">6</span><br><span class="line">7</span><br><span class="line">8</span><br><span class="line">9</span><br><span class="line">10</span><br><span class="line">11</span><br><span class="line">12</span><br><span class="line">13</span><br><span class="line">14</span><br><span class="line">15</span><br><span class="line">16</span><br><span class="line">17</span><br><span class="line">18</span><br></pre></td><td class="code"><pre><span class="line">objectAnimator1.addListener(<span class="keyword">new</span> <span class="title class_">Animator</span>.AnimatorListener() &#123;</span><br><span class="line">    <span class="meta">@Override</span></span><br><span class="line">    <span class="keyword">public</span> <span class="keyword">void</span> <span class="title function_">onAnimationStart</span><span class="params">(Animator animator)</span> &#123;</span><br><span class="line">    &#125;</span><br><span class="line"></span><br><span class="line">    <span class="meta">@Override</span></span><br><span class="line">    <span class="keyword">public</span> <span class="keyword">void</span> <span class="title function_">onAnimationEnd</span><span class="params">(Animator animator)</span> &#123;</span><br><span class="line">        i = <span class="number">0</span>;</span><br><span class="line">    &#125;</span><br><span class="line">&#125;);</span><br><span class="line"></span><br><span class="line">objectAnimator1.addUpdateListener(<span class="keyword">new</span> <span class="title class_">ValueAnimator</span>.AnimatorUpdateListener() &#123;</span><br><span class="line">    <span class="meta">@Override</span></span><br><span class="line">    <span class="keyword">public</span> <span class="keyword">void</span> <span class="title function_">onAnimationUpdate</span><span class="params">(ValueAnimator valueAnimator)</span> &#123;</span><br><span class="line">        animationText.setText(String.format(<span class="string">&quot;%s%d&quot;</span>, animationText.getText().toString(), i));</span><br><span class="line">        i++;</span><br><span class="line">    &#125;</span><br><span class="line">&#125;);</span><br></pre></td></tr></table></figure><h3 id="Systrace-Phenomenon-3"><a href="#Systrace-Phenomenon-3" class="headerlink" title="Systrace Phenomenon"></a>Systrace Phenomenon</h3><p>You can see that during the animation process, there are some yellow frames, and some frames’ Animation, measure, layout, draw are relatively time-consuming. <a href="https://github.com/Gracker/Android_HardwareLayer_Example/blob/master/Systrace/Normal_Layer_UpdateView.html">Download Systrace</a></p><p><img src="/en/images/15642087831154.jpg" alt="Normal Layer Update Trace"></p><h3 id="gfxInfo-Data-3"><a href="#gfxInfo-Data-3" class="headerlink" title="gfxInfo Data"></a>gfxInfo Data</h3><p>You can see that the Janky Frames ratio is 38%, 99th percentile: 29ms, indicating that the performance is relatively poor. At the same time, Number High input latency &#x3D; 31, indicating that the main thread’s load is relatively high.</p><figure class="highlight java"><table><tr><td class="gutter"><pre><span class="line">1</span><br><span class="line">2</span><br><span class="line">3</span><br><span class="line">4</span><br><span class="line">5</span><br><span class="line">6</span><br><span class="line">7</span><br><span class="line">8</span><br><span class="line">9</span><br><span class="line">10</span><br><span class="line">11</span><br><span class="line">12</span><br><span class="line">13</span><br></pre></td><td class="code"><pre><span class="line">Total frames rendered: <span class="number">31</span></span><br><span class="line">Janky frames: <span class="number">12</span> (<span class="number">38.71</span>%)</span><br><span class="line">50th percentile: 14ms</span><br><span class="line">90th percentile: 25ms</span><br><span class="line">95th percentile: 29ms</span><br><span class="line">99th percentile: 29ms</span><br><span class="line">Number Missed Vsync: <span class="number">0</span></span><br><span class="line">Number High input latency: <span class="number">31</span></span><br><span class="line">Number Slow UI thread: <span class="number">0</span></span><br><span class="line">Number Slow bitmap uploads: <span class="number">0</span></span><br><span class="line">Number Slow issue draw commands: <span class="number">0</span></span><br><span class="line">Number Frame deadline missed: <span class="number">0</span></span><br><span class="line">HISTOGRAM: 5ms=<span class="number">0</span> 6ms=<span class="number">0</span> 7ms=<span class="number">1</span> 8ms=<span class="number">2</span> 9ms=<span class="number">4</span> 10ms=<span class="number">1</span> 11ms=<span class="number">1</span> 12ms=<span class="number">4</span> 13ms=<span class="number">2</span> 14ms=<span class="number">1</span> 15ms=<span class="number">2</span> 16ms=<span class="number">2</span> 17ms=<span class="number">1</span> 18ms=<span class="number">2</span> 19ms=<span class="number">0</span> 20ms=<span class="number">2</span> 21ms=<span class="number">1</span> 22ms=<span class="number">0</span> 23ms=<span class="number">0</span> 24ms=<span class="number">1</span> 25ms=<span class="number">1</span> 26ms=<span class="number">1</span> 27ms=<span class="number">0</span> 28ms=<span class="number">0</span> 29ms=<span class="number">2</span> 30ms=<span class="number">0</span> 31ms=<span class="number">0</span> 32ms=<span class="number">0</span> 34ms=<span class="number">0</span> 36ms=<span class="number">0</span> 38ms=<span class="number">0</span> 40ms=<span class="number">0</span></span><br></pre></td></tr></table></figure><h2 id="Case-5-Software-Layer-Dynamic-View-Content-Update"><a href="#Case-5-Software-Layer-Dynamic-View-Content-Update" class="headerlink" title="Case 5: Software Layer + Dynamic View Content Update"></a>Case 5: Software Layer + Dynamic View Content Update</h2><h3 id="Code-5"><a href="#Code-5" class="headerlink" title="Code"></a>Code</h3><figure class="highlight java"><table><tr><td class="gutter"><pre><span class="line">1</span><br><span class="line">2</span><br><span class="line">3</span><br><span class="line">4</span><br><span class="line">5</span><br><span class="line">6</span><br><span class="line">7</span><br><span class="line">8</span><br><span class="line">9</span><br><span class="line">10</span><br><span class="line">11</span><br><span class="line">12</span><br><span class="line">13</span><br><span class="line">14</span><br><span class="line">15</span><br><span class="line">16</span><br><span class="line">17</span><br><span class="line">18</span><br><span class="line">19</span><br><span class="line">20</span><br></pre></td><td class="code"><pre><span class="line">objectAnimator1.addListener(<span class="keyword">new</span> <span class="title class_">Animator</span>.AnimatorListener() &#123;</span><br><span class="line">    <span class="meta">@Override</span></span><br><span class="line">    <span class="keyword">public</span> <span class="keyword">void</span> <span class="title function_">onAnimationStart</span><span class="params">(Animator animator)</span> &#123;</span><br><span class="line">        animationText.setLayerType(View.LAYER_TYPE_SOFTWARE, <span class="literal">null</span>);</span><br><span class="line">    &#125;</span><br><span class="line"></span><br><span class="line">    <span class="meta">@Override</span></span><br><span class="line">    <span class="keyword">public</span> <span class="keyword">void</span> <span class="title function_">onAnimationEnd</span><span class="params">(Animator animator)</span> &#123;</span><br><span class="line">        animationText.setLayerType(View.LAYER_TYPE_NONE, <span class="literal">null</span>);</span><br><span class="line">        i = <span class="number">0</span>;</span><br><span class="line">    &#125;</span><br><span class="line">&#125;);</span><br><span class="line"></span><br><span class="line">objectAnimator1.addUpdateListener(<span class="keyword">new</span> <span class="title class_">ValueAnimator</span>.AnimatorUpdateListener() &#123;</span><br><span class="line">    <span class="meta">@Override</span></span><br><span class="line">    <span class="keyword">public</span> <span class="keyword">void</span> <span class="title function_">onAnimationUpdate</span><span class="params">(ValueAnimator valueAnimator)</span> &#123;</span><br><span class="line">        animationText.setText(String.format(<span class="string">&quot;%s%d&quot;</span>, animationText.getText().toString(), i));</span><br><span class="line">        i++;</span><br><span class="line">    &#125;</span><br><span class="line">&#125;);</span><br></pre></td></tr></table></figure><h3 id="Systrace-Phenomenon-4"><a href="#Systrace-Phenomenon-4" class="headerlink" title="Systrace Phenomenon"></a>Systrace Phenomenon</h3><p>Since the content is updated every frame, the Bitmap generated by <code>buildDrawingCache</code> every frame is destroyed and rebuilt. At this point, the bottleneck is all in the main thread. Because <code>buildDrawingCache</code> is executed every frame, the execution times for Animation and Draw are both very long. <a href="https://github.com/Gracker/Android_HardwareLayer_Example/blob/master/Systrace/Software_Layer_UpdateView.html">Download Systrace</a></p><p><img src="/en/images/15642088391947.jpg" alt="Software Layer Update Trace"></p><h3 id="gfxInfo-Data-4"><a href="#gfxInfo-Data-4" class="headerlink" title="gfxInfo Data"></a>gfxInfo Data</h3><p>You can see that the Janky Frames ratio is 41%, 99th percentile: 32ms, indicating that the performance is relatively poor. At the same time, Number High input latency &#x3D; 18, indicating that the main thread’s load is relatively high.</p><figure class="highlight java"><table><tr><td class="gutter"><pre><span class="line">1</span><br><span class="line">2</span><br><span class="line">3</span><br><span class="line">4</span><br><span class="line">5</span><br><span class="line">6</span><br><span class="line">7</span><br><span class="line">8</span><br><span class="line">9</span><br><span class="line">10</span><br><span class="line">11</span><br><span class="line">12</span><br><span class="line">13</span><br></pre></td><td class="code"><pre><span class="line">Total frames rendered: <span class="number">29</span></span><br><span class="line">Janky frames: <span class="number">12</span> (<span class="number">41.38</span>%)</span><br><span class="line">50th percentile: 14ms</span><br><span class="line">90th percentile: 30ms</span><br><span class="line">95th percentile: 31ms</span><br><span class="line">99th percentile: 32ms</span><br><span class="line">Number Missed Vsync: <span class="number">0</span></span><br><span class="line">Number High input latency: <span class="number">18</span></span><br><span class="line">Number Slow UI thread: <span class="number">4</span></span><br><span class="line">Number Slow bitmap uploads: <span class="number">0</span></span><br><span class="line">Number Slow issue draw commands: <span class="number">0</span></span><br><span class="line">Number Frame deadline missed: <span class="number">4</span></span><br><span class="line">HISTOGRAM: 5ms=<span class="number">0</span> 6ms=<span class="number">1</span> 7ms=<span class="number">0</span> 8ms=<span class="number">0</span> 9ms=<span class="number">0</span> 10ms=<span class="number">1</span> 11ms=<span class="number">6</span> 12ms=<span class="number">3</span> 13ms=<span class="number">2</span> 14ms=<span class="number">3</span> 15ms=<span class="number">0</span> 16ms=<span class="number">1</span> 17ms=<span class="number">1</span> 18ms=<span class="number">1</span> 19ms=<span class="number">2</span> 20ms=<span class="number">0</span> 21ms=<span class="number">1</span> 22ms=<span class="number">0</span> 23ms=<span class="number">0</span> 24ms=<span class="number">2</span> 25ms=<span class="number">1</span> 26ms=<span class="number">0</span> 27ms=<span class="number">1</span> 28ms=<span class="number">0</span> 29ms=<span class="number">0</span> 30ms=<span class="number">1</span> 31ms=<span class="number">1</span> 32ms=<span class="number">1</span> 34ms=<span class="number">0</span> 36ms=<span class="number">0</span> 38ms=<span class="number">0</span> 40ms=<span class="number">0</span></span><br></pre></td></tr></table></figure><h2 id="Case-6-Hardware-Layer-Dynamic-View-Content-Update"><a href="#Case-6-Hardware-Layer-Dynamic-View-Content-Update" class="headerlink" title="Case 6: Hardware Layer + Dynamic View Content Update"></a>Case 6: Hardware Layer + Dynamic View Content Update</h2><h3 id="Code-6"><a href="#Code-6" class="headerlink" title="Code"></a>Code</h3><figure class="highlight java"><table><tr><td class="gutter"><pre><span class="line">1</span><br><span class="line">2</span><br><span class="line">3</span><br><span class="line">4</span><br><span class="line">5</span><br><span class="line">6</span><br><span class="line">7</span><br><span class="line">8</span><br><span class="line">9</span><br><span class="line">10</span><br><span class="line">11</span><br><span class="line">12</span><br><span class="line">13</span><br><span class="line">14</span><br><span class="line">15</span><br><span class="line">16</span><br><span class="line">17</span><br><span class="line">18</span><br><span class="line">19</span><br><span class="line">20</span><br></pre></td><td class="code"><pre><span class="line">objectAnimator1.addListener(<span class="keyword">new</span> <span class="title class_">Animator</span>.AnimatorListener() &#123;</span><br><span class="line">    <span class="meta">@Override</span></span><br><span class="line">    <span class="keyword">public</span> <span class="keyword">void</span> <span class="title function_">onAnimationStart</span><span class="params">(Animator animator)</span> &#123;</span><br><span class="line">        animationText.setLayerType(View.LAYER_TYPE_HARDWARE, <span class="literal">null</span>);</span><br><span class="line">    &#125;</span><br><span class="line"></span><br><span class="line">    <span class="meta">@Override</span></span><br><span class="line">    <span class="keyword">public</span> <span class="keyword">void</span> <span class="title function_">onAnimationEnd</span><span class="params">(Animator animator)</span> &#123;</span><br><span class="line">        animationText.setLayerType(View.LAYER_TYPE_NONE, <span class="literal">null</span>);</span><br><span class="line">        i = <span class="number">0</span>;</span><br><span class="line">    &#125;</span><br><span class="line">&#125;);</span><br><span class="line"></span><br><span class="line">objectAnimator1.addUpdateListener(<span class="keyword">new</span> <span class="title class_">ValueAnimator</span>.AnimatorUpdateListener() &#123;</span><br><span class="line">    <span class="meta">@Override</span></span><br><span class="line">    <span class="keyword">public</span> <span class="keyword">void</span> <span class="title function_">onAnimationUpdate</span><span class="params">(ValueAnimator valueAnimator)</span> &#123;</span><br><span class="line">        animationText.setText(String.format(<span class="string">&quot;%s%d&quot;</span>, animationText.getText().toString(), i));</span><br><span class="line">        i++;</span><br><span class="line">    &#125;</span><br><span class="line">&#125;);</span><br></pre></td></tr></table></figure><h3 id="Systrace-Phenomenon-5"><a href="#Systrace-Phenomenon-5" class="headerlink" title="Systrace Phenomenon"></a>Systrace Phenomenon</h3><p>Similar to the Software Layer situation, since the content is updated every frame, the Buffer generated by <code>drawLayer</code> every frame is destroyed and rebuilt. At this point, the bottleneck is in both the main thread and the render thread. Because the content is updated every frame and the Buffer is destroyed and rebuilt, the execution times of both the main thread and the render thread are very long, and the performance is relatively poor. <a href="https://github.com/Gracker/Android_HardwareLayer_Example/blob/master/Systrace/HardWare_Layer_UpdateView.html">Download Systrace</a></p><p><img src="/en/images/15642088948719.jpg" alt="Hardware Layer Update Trace"></p><h3 id="gfxInfo-Data-5"><a href="#gfxInfo-Data-5" class="headerlink" title="gfxInfo Data"></a>gfxInfo Data</h3><p>You can see that the Janky Frames ratio is 46%, 99th percentile: 32ms, indicating that the performance is relatively poor. At the same time, Number High input latency &#x3D; 30, indicating that the main thread’s load is relatively high.</p><figure class="highlight java"><table><tr><td class="gutter"><pre><span class="line">1</span><br><span class="line">2</span><br><span class="line">3</span><br><span class="line">4</span><br><span class="line">5</span><br><span class="line">6</span><br><span class="line">7</span><br><span class="line">8</span><br><span class="line">9</span><br><span class="line">10</span><br><span class="line">11</span><br><span class="line">12</span><br><span class="line">13</span><br></pre></td><td class="code"><pre><span class="line">Total frames rendered: <span class="number">30</span></span><br><span class="line">Janky frames: <span class="number">14</span> (<span class="number">46.67</span>%)</span><br><span class="line">50th percentile: 16ms</span><br><span class="line">90th percentile: 29ms</span><br><span class="line">95th percentile: 32ms</span><br><span class="line">99th percentile: 32ms</span><br><span class="line">Number Missed Vsync: <span class="number">0</span></span><br><span class="line">Number High input latency: <span class="number">30</span></span><br><span class="line">Number Slow UI thread: <span class="number">0</span></span><br><span class="line">Number Slow bitmap uploads: <span class="number">0</span></span><br><span class="line">Number Slow issue draw commands: <span class="number">0</span></span><br><span class="line">Number Frame deadline missed: <span class="number">0</span></span><br><span class="line">HISTOGRAM: 5ms=<span class="number">0</span> 6ms=<span class="number">0</span> 7ms=<span class="number">0</span> 8ms=<span class="number">0</span> 9ms=<span class="number">0</span> 10ms=<span class="number">2</span> 11ms=<span class="number">2</span> 12ms=<span class="number">5</span> 13ms=<span class="number">1</span> 14ms=<span class="number">2</span> 15ms=<span class="number">1</span> 16ms=<span class="number">3</span> 17ms=<span class="number">2</span> 18ms=<span class="number">0</span> 19ms=<span class="number">0</span> 20ms=<span class="number">0</span> 21ms=<span class="number">1</span> 22ms=<span class="number">1</span> 23ms=<span class="number">1</span> 24ms=<span class="number">1</span> 25ms=<span class="number">2</span> 26ms=<span class="number">2</span> 27ms=<span class="number">0</span> 28ms=<span class="number">1</span> 29ms=<span class="number">1</span> 30ms=<span class="number">0</span> 31ms=<span class="number">0</span> 32ms=<span class="number">2</span> 34ms=<span class="number">0</span> 36ms=<span class="number">0</span> 38ms=<span class="number">0</span> 40ms=<span class="number">0</span></span><br></pre></td></tr></table></figure><h2 id="Summary-3"><a href="#Summary-3" class="headerlink" title="Summary"></a>Summary</h2><p>From the six cases above, you can see that for the same animation, under different LayerTypes, the performance performance varies greatly. This is just simple property animations; if you encounter more complex animations, the performance difference will be even greater.</p><p>Let’s do a simple summary of the above cases and the performance data they show:</p><ol><li>If you’re just doing animation without dynamically modifying the View’s content, then the performance is: <strong>Hardware Layer &gt;&#x3D; Software Layer &gt; Normal Layer</strong>.</li><li>If you’re doing animation while simultaneously dynamically modifying the View’s content, then the performance is: <strong>Normal Layer &gt; Software Layer &#x3D; Hardware Layer</strong>.</li><li>Hardware Layer indeed provides a huge improvement for animation performance, but if you use it poorly, it’s even worse than not using it.</li><li>If through Systrace you discover that every frame during your animation is doing <code>buildDrawingCache/SW</code> (main thread) or <code>buildLayer</code> (render thread), then please check your code’s logic.</li><li>In some cases, it’s due to system reasons, such as images being larger than Cache, invalidate logic problems. You can contact the phone manufacturer to modify it together.</li></ol><hr><h1 id="Zhihu-Article-Address"><a href="#Zhihu-Article-Address" class="headerlink" title="Zhihu Article Address"></a>Zhihu Article Address</h1><p>Since blog message communication is inconvenient, for likes or communication, you can move to this article’s Zhihu page.</p><p><a href="https://zhuanlan.zhihu.com/p/75458539">Zhihu - A Deep Dive into Hardware Layers in Android</a></p><hr><h1 id="About-Me-amp-amp-Blog"><a href="#About-Me-amp-amp-Blog" class="headerlink" title="About Me &amp;&amp; Blog"></a>About Me &amp;&amp; Blog</h1><p>Below is a personal introduction and related links. I look forward to communicating with colleagues in the same field. When three walk together, there must be my teacher!</p><ol><li><a href="https://www.androidperformance.com/about/">Blogger Personal Introduction</a>: Inside are personal WeChat and WeChat group links.</li><li><a href="https://androidperformance.com/2019/12/01/BlogMap/">Blog Content Navigation</a>: A navigation of personal blog content.</li><li><a href="https://androidperformance.com/2018/05/07/Android-performance-optimization-skills-and-tools/">Personally Organized and Collected Excellent Blog Articles - Android Performance Optimization Must Know</a>: Everyone is welcome to recommend and self-recommend (private WeChat chat is fine).</li><li><a href="https://www.androidperformance.com/2023/12/30/the-performance/">Android Performance Optimization Knowledge Planet</a>: Welcome to join, thank you for your support~</li></ol><hr><blockquote><p><strong>“If you want to go fast, go alone. If you want to go far, go together.”</strong></p></blockquote><p><img src="/en/images/WechatIMG581.webp" alt="Wechat QR"></p>]]></content>


    <summary type="html">&lt;h1 id=&quot;Hardware-Acceleration-vs-Software-Acceleration&quot;&gt;&lt;a href=&quot;#Hardware-Acceleration-vs-Software-Acceleration&quot; class=&quot;headerlink&quot; title=&quot;</summary>


    <category term="Android" scheme="https://androidperformance.com/en/categories/Android/"/>
    
    
    <category term="Android" scheme="https://androidperformance.com/en/tags/Android/"/>
    
    <category term="Systrace" scheme="https://androidperformance.com/en/tags/Systrace/"/>
    
    <category term="Performance" scheme="https://androidperformance.com/en/tags/Performance/"/>
    
    <category term="Tools" scheme="https://androidperformance.com/en/tags/Tools/"/>
    
    <category term="RenderThread" scheme="https://androidperformance.com/en/tags/RenderThread/"/>
    
  </entry>
  
  <entry>
    <title>Android Systrace Basics - Prerequisites for Analyzing Systrace</title>
    <link href="https://androidperformance.com/en/2019/07/23/Android-Systrace-Pre/"/>
    <id>https://androidperformance.com/en/2019/07/23/Android-Systrace-Pre/</id>
    <published>2019-07-23T14:09:59.000Z</published>
    <updated>2026-05-10T23:29:51.060Z</updated>
    
    <content type="html"><![CDATA[<p>This is the second article in the Systrace series, primarily explaining the prerequisites for analyzing Systrace. With these prerequisites, analyzing Systrace will be more effective, allowing you to identify issues faster and more efficiently.</p><p>This article introduces how to view thread states in Systrace, how to analyze thread wakeup information, how to interpret data in the information panel, and common shortcuts. By studying this article, you will gain an understanding of process and thread-related information and know how to extract key information from complex Systrace traces.</p><span id="more"></span><h2 id="Table-of-Contents"><a href="#Table-of-Contents" class="headerlink" title="Table of Contents"></a>Table of Contents</h2><ul><li><a href="#series">Series Article Index</a></li><li><a href="#content">Main Content</a></li><li><a href="#perfetto-reading">Reading This Article with Perfetto</a></li><li><a href="#thread-states">Viewing Thread States</a></li><li><a href="#wakeup">Analyzing Thread Wakeup Information</a></li><li><a href="#info-panel">Data Parsing in Information Panel</a></li><li><a href="#shortcuts">Using Shortcuts</a></li><li><a href="#zhihu">Zhihu Article Link</a></li><li><a href="#about">About Me &amp;&amp; Blog</a></li></ul><p><a id="series"></a></p><h1 id="Series-Article-Index"><a href="#Series-Article-Index" class="headerlink" title="Series Article Index"></a>Series Article Index</h1><ol><li><a href="https://www.androidperformance.com/en/2019/05/28/Android-Systrace-About/">Introduction to Systrace</a></li><li><a href="https://www.androidperformance.com/en/2019/07/23/Android-Systrace-Pre/">Systrace Basics - Prerequisites for Systrace</a></li><li><a href="https://www.androidperformance.com/en/2019/05/27/why-60-fps/">Systrace Basics - Why 60 fps?</a></li><li><a href="https://www.androidperformance.com/en/2019/06/29/Android-Systrace-SystemServer/">Android Systrace Basics - SystemServer Explained</a></li><li><a href="https://www.androidperformance.com/en/2020/02/14/Android-Systrace-SurfaceFlinger/">Systrace Basics - SurfaceFlinger Explained</a></li><li><a href="https://www.androidperformance.com/en/2019/11/04/Android-Systrace-Input/">Systrace Basics - Input Explained</a></li><li><a href="https://www.androidperformance.com/en/2019/12/01/Android-Systrace-Vsync/">Systrace Basics - Vsync Explained</a></li><li><a href="https://www.androidperformance.com/en/2019/10/22/Android-Choreographer/">Systrace Basics - Vsync-App: Detailed Explanation of Choreographer-Based Rendering Mechanism</a></li><li><a href="https://www.androidperformance.com/en/2019/11/06/Android-Systrace-MainThread-And-RenderThread/">Systrace Basics - MainThread and RenderThread Explained</a></li><li><a href="https://www.androidperformance.com/en/2019/12/06/Android-Systrace-Binder/">Systrace Basics - Binder and Lock Contention Explained</a></li><li><a href="https://www.androidperformance.com/en/2019/12/15/Android-Systrace-Triple-Buffer">Systrace Basics - Triple Buffer Explained</a></li><li><a href="https://www.androidperformance.com/en/2019/12/21/Android-Systrace-CPU">Systrace Basics - CPU Info Explained</a></li><li><a href="https://www.androidperformance.com/en/2021/04/24/android-systrace-smooth-in-action-1/">Systrace Smoothness in Action 1: Understanding Jank Principles</a></li><li><a href="https://www.androidperformance.com/en/2021/04/24/android-systrace-smooth-in-action-2/">Systrace Smoothness in Action 2: Case Analysis - MIUI Launcher Scroll Jank Analysis</a></li><li><a href="https://www.androidperformance.com/en/2021/04/24/android-systrace-smooth-in-action-3/">Systrace Smoothness in Action 3: FAQs During Jank Analysis</a></li><li><a href="https://www.androidperformance.com/en/2021/09/13/android-systrace-Responsiveness-in-action-1/">Systrace Responsiveness in Action 1: Understanding Responsiveness Principles</a></li><li><a href="https://www.androidperformance.com/en/2021/09/13/android-systrace-Responsiveness-in-action-2/">Systrace Responsiveness in Action 2: Responsiveness Analysis - Using App Startup as an Example</a></li><li><a href="https://www.androidperformance.com/en/2021/09/13/android-systrace-Responsiveness-in-action-3/">Systrace Responsiveness in Action 3: Extended Knowledge on Responsiveness</a></li><li><a href="https://www.androidperformance.com/en/2022/01/21/android-systrace-cpu-state-runnable/">Systrace Thread CPU State Analysis Tips - Runnable</a></li><li><a href="https://www.androidperformance.com/en/2022/03/13/android-systrace-cpu-state-running/">Systrace Thread CPU State Analysis Tips - Running</a></li><li><a href="https://www.androidperformance.com/en/2022/03/13/android-systrace-cpu-state-sleep/">Systrace Thread CPU State Analysis Tips - Sleep and Uninterruptible Sleep</a></li></ol><p><a id="content"></a></p><h1 id="Main-Content"><a href="#Main-Content" class="headerlink" title="Main Content"></a>Main Content</h1><p><a id="perfetto-reading"></a></p><h2 id="Reading-This-Article-with-Perfetto"><a href="#Reading-This-Article-with-Perfetto" class="headerlink" title="Reading This Article with Perfetto"></a>Reading This Article with Perfetto</h2><p>This article builds the basic skills needed before analyzing a trace: thread states, wakeup relationships, information-panel fields, and navigation shortcuts. The old Systrace UI and the current Perfetto UI look different, but these skills remain the same foundation.</p><p>In the old flow, Systrace HTML used colors to show thread states directly, and clicking a slice exposed fields such as duration, thread, process, and wakeup information in the lower panel. In the current flow, Perfetto spreads the same evidence across thread tracks, CPU scheduling tracks, the selection panel, search results, and SQL tables. The workflow changes from “read one HTML view” to “read tracks first, then narrow evidence with search or SQL.”</p><p>Use this mapping while reading:</p><table><thead><tr><th>Topic in this article</th><th>Perfetto entry point</th></tr></thead><tbody><tr><td>Opening, zooming, searching, selecting slices</td><td><a href="https://www.androidperformance.com/en/2024/05/21/Android-Perfetto-03-how-to-analysis-perfetto/">Perfetto 3: Perfetto View</a></td></tr><tr><td>Running, Runnable, Sleep, and similar thread states</td><td><a href="https://www.androidperformance.com/en/2025/11/12/Android-Perfetto-09-CPU/">Perfetto 9: CPU information</a></td></tr><tr><td>Main-thread waits, RenderThread waits, Binder waits</td><td><a href="https://www.androidperformance.com/en/2025/08/02/Android-Perfetto-07-MainThread-And-RenderThread/">Perfetto 7: MainThread and RenderThread</a> &#x2F; <a href="https://www.androidperformance.com/en/2025/11/16/Android-Perfetto-10-Binder/">Perfetto 10: Binder scheduling and lock contention</a></td></tr></tbody></table><p><a id="thread-states"></a></p><h2 id="Viewing-Thread-States"><a href="#Viewing-Thread-States" class="headerlink" title="Viewing Thread States"></a>Viewing Thread States</h2><p>Systrace uses different colors to identify different thread states. Above each method, there will be a corresponding thread state indicator showing the current status of the thread. By viewing the thread state, we can identify current bottlenecks: whether the CPU execution is slow, if it’s due to a Binder call, IO operations, or waiting for CPU time slices.</p><p>When using Perfetto for the same problem today, do not look only for colors that match the old Systrace UI. A more reliable method is to read three signals together: slices on the thread track, actual running intervals on CPU tracks, and scheduling states such as Runnable, Sleep, and Uninterruptible Sleep. That is how you separate “the function itself is slow,” “the thread woke up but did not get CPU,” and “the thread is waiting for Binder, a lock, or I&#x2F;O.”</p><p>Main thread states include:</p><h3 id="Green-Running"><a href="#Green-Running" class="headerlink" title="Green: Running"></a>Green: Running</h3><p>Only threads in this state can run on the CPU. Multiple threads may be in an executable state at the same time, and their <code>task_struct</code> structures are placed in the executable queue of the corresponding CPU (a thread can appear in only one CPU’s executable queue at a time). The scheduler’s task is to select a thread from each CPU’s executable queue to run on that CPU.</p><p><strong>Observation Purpose:</strong> We frequently check Running threads to compare their execution time with competitors and analyze reasons for speed or slowness:</p><ol><li>Is the frequency insufficient?</li><li>Is it running on a small core?</li><li>Does it switch frequently between Running and Runnable? Why?</li><li>Does it switch frequently between Running and Sleep? Why?</li><li>Is it running on the wrong core? For example, an unimportant thread occupying a super-large core.</li></ol><p><img src="/en/images/15638915926547.jpg"></p><h3 id="Blue-Runnable"><a href="#Blue-Runnable" class="headerlink" title="Blue: Runnable"></a>Blue: Runnable</h3><p>The thread is ready to run but currently not scheduled, waiting for CPU scheduling.</p><p><strong>Observation Purpose:</strong> The longer a thread stays in the Runnable state, the busier the CPU scheduling is, indicating it hasn’t handled the task promptly:</p><ol><li>Are there too many background tasks running?</li><li>Is the lack of prompt handling due to low frequency?</li><li>Is it restricted to a specific cpuset while the CPU is full?</li><li>What is the currently Running task? Why?</li></ol><p><img src="/en/images/15638916092620.jpg"></p><h3 id="White-Sleep"><a href="#White-Sleep" class="headerlink" title="White: Sleep"></a>White: Sleep</h3><p>The thread has no work to do, possibly because it’s blocked on a mutex.</p><p><strong>Observation Purpose:</strong> Generally waiting for event-driven triggers.<br><img src="/en/images/15638916218040.jpg"></p><h3 id="Orange-Uninterruptible-Sleep-IO-Block"><a href="#Orange-Uninterruptible-Sleep-IO-Block" class="headerlink" title="Orange: Uninterruptible Sleep - IO Block"></a>Orange: Uninterruptible Sleep - IO Block</h3><p>The thread is blocked on I&#x2F;O or waiting for disk operations to complete. The bottom line usually identifies the callsite: <code>wait_on_page_locked_killable</code>.</p><p><strong>Observation Purpose:</strong> This generally indicates slow I&#x2F;O operations. If a large number of orange Uninterruptible Sleep states appear, it’s often due to low memory status, triggering <code>pageFault</code> during memory allocation. In the Linux system’s page cache list, some pages may not be ready yet (i.e., not fully read from disk), leading to <code>wait_on_page_locked_killable</code> blocking when a user accesses that page. This is highly likely to occur with long blocking durations when the system I&#x2F;O is very busy and operations are queued.</p><p><img src="/en/images/15638916331888.jpg"></p><h3 id="Purple-Uninterruptible-Sleep"><a href="#Purple-Uninterruptible-Sleep" class="headerlink" title="Purple: Uninterruptible Sleep"></a>Purple: Uninterruptible Sleep</h3><p>The thread is blocked on another kernel operation (usually memory management).</p><p><strong>Observation Purpose:</strong> Generally trapped in kernel mode. This can be normal in some cases and abnormal in others, requiring specific analysis.<br><img src="/en/images/15638916451317.jpg"></p><p><a id="wakeup"></a></p><h2 id="Analyzing-Thread-Wakeup-Information"><a href="#Analyzing-Thread-Wakeup-Information" class="headerlink" title="Analyzing Thread Wakeup Information"></a>Analyzing Thread Wakeup Information</h2><p>Systrace identifies a very useful piece of information that helps us analyze thread calls and wait relationships.</p><p>Thread wakeup information is crucial. Knowing who waked up a thread tells us the call-wait relationship between them. If a thread sleeps for a long time and then wakes up, we can investigate who woke it up and check the waker’s information to see why they woke it so late.</p><p>A common scenario: An application’s main thread uses Binder to communicate with <code>AMS</code> in <code>SystemServer</code>, but the <code>AMS</code> function is waiting for a lock release (or the function itself takes a long time). The app’s main thread then has to wait a long time, leading to performance issues like slow response or jank. This is a primary reason why system performance decreases after running Monkey or when many background processes are active.</p><p>Another scenario: The application’s main thread is waiting for results from another thread in the same app. Wakeup information can analyze which thread is blocking the main thread. For example, in the following scenario, a <code>doFrame</code> took 152ms—a clear abnormality—but most of the time was spent in sleep.</p><p><img src="/en/images/Android-Systrace-Pre/image-20211210185851589.webp" alt="image-20211210185851589"></p><p>Zooming in reveals segmental wakeups. Clicking on the <code>runnable</code> section displays wakeup information in the panel below, allowing you to trace what the thread was doing. In Perfetto, the analysis idea is the same: find the long Sleep or Runnable interval on the main thread or target thread, then inspect wakeup-related events and the threads running on CPU at that time. If the visual view is not enough, query the <code>sched</code> or <code>thread_state</code> related data to list wait time and wakeup sources.</p><p><img src="/en/images/Android-Systrace-Pre/image-20211213145728467.webp" alt="image-20211213145728467"></p><p>The thread <code>20424</code> is <code>RenderHeartbeat</code>, which involves the App’s own code logic. The App needs to analyze what <code>RenderHeartbeat</code> was doing.</p><p><img src="/en/images/Android-Systrace-Pre/image-20211210190921614.webp" alt="image-20211210190921614"></p><p>Systrace can label this because a task enters the <code>Runnable</code> state before entering <code>Running</code>, and Systrace marks this state (very short, needs zooming to see).</p><p><img src="/en/images/15638916556947.jpg"></p><p>Scrolling to the top to check task info on the corresponding CPU identifies the task’s state before being waked up:<br><img src="/en/images/15638916674736.jpg"></p><p>Common Linux process states:</p><ol><li><strong>D</strong>: Uninterruptible sleep (usually IO processes).</li><li><strong>R</strong>: In the runnable queue waiting for scheduling.</li><li><strong>S</strong>: Sleeping.</li><li><strong>T</strong>: Stopped or traced.</li><li><strong>W</strong>: Paging (invalid since kernel 2.6).</li><li><strong>X</strong>: Dead process (very rare).</li><li><strong>Z</strong>: Zombie process.</li><li><strong>&lt;</strong>: High-priority process.</li><li><strong>N</strong>: Low-priority process.</li><li><strong>L</strong>: Pages locked into memory.</li><li><strong>s</strong>: Session leader (has child processes).</li><li><strong>l</strong>: Multi-threaded (using CLONE_THREAD, like NPTL pthreads).</li><li><strong>+</strong>: Process group in foreground.</li></ol><p><a id="info-panel"></a></p><h2 id="Data-Parsing-in-Information-Panel"><a href="#Data-Parsing-in-Information-Panel" class="headerlink" title="Data Parsing in Information Panel"></a>Data Parsing in Information Panel</h2><h3 id="Thread-State-Interpretation"><a href="#Thread-State-Interpretation" class="headerlink" title="Thread State Interpretation"></a>Thread State Interpretation</h3><p><img src="/en/images/15638916860044.jpg"></p><h3 id="Function-Slice-Interpretation"><a href="#Function-Slice-Interpretation" class="headerlink" title="Function Slice Interpretation"></a>Function Slice Interpretation</h3><p><img src="/en/images/15638916944506.jpg"></p><h3 id="Counter-Sample-Interpretation"><a href="#Counter-Sample-Interpretation" class="headerlink" title="Counter Sample Interpretation"></a>Counter Sample Interpretation</h3><p><img src="/en/images/15638917076247.jpg"></p><h3 id="Async-Slice-Interpretation"><a href="#Async-Slice-Interpretation" class="headerlink" title="Async Slice Interpretation"></a>Async Slice Interpretation</h3><p><img src="/en/images/15638917151530.jpg"></p><h3 id="CPU-Slice-Interpretation"><a href="#CPU-Slice-Interpretation" class="headerlink" title="CPU Slice Interpretation"></a>CPU Slice Interpretation</h3><p><img src="/en/images/15638917222302.jpg"></p><h3 id="User-Expectation-Interpretation"><a href="#User-Expectation-Interpretation" class="headerlink" title="User Expectation Interpretation"></a>User Expectation Interpretation</h3><p>Located at the very top of Systrace, identifying Rendering Response and Input Response.<br><img src="/en/images/15638917348214.jpg"></p><p><a id="shortcuts"></a></p><h2 id="Using-Shortcuts"><a href="#Using-Shortcuts" class="headerlink" title="Using Shortcuts"></a>Using Shortcuts</h2><p>Shortcuts can speed up Systrace viewing. Here are common ones:</p><p><strong>W</strong>: Zoom in for local details.<br><strong>S</strong>: Zoom out for the overview.<br><strong>A</strong>: Move left.<br><strong>D</strong>: Move right.<br><strong>M</strong>: Highlight the currently clicked segment (very useful for identifying boundaries and duration).</p><p>Mouse mode switching: Switch experimental modes for the mouse. Default is 1 (Selection mode). Direct shortcut switching is much more efficient than clicking.</p><p><strong>Number 1</strong>: Switch to <strong>Selection mode</strong>. Click segments for details. Most commonly used.<br><strong>Number 2</strong>: Switch to <strong>Pan mode</strong>. Long-press to drag left&#x2F;right.<br><strong>Number 3</strong>: Switch to <strong>Zoom mode</strong>. Long-press to zoom.<br><strong>Number 4</strong>: Switch to <strong>Timing mode</strong>. Measure time between a selected start and end point.</p><p><a id="zhihu"></a></p><h1 id="Zhihu-Article-Link"><a href="#Zhihu-Article-Link" class="headerlink" title="Zhihu Article Link"></a>Zhihu Article Link</h1><p>Since blog comments are less convenient, feel free to visit the Zhihu or Juejin pages for this article to like or exchange ideas:<br><a href="https://zhuanlan.zhihu.com/p/82522750">Zhihu - Android Systrace Basics - Prerequisites for Analyzing Systrace</a><br><a href="https://juejin.im/post/5dc18576f265da4d307f1878">Juejin - Android Systrace Basics - Prerequisites for Analyzing Systrace</a></p><p><a id="about"></a></p><h1 id="About-Me-amp-amp-Blog"><a href="#About-Me-amp-amp-Blog" class="headerlink" title="About Me &amp;&amp; Blog"></a>About Me &amp;&amp; Blog</h1><p>Below is my personal intro and related links. I look forward to exchanging ideas with fellow professionals. “When three walk together, one can always be my teacher!”</p><ol><li><a href="https://www.androidperformance.com/en/about/">Blogger Intro</a>: Includes personal WeChat and WeChat group links.</li><li><a href="https://www.androidperformance.com/en/2019/12/01/BlogMap/">Blog Content Navigation</a>: A guide for my blog content.</li><li><a href="https://www.androidperformance.com/en/2018/05/07/Android-performance-optimization-skills-and-tools/">Curated Excellent Blog Articles - Android Performance Optimization Must-Knows</a>: Welcome to recommend projects&#x2F;articles.</li><li><a href="https://www.androidperformance.com/en/2023/12/30/the-performance/">Android Performance Optimization Knowledge Planet</a>: Welcome to join and thank you for your support~</li></ol><blockquote><p><strong>One walks faster alone, but a group walks further together.</strong></p></blockquote><p><img src="/en/images/WechatIMG581.webp" alt="Scan WeChat QR Code"></p>]]></content>
    
    
    <summary type="html">&lt;p&gt;This is the second article in the Systrace series, primarily explaining the prerequisites for analyzing Systrace. With these prerequisites, analyzing Systrace will be more effective, allowing you to identify issues faster and more efficiently.&lt;/p&gt;
&lt;p&gt;This article introduces how to view thread states in Systrace, how to analyze thread wakeup information, how to interpret data in the information panel, and common shortcuts. By studying this article, you will gain an understanding of process and thread-related information and know how to extract key information from complex Systrace traces.&lt;/p&gt;</summary>


    <category term="Android" scheme="https://androidperformance.com/en/categories/Android/"/>
    
    
    <category term="Android" scheme="https://androidperformance.com/en/tags/Android/"/>
    
    <category term="Systrace" scheme="https://androidperformance.com/en/tags/Systrace/"/>
    
    <category term="Startup" scheme="https://androidperformance.com/en/tags/Startup/"/>
    
    <category term="Memory" scheme="https://androidperformance.com/en/tags/Memory/"/>
    
    <category term="Performance" scheme="https://androidperformance.com/en/tags/Performance/"/>
    
  </entry>
  
  <entry>
    <title>Android Systrace Basics - SystemServer Explained</title>
    <link href="https://androidperformance.com/en/2019/06/29/Android-Systrace-SystemServer/"/>
    <id>https://androidperformance.com/en/2019/06/29/Android-Systrace-SystemServer/</id>
    <published>2019-06-29T09:52:52.000Z</published>
    <updated>2026-05-10T23:29:51.060Z</updated>
    
    <content type="html"><![CDATA[<p>This is the fourth article in the Systrace series, primarily providing a brief introduction to <code>SystemServer</code>. It covers several important threads within <code>SystemServer</code>. Since Input and Binder are particularly critical, they are discussed separately and won’t be covered in detail here.</p><p>The purpose of this series is to view the overall operation of the Android system from a different perspective using Systrace, while also providing an alternative angle for learning the Framework. Perhaps you’ve read many articles about the Framework but can never remember the code, or you’re unclear about the execution flow. Maybe from Systrace’s graphical perspective, you can gain a deeper understanding.</p><span id="more"></span><h2 id="Table-of-Contents"><a href="#Table-of-Contents" class="headerlink" title="Table of Contents"></a>Table of Contents</h2><ul><li><a href="#series">Series Article Index</a></li><li><a href="#content">Main Content</a></li><li><a href="#wm-anim">Window Animations</a></li><li><a href="#ams">ActivityManagerService</a></li><li><a href="#wms">WindowManagerService</a></li><li><a href="#input">Input</a></li><li><a href="#binder">Binder</a></li><li><a href="#handlerthreads">HandlerThreads</a></li><li><a href="#about">About Me &amp;&amp; Blog</a></li></ul><p><a id="series"></a></p><h1 id="Series-Article-Index"><a href="#Series-Article-Index" class="headerlink" title="Series Article Index"></a>Series Article Index</h1><ol><li><a href="https://www.androidperformance.com/en/2019/05/28/Android-Systrace-About/">Introduction to Systrace</a></li><li><a href="https://www.androidperformance.com/en/2019/07/23/Android-Systrace-Pre/">Systrace Basics - Prerequisites for Systrace</a></li><li><a href="https://www.androidperformance.com/en/2019/05/27/why-60-fps/">Systrace Basics - Why 60 fps?</a></li><li><a href="https://www.androidperformance.com/en/2019/06/29/Android-Systrace-SystemServer/">Android Systrace Basics - SystemServer Explained</a></li><li><a href="https://www.androidperformance.com/en/2020/02/14/Android-Systrace-SurfaceFlinger/">Systrace Basics - SurfaceFlinger Explained</a></li><li><a href="https://www.androidperformance.com/en/2019/11/04/Android-Systrace-Input/">Systrace Basics - Input Explained</a></li><li><a href="https://www.androidperformance.com/en/2019/12/01/Android-Systrace-Vsync/">Systrace Basics - Vsync Explained</a></li><li><a href="https://www.androidperformance.com/en/2019/10/22/Android-Choreographer/">Systrace Basics - Vsync-App: Detailed Explanation of Choreographer-Based Rendering Mechanism</a></li><li><a href="https://www.androidperformance.com/en/2019/11/06/Android-Systrace-MainThread-And-RenderThread/">Systrace Basics - MainThread and RenderThread Explained</a></li><li><a href="https://www.androidperformance.com/en/2019/12/06/Android-Systrace-Binder/">Systrace Basics - Binder and Lock Contention Explained</a></li><li><a href="https://www.androidperformance.com/en/2019/12/15/Android-Systrace-Triple-Buffer">Systrace Basics - Triple Buffer Explained</a></li><li><a href="https://www.androidperformance.com/en/2019/12/21/Android-Systrace-CPU">Systrace Basics - CPU Info Explained</a></li><li><a href="https://www.androidperformance.com/en/2021/04/24/android-systrace-smooth-in-action-1/">Systrace Smoothness in Action 1: Understanding Jank Principles</a></li><li><a href="https://www.androidperformance.com/en/2021/04/24/android-systrace-smooth-in-action-2/">Systrace Smoothness in Action 2: Case Analysis - MIUI Launcher Scroll Jank Analysis</a></li><li><a href="https://www.androidperformance.com/en/2021/04/24/android-systrace-smooth-in-action-3/">Systrace Smoothness in Action 3: FAQs During Jank Analysis</a></li><li><a href="https://www.androidperformance.com/en/2021/09/13/android-systrace-Responsiveness-in-action-1/">Systrace Responsiveness in Action 1: Understanding Responsiveness Principles</a></li><li><a href="https://www.androidperformance.com/en/2021/09/13/android-systrace-Responsiveness-in-action-2/">Systrace Responsiveness in Action 2: Responsiveness Analysis - Using App Startup as an Example</a></li><li><a href="https://www.androidperformance.com/en/2021/09/13/android-systrace-Responsiveness-in-action-3/">Systrace Responsiveness in Action 3: Extended Knowledge on Responsiveness</a></li><li><a href="https://www.androidperformance.com/en/2022/01/21/android-systrace-cpu-state-runnable/">Systrace Thread CPU State Analysis Tips - Runnable</a></li><li><a href="https://www.androidperformance.com/en/2022/03/13/android-systrace-cpu-state-running/">Systrace Thread CPU State Analysis Tips - Running</a></li><li><a href="https://www.androidperformance.com/en/2022/03/13/android-systrace-cpu-state-sleep/">Systrace Thread CPU State Analysis Tips - Sleep and Uninterruptible Sleep</a></li></ol><p><a id="content"></a></p><h1 id="Main-Content"><a href="#Main-Content" class="headerlink" title="Main Content"></a>Main Content</h1><p>Read this SystemServer article together with <a href="https://www.androidperformance.com/en/2025/11/16/Android-Perfetto-10-Binder/">Perfetto 10: Binder scheduling and lock contention</a>. In old Systrace, SystemServer analysis focused on long slices around window animation, Input, AMS&#x2F;WMS, Binder calls, and lock contention. In Perfetto, the same problems should be read across SystemServer threads, Binder thread pools, caller app thread states, CPU scheduling, and lock-wait evidence.</p><p>The current workflow is to first find the SystemServer call that the app is waiting for, then check whether the corresponding SystemServer thread is Running, Runnable, Sleep, or waiting for a lock. If it is a Binder call, also check whether the Binder thread pool is queueing, whether the caller is blocked by synchronous Binder, and whether CPU is occupied by higher-priority work. This separates “SystemServer is slow” into window animation work, AMS&#x2F;WMS lock holding, remote Binder execution, and CPU scheduling delay.</p><p><a id="wm-anim"></a></p><h2 id="Window-Animations"><a href="#Window-Animations" class="headerlink" title="Window Animations"></a>Window Animations</h2><p>A critical part of <code>SystemServer</code> in Systrace is window animations. Since <code>SystemServer</code> manages windows, it also handles window animations centrally. This involves two key threads: <code>android.anim</code> and <code>android.anim.lf</code> (further explained below).</p><p>Using <strong>App Startup</strong> as an example, we can see how animations switch between these threads. In Android P, an app’s startup animation consists of the Launcher’s part and the App’s first frame. Previously handled entirely in <code>SystemServer</code>, multitasking animations have partly moved to the Launcher for better performance.</p><p>When you click an icon, the Launcher first starts a <code>StartingWindow</code> while the App is still launching. Once the App’s first frame is ready, it switches to the App’s window animation.</p><p>Launcher Animation:<br><img src="/en/images/15811380751710.jpg" alt="-w1019"></p><p>Correspondingly, the App is starting:<br><img src="/en/images/15811380510520.jpg" alt="-w1025"></p><p>As shown above, after the App’s first frame is prepared, <code>SystemServer</code> switches to the App’s window animation.</p><p><img src="/en/images/15811383348116.jpg" alt="-w1236"></p><p><a id="ams"></a></p><h2 id="ActivityManagerService"><a href="#ActivityManagerService" class="headerlink" title="ActivityManagerService"></a>ActivityManagerService</h2><p>AMS and WMS are the busiest services in <code>SystemServer</code>. Trace points related to AMS typically use the <code>TRACE_TAG_ACTIVITY_MANAGER</code> tag, appearing as <code>ActivityManager</code> in Systrace.</p><p>Below is the AMS output when launching a new process:<br><img src="/en/images/15808922537197.jpg" alt="-w826"></p><p>Various scenarios for processes and the four components have corresponding Trace points, such as <code>ActivityStart</code>, <code>ActivityResume</code>, and <code>activityStop</code>. Some reside in the application process and others in <code>SystemServer</code>, so analyzing Activity logic requires toggling between both processes to understand state changes and <code>SystemServer</code>‘s role.</p><p><img src="/en/images/15808919921881.jpg" alt="-w660"></p><p><a id="wms"></a></p><h2 id="WindowManagerService"><a href="#WindowManagerService" class="headerlink" title="WindowManagerService"></a>WindowManagerService</h2><p>WMS-related Trace points typically use the <code>TRACE_TAG_WINDOW_MANAGER</code> tag. <code>WindowManagerService</code> often appears within Binder threads in <code>SystemServer</code>. For example, here’s the <code>relayoutWindow</code> output during app startup:</p><p><img src="/en/images/15808923853151.jpg" alt="-w957"></p><p>Various Window scenarios have Trace points like <code>relayoutWindow</code>, <code>performLayout</code>, and <code>prepareToDisplay</code>.</p><p><img src="/en/images/15808918520410.jpg" alt="-w659"></p><p><a id="input"></a></p><h2 id="Input"><a href="#Input" class="headerlink" title="Input"></a>Input</h2><p>Input is a vital part of <code>SystemServer</code>, primarily consisting of the Native threads <code>InputReader</code> and <code>InputDispatcher</code>. This is detailed in <a href="https://www.androidperformance.com/en/2019/11/04/Android-Systrace-Input/">Systrace Basics - Input Interpretation</a> and won’t be repeated here.</p><p><img src="/en/images/15808245020456.jpg" alt="-w725"></p><p><a id="binder"></a></p><h2 id="Binder"><a href="#Binder" class="headerlink" title="Binder"></a>Binder</h2><p>Since <code>SystemServer</code> provides numerous base services, inter-process communication (IPC) is heavy, and most of it uses Binder. Its role is critical; with many background apps, <code>SystemServer</code> can suffer from Binder communication overhead and lock contention, leading to system or app jank. This is detailed in <a href="https://www.androidperformance.com/en/2019/12/06/Android-Systrace-Binder/">Binder and Lock Contention Explained</a>.</p><p><img src="/en/images/15808245356047.jpg" alt="-w1028"></p><p><a id="handlerthreads"></a></p><h2 id="HandlerThread"><a href="#HandlerThread" class="headerlink" title="HandlerThread"></a>HandlerThread</h2><h3 id="BackgroundThread"><a href="#BackgroundThread" class="headerlink" title="BackgroundThread"></a>BackgroundThread</h3><p><code>com/android/internal/os/BackgroundThread.java</code></p><figure class="highlight java"><table><tr><td class="gutter"><pre><span class="line">1</span><br><span class="line">2</span><br><span class="line">3</span><br></pre></td><td class="code"><pre><span class="line"><span class="keyword">private</span> <span class="title function_">BackgroundThread</span><span class="params">()</span> &#123;</span><br><span class="line">    <span class="built_in">super</span>(<span class="string">&quot;android.bg&quot;</span>, android.os.Process.THREAD_PRIORITY_BACKGROUND);</span><br><span class="line">&#125;</span><br></pre></td></tr></table></figure><p><code>BackgroundThread</code> in Systrace:<br><img src="/en/images/15808252037825.jpg" alt="-w1082"></p><p><code>BackgroundThread</code> is widely used for non-performance-critical tasks.</p><p><img src="/en/images/15808271946061.jpg" alt="-w654"></p><h2 id="ServiceThread"><a href="#ServiceThread" class="headerlink" title="ServiceThread"></a>ServiceThread</h2><p><code>ServiceThread</code> inherits from <code>HandlerThread</code>. Several worker threads mentioned below inherit from <code>ServiceThread</code>, performing different functions with varying priorities: <code>UiThread</code>, <code>IoThread</code>, <code>DisplayThread</code>, <code>AnimationThread</code>, <code>FgThread</code>, and <code>SurfaceAnimationThread</code>.</p><p>Each thread has its own <code>Looper</code>, <code>Thread</code>, and <code>MessageQueue</code> to avoid interference. Android uses specific threads for specific functional tasks.</p><h3 id="UiThread"><a href="#UiThread" class="headerlink" title="UiThread"></a>UiThread</h3><p><code>com/android/server/UiThread.java</code></p><figure class="highlight java"><table><tr><td class="gutter"><pre><span class="line">1</span><br><span class="line">2</span><br><span class="line">3</span><br></pre></td><td class="code"><pre><span class="line"><span class="keyword">private</span> <span class="title function_">UiThread</span><span class="params">()</span> &#123;</span><br><span class="line">    <span class="built_in">super</span>(<span class="string">&quot;android.ui&quot;</span>, Process.THREAD_PRIORITY_FOREGROUND, <span class="literal">false</span> <span class="comment">/*allowIo*/</span>);</span><br><span class="line">&#125;</span><br></pre></td></tr></table></figure><p><code>UiThread</code> in Systrace:<br><img src="/en/images/15808252975757.jpg" alt="-w1049"></p><p>Common uses for <code>UiThread</code> can be found in the source by searching for <code>UiThread.get()</code>.</p><p><img src="/en/images/15808258949148.jpg" alt="-w650"></p><h3 id="IoThread"><a href="#IoThread" class="headerlink" title="IoThread"></a>IoThread</h3><p><code>com/android/server/IoThread.java</code></p><figure class="highlight java"><table><tr><td class="gutter"><pre><span class="line">1</span><br><span class="line">2</span><br><span class="line">3</span><br></pre></td><td class="code"><pre><span class="line"><span class="keyword">private</span> <span class="title function_">IoThread</span><span class="params">()</span> &#123;</span><br><span class="line">    <span class="built_in">super</span>(<span class="string">&quot;android.io&quot;</span>, android.os.Process.THREAD_PRIORITY_DEFAULT, <span class="literal">true</span> <span class="comment">/*allowIo*/</span>);</span><br><span class="line">&#125;</span><br></pre></td></tr></table></figure><p>Uses for <code>IoThread</code> can be found via <code>IoThread.get()</code>.</p><p><img src="/en/images/15808257964346.jpg" alt="-w654"></p><h3 id="DisplayThread"><a href="#DisplayThread" class="headerlink" title="DisplayThread"></a>DisplayThread</h3><p><code>com/android/server/DisplayThread.java</code></p><figure class="highlight java"><table><tr><td class="gutter"><pre><span class="line">1</span><br><span class="line">2</span><br><span class="line">3</span><br><span class="line">4</span><br><span class="line">5</span><br></pre></td><td class="code"><pre><span class="line"><span class="keyword">private</span> <span class="title function_">DisplayThread</span><span class="params">()</span> &#123;</span><br><span class="line">    <span class="comment">// DisplayThread runs important stuff, but these are not as important as things running in</span></span><br><span class="line">    <span class="comment">// AnimationThread. Thus, set the priority to one lower.</span></span><br><span class="line">    <span class="built_in">super</span>(<span class="string">&quot;android.display&quot;</span>, Process.THREAD_PRIORITY_DISPLAY + <span class="number">1</span>, <span class="literal">false</span> <span class="comment">/*allowIo*/</span>);</span><br><span class="line">&#125;</span><br></pre></td></tr></table></figure><p><code>DisplayThread</code> in Systrace:<br><img src="/en/images/15808251210767.jpg" alt="-w1108"></p><p><img src="/en/images/15808259701453.jpg" alt="-w656"></p><h3 id="AnimationThread"><a href="#AnimationThread" class="headerlink" title="AnimationThread"></a>AnimationThread</h3><p><code>com/android/server/AnimationThread.java</code></p><figure class="highlight java"><table><tr><td class="gutter"><pre><span class="line">1</span><br><span class="line">2</span><br><span class="line">3</span><br></pre></td><td class="code"><pre><span class="line"><span class="keyword">private</span> <span class="title function_">AnimationThread</span><span class="params">()</span> &#123;</span><br><span class="line">    <span class="built_in">super</span>(<span class="string">&quot;android.anim&quot;</span>, THREAD_PRIORITY_DISPLAY, <span class="literal">false</span> <span class="comment">/*allowIo*/</span>);</span><br><span class="line">&#125;</span><br></pre></td></tr></table></figure><p><code>AnimationThread</code> in Systrace:<br><img src="/en/images/15808255124784.jpg" alt="-w902"></p><p>Uses in source show that <code>WindowAnimator</code> executions happen here. Android P added <code>SurfaceAnimationThread</code> to offload work and improve <code>WindowAnimation</code> performance.</p><p><img src="/en/images/15808260775808.jpg" alt="-w657"></p><h3 id="FgThread"><a href="#FgThread" class="headerlink" title="FgThread"></a>FgThread</h3><p><code>com/android/server/FgThread.java</code></p><figure class="highlight java"><table><tr><td class="gutter"><pre><span class="line">1</span><br><span class="line">2</span><br><span class="line">3</span><br></pre></td><td class="code"><pre><span class="line"><span class="keyword">private</span> <span class="title function_">FgThread</span><span class="params">()</span> &#123;</span><br><span class="line">    <span class="built_in">super</span>(<span class="string">&quot;android.fg&quot;</span>, android.os.Process.THREAD_PRIORITY_DEFAULT, <span class="literal">true</span> <span class="comment">/*allowIo*/</span>);</span><br><span class="line">&#125;</span><br></pre></td></tr></table></figure><p><code>FgThread</code> in Systrace:<br><img src="/en/images/15808253825450.jpg" alt="-w1018"></p><p>Example of <code>FgThread</code> usage:</p><figure class="highlight java"><table><tr><td class="gutter"><pre><span class="line">1</span><br><span class="line">2</span><br><span class="line">3</span><br><span class="line">4</span><br><span class="line">5</span><br><span class="line">6</span><br><span class="line">7</span><br><span class="line">8</span><br><span class="line">9</span><br><span class="line">10</span><br><span class="line">11</span><br><span class="line">12</span><br><span class="line">13</span><br><span class="line">14</span><br><span class="line">15</span><br><span class="line">16</span><br><span class="line">17</span><br><span class="line">18</span><br></pre></td><td class="code"><pre><span class="line">FgThread.getHandler().post(() -&gt; &#123;</span><br><span class="line">    <span class="keyword">synchronized</span> (mLock) &#123;</span><br><span class="line">        <span class="keyword">if</span> (mStartedUsers.get(userIdToLockF) != <span class="literal">null</span>) &#123;</span><br><span class="line">            Slog.w(TAG, <span class="string">&quot;User was restarted, skipping key eviction&quot;</span>);</span><br><span class="line">            <span class="keyword">return</span>;</span><br><span class="line">        &#125;</span><br><span class="line">    &#125;</span><br><span class="line">    <span class="keyword">try</span> &#123;</span><br><span class="line">        mInjector.getStorageManager().lockUserKey(userIdToLockF);</span><br><span class="line">    &#125; <span class="keyword">catch</span> (RemoteException re) &#123;</span><br><span class="line">        <span class="keyword">throw</span> re.rethrowAsRuntimeException();</span><br><span class="line">    &#125;</span><br><span class="line">    <span class="keyword">if</span> (userIdToLockF == userId) &#123;</span><br><span class="line">        <span class="keyword">for</span> (<span class="keyword">final</span> KeyEvictedCallback callback : keyEvictedCallbacks) &#123;</span><br><span class="line">            callback.keyEvicted(userId);</span><br><span class="line">        &#125;</span><br><span class="line">    &#125;</span><br><span class="line">&#125;);</span><br></pre></td></tr></table></figure><h3 id="SurfaceAnimationThread"><a href="#SurfaceAnimationThread" class="headerlink" title="SurfaceAnimationThread"></a>SurfaceAnimationThread</h3><figure class="highlight java"><table><tr><td class="gutter"><pre><span class="line">1</span><br><span class="line">2</span><br><span class="line">3</span><br><span class="line">4</span><br></pre></td><td class="code"><pre><span class="line">com/android/server/wm/SurfaceAnimationThread.java</span><br><span class="line"><span class="keyword">private</span> <span class="title function_">SurfaceAnimationThread</span><span class="params">()</span> &#123;</span><br><span class="line">    <span class="built_in">super</span>(<span class="string">&quot;android.anim.lf&quot;</span>, THREAD_PRIORITY_DISPLAY, <span class="literal">false</span> <span class="comment">/*allowIo*/</span>);</span><br><span class="line">&#125;</span><br></pre></td></tr></table></figure><p><code>SurfaceAnimationThread</code> in Systrace (named <code>android.anim.lf</code>):<br><img src="/en/images/15808254715766.jpg" alt="-w1148"></p><p>This thread primarily executes window animations to offload <code>android.anim</code>, reducing jank caused by locks. See: <a href="https://zhuanlan.zhihu.com/p/44864987">Android P——LockFreeAnimation</a>.</p><figure class="highlight java"><table><tr><td class="gutter"><pre><span class="line">1</span><br><span class="line">2</span><br><span class="line">3</span><br><span class="line">4</span><br><span class="line">5</span><br><span class="line">6</span><br><span class="line">7</span><br><span class="line">8</span><br><span class="line">9</span><br><span class="line">10</span><br><span class="line">11</span><br><span class="line">12</span><br><span class="line">13</span><br><span class="line">14</span><br><span class="line">15</span><br></pre></td><td class="code"><pre><span class="line">SurfaceAnimationRunner(<span class="meta">@Nullable</span> AnimationFrameCallbackProvider callbackProvider,</span><br><span class="line">        AnimatorFactory animatorFactory, Transaction frameTransaction,</span><br><span class="line">        PowerManagerInternal powerManagerInternal) &#123;</span><br><span class="line">    SurfaceAnimationThread.getHandler().runWithScissors(() -&gt; mChoreographer = getSfInstance(),</span><br><span class="line">            <span class="number">0</span> <span class="comment">/* timeout */</span>);</span><br><span class="line">    mFrameTransaction = frameTransaction;</span><br><span class="line">    mAnimationHandler = <span class="keyword">new</span> <span class="title class_">AnimationHandler</span>();</span><br><span class="line">    mAnimationHandler.setProvider(callbackProvider != <span class="literal">null</span></span><br><span class="line">            ? callbackProvider</span><br><span class="line">            : <span class="keyword">new</span> <span class="title class_">SfVsyncFrameCallbackProvider</span>(mChoreographer));</span><br><span class="line">    mAnimatorFactory = animatorFactory != <span class="literal">null</span></span><br><span class="line">            ? animatorFactory</span><br><span class="line">            : SfValueAnimator::<span class="keyword">new</span>;</span><br><span class="line">    mPowerManagerInternal = powerManagerInternal;</span><br><span class="line">&#125;</span><br></pre></td></tr></table></figure><p><a id="about"></a></p><h1 id="About-Me-amp-amp-Blog"><a href="#About-Me-amp-amp-Blog" class="headerlink" title="About Me &amp;&amp; Blog"></a>About Me &amp;&amp; Blog</h1><p>Below is my personal intro and related links. I look forward to exchanging ideas with fellow professionals. “When three walk together, one can always be my teacher!”</p><ol><li><a href="https://www.androidperformance.com/en/about/">Blogger Intro</a>: Includes personal WeChat and WeChat group links.</li><li><a href="https://www.androidperformance.com/en/2019/12/01/BlogMap/">Blog Content Navigation</a>: A guide for my blog content.</li><li><a href="https://www.androidperformance.com/en/2018/05/07/Android-performance-optimization-skills-and-tools/">Curated Excellent Blog Articles - Android Performance Optimization Must-Knows</a>: Welcome to recommend projects&#x2F;articles.</li><li><a href="https://www.androidperformance.com/en/2023/12/30/the-performance/">Android Performance Optimization Knowledge Planet</a>: Welcome to join and thank you for your support~</li></ol><blockquote><p><strong>One walks faster alone, but a group walks further together.</strong></p></blockquote><p><img src="/en/images/WechatIMG581.webp" alt="Scan WeChat QR Code"></p>]]></content>
    
    
    <summary type="html">&lt;p&gt;This is the fourth article in the Systrace series, primarily providing a brief introduction to &lt;code&gt;SystemServer&lt;/code&gt;. It covers several important threads within &lt;code&gt;SystemServer&lt;/code&gt;. Since Input and Binder are particularly critical, they are discussed separately and won’t be covered in detail here.&lt;/p&gt;
&lt;p&gt;The purpose of this series is to view the overall operation of the Android system from a different perspective using Systrace, while also providing an alternative angle for learning the Framework. Perhaps you’ve read many articles about the Framework but can never remember the code, or you’re unclear about the execution flow. Maybe from Systrace’s graphical perspective, you can gain a deeper understanding.&lt;/p&gt;</summary>


    <category term="Android" scheme="https://androidperformance.com/en/categories/Android/"/>
    
    
    <category term="Android" scheme="https://androidperformance.com/en/tags/Android/"/>
    
    <category term="Systrace" scheme="https://androidperformance.com/en/tags/Systrace/"/>
    
    <category term="Startup" scheme="https://androidperformance.com/en/tags/Startup/"/>
    
    <category term="Jank" scheme="https://androidperformance.com/en/tags/Jank/"/>
    
    <category term="Performance" scheme="https://androidperformance.com/en/tags/Performance/"/>
    
  </entry>
  
  <entry>
    <title>Android Systrace Basics - Introduction to Systrace</title>
    <link href="https://androidperformance.com/en/2019/05/28/Android-Systrace-About/"/>
    <id>https://androidperformance.com/en/2019/05/28/Android-Systrace-About/</id>
    <published>2019-05-28T08:58:00.000Z</published>
    <updated>2026-05-10T23:29:51.059Z</updated>
    
    <content type="html"><![CDATA[<p>This is the first article in the Systrace series, primarily providing a brief introduction to Systrace, its basic usage, how to interpret Systrace traces, and how to analyze phenomena in Systrace in conjunction with other tools.</p><p>The purpose of this series is to view the overall operation of the Android system from a different perspective using Systrace, while also providing an alternative angle for learning the Framework. Perhaps you’ve read many articles about the Framework but can never remember the code, or you’re unclear about the execution flow. Maybe from Systrace’s graphical perspective, you can gain a deeper understanding.</p><span id="more"></span><h2 id="Table-of-Contents"><a href="#Table-of-Contents" class="headerlink" title="Table of Contents"></a>Table of Contents</h2><ul><li><a href="#perf-series">Perfetto Series Article Index</a></li><li><a href="#systrace-series">Systrace Series Article Index</a></li><li><a href="#content">Main Content</a></li><li><a href="#simple-use">Simple Usage of Systrace</a></li><li><a href="#cli">Capturing Systrace with Command-Line Tools</a></li><li><a href="#tags">Viewing Supported TAGs</a></li><li><a href="#about">About Me &amp;&amp; Blog</a></li></ul><p><a id="perf-series"></a></p><h1 id="Perfetto-Series-Article-Index"><a href="#Perfetto-Series-Article-Index" class="headerlink" title="Perfetto Series Article Index"></a>Perfetto Series Article Index</h1><h3 id="How-the-Systrace-workflow-changed-after-Perfetto"><a href="#How-the-Systrace-workflow-changed-after-Perfetto" class="headerlink" title="How the Systrace workflow changed after Perfetto"></a>How the Systrace workflow changed after Perfetto</h3><p>When this article first described Systrace, the main workflow was <code>systrace.py</code> calling <code>atrace</code>, collecting ftrace and ATrace data, generating HTML, and opening it in Chrome. Today, split that flow into two layers:</p><ol><li>The underlying mechanisms are still useful: <code>android.os.Trace</code>, native ATrace macros, ATrace in system services, Linux ftrace, and CPU scheduling events remain core data sources for Android performance analysis.</li><li>The tool workflow changed: current <code>platform-tools</code> no longer treats <code>systrace.py</code> as the main entry point. On Android 10 (API 29) and later, System Tracing mainly produces <code>.perfetto-trace</code> files, and the default analysis tools are <a href="https://ui.perfetto.dev/">Perfetto UI</a> and <code>trace_processor</code>.</li><li>There are three common capture paths now: use the System Tracing Quick Settings tile for interactive issues; use <code>adb shell perfetto ... --out /data/misc/perfetto-traces/xxx.perfetto-trace</code> for reproducible issues; use a Perfetto config or the <code>record_android_trace</code> script when the configuration needs to be stable and repeatable.</li><li>The Systrace concepts in this article map to <a href="https://www.androidperformance.com/en/2024/05/21/Android-Perfetto-01-What-is-perfetto/">Perfetto 1: Introduction</a>, <a href="https://www.androidperformance.com/en/2024/05/21/Android-Perfetto-02-how-to-get-perfetto/">Perfetto 2: Capturing traces</a>, and <a href="https://www.androidperformance.com/en/2024/05/21/Android-Perfetto-03-how-to-analysis-perfetto/">Perfetto 3: Perfetto View</a>.</li></ol><p>Perfetto is not just a different web viewer. It puts short traces, long traces, protobuf files, SQL, metrics, command-line processing, and large-file analysis into one system. The old Systrace HTML flow is still good for quick visual inspection; the current Perfetto flow is better when the analysis needs search, filtering, SQL, metrics, or automation.</p><p>I will continue to update the Perfetto series, and all future illustrations will use Perfetto. <strong>The underlying knowledge points are common between Systrace and Perfetto, so don’t worry about which one to use—you can learn from both series.</strong></p><h1 id="Perfetto-Series-Article-Index-1"><a href="#Perfetto-Series-Article-Index-1" class="headerlink" title="Perfetto Series Article Index"></a>Perfetto Series Article Index</h1><ol><li><a href="https://www.androidperformance.com/en/2024/03/27/Android-Perfetto-101/#/Perfetto-%E7%B3%BB%E5%88%97%E7%9B%AE%E5%BD%95">Android Perfetto Series Index</a></li><li><a href="https://www.androidperformance.com/en/2024/05/21/Android-Perfetto-01-What-is-perfetto/">Android Perfetto Series 1: Introduction to Perfetto</a></li><li><a href="https://www.androidperformance.com/en/2024/05/21/Android-Perfetto-02-how-to-get-perfetto/">Android Perfetto Series 2: Capturing Perfetto Traces</a></li><li><a href="https://www.androidperformance.com/en/2024/05/21/Android-Perfetto-03-how-to-analysis-perfetto/">Android Perfetto Series 3: Getting Familiar with Perfetto View</a></li><li><a href="https://www.androidperformance.com/en/2025/02/08/Android-Perfetto-04-Open-Big-Trace-With-Command-Line/">Android Perfetto Series 4: Opening Large Traces Locally Using Command Line</a></li><li><a href="https://www.androidperformance.com/en/2025/03/26/Android-Perfetto-05-Chorergrapher/">Android Perfetto Series 5: Android App Rendering Pipeline Based on Choreographer</a></li><li><a href="https://www.androidperformance.com/en/2025/04/26/Android-Perfetto-06-Why-120Hz/">Android Perfetto Series 6: Why 120Hz? Advantages and Challenges of High Refresh Rate</a></li><li><a href="https://www.androidperformance.com/en/2025/08/02/Android-Perfetto-07-MainThread-And-RenderThread/">Android Perfetto Series 7 - MainThread and RenderThread Explained</a></li><li><a href="https://www.androidperformance.com/en/2025/08/05/Android-Perfetto-08-Vsync/">Android Perfetto Series 8: Deep Dive into Vsync Mechanism and Performance Analysis</a></li><li><a href="https://www.androidperformance.com/en/2025/11/12/Android-Perfetto-09-CPU/">Android Perfetto Series 9 - CPU Information Explained</a></li><li><a href="https://www.androidperformance.com/en/2025/11/16/Android-Perfetto-10-Binder/">Android Perfetto Series 10: Binder Scheduling and Lock Contention</a></li><li><a href="https://www.bilibili.com/video/BV1oi82efE4D/?vd_source=0c6d2191e785de0a36dc21a9da7e664e">Video (Bilibili) - Android Perfetto Basics and Case Studies</a></li><li><a href="https://www.bilibili.com/video/BV17A6bBLECu/">Video (Bilibili) - Android Perfetto: Trace Graph Types - AOSP, WebView, Flutter + OEM System Optimization</a></li></ol><p><a id="systrace-series"></a></p><h1 id="Systrace-Series-Article-Index"><a href="#Systrace-Series-Article-Index" class="headerlink" title="Systrace Series Article Index"></a>Systrace Series Article Index</h1><ol><li><a href="https://www.androidperformance.com/en/2019/05/28/Android-Systrace-About/">Introduction to Systrace</a></li><li><a href="https://www.androidperformance.com/en/2019/07/23/Android-Systrace-Pre/">Systrace Basics - Prerequisites for Systrace</a></li><li><a href="https://www.androidperformance.com/en/2019/05/27/why-60-fps/">Systrace Basics - Why 60 fps?</a></li><li><a href="https://www.androidperformance.com/en/2019/06/29/Android-Systrace-SystemServer/">Android Systrace Basics - SystemServer Explained</a></li><li><a href="https://www.androidperformance.com/en/2020/02/14/Android-Systrace-SurfaceFlinger/">Systrace Basics - SurfaceFlinger Explained</a></li><li><a href="https://www.androidperformance.com/en/2019/11/04/Android-Systrace-Input/">Systrace Basics - Input Explained</a></li><li><a href="https://www.androidperformance.com/en/2019/12/01/Android-Systrace-Vsync/">Systrace Basics - Vsync Explained</a></li><li><a href="https://www.androidperformance.com/en/2019/10/22/Android-Choreographer/">Systrace Basics - Vsync-App: Detailed Explanation of Choreographer-Based Rendering Mechanism</a></li><li><a href="https://www.androidperformance.com/en/2019/11/06/Android-Systrace-MainThread-And-RenderThread/">Systrace Basics - MainThread and RenderThread Explained</a></li><li><a href="https://www.androidperformance.com/en/2019/12/06/Android-Systrace-Binder/">Systrace Basics - Binder and Lock Contention Explained</a></li><li><a href="https://www.androidperformance.com/en/2019/12/15/Android-Systrace-Triple-Buffer">Systrace Basics - Triple Buffer Explained</a></li><li><a href="https://www.androidperformance.com/en/2019/12/21/Android-Systrace-CPU">Systrace Basics - CPU Info Explained</a></li><li><a href="https://www.androidperformance.com/en/2021/04/24/android-systrace-smooth-in-action-1/">Systrace Smoothness in Action 1: Understanding Jank Principles</a></li><li><a href="https://www.androidperformance.com/en/2021/04/24/android-systrace-smooth-in-action-2/">Systrace Smoothness in Action 2: Case Analysis - MIUI Launcher Scroll Jank Analysis</a></li><li><a href="https://www.androidperformance.com/en/2021/04/24/android-systrace-smooth-in-action-3/">Systrace Smoothness in Action 3: FAQs During Jank Analysis</a></li><li><a href="https://www.androidperformance.com/en/2021/09/13/android-systrace-Responsiveness-in-action-1/">Systrace Responsiveness in Action 1: Understanding Responsiveness Principles</a></li><li><a href="https://www.androidperformance.com/en/2021/09/13/android-systrace-Responsiveness-in-action-2/">Systrace Responsiveness in Action 2: Responsiveness Analysis - Using App Startup as an Example</a></li><li><a href="https://www.androidperformance.com/en/2021/09/13/android-systrace-Responsiveness-in-action-3/">Systrace Responsiveness in Action 3: Extended Knowledge on Responsiveness</a></li><li><a href="https://www.androidperformance.com/en/2022/01/21/android-systrace-cpu-state-runnable/">Systrace Thread CPU State Analysis Tips - Runnable</a></li><li><a href="https://www.androidperformance.com/en/2022/03/13/android-systrace-cpu-state-running/">Systrace Thread CPU State Analysis Tips - Running</a></li><li><a href="https://www.androidperformance.com/en/2022/03/13/android-systrace-cpu-state-sleep/">Systrace Thread CPU State Analysis Tips - Sleep and Uninterruptible Sleep</a></li></ol><p><a id="content"></a></p><h1 id="Main-Content"><a href="#Main-Content" class="headerlink" title="Main Content"></a>Main Content</h1><p>Systrace is a performance data sampling and analysis tool introduced in Android 4.1. It helps developers collect execution information from key Android subsystems (such as SurfaceFlinger, SystemServer, Kernel, Input, Display, and other critical framework modules, services, and the View system), allowing for a more intuitive analysis of system bottlenecks and performance improvements.</p><p>Systrace’s capabilities include tracking system I&#x2F;O operations, kernel workqueues, CPU load, and the health of various Android subsystems. On the Android platform, it’s composed of three main parts:</p><ul><li><strong>Kernel Space</strong>: Systrace leverages the <code>ftrace</code> feature in the Linux Kernel. Therefore, to use Systrace, the relevant <code>ftrace</code> modules in the kernel must be enabled.</li><li><strong>Data Collection</strong>: Android defines a <code>Trace</code> class that applications can use to output statistical information to <code>ftrace</code>. Additionally, the <code>atrace</code> program in Android reads statistical info from <code>ftrace</code> and passes it to data analysis tools.</li><li><strong>Data Analysis Tools</strong>: In the old flow, Android provided <code>systrace.py</code> (a Python script once located under <code>Android SDK directory/platform-tools/systrace</code>) to configure collection and generate HTML. In the current flow, <code>perfetto</code> records data into <code>.perfetto-trace</code>, while Perfetto UI and <code>trace_processor</code> open, query, and analyze it. Essentially, Systrace is a wrapper around Linux Kernel <code>ftrace</code>; Perfetto continues to support ATrace&#x2F;ftrace while integrating more data sources, file formats, and analysis capabilities. Applications can still use Android’s <code>Trace</code> class to emit custom trace points.</li></ul><p>Official documentation and usage for Systrace can be found here: <a href="http://developer.android.com/tools/help/systrace.html" title="SysTrace Official Introduction">Systrace</a></p><h3 id="Design-Philosophy-of-Systrace"><a href="#Design-Philosophy-of-Systrace" class="headerlink" title="Design Philosophy of Systrace"></a><strong>Design Philosophy of Systrace</strong></h3><p>Key flows in the system (such as Touch operations, Power button presses, scrolling), system mechanisms (input dispatching, View rendering, IPC, process management), and hardware&#x2F;software status (CPU frequency, CPU scheduling, disk info, memory info) have Log-like info inserted, known as <strong>TracePoints</strong> (essentially Ftrace info). These TracePoints demonstrate the execution time of core operations and the values of specific variables. The Android system then collects these TracePoints scattered across various processes and writes them into a file. After exporting this file, Systrace parses the data to provide an overview of system operation over a period of time.</p><p><img src="/en/images/Android-Systrace-About/56bebe5b-e5fd-4b69-8e36-3197fe205034.webp"></p><p>Important modules in Android have TracePoints inserted by default, categorized by <code>TraceTag</code>:</p><ol><li>Framework Java-level TracePoints use the <code>android.os.Trace</code> class.</li><li>Framework Native-level TracePoints use <code>ATrace</code> macros.</li><li>App developers can define custom traces using the <code>android.os.Trace</code> class.</li></ol><p>Consequently, Systrace can collect and centrally display all information from both upper and lower layers of Android. For Android developers, Systrace’s greatest value is transforming the internal state of the Android system from a black box to a white box. Its global perspective and visualization make it the preferred choice for analyzing complex performance issues.</p><h3 id="Practical-Applications"><a href="#Practical-Applications" class="headerlink" title="Practical Applications"></a>Practical Applications</h3><p>Because it contains a wealth of system info, parsed Systrace files are naturally suited for analyzing performance issues in both Android Apps and the system itself. App developers, system developers, and Kernel developers can all use Systrace for performance analysis.</p><ol><li>From a technical standpoint, Systrace covers major performance categories: <strong>Responsiveness</strong>, <strong>Jank&#x2F;Dropped Frames</strong>, and <strong>ANR</strong>.</li><li>From a user perspective, Systrace can analyze issues including but not limited to:<ol><li>App startup speed (cold, hot, and warm start).</li><li>Slow UI navigation or janky transitions.</li><li>Sluggishness in non-navigation actions (toggles, popups, long-presses, selection, etc.).</li><li>Slow screen on&#x2F;off, power on&#x2F;off, unlocking, or face recognition.</li><li>List scrolling jank.</li><li>Window animation jank.</li><li>Content loading jank.</li><li>System-wide sluggishness.</li><li>App unresponsiveness (ANR), freezes, or crashes.</li></ol></li></ol><p>When encountering these issues, old systems can still use Systrace HTML and Chrome. On Android 10 and later, prefer System Tracing or <code>perfetto</code> to capture a <code>.perfetto-trace</code> file and analyze it in Perfetto UI. The methods in this series, such as reading threads, wakeups, CPU scheduling, and Binder waits, still apply; the entry point has moved from Chrome HTML to Perfetto tracks, search, the selection panel, and SQL.</p><p><a id="simple-use"></a></p><h2 id="Simple-Usage-of-Systrace"><a href="#Simple-Usage-of-Systrace" class="headerlink" title="Simple Usage of Systrace"></a>Simple Usage of Systrace</h2><p>Before using Systrace, understand how the usage changed across Android versions. Older articles mention Eclipse, Android Studio Device Monitor, and <code>systrace.py</code>; today, the recommended flow is System Tracing or Perfetto. The capture rhythm is similar, but the output file and analysis tool are different.</p><p>The old flow was:</p><ul><li>Prepare the UI you want to trace on the phone.</li><li>Click to start capture, or run <code>systrace.py</code> from the command line.</li><li>Perform operations on the phone, keeping the reproduction short.</li><li>When the configured duration ends, open <code>Trace.html</code> in <strong>Chrome</strong> or the legacy UI.</li></ul><p>The current flow is:</p><ul><li>Start recording from the System Tracing developer option, or run <code>adb shell perfetto</code>.</li><li>Reproduce jank, slow response, slow launch, or another target issue.</li><li>Export the <code>.perfetto-trace</code> file.</li><li>Open it in <a href="https://ui.perfetto.dev/">Perfetto UI</a>, then use search, SQL, metrics, or <code>trace_processor_shell</code> when visual inspection is not enough.</li></ul><p>A typically captured Systrace file looks like this:<br><img src="/en/images/15618018036720.jpg"></p><p><a id="cli"></a></p><h2 id="Capturing-Systrace-x2F-Perfetto-with-Command-Line-Tools"><a href="#Capturing-Systrace-x2F-Perfetto-with-Command-Line-Tools" class="headerlink" title="Capturing Systrace &#x2F; Perfetto with Command-Line Tools"></a>Capturing Systrace &#x2F; Perfetto with Command-Line Tools</h2><p>The command-line approach is more flexible and faster. Once configured, you can get results quickly (<strong>highly recommended</strong>).<br>The Systrace tool used to live under <code>platform-tools/systrace</code> in the Android SDK. Current <code>platform-tools</code> no longer treats <code>systrace.py</code> as the recommended entry point. If you need to reproduce the old flow, use version 33 or older. For current projects, use <code>perfetto</code> directly:</p><figure class="highlight bash"><table><tr><td class="gutter"><pre><span class="line">1</span><br><span class="line">2</span><br><span class="line">3</span><br><span class="line">4</span><br><span class="line">5</span><br></pre></td><td class="code"><pre><span class="line">adb shell perfetto -t 10s -b 64mb \</span><br><span class="line">  <span class="built_in">sched</span> freq idle am wm gfx view binder_driver \</span><br><span class="line">  --out /data/misc/perfetto-traces/trace_file.perfetto-trace</span><br><span class="line"></span><br><span class="line">adb pull /data/misc/perfetto-traces/trace_file.perfetto-trace .</span><br></pre></td></tr></table></figure><p>If you need app-level custom trace points, add the package name:</p><figure class="highlight bash"><table><tr><td class="gutter"><pre><span class="line">1</span><br><span class="line">2</span><br><span class="line">3</span><br></pre></td><td class="code"><pre><span class="line">adb shell perfetto -t 10s -b 64mb -a com.example.app \</span><br><span class="line">  <span class="built_in">sched</span> freq idle am wm gfx view binder_driver \</span><br><span class="line">  --out /data/misc/perfetto-traces/app_trace.perfetto-trace</span><br></pre></td></tr></table></figure><p>The following is the old Systrace usage, useful for older systems or historical trace reproduction:</p><figure class="highlight bash"><table><tr><td class="gutter"><pre><span class="line">1</span><br><span class="line">2</span><br></pre></td><td class="code"><pre><span class="line">$ <span class="built_in">cd</span> android-sdk/platform-tools/systrace</span><br><span class="line">$ python systrace.py</span><br></pre></td></tr></table></figure><p>Configuring the path and an Alias in your Bash profile can make this very efficient. Traces from User builds contain less information than Eng or Userdebug builds. For system-service, kernel-scheduling, or vendor-policy issues, use a <strong>Userdebug</strong> device when possible. For normal app issues, User builds can still be a useful first pass through System Tracing or Perfetto, but some system detail will be missing.</p><p>After old Systrace capture, a <code>Trace.html</code> file is generated. After Perfetto capture, a <code>.perfetto-trace</code> file is generated. We’ll cover how to analyze trace files in later sections. The following options are the old <code>systrace.py</code> parameters:</p><figure class="highlight shell"><table><tr><td class="gutter"><pre><span class="line">1</span><br><span class="line">2</span><br><span class="line">3</span><br><span class="line">4</span><br><span class="line">5</span><br><span class="line">6</span><br><span class="line">7</span><br><span class="line">8</span><br><span class="line">9</span><br><span class="line">10</span><br><span class="line">11</span><br><span class="line">12</span><br><span class="line">13</span><br><span class="line">14</span><br><span class="line">15</span><br><span class="line">16</span><br><span class="line">17</span><br><span class="line">18</span><br><span class="line">19</span><br><span class="line">20</span><br><span class="line">21</span><br><span class="line">22</span><br></pre></td><td class="code"><pre><span class="line">-a appname      enable app-level tracing for a comma separated list of cmdlines; * is a wildcard matching any process</span><br><span class="line">-b N            use a trace buffer size of N KB</span><br><span class="line">-c              trace into a circular buffer</span><br><span class="line">-f filename     use the categories written in a file as space-separated</span><br><span class="line">                  values in a line</span><br><span class="line">-k fname,...    trace the listed kernel functions</span><br><span class="line">-n              ignore signals</span><br><span class="line">-s N            sleep for N seconds before tracing [default 0]</span><br><span class="line">-t N            trace for N seconds [default 5]</span><br><span class="line">-z              compress the trace dump</span><br><span class="line">--async_start   start circular trace and return immediately</span><br><span class="line">--async_dump    dump the current contents of circular trace buffer</span><br><span class="line">--async_stop    stop tracing and dump the current contents of circular</span><br><span class="line">                  trace buffer</span><br><span class="line">--stream        stream trace to stdout as it enters the trace buffer</span><br><span class="line">                  Note: this can take significant CPU time, and is best</span><br><span class="line">                  used for measuring things that are not affected by</span><br><span class="line">                  CPU performance, like pagecache usage.</span><br><span class="line">--list_categories</span><br><span class="line">                list the available tracing categories</span><br><span class="line">-o filename      write the trace to the specified file instead</span><br><span class="line">                  of stdout.</span><br></pre></td></tr></table></figure><p>While there are many parameters, you usually don’t need to worry about most of them when using tools—just check the boxes. In the CLI, we typically alias the command. For example:</p><figure class="highlight bash"><table><tr><td class="gutter"><pre><span class="line">1</span><br><span class="line">2</span><br></pre></td><td class="code"><pre><span class="line"><span class="built_in">alias</span> st-start=<span class="string">&#x27;python /path-to-sdk/platform-tools/systrace/systrace.py&#x27;</span></span><br><span class="line"><span class="built_in">alias</span> st-start-gfx-trace=<span class="string">&#x27;st-start -t 8 am,binder_driver,camera,dalvik,freq,gfx,hal,idle,input,memory,memreclaim,res,sched,sync,view,webview,wm,workq,binder&#x27;</span></span><br></pre></td></tr></table></figure><p>This allows you to simply type <code>st-start</code> to begin. Of course, to distinguish and save files, add <code>-o filename.html</code>. You don’t need to understand every parameter immediately; they will become familiar during the analysis process.</p><p>Commonly used parameters:</p><ol><li><code>-o</code>: Specifies the output file path and name.</li><li><code>-t</code>: Capture duration (you can press Enter to stop early in newer versions).</li><li><code>-b</code>: Specifies the buffer size (default is usually enough; increase it for longer traces).</li><li><code>-a</code>: Specifies the app package name (required for debugging custom TracePoints).</li></ol><p><a id="tags"></a></p><h1 id="Viewing-Supported-TAGs"><a href="#Viewing-Supported-TAGs" class="headerlink" title="Viewing Supported TAGs"></a>Viewing Supported TAGs</h1><p>The default TAGs supported by Systrace can be viewed with the following command. Different manufacturers may have various configurations; you can choose and configure TAGs based on your needs. Selecting fewer TAGs results in smaller Trace files but less content. Large Trace files can impact Chrome’s performance during analysis, so choose wisely.</p><p>Using my Android 12 device as an example, it supports the following tags (tag name on the left, description on the right):</p><figure class="highlight shell"><table><tr><td class="gutter"><pre><span class="line">1</span><br><span class="line">2</span><br><span class="line">3</span><br><span class="line">4</span><br><span class="line">5</span><br><span class="line">6</span><br><span class="line">7</span><br><span class="line">8</span><br><span class="line">9</span><br><span class="line">10</span><br><span class="line">11</span><br><span class="line">12</span><br><span class="line">13</span><br><span class="line">14</span><br><span class="line">15</span><br><span class="line">16</span><br><span class="line">17</span><br><span class="line">18</span><br><span class="line">19</span><br><span class="line">20</span><br><span class="line">21</span><br><span class="line">22</span><br><span class="line">23</span><br><span class="line">24</span><br><span class="line">25</span><br><span class="line">26</span><br><span class="line">27</span><br><span class="line">28</span><br><span class="line">29</span><br><span class="line">30</span><br><span class="line">31</span><br><span class="line">32</span><br><span class="line">33</span><br><span class="line">34</span><br><span class="line">35</span><br><span class="line">36</span><br><span class="line">37</span><br><span class="line">38</span><br><span class="line">39</span><br><span class="line">40</span><br><span class="line">41</span><br><span class="line">42</span><br><span class="line">43</span><br><span class="line">44</span><br><span class="line">45</span><br><span class="line">46</span><br><span class="line">47</span><br><span class="line">48</span><br></pre></td><td class="code"><pre><span class="line"><span class="meta prompt_">$ </span><span class="language-bash">adb shell atrace --list_categories</span></span><br><span class="line">         gfx - Graphics</span><br><span class="line">       input - Input</span><br><span class="line">        view - View System</span><br><span class="line">      webview - WebView</span><br><span class="line">           wm - Window Manager</span><br><span class="line">           am - Activity Manager</span><br><span class="line">           sm - Sync Manager</span><br><span class="line">        audio - Audio</span><br><span class="line">        video - Video</span><br><span class="line">       camera - Camera</span><br><span class="line">          hal - Hardware Modules</span><br><span class="line">          res - Resource Loading</span><br><span class="line">       dalvik - Dalvik VM</span><br><span class="line">           rs - RenderScript</span><br><span class="line">       bionic - Bionic C Library</span><br><span class="line">        power - Power Management</span><br><span class="line">           pm - Package Manager</span><br><span class="line">           ss - System Server</span><br><span class="line">     database - Database</span><br><span class="line">      network - Network</span><br><span class="line">          adb - ADB</span><br><span class="line">     vibrator - Vibrator</span><br><span class="line">         aidl - AIDL calls</span><br><span class="line">        nnapi - NNAPI</span><br><span class="line">          rro - Runtime Resource Overlay</span><br><span class="line">          pdx - PDX services</span><br><span class="line">        sched - CPU Scheduling</span><br><span class="line">          irq - IRQ Events</span><br><span class="line">          i2c - I2C Events</span><br><span class="line">         freq - CPU Frequency</span><br><span class="line">         idle - CPU Idle</span><br><span class="line">         disk - Disk I/O</span><br><span class="line">         sync - Synchronization</span><br><span class="line">        workq - Kernel Workqueues</span><br><span class="line">   memreclaim - Kernel Memory Reclaim</span><br><span class="line">   regulators - Voltage and Current Regulators</span><br><span class="line">   binder_driver - Binder Kernel driver</span><br><span class="line">   binder_lock - Binder global lock trace</span><br><span class="line">    pagecache - Page cache</span><br><span class="line">       memory - Memory</span><br><span class="line">      thermal - Thermal event</span><br><span class="line">         freq - CPU Frequency and System Clock (HAL)</span><br><span class="line">          gfx - Graphics (HAL)</span><br><span class="line">          ion - ION Allocation (HAL)</span><br><span class="line">       memory - Memory (HAL)</span><br><span class="line">        sched - CPU Scheduling and Trustzone (HAL)</span><br><span class="line">   thermal_tj - Tj power limits and frequency (HAL)</span><br></pre></td></tr></table></figure><p><a id="about"></a></p><h1 id="About-Me-amp-amp-Blog"><a href="#About-Me-amp-amp-Blog" class="headerlink" title="About Me &amp;&amp; Blog"></a>About Me &amp;&amp; Blog</h1><p>Below is my personal intro and related links. I look forward to exchanging ideas with fellow professionals. “When three walk together, one can always be my teacher!”</p><ol><li><a href="https://www.androidperformance.com/en/about/">Blogger Intro</a>: Includes personal WeChat and WeChat group links.</li><li><a href="https://www.androidperformance.com/en/2019/12/01/BlogMap/">Blog Content Navigation</a>: A guide for my blog content.</li><li><a href="https://www.androidperformance.com/en/2018/05/07/Android-performance-optimization-skills-and-tools/">Curated Excellent Blog Articles - Android Performance Optimization Must-Knows</a>: Welcome to recommend projects&#x2F;articles.</li><li><a href="https://www.androidperformance.com/en/2023/12/30/the-performance/">Android Performance Optimization Knowledge Planet</a>: Welcome to join and thank you for your support~</li></ol><blockquote><p><strong>One walks faster alone, but a group walks further together.</strong></p></blockquote><p><img src="/en/images/WechatIMG581.webp" alt="Scan WeChat QR Code"></p>]]></content>
    
    
    <summary type="html">&lt;p&gt;This is the first article in the Systrace series, primarily providing a brief introduction to Systrace, its basic usage, how to interpret Systrace traces, and how to analyze phenomena in Systrace in conjunction with other tools.&lt;/p&gt;
&lt;p&gt;The purpose of this series is to view the overall operation of the Android system from a different perspective using Systrace, while also providing an alternative angle for learning the Framework. Perhaps you’ve read many articles about the Framework but can never remember the code, or you’re unclear about the execution flow. Maybe from Systrace’s graphical perspective, you can gain a deeper understanding.&lt;/p&gt;</summary>


    <category term="Android" scheme="https://androidperformance.com/en/categories/Android/"/>
    
    
    <category term="Android" scheme="https://androidperformance.com/en/tags/Android/"/>
    
    <category term="Perfetto" scheme="https://androidperformance.com/en/tags/Perfetto/"/>
    
    <category term="Systrace" scheme="https://androidperformance.com/en/tags/Systrace/"/>
    
    <category term="Memory" scheme="https://androidperformance.com/en/tags/Memory/"/>
    
    <category term="Performance" scheme="https://androidperformance.com/en/tags/Performance/"/>
    
  </entry>
  
  <entry>
    <title>Android Systrace Basics - Why 60 FPS?</title>
    <link href="https://androidperformance.com/en/2019/05/27/why-60-fps/"/>
    <id>https://androidperformance.com/en/2019/05/27/why-60-fps/</id>
    <published>2019-05-27T08:58:00.000Z</published>
    <updated>2026-05-10T23:29:51.069Z</updated>
    
    <content type="html"><![CDATA[<p>This is the third article in the Systrace series, explaining why 60 FPS is constantly emphasized. 60 FPS is a software concept, distinct from the 60Hz mentioned in screen refresh rates. For further context, refer to: <a href="https://www.androidperformance.com/en/2019/05/15/90hz-on-android/">A New Smooth Experience: A Talk on 90Hz</a>.</p><p>The purpose of this series is to view the overall operation of the Android system from a different perspective using Systrace, while also providing an alternative angle for learning the Framework. Perhaps you’ve read many articles about the Framework but can never remember the code, or you’re unclear about the execution flow. Maybe from Systrace’s graphical perspective, you can gain a deeper understanding.</p><span id="more"></span><h1 id="Series-Article-Index"><a href="#Series-Article-Index" class="headerlink" title="Series Article Index"></a>Series Article Index</h1><ol><li><a href="https://www.androidperformance.com/en/2019/05/28/Android-Systrace-About/">Introduction to Systrace</a></li><li><a href="https://www.androidperformance.com/en/2019/07/23/Android-Systrace-Pre/">Systrace Basics - Prerequisites for Systrace</a></li><li><a href="https://www.androidperformance.com/en/2019/05/27/why-60-fps/">Systrace Basics - Why 60 fps?</a></li><li><a href="https://www.androidperformance.com/en/2019/06/29/Android-Systrace-SystemServer/">Android Systrace Basics - SystemServer Explained</a></li><li><a href="https://www.androidperformance.com/en/2020/02/14/Android-Systrace-SurfaceFlinger/">Systrace Basics - SurfaceFlinger Explained</a></li><li><a href="https://www.androidperformance.com/en/2019/11/04/Android-Systrace-Input/">Systrace Basics - Input Explained</a></li><li><a href="https://www.androidperformance.com/en/2019/12/01/Android-Systrace-Vsync/">Systrace Basics - Vsync Explained</a></li><li><a href="https://www.androidperformance.com/en/2019/10/22/Android-Choreographer/">Systrace Basics - Vsync-App: Detailed Explanation of Choreographer-Based Rendering Mechanism</a></li><li><a href="https://www.androidperformance.com/en/2019/11/06/Android-Systrace-MainThread-And-RenderThread/">Systrace Basics - MainThread and RenderThread Explained</a></li><li><a href="https://www.androidperformance.com/en/2019/12/06/Android-Systrace-Binder/">Systrace Basics - Binder and Lock Contention Explained</a></li><li><a href="https://www.androidperformance.com/en/2019/12/15/Android-Systrace-Triple-Buffer">Systrace Basics - Triple Buffer Explained</a></li><li><a href="https://www.androidperformance.com/en/2019/12/21/Android-Systrace-CPU">Systrace Basics - CPU Info Explained</a></li><li><a href="https://www.androidperformance.com/en/2021/04/24/android-systrace-smooth-in-action-1/">Systrace Smoothness in Action 1: Understanding Jank Principles</a></li><li><a href="https://www.androidperformance.com/en/2021/04/24/android-systrace-smooth-in-action-2/">Systrace Smoothness in Action 2: Case Analysis - MIUI Launcher Scroll Jank Analysis</a></li><li><a href="https://www.androidperformance.com/en/2021/04/24/android-systrace-smooth-in-action-3/">Systrace Smoothness in Action 3: FAQs During Jank Analysis</a></li><li><a href="https://www.androidperformance.com/en/2021/09/13/android-systrace-Responsiveness-in-action-1/">Systrace Responsiveness in Action 1: Understanding Responsiveness Principles</a></li><li><a href="https://www.androidperformance.com/en/2021/09/13/android-systrace-Responsiveness-in-action-2/">Systrace Responsiveness in Action 2: Responsiveness Analysis - Using App Startup as an Example</a></li><li><a href="https://www.androidperformance.com/en/2021/09/13/android-systrace-Responsiveness-in-action-3/">Systrace Responsiveness in Action 3: Extended Knowledge on Responsiveness</a></li><li><a href="https://www.androidperformance.com/en/2022/01/21/android-systrace-cpu-state-runnable/">Systrace Thread CPU State Analysis Tips - Runnable</a></li><li><a href="https://www.androidperformance.com/en/2022/03/13/android-systrace-cpu-state-running/">Systrace Thread CPU State Analysis Tips - Running</a></li><li><a href="https://www.androidperformance.com/en/2022/03/13/android-systrace-cpu-state-sleep/">Systrace Thread CPU State Analysis Tips - Sleep and Uninterruptible Sleep</a></li></ol><h1 id="Main-Content"><a href="#Main-Content" class="headerlink" title="Main Content"></a>Main Content</h1><p>Today, let’s discuss why we start with 60 FPS when talking about smoothness.</p><p>First, let’s clarify some basic concepts:</p><ol><li><strong>60 FPS</strong> means the screen updates 60 times per second.</li><li>These 60 updates must be <strong>uniform</strong>. If it’s fast one moment and slow the next, it won’t feel smooth visually.</li><li>60 times per second means one update every <strong>1&#x2F;60 ~&#x3D; 16.67 ms</strong>.</li></ol><p>With these basic concepts understood, let’s return to Android. Why is Android’s current rendering mechanism based on 60 FPS? This relates primarily to the screen refresh rate.</p><h2 id="Basic-Concepts"><a href="#Basic-Concepts" class="headerlink" title="Basic Concepts"></a>Basic Concepts</h2><ol><li>The <strong>60 FPS</strong> we referred to is software-based; we generally call it FPS.</li><li><strong>Screen Refresh Rate</strong> is hardware-based. Most current mobile screens maintain a refresh rate of <strong>60 Hz</strong>. <strong>Mobile devices typically use 60 Hz because they have higher power requirements. Increasing the refresh rate causes logic power consumption to increase linearly. Additionally, higher refresh rates mean shorter TFT data writing times, making screen design more challenging.</strong></li><li>A 60 Hz refresh rate is <strong>sufficient</strong>, but high-refresh-rate screens are now common. 90Hz, 120Hz, and 144Hz further shrink the frame budget: 60Hz gives 16.67ms, 90Hz gives 11.11ms, and 120Hz gives 8.33ms. The key question is no longer whether 60Hz is the only standard, but how software frame rate, display refresh rate, power, touch latency, and rendering budget are balanced together. Further increases still depend on breakthroughs in:<ol start="4"><li>Battery technology</li><li>Software technology</li><li>Hardware capabilities</li></ol></li></ol><p>In current conditions:</p><ol><li><strong>At 60 FPS</strong>: Android’s rendering draws every 16.67 ms, and a 60 Hz screen refreshes every 16.67 ms.</li><li><strong>At 120 FPS</strong>: Android’s rendering draws every 8.33 ms, and a 120 Hz screen refreshes every 8.33 ms.</li></ol><h2 id="Performance-Gains"><a href="#Performance-Gains" class="headerlink" title="Performance Gains"></a>Performance Gains</h2><p>To improve performance, both software and hardware must advance together. Upgrading only one is largely ineffective. If your screen is 75 Hz but the software is 60 FPS, the screen refreshes 75 times while the software only renders 60—resulting in wasted power for duplicate frames. Conversely, if your screen is 30 Hz but the software is 60 FPS, half the software-rendered frames are discarded before display.</p><p>If you want to experience a 120 Hz screen, I suggest trying an iPad Pro. You’ll notice that 60 Hz screens definitely have room for improvement.</p><p>This is a brief introduction. For deeper knowledge, you can search Google. Google also released a short video explaining “Why 60 FPS”:</p><ol><li><a href="https://www.youtube.com/watch?v=CaMTIgxCSqU">Why 60 fps</a></li><li><a href="https://www.youtube.com/watch?v=--OKrYxOb6Y">Why Games Need 60 FPS for Smoothness, but Movies Only Need 24</a></li></ol><p>The diagram below shows the tasks an Android app must complete within a single frame; we’ll discuss this in detail later:</p><p><img src="/en/images/media/15225938262396.jpg" alt="Meaning of GPU Profile"></p><h1 id="About-Me-amp-amp-Blog"><a href="#About-Me-amp-amp-Blog" class="headerlink" title="About Me &amp;&amp; Blog"></a>About Me &amp;&amp; Blog</h1><p>Below is my personal intro and related links. I look forward to exchanging ideas with fellow professionals. “When three walk together, one can always be my teacher!”</p><ol><li><a href="https://www.androidperformance.com/en/about/">Blogger Intro</a>: Includes personal WeChat and WeChat group links.</li><li><a href="https://www.androidperformance.com/en/2019/12/01/BlogMap/">Blog Content Navigation</a>: A guide for my blog content.</li><li><a href="https://www.androidperformance.com/en/2018/05/07/Android-performance-optimization-skills-and-tools/">Curated Excellent Blog Articles - Android Performance Optimization Must-Knows</a>: Welcome to recommend projects&#x2F;articles.</li><li><a href="https://www.androidperformance.com/en/2023/12/30/the-performance/">Android Performance Optimization Knowledge Planet</a>: Welcome to join and thank you for your support~</li></ol><blockquote><p><strong>One walks faster alone, but a group walks further together.</strong></p></blockquote><p><img src="/en/images/WechatIMG581.webp" alt="Scan WeChat QR Code"></p>]]></content>
    
    
    <summary type="html">&lt;p&gt;This is the third article in the Systrace series, explaining why 60 FPS is constantly emphasized. 60 FPS is a software concept, distinct from the 60Hz mentioned in screen refresh rates. For further context, refer to: &lt;a href=&quot;https://www.androidperformance.com/en/2019/05/15/90hz-on-android/&quot;&gt;A New Smooth Experience: A Talk on 90Hz&lt;/a&gt;.&lt;/p&gt;
&lt;p&gt;The purpose of this series is to view the overall operation of the Android system from a different perspective using Systrace, while also providing an alternative angle for learning the Framework. Perhaps you’ve read many articles about the Framework but can never remember the code, or you’re unclear about the execution flow. Maybe from Systrace’s graphical perspective, you can gain a deeper understanding.&lt;/p&gt;</summary>


    <category term="Android" scheme="https://androidperformance.com/en/categories/Android/"/>
    
    
    <category term="Android" scheme="https://androidperformance.com/en/tags/Android/"/>
    
    <category term="Systrace" scheme="https://androidperformance.com/en/tags/Systrace/"/>
    
    <category term="Startup" scheme="https://androidperformance.com/en/tags/Startup/"/>
    
    <category term="Jank" scheme="https://androidperformance.com/en/tags/Jank/"/>
    
    <category term="Performance" scheme="https://androidperformance.com/en/tags/Performance/"/>
    
  </entry>
  
  <entry>
    <title>Android Systrace -- Series Article Index</title>
    <link href="https://androidperformance.com/en/2019/05/26/Android_Systrace_0/"/>
    <id>https://androidperformance.com/en/2019/05/26/Android_Systrace_0/</id>
    <published>2019-05-26T08:54:34.000Z</published>
    <updated>2026-05-10T23:29:51.061Z</updated>
    
    <content type="html"><![CDATA[<p>As Systrace becomes increasingly feature-rich, combined with Android version iterations, the previous Systrace series tutorials have become somewhat outdated. Additionally, as my own skills have improved, I’ve been able to extract more information from Systrace, which has been very helpful in solving various performance issues. I need to document these skills to enhance my summarization and organization abilities, and if it helps those who read these articles, that would be excellent.</p><p>The purpose of this series is to view the overall operation of the Android system from a different perspective using Systrace, while also providing an alternative angle for learning the Framework. Perhaps you’ve read many articles about the Framework but can never remember the code, or you’re unclear about the execution flow. Maybe from Systrace’s graphical perspective, you can gain a deeper understanding.</p><span id="more"></span><p>As Google announced the deprecation of the Systrace tool and introduced Perfetto, Perfetto has essentially replaced Systrace in my daily work. Meanwhile, major manufacturers like OPPO and Vivo have also switched from Systrace to Perfetto. Many newcomers to Android performance optimization find Perfetto’s dazzling interface and complex features overwhelming, and they’ve been hoping I could present the previous Systrace articles using Perfetto.</p><p>Read this index along two lines now: the Systrace articles explain Android Framework and Linux scheduling mechanisms, while the Perfetto articles explain the current capture, opening, search, SQL, and large-trace workflows. The old flow was <code>systrace.py</code> generating HTML. The current flow is System Tracing or <code>adb shell perfetto</code> generating <code>.perfetto-trace</code>, then Perfetto UI or <code>trace_processor</code> for analysis. ATrace and ftrace still exist underneath; the entry point and analysis capability changed.</p><p>This series aims to examine the overall operation of the Android system from a new perspective using Perfetto. Additionally, it provides a different angle for learning key modules such as App, Framework, and Linux. Although you may have read many articles about Android Framework, App development, and performance optimization, you might still feel confused because you can’t remember the code or don’t understand the execution flow. Through Perfetto, this graphical tool, you may gain a deeper understanding.</p><h1 id="Perfetto-Series-Index"><a href="#Perfetto-Series-Index" class="headerlink" title="Perfetto Series Index"></a>Perfetto Series Index</h1><ol><li><a href="https://www.androidperformance.com/en/2024/03/27/Android-Perfetto-101/#/Perfetto-%E7%B3%BB%E5%88%97%E7%9B%AE%E5%BD%95">Android Perfetto Series Index</a></li><li><a href="https://www.androidperformance.com/en/2024/05/21/Android-Perfetto-01-What-is-perfetto/">Android Perfetto Series 1: Introduction to Perfetto</a></li><li><a href="https://www.androidperformance.com/en/2024/05/21/Android-Perfetto-02-how-to-get-perfetto/">Android Perfetto Series 2: Capturing Perfetto Traces</a></li><li><a href="https://www.androidperformance.com/en/2024/05/21/Android-Perfetto-03-how-to-analysis-perfetto/">Android Perfetto Series 3: Getting Familiar with Perfetto View</a></li><li><a href="https://www.androidperformance.com/en/2025/02/08/Android-Perfetto-04-Open-Big-Trace-With-Command-Line/">Android Perfetto Series 4: Opening Large Traces Locally Using Command Line</a></li><li><a href="https://www.androidperformance.com/en/2025/03/26/Android-Perfetto-05-Chorergrapher/">Android Perfetto Series 5: Android App Rendering Pipeline Based on Choreographer</a></li><li><a href="https://www.androidperformance.com/en/2025/04/26/Android-Perfetto-06-Why-120Hz/">Android Perfetto Series 6: Why 120Hz? Advantages and Challenges of High Refresh Rate</a></li><li><a href="https://www.androidperformance.com/en/2025/08/02/Android-Perfetto-07-MainThread-And-RenderThread/">Android Perfetto Series 7 - MainThread and RenderThread Explained</a></li><li><a href="https://www.androidperformance.com/en/2025/08/05/Android-Perfetto-08-Vsync/">Android Perfetto Series 8: Deep Dive into Vsync Mechanism and Performance Analysis</a></li><li><a href="https://www.androidperformance.com/en/2025/11/12/Android-Perfetto-09-CPU/">Android Perfetto Series 9 - CPU Information Explained</a></li><li><a href="https://www.androidperformance.com/en/2025/11/16/Android-Perfetto-10-Binder/">Android Perfetto Series 10: Binder Scheduling and Lock Contention</a></li><li><a href="https://www.bilibili.com/video/BV1oi82efE4D/?vd_source=0c6d2191e785de0a36dc21a9da7e664e">Video (Bilibili) - Android Perfetto Basics and Case Studies</a></li><li><a href="https://www.bilibili.com/video/BV17A6bBLECu/">Video (Bilibili) - Android Perfetto: Trace Graph Types - AOSP, WebView, Flutter + OEM System Optimization</a></li></ol><h1 id="Systrace-Series-Article-Index"><a href="#Systrace-Series-Article-Index" class="headerlink" title="Systrace Series Article Index"></a>Systrace Series Article Index</h1><p>This article serves as an index. After subsequent articles are updated, they will be aggregated here. The content is as follows:</p><p>When migrating from the old Systrace series to the current Perfetto workflow, start with this mapping:</p><table><thead><tr><th>Systrace topic</th><th>Matching Perfetto articles</th></tr></thead><tbody><tr><td>Introduction, prerequisites, capture and opening</td><td><a href="https://www.androidperformance.com/en/2024/05/21/Android-Perfetto-01-What-is-perfetto/">Perfetto 1</a> &#x2F; <a href="https://www.androidperformance.com/en/2024/05/21/Android-Perfetto-02-how-to-get-perfetto/">Perfetto 2</a> &#x2F; <a href="https://www.androidperformance.com/en/2024/05/21/Android-Perfetto-03-how-to-analysis-perfetto/">Perfetto 3</a></td></tr><tr><td>Why 60 fps and high refresh rate</td><td><a href="https://www.androidperformance.com/en/2025/04/26/Android-Perfetto-06-Why-120Hz/">Perfetto 6</a></td></tr><tr><td>Choreographer, MainThread, RenderThread, jank analysis</td><td><a href="https://www.androidperformance.com/en/2025/03/26/Android-Perfetto-05-Chorergrapher/">Perfetto 5</a> &#x2F; <a href="https://www.androidperformance.com/en/2025/08/02/Android-Perfetto-07-MainThread-And-RenderThread/">Perfetto 7</a></td></tr><tr><td>Vsync, SurfaceFlinger, Triple Buffer</td><td><a href="https://www.androidperformance.com/en/2025/08/05/Android-Perfetto-08-Vsync/">Perfetto 8</a></td></tr><tr><td>CPU and thread states</td><td><a href="https://www.androidperformance.com/en/2025/11/12/Android-Perfetto-09-CPU/">Perfetto 9</a></td></tr><tr><td>Binder, lock contention, SystemServer waits</td><td><a href="https://www.androidperformance.com/en/2025/11/16/Android-Perfetto-10-Binder/">Perfetto 10</a></td></tr></tbody></table><ol><li><a href="https://www.androidperformance.com/en/2019/05/28/Android-Systrace-About/">Systrace Introduction</a></li><li><a href="https://www.androidperformance.com/en/2019/07/23/Android-Systrace-Pre/">Systrace Basics - Systrace Prerequisites</a></li><li><a href="https://www.androidperformance.com/en/2019/05/27/why-60-fps/">Systrace Basics - Why 60 fps?</a></li><li><a href="https://www.androidperformance.com/en/2019/06/29/Android-Systrace-SystemServer/">Systrace Basics - SystemServer Explained</a></li><li><a href="https://www.androidperformance.com/en/2020/02/14/Android-Systrace-SurfaceFlinger/">Systrace Basics - SurfaceFlinger Explained</a></li><li><a href="https://www.androidperformance.com/en/2019/11/04/Android-Systrace-Input/">Systrace Basics - Input Explained</a></li><li><a href="https://www.androidperformance.com/en/2019/12/01/Android-Systrace-Vsync/">Systrace Basics - Vsync Explained</a></li><li><a href="https://www.androidperformance.com/en/2019/10/22/Android-Choreographer/">Systrace Basics - Vsync-App: Detailed Explanation of Choreographer-Based Rendering Mechanism</a></li><li><a href="https://www.androidperformance.com/en/2019/11/06/Android-Systrace-MainThread-And-RenderThread/">Systrace Basics - MainThread and RenderThread Explained</a></li><li><a href="https://www.androidperformance.com/en/2019/12/06/Android-Systrace-Binder/">Systrace Basics - Binder and Lock Contention Explained</a></li><li><a href="https://www.androidperformance.com/en/2019/12/15/Android-Systrace-Triple-Buffer">Systrace Basics - Triple Buffer Explained</a></li><li><a href="https://www.androidperformance.com/en/2019/12/21/Android-Systrace-CPU">Systrace Basics - CPU Info Explained</a></li><li><a href="https://www.androidperformance.com/en/2021/04/24/android-systrace-smooth-in-action-1/">Systrace Smoothness Practice 1: Understanding Jank Principles</a></li><li><a href="https://www.androidperformance.com/en/2021/04/24/android-systrace-smooth-in-action-2/">Systrace Smoothness Practice 2: Case Analysis - MIUI Launcher Scroll Jank Analysis</a></li><li><a href="https://www.androidperformance.com/en/2021/04/24/android-systrace-smooth-in-action-3/">Systrace Smoothness Practice 3: Questions During Jank Analysis</a></li><li><a href="https://www.androidperformance.com/en/2021/09/13/android-systrace-Responsiveness-in-action-1/">Systrace Response Speed Practice 1: Understanding Response Speed Principles</a></li><li><a href="https://www.androidperformance.com/en/2021/09/13/android-systrace-Responsiveness-in-action-2/">Systrace Response Speed Practice 2: Response Speed Analysis - Using App Startup as an Example</a></li><li><a href="https://www.androidperformance.com/en/2021/09/13/android-systrace-Responsiveness-in-action-3/">Systrace Response Speed Practice 3: Extended Knowledge on Response Speed</a></li><li><a href="https://www.androidperformance.com/en/2022/01/21/android-systrace-cpu-state-runnable/">Systrace Thread CPU State Analysis Tips - Runnable</a></li><li><a href="https://www.androidperformance.com/en/2022/03/13/android-systrace-cpu-state-running/">Systrace Thread CPU State Analysis Tips - Running</a></li><li><a href="https://www.androidperformance.com/en/2022/03/13/android-systrace-cpu-state-sleep/">Systrace Thread CPU State Analysis Tips - Sleep and Uninterruptible Sleep</a></li></ol><p>2023-10 update:</p><p>Starting to prepare the Perfetto series</p><h2 id="Target-Audience"><a href="#Target-Audience" class="headerlink" title="Target Audience"></a>Target Audience</h2><p>This series of articles is suitable for both application developers and system developers. I will consider both perspectives when writing. As a system developer, here are roughly my advantages:</p><ol><li>Access to system source code, making it convenient to debug and modify code, and see results on the phone at any time</li><li>Certain understanding of the system framework</li><li>Certain understanding of system tuning</li></ol><p>Based on these points, I will leverage these advantages in my writing to bring you something different:</p><ol><li>Learning Android Framework through Systrace</li><li>Modifying certain system configurations to show everyone the results: for example, the impact of Buffer count on applications</li><li>Introducing considerations and trade-offs that system manufacturers make when building systems</li><li>Introducing important but often overlooked points during application development</li></ol><h2 id="Update-Log"><a href="#Update-Log" class="headerlink" title="Update Log"></a>Update Log</h2><p>The plan is to update one article per week, giving myself a goal and accountability.</p><ol><li>2018-03-30 Index update: <a href="https://www.androidperformance.com/en/2018/05/03/Android_Systrace_0.html">Systrace Series Article Index</a></li><li>2018-04-01 Article update: <a href="https://www.androidperformance.com/en/2018/04/01/why-60-fps.html">Systrace Basics - Why 60 fps?</a></li><li>2019-07-23 Article update: <a href="https://www.androidperformance.com/en/2019/07/23/Android-Systrace-Pre/">Systrace Basics - Systrace Prerequisites</a></li><li>2019-10-22 Article update: <a href="https://www.androidperformance.com/en/2019/10/22/Android-Choreographer/">Systrace Basics - Vsync-App: Detailed Explanation of Choreographer-Based Rendering Mechanism</a></li><li>2019-11-04 Article update: <a href="https://www.androidperformance.com/en/2019/11/04/Android-Systrace-Input/">Systrace Basics - Input Explained</a></li><li>2019-11-06 Article update: <a href="https://www.androidperformance.com/en/2019/11/06/Android-Systrace-MainThread-And-RenderThread/">Systrace Basics - MainThread and RenderThread Explained</a></li><li>2019-12-01 Article update: <a href="https://www.androidperformance.com/en/2019/12/01/Android-Systrace-Vsync/">Systrace Basics - Vsync Explained</a></li><li>2019-12-06 Article update: <a href="https://www.androidperformance.com/en/2019/12/06/Android-Systrace-Binder/">Systrace Basics - Binder and Lock Contention Explained</a></li><li>2019-12-15 Article update: <a href="https://www.androidperformance.com/en/2019/12/15/Android-Systrace-Triple-Buffer">Systrace Basics - Triple Buffer Explained</a></li><li>2019-12-21 Article update: <a href="https://www.androidperformance.com/en/2019/12/21/Android-Systrace-CPU">Systrace Basics - CPU Info Explained</a></li><li>2020-02-04 Article update: <a href="https://www.androidperformance.com/en/2019/06/29/Android-Systrace-SystemServer/">Systrace Basics - SystemServer Explained</a></li><li>2020-02-14 Article update: <a href="https://www.androidperformance.com/en/2020/02/14/Android-Systrace-SurfaceFlinger/">Systrace Basics - SurfaceFlinger Explained</a></li><li>2021-04-24 Article update: <a href="https://www.androidperformance.com/en/2021/04/24/android-systrace-smooth-in-action-1/">Systrace Smoothness Practice 1: Understanding Jank Principles</a></li><li>2021-04-24 Article update: <a href="https://www.androidperformance.com/en/2021/04/24/android-systrace-smooth-in-action-2/">Systrace Smoothness Practice 2: Case Analysis - MIUI Launcher Scroll Jank Analysis</a></li><li>2021-04-24 Article update: <a href="https://www.androidperformance.com/en/2021/04/24/android-systrace-smooth-in-action-3/">Systrace Smoothness Practice 3: Questions During Jank Analysis</a></li><li>2021-10-28 Article update: <a href="https://www.androidperformance.com/en/2021/09/13/android-systrace-Responsiveness-in-action-1/">Systrace Response Speed Practice 1: Understanding Response Speed Principles</a></li><li>2021-10-28 Article update: <a href="https://www.androidperformance.com/en/2021/09/13/android-systrace-Responsiveness-in-action-2/">Systrace Response Speed Practice 2: Response Speed Analysis - Using App Startup as an Example</a></li><li>2021-10-28 Article update: <a href="https://www.androidperformance.com/en/2021/09/13/android-systrace-Responsiveness-in-action-3/">Systrace Response Speed Practice 3: Extended Knowledge on Response Speed</a></li></ol><h1 id="About-Me-amp-amp-Blog"><a href="#About-Me-amp-amp-Blog" class="headerlink" title="About Me &amp;&amp; Blog"></a>About Me &amp;&amp; Blog</h1><p>Below is my personal introduction and related links. I look forward to exchanging ideas with fellow professionals. When three walk together, one can always be my teacher!</p><ol><li><a href="https://www.androidperformance.com/en/about/">Blogger Introduction</a>: Contains my personal WeChat and WeChat group links.</li><li><a href="https://www.androidperformance.com/en/2019/12/01/BlogMap/">Blog Content Navigation</a>: A navigation guide for my blog content.</li><li><a href="https://www.androidperformance.com/en/2018/05/07/Android-performance-optimization-skills-and-tools/">Curated Collection of Excellent Blog Articles - Android Performance Optimization Must-Knows</a>: Welcome to recommend articles (via WeChat private message)</li><li><a href="https://www.androidperformance.com/en/2023/12/30/the-performance/">Android Performance Optimization Knowledge Planet</a>: Welcome to join, thank you for your support~</li></ol><blockquote><p><strong>One person can walk faster, but a group can walk further</strong></p></blockquote><p><img src="/en/images/WechatIMG581.webp" alt="Scan WeChat QR Code"></p>]]></content>
    
    
    <summary type="html">&lt;p&gt;As Systrace becomes increasingly feature-rich, combined with Android version iterations, the previous Systrace series tutorials have become somewhat outdated. Additionally, as my own skills have improved, I’ve been able to extract more information from Systrace, which has been very helpful in solving various performance issues. I need to document these skills to enhance my summarization and organization abilities, and if it helps those who read these articles, that would be excellent.&lt;/p&gt;
&lt;p&gt;The purpose of this series is to view the overall operation of the Android system from a different perspective using Systrace, while also providing an alternative angle for learning the Framework. Perhaps you’ve read many articles about the Framework but can never remember the code, or you’re unclear about the execution flow. Maybe from Systrace’s graphical perspective, you can gain a deeper understanding.&lt;/p&gt;</summary>


    <category term="Android" scheme="https://androidperformance.com/en/categories/Android/"/>
    
    
    <category term="Android" scheme="https://androidperformance.com/en/tags/Android/"/>
    
    <category term="Perfetto" scheme="https://androidperformance.com/en/tags/Perfetto/"/>
    
    <category term="Systrace" scheme="https://androidperformance.com/en/tags/Systrace/"/>
    
    <category term="Startup" scheme="https://androidperformance.com/en/tags/Startup/"/>
    
    <category term="Performance" scheme="https://androidperformance.com/en/tags/Performance/"/>
    
  </entry>
  
  <entry>
    <title>A New Era of Smoothness: Thoughts on 90Hz on Android</title>
    <link href="https://androidperformance.com/en/2019/05/15/90hz-on-android/"/>
    <id>https://androidperformance.com/en/2019/05/15/90hz-on-android/</id>
    <published>2019-05-15T09:57:53.000Z</published>
    <updated>2026-05-10T23:29:51.052Z</updated>
    
    <content type="html"><![CDATA[<p>High-refresh-rate screens have been common on PCs for years, but they’ve only recently made their way to Android. While the Razer Phone introduced a 120Hz screen last year to a quiet reception, I believe the 90Hz screens on the Nubia Red Magic 3 and OnePlus 7 Pro represent the current “sweet spot” for Android. They offer a tangible, immediate boost to the user experience. If you’ve never used a high-refresh-rate mobile screen, I highly recommend visiting an Apple Store to try out the 120Hz ProMotion display on the iPad Pro.</p><h1 id="Terminology-Explained"><a href="#Terminology-Explained" class="headerlink" title="Terminology Explained"></a>Terminology Explained</h1><h2 id="What-is-Screen-Refresh-Rate"><a href="#What-is-Screen-Refresh-Rate" class="headerlink" title="What is Screen Refresh Rate?"></a>What is Screen Refresh Rate?</h2><p>This is a <strong>hardware</strong> specification. It refers to how often the display panel refreshes the image on the screen.</p><p>A 60Hz refresh rate means the screen refreshes 60 times per second; 90Hz means 90 refreshes per second. The screen doesn’t care <em>what</em> it’s displaying; it just pulls data from its buffer and shows it at the defined frequency.</p><h2 id="What-is-FPS"><a href="#What-is-FPS" class="headerlink" title="What is FPS?"></a>What is FPS?</h2><p>FPS (Frames Per Second) is a <strong>software</strong> metric. It refers to how many unique frames the operating system and apps generate every second. While the screen refreshes at a constant rate, the software might produce frames at varying speeds.</p><h2 id="What-is-Vsync"><a href="#What-is-Vsync" class="headerlink" title="What is Vsync?"></a>What is Vsync?</h2><p>Vsync (Vertical Synchronization) is the mechanism that syncs the software’s <strong>FPS</strong> with the hardware’s <strong>Refresh Rate</strong>. Its primary job is to prevent “tearing.”</p><ul><li><strong>60Hz System</strong>: One frame must be generated every <strong>16.67ms</strong> (1&#x2F;60s).</li><li><strong>90Hz System</strong>: One frame must be generated every <strong>11.11ms</strong> (1&#x2F;90s) to avoid a “FrameMiss.”</li></ul><h2 id="What-is-the-Input-Scanning-Cycle"><a href="#What-is-the-Input-Scanning-Cycle" class="headerlink" title="What is the Input Scanning Cycle?"></a>What is the Input Scanning Cycle?</h2><p>Most modern phones have an input scanning cycle around 8ms. Since Android’s display system is Vsync-driven, input events are typically processed at the start of each Vsync pulse.</p><ul><li>In a 16.67ms Vsync window, there’s comfortably room for 2 input points.</li><li>In an 11.11ms Vsync window, you might get 2 points, but often only 1. This can sometimes lead to a slightly “uneven” input feel if not handled correctly.</li></ul><h1 id="The-90Hz-User-Experience"><a href="#The-90Hz-User-Experience" class="headerlink" title="The 90Hz User Experience"></a>The 90Hz User Experience</h1><p>The best experience occurs when the <strong>Hardware Refresh Rate</strong> matches the <strong>Software FPS</strong>. Currently, 90Hz hardware + 90 FPS software is the ideal combo.</p><ul><li><strong>90Hz screen running 60 FPS software</strong>: The screen refreshes, but the content isn’t ready, so it displays the previous frame again (judder).</li><li><strong>60Hz screen running 90 FPS software</strong>: The software prepares frames faster than the screen can show them, leading to wasted CPU&#x2F;GPU cycles and dropped frames.</li></ul><p>While 120Hz is the ultimate goal (as seen on iPad Pro), current Android architecture and hardware are still catching up to that 8.3ms-per-frame requirement. We’ll likely see mature 120Hz Android flagships in 2020.</p><p>Check out this comparison video: <a href="https://weibo.com/tv/v/HusfeiEbX?fid=1034:4372578974817409">90Hz vs. 60Hz Screen Comparison</a></p><h1 id="How-90-FPS-Works-Platform-Perspective"><a href="#How-90-FPS-Works-Platform-Perspective" class="headerlink" title="How 90 FPS Works (Platform Perspective)"></a>How 90 FPS Works (Platform Perspective)</h1><p>The Android rendering pipeline follows these basic steps:</p><ol><li><strong>Event Trigger</strong>: User taps an icon or scrolls a list.</li><li><strong>Dispatch</strong>: System sends the event to the app.</li><li><strong>App Logic</strong>: The app processes the event (e.g., updating list state).</li><li><strong>Choreography</strong>: If UI changed, the app runs <code>measure</code>, <code>layout</code>, and <code>draw</code>. Hardware acceleration uses the <code>RenderThread</code>.</li><li><strong>Composition</strong>: The completed buffer is sent to <code>SurfaceFlinger</code>, which composites all layers and sends them to the display hardware.</li></ol><p>The process for 90 FPS is the same as 60 FPS—it just has to happen faster.</p><h2 id="App-Rendering-Flow-at-90-FPS"><a href="#App-Rendering-Flow-at-90-FPS" class="headerlink" title="App Rendering Flow at 90 FPS"></a>App Rendering Flow at 90 FPS</h2><p><img src="/en/images/15586889336528.jpg" alt="90 FPS App Pipeline"></p><h2 id="SurfaceFlinger-Flow-at-90-FPS"><a href="#SurfaceFlinger-Flow-at-90-FPS" class="headerlink" title="SurfaceFlinger Flow at 90 FPS"></a>SurfaceFlinger Flow at 90 FPS</h2><p><img src="/en/images/15586889505177.jpg" alt="90 FPS SF Pipeline"></p><h1 id="Advantages-and-Challenges"><a href="#Advantages-and-Challenges" class="headerlink" title="Advantages and Challenges"></a>Advantages and Challenges</h1><h2 id="Advantages"><a href="#Advantages" class="headerlink" title="Advantages"></a>Advantages</h2><ol><li><strong>Unmatched Fluidity</strong>: Human eyes are highly sensitive to motion. Once you get used to the smoothness of 90 frames per second, 60 FPS begins to look stuttery and disconnected.</li><li><strong>Irreversible Change</strong>: High refresh rate is a “one-way street.” Once you adapt to it, going back to a lower refresh rate feels like a downgrade.</li><li><strong>Future-Proofing</strong>: As we keep our phones longer, buying a device with a top-tier screen, SoC, and UFS 3.0 storage is a wise investment.</li></ol><h2 id="Challenges"><a href="#Challenges" class="headerlink" title="Challenges"></a>Challenges</h2><ol><li><strong>Performance</strong>:<ul><li>App and System components must shrink their processing windows from <strong>16.6ms</strong> to <strong>11.11ms</strong>.</li><li>This requires far more aggressive hardware (Snapdragon 855+, UFS 3.0). This explains why the Razer Phone struggled at 120Hz—the hardware simply weren’t ready for 8.3ms frames.</li></ul></li><li><strong>Power Consumption</strong>: 90Hz screens consume significantly more battery, especially at high resolutions. Manufacturers must optimize power usage or allow dynamic switching to 60Hz in static scenarios.</li><li><strong>App &amp; Game Adaptation</strong>:<ul><li>Standard apps usually run fine, but their fluidity depends on code quality.</li><li>Games must be specifically optimized by developers to support and maintain a stable 90 FPS.</li><li>View types like <code>WebView</code> or <code>SurfaceView</code> require content-aware adjustments.</li></ul></li></ol><h1 id="About-Me-amp-amp-Blog"><a href="#About-Me-amp-amp-Blog" class="headerlink" title="About Me &amp;&amp; Blog"></a>About Me &amp;&amp; Blog</h1><p>(Links and introduction)</p>]]></content>


    <summary type="html">&lt;p&gt;High-refresh-rate screens have been common on PCs for years, but they’ve only recently made their way to Android. While the Razer Phone i</summary>


    <category term="Android" scheme="https://androidperformance.com/en/categories/Android/"/>
    
    
    <category term="Android" scheme="https://androidperformance.com/en/tags/Android/"/>
    
    <category term="Systrace" scheme="https://androidperformance.com/en/tags/Systrace/"/>
    
    <category term="Startup" scheme="https://androidperformance.com/en/tags/Startup/"/>
    
    <category term="Jank" scheme="https://androidperformance.com/en/tags/Jank/"/>
    
    <category term="Memory" scheme="https://androidperformance.com/en/tags/Memory/"/>
    
  </entry>
  
  <entry>
    <title>Sharp Tools - Efficient Tool Recommendations</title>
    <link href="https://androidperformance.com/en/2019/04/07/Sharp-Tools/"/>
    <id>https://androidperformance.com/en/2019/04/07/Sharp-Tools/</id>
    <published>2019-04-07T08:22:32.000Z</published>
    <updated>2026-06-02T15:41:12.166Z</updated>
    
    <content type="html"><![CDATA[<p>I’ve been following the <a href="https://liqi.io/community/">Sharp Tools Community Program</a> for a long time. I’ve learned a lot from everyone’s sharing. As stated in the beginning: “<strong>Both tools and inspiration are sharp tools. When tools and inspiration from different fields and creators collide, more possibilities arise.</strong>“ Below are my simple answers to the six questions of the Sharp Tools Community Program. I hope some parts will be helpful to you.</p><h2 id="Introduce-yourself-and-the-work-you-do"><a href="#Introduce-yourself-and-the-work-you-do" class="headerlink" title="Introduce yourself and the work you do."></a>Introduce yourself and the work you do.</h2><p>I am an Android System Development Engineer working in the system R&amp;D department of a smartphone manufacturer. My work mainly involves Android system-related tasks, such as performance, power consumption, stability, and framework maintenance. It’s quite varied—I often call myself a “jack-of-all-trades.”</p><p>As for hobbies, I enjoy basketball, running, and gaming—essential skills for any programmer. I also appreciate more “artistic” pursuits like reading, raising cats, and drinking tea. In my spare time, I like browsing Bilibili and YouTube. When I have time, I try to finish pending articles for my blog. Currently, I’m obsessed with losing weight and fighting a life-and-death struggle against my belly.</p><h2 id="What-hardware-are-you-using"><a href="#What-hardware-are-you-using" class="headerlink" title="What hardware are you using?"></a>What hardware are you using?</h2><p><strong>Computers</strong>: I primarily use three. A <strong>MacBook Pro</strong> for writing, developing my own small apps, and photo processing. A <strong>desktop provided by my company</strong> running Ubuntu, mainly for work and essential for compiling Android source code. A <strong>self-built desktop</strong> mainly for gaming and compiling AOSP code.</p><p><strong>Phones</strong>: I also have three. My main device is an <strong>iPhone X</strong>—I’m satisfied with everything except the battery life. My backup is a <strong>OnePlus 6</strong>, an Android flagship; as an Android engineer, I must have a solid Android device. The third one is a <strong>Pixel</strong>, used mainly for running my own compiled AOSP code—a must-have for studying the framework.</p><p><strong>Other Hardware</strong>: Apple ecosystem products like the Watch, iPad Pro, and AirPods. Sony’s WH-1000XM3 wireless headphones. A Kindle Voyage specifically for e-books.</p><h2 id="What-about-software"><a href="#What-about-software" class="headerlink" title="What about software?"></a>What about software?</h2><ul><li><strong>Things 3</strong>: Primarily for scheduling daily work and recording tasks.</li><li><strong>MWeb</strong>: Dedicated to writing—this article was written using MWeb.</li><li><strong>Keep</strong>: A great fitness helper. I just follow the courses; it’s great for tracking progress and setting goals, especially during HIIT sessions on the treadmill.</li><li><strong>Holphin Accounting</strong>: A bookkeeping app for basic needs.</li><li><strong>Kindle &amp;&amp; WeChat Read</strong>: Reading apps; the two libraries complement each other. E-books are very convenient, especially on the iPad Pro.</li><li><strong>YouTube &amp;&amp; Bilibili</strong>: My main sources for learning and entertainment.</li><li><strong>Network tools</strong>: I keep the corresponding tools ready on Android, Mac, and iPhone&#x2F;iPad. The widget makes it very convenient to toggle.</li><li><strong>Geek Time &amp;&amp; Deodao</strong>: Knowledge-sharing platforms. I find that hearing what others are doing and how they do it is very helpful for self-improvement and avoiding pitfalls.</li><li><strong>Google Photos</strong>: Almost all my photos are stored here. I’d be devastated if I ever lost access…</li><li><strong>Reeder</strong>: I once maintained a <a href="https://github.com/Gracker/Rss-IT">Feed list</a> for developers, and I use Reeder to keep up with it.</li><li><strong>Android Studio &amp;&amp; VS Code</strong>: Productivity software; one for Framework Java code and the other for C&#x2F;C++ code.</li><li><strong>RescueTime</strong>: Used to track working hours across all platforms. It’s eye-opening (and sometimes depressing) to see where those 10+ hours go every day.</li><li><strong>Shimo Docs</strong>: For daily&#x2F;weekly reports and research notes. It’s cross-platform, syncs perfectly, and is great for collaboration. The web version is excellent.</li><li><strong>Nutstore (JianGuoYun)</strong>: A cross-platform cloud drive. I never fear losing data once it’s uploaded. (The Ubuntu support is a huge plus for programmers.)</li><li><strong>Evernote</strong>: Used to be for notes, but now it’s more of a collection center for interesting articles I find. I use Shimo Docs for daily work records.</li></ul><h2 id="What-is-your-ideal-working-environment"><a href="#What-is-your-ideal-working-environment" class="headerlink" title="What is your ideal working environment?"></a>What is your ideal working environment?</h2><p>My ideal working environment is <strong>Work-Life Balance</strong>. As mentioned in the popular <a href="https://996.icu/#/en_US">996.ICU</a> project, my current workload is similar to that. Therefore, I prefer the environment described in the <a href="https://github.com/formulahendry/955.WLB">955.WLB</a> project.</p><p>The biggest pressure of a 996 schedule is the lack of personal time for self-improvement. Working until 10 or 11 PM every day leaves no time for fitness, reading, or learning. As an article once said, “The most hidden way to ruin a person is to make them too busy to grow.”</p><blockquote><p>If a person only learns from their work, this single way of learning will inevitably lead to a decreasing marginal contribution to growth. You must give yourself time to grow every day through diverse learning methods outside of work. Continuous growth is essential for a rising career path.</p></blockquote><p>In summary, my ideal working environment includes <strong>like-minded colleagues, work I love, and the time&#x2F;space for personal growth.</strong></p><h2 id="How-do-you-usually-get-inspiration-for-your-work"><a href="#How-do-you-usually-get-inspiration-for-your-work" class="headerlink" title="How do you usually get inspiration for your work?"></a>How do you usually get inspiration for your work?</h2><p>One way is through <strong>reading</strong>—extracting the essence of others’ thoughts to see if I can apply, improve, or expand upon them. Another is <strong>thinking and recording</strong>—drawing flowcharts while thinking and capturing sparks of ideas.</p><p>Admittedly, it’s not always easy. When busy, there’s little time left for deep reading and reflection. I’m always open to advice on this.</p><h2 id="Recommend-one-“Sharp-Tool”-to-everyone"><a href="#Recommend-one-“Sharp-Tool”-to-everyone" class="headerlink" title="Recommend one “Sharp Tool” to everyone?"></a>Recommend one “Sharp Tool” to everyone?</h2><p>Instead of hardware or software, I want to recommend a learning method: <strong>Record - Summarize - Output</strong>. These three steps are closely linked:</p><p><strong>Record</strong>: As the saying goes, “The palest ink is better than the best memory.” In today’s information explosion, having your own recording method is crucial. To-do lists, random ideas, problems encountered, solutions found, great articles, blog ideas, or YouTube tutorials—recording keeps you organized.</p><p><strong>Summarize</strong>: Summarizing helps organize scattered thoughts or knowledge. A clear structure helps you see the big picture. Project summaries help avoid repeating mistakes, and knowledge summaries deepen your understanding of a specific topic.</p><p><strong>Output</strong>: Output can be private notes, blogs, or videos. Output reinforces your own knowledge by explaining it to others. To explain something clearly, you must know it thoroughly. Discussions following your output further strengthen your understanding. It also helps others while building your reputation—if you’re good, you should let others know it too.</p><h2 id="Conclusion"><a href="#Conclusion" class="headerlink" title="Conclusion"></a>Conclusion</h2><p>I recently visited Japan during the cherry blossom season. Let’s end with a photo of the blossoms.<br><img src="/en/images/media/performancecase/15546301230322.jpg" alt="Cherry Blossoms"></p><blockquote><p>This article is part of the “Sharp Tools Community Program.” Discover more creators and their tools at: <a href="http://liqi.io/community/">http://liqi.io/community/</a></p></blockquote><h1 id="About-Me-amp-amp-Blog"><a href="#About-Me-amp-amp-Blog" class="headerlink" title="About Me &amp;&amp; Blog"></a>About Me &amp;&amp; Blog</h1><p>Below is my personal intro and related links. I look forward to exchanging ideas with fellow professionals. “When three walk together, one can always be my teacher!”</p><ol><li><a href="https://www.androidperformance.com/en/about/">Blogger Intro</a></li><li><a href="https://www.androidperformance.com/en/2019/12/01/BlogMap/">Blog Content Navigation</a>: A guide for my blog content.</li><li><a href="https://www.androidperformance.com/en/2018/05/07/Android-performance-optimization-skills-and-tools/">Curated Excellent Blog Articles - Android Performance Optimization Must-Knows</a></li><li><a href="https://www.androidperformance.com/en/2023/12/30/the-performance/">Android Performance Optimization Knowledge Planet</a></li></ol><blockquote><p><strong>One walks faster alone, but a group walks further together.</strong></p></blockquote><p><img src="/en/images/WechatIMG581.webp" alt="Scan WeChat QR Code"></p>]]></content>


    <summary type="html">&lt;p&gt;I’ve been following the &lt;a href=&quot;https://liqi.io/community/&quot;&gt;Sharp Tools Community Program&lt;/a&gt; for a long time. I’ve learned a lot from e</summary>


    <category term="Reading Notes" scheme="https://androidperformance.com/en/categories/Reading-Notes/"/>
    
    
    <category term="Sharp Tools" scheme="https://androidperformance.com/en/tags/Sharp-Tools/"/>
    
    <category term="Productivity" scheme="https://androidperformance.com/en/tags/Productivity/"/>
    
  </entry>
  
  <entry>
    <title>Liqi - High-Efficiency Tools Recommendation</title>
    <link href="https://androidperformance.com/en/2019/04/07/liqi/"/>
    <id>https://androidperformance.com/en/2019/04/07/liqi/</id>
    <published>2019-04-07T08:22:32.000Z</published>
    <updated>2026-06-02T15:41:12.165Z</updated>
    
    <content type="html"><![CDATA[<p>I saw the <a href="https://mp.weixin.qq.com/s?__biz=MzA3NTgzNzU2NQ==&mid=400594784&idx=1&sn=a88b34faa7522206957d448d40ea0b31&scene=21#wechat_redirect">Liqi Community Project</a> a long time ago. I learned a lot from everyone’s sharing. As stated in the beginning: “<strong>Tools and inspiration are both Liqi. When tools and inspiration from different fields collide with each other, more possibilities will emerge.</strong>“ Below are my simple answers to the 6 questions from the Liqi Community Project. I hope this can help everyone in some way.</p><h2 id="Introduce-Yourself-and-Your-Work"><a href="#Introduce-Yourself-and-Your-Work" class="headerlink" title="Introduce Yourself and Your Work?"></a>Introduce Yourself and Your Work?</h2><p>I am an Android system development engineer, working in the system R&amp;D department of a certain phone manufacturer. My work mainly involves Android system-related tasks, such as performance, power consumption, stability, framework maintenance, etc. The work is quite diverse, dealing with various miscellaneous tasks.</p><p>As for hobbies, basketball, running, and gaming - these essential skills for programmers - naturally cannot be lacking; reading, raising cats, drinking tea - these artsy hobbies for young people also must not be neglected; in my spare time, I like to browse Bilibili and YouTube; when I have time, I complete unfinished articles I left behind; currently I’m obsessed with weight loss, fighting a desperate battle with my belly.</p><h2 id="What-Hardware-Are-You-Using"><a href="#What-Hardware-Are-You-Using" class="headerlink" title="What Hardware Are You Using?"></a>What Hardware Are You Using?</h2><p><strong>Computers</strong>: I mainly have three computers. One MacBook Pro for coding, writing my small apps, and processing photos; one company-configured desktop, Ubuntu system, mainly used for work, essential for compiling Android source code; one self-configured desktop, mainly used for gaming and compiling AOSP code.</p><p><strong>Phones</strong>: I have three phones. My main device is <strong>iPhone X</strong>, and I’m satisfied with everything except the battery life. My backup device is a <strong>OnePlus 6</strong>, an Android flagship - as an Android engineer, I still need to have one usable Android machine. Another one is a <strong>Pixel</strong>, mainly used to run the AOSP code I compiled myself - essential for amateur framework learning.</p><p><strong>Other Hardware</strong>: Apple family’s Watch, iPad Pro, AirPods; Sony’s large noise-canceling wireless headphones MDR-1000X; Kindle Voyage, dedicated for reading e-books.</p><h2 id="What-About-Software"><a href="#What-About-Software" class="headerlink" title="What About Software?"></a>What About Software?</h2><ul><li><strong>Things3</strong>: Mainly used for arranging daily work and recording things to do</li><li><strong>MWeb</strong>: Coding专用, this article is written with MWeb</li><li><strong>Keep</strong>: A good fitness assistant, some courses can be followed, mainly for recording. Sometimes there’s a goal, it’s better to persist than without a goal, especially when running (I recommend the HIT treadmill for running training)</li><li><strong>Dolphin Ledger</strong>: An accounting app, basically necessary.</li><li><strong>Kindle &amp;&amp; WeChat Reading</strong>: Reading apps. The two book libraries can complement each other. E-books are quite convenient, especially when reading on iPad Pro.</li><li><strong>YouTube &amp;&amp; Bilibili</strong>: Learning and entertainment, basically rely on them.</li><li><strong>Network tools</strong>: I keep the corresponding tools ready on Android, Mac, phone, and iPad. What’s convenient is having a small plugin. Sometimes the software gets killed, and the small plugin switch is very convenient.</li><li><strong>Dedao Time &amp;&amp; Get</strong>: Knowledge payment apps. Three people walking together, there must be my teacher. I personally think that listening to what others are doing, what they’ve done, how they did it - it’s quite beneficial for my own improvement. It saves me from taking many detours.</li><li><strong>Google Photos</strong>: Basically all my photos are here. I’m really afraid that one day I won’t be able to access them. I’ll probably cry to death…</li><li><strong>Reeder</strong>: I previously maintained a <a href="https://github.com/Gracker/Rss-IT">developer’s RSS feed list</a>, and I personally use Reeder3 to read it.</li><li><strong>Android Studio &amp;&amp; VS Code</strong>: Productivity software. One is used to view Framework Java code, one is used to view C\C++ code.</li><li><strong>RescueTime</strong>: Mainly used to record work time. I can check where I spent my time every day after coming back. It supports all platforms (though on iOS you can only view, not record; on Mac you can record; on Android, Ubuntu, and Windows you can both record and view). Sometimes when I look at my work time of a few hours, it makes me want to cry…</li><li><strong>Shimo Docs</strong>: Recording my daily reports, weekly reports, and some research content. Supports all platforms, synchronization is very convenient, and multi-person collaboration efficiency is also high. The web client is best to use.</li><li><strong>Jianguo Cloud</strong>: Cloud storage supporting all platforms. Upload materials once, never worry about losing them again (direct Ubuntu support is too friendly to programmers).</li><li><strong>Yinxiang Notes</strong>: Previously used for recording, now more used as a collection center. When I encounter good articles, I usually record them here, then organize and review them later. Daily work recording is all handed over to Shimo Docs now.</li></ul><h2 id="What’s-Your-Ideal-Work-Environment"><a href="#What’s-Your-Ideal-Work-Environment" class="headerlink" title="What’s Your Ideal Work Environment?"></a>What’s Your Ideal Work Environment?</h2><p>The ideal work environment is Work Life Balance, just like what the recently popular <a href="https://996.icu/#/zh_CN">996 project</a> describes. My current work situation is about the same, so I hope my work environment is what’s described in the <a href="https://github.com/formulahendry/955.WLB">955.WLB</a> project: work-life balance.</p><p>The greatest pressure 996 gives people is having no time of their own to improve themselves. They’re busy until 10 or 11 PM every day. Going back to take a shower and go to sleep. There’s simply no time for fitness, reading, learning, etc. As this article <a href="https://mp.weixin.qq.com/s/9-ZIoCvJmnYpkGpZBou4Dw">The most subtle way to destroy a person is to keep them so busy they have no time to grow</a> says:</p><blockquote><p>If a person only learns from the work process, then this single learning method will inevitably lead to its marginal contribution to growth becoming increasingly low.</p></blockquote><blockquote><p>You must make yourself have time to grow every day. Actually, this is to let you expand other growth methods beyond work. The more diversified your learning methods are, the higher the marginal contribution to growth will be. The faster you will grow.</p></blockquote><blockquote><p>A person must have continuous incremental growth in their career.</p></blockquote><p>To sum up, my ideal work environment: <strong>having colleagues who share the same aspirations, having work that I love, having space and time for my own growth.</strong></p><h2 id="What-Are-Your-Ways-to-Get-Work-Inspiration"><a href="#What-Are-Your-Ways-to-Get-Work-Inspiration" class="headerlink" title="What Are Your Ways to Get Work Inspiration?"></a>What Are Your Ways to Get Work Inspiration?</h2><p>One is reading, extracting the essence from others’ thoughts to see if they can be used by me or improved or carried forward; the other is thinking and recording, drawing flow diagrams while thinking, recording the spark of certain thoughts.</p><p>However, no matter how good the effect is, when I get busy, I rarely have time to read and think. I ask all the great gods for guidance.</p><h2 id="Recommend-a-Life-Liqi-to-Everyone"><a href="#Recommend-a-Life-Liqi-to-Everyone" class="headerlink" title="Recommend a Life Liqi to Everyone?"></a>Recommend a Life Liqi to Everyone?</h2><p>What I most want to recommend to everyone is not a certain hardware or software, but a learning method: <strong>Record-Summarize-Output</strong>. These three links form a loop:</p><p><strong>Recording</strong>: We always say, good memory is worse than a bad pen, especially in this era of information explosion. Having your own recording method appears especially important. To-do items, occasional strange ideas that pop up, problems encountered and solution methods, good articles seen on certain websites, Blog posts to be updated, tutorial videos on YouTube, etc. - recording will make you appear organized.</p><p><strong>Summarizing</strong>: Summarizing can gather previously scattered thoughts or knowledge together. Clear outlines help to look at a certain period or certain knowledge from an overall perspective. For example, project summaries can let us avoid the pitfalls in that project in future projects; summaries of certain knowledge points can let us understand this knowledge from points to surfaces, deepening the impression of this knowledge.</p><p><strong>Outputting</strong>: Outputting can be private notes, Blogs, videos. Outputting is more about strengthening yourself by explaining to others. To explain clearly to others, you must be very familiar with the points you’re outputting; everyone’s discussion about your output will also strengthen your understanding of this knowledge point; outputting also helps others, while improving your own fame. If you’re strong, you have to let others know you’re strong too.</p><h2 id="Finally"><a href="#Finally" class="headerlink" title="Finally"></a>Finally</h2><p>I recently went to Japan, catching the cherry blossom season. Let me end with a photo of cherry blossoms.</p><p><img src="/en/images/media/performancecase/15546301230322.jpg" alt="Cherry Blossoms"></p><blockquote><p>This article participated in “Liqi Community Plan”. Discover more creators and their tools: <a href="http://liqi.io/community/">http://liqi.io/community/</a></p></blockquote><hr><h1 id="About-Me-amp-amp-Blog"><a href="#About-Me-amp-amp-Blog" class="headerlink" title="About Me &amp;&amp; Blog"></a>About Me &amp;&amp; Blog</h1><p>Below is a personal introduction and related links. I look forward to communicating with colleagues in the same field. When three walk together, there must be my teacher!</p><ol><li><a href="https://www.androidperformance.com/about/">Blogger Personal Introduction</a>: Inside are personal WeChat and WeChat group links.</li><li><a href="https://androidperformance.com/2019/12/01/BlogMap/">Blog Content Navigation</a>: A navigation of personal blog content.</li><li><a href="https://androidperformance.com/2018/05/07/Android-performance-optimization-skills-and-tools/">Personally Organized and Collected Excellent Blog Articles - Android Performance Optimization Must Know</a>: Everyone is welcome to self-recommend and recommend (private WeChat chat is fine).</li><li><a href="https://www.androidperformance.com/2023/12/30/the-performance/">Android Performance Optimization Knowledge Planet</a>: Welcome to join, thank you for your support~</li></ol><hr><blockquote><p><strong>“If you want to go fast, go alone. If you want to go far, go together.”</strong></p></blockquote><p><img src="/en/images/WechatIMG581.webp" alt="Wechat QR"></p>]]></content>


    <summary type="html">&lt;p&gt;I saw the &lt;a href=&quot;https://mp.weixin.qq.com/s?__biz=MzA3NTgzNzU2NQ==&amp;mid=400594784&amp;idx=1&amp;sn=a88b34faa7522206957d448d40ea0b31&amp;scene=21#wec</summary>


    <category term="Reading Notes" scheme="https://androidperformance.com/en/categories/Reading-Notes/"/>
    
    
    <category term="Liqi" scheme="https://androidperformance.com/en/tags/Liqi/"/>
    
  </entry>
  
  <entry>
    <title>Case Analysis of System-wide Stutter Caused by Android Accessibility Service</title>
    <link href="https://androidperformance.com/en/2019/01/21/android-performance-case-jank-accessbility/"/>
    <id>https://androidperformance.com/en/2019/01/21/android-performance-case-jank-accessbility/</id>
    <published>2019-01-20T16:22:22.000Z</published>
    <updated>2026-05-10T23:29:51.064Z</updated>
    
    <content type="html"><![CDATA[<h1 id="Phenomenon"><a href="#Phenomenon" class="headerlink" title="Phenomenon"></a>Phenomenon</h1><p>Some users reported that while scrolling on the phone, the list would jitter. This happens when scrolling on the desktop or settings (as long as it is scrollable), but this is not reproducible for everyone; it appears for some users, but not for others.</p><p>Onlookers can scroll directly to the bottom to see <strong>The Culprit and Self-Check</strong>. Those interested in analyzing the problem can read the analysis process.</p><h1 id="Systrace-Analysis"><a href="#Systrace-Analysis" class="headerlink" title="Systrace Analysis"></a>Systrace Analysis</h1><p>There is a reproducible device for local testing. After analyzing it, it was found that sliding the desktop or settings with a finger will inevitably cause stuttering. From the Trace, it looks like this:<br><img src="/en/images/media/performancecase/15482434530990.jpg"></p><p>The red arrow indicates where the frame drop occurred. From the Buffer count above, it can be seen that the reason SF did not draw is that Launcher did not submit a Buffer.</p><p>The corresponding Launcher Trace is as follows. It can be seen that the reason Launcher did not draw is that no Input event was passed up. So the Launcher’s screen was not updated, causing frame drops.<br><img src="/en/images/media/performancecase/15482435308066.jpg"></p><p>The fact that no event came up is problematic in itself. Our finger slides across the screen continuously, so the event reporting should be continuous. We suspect there is a problem with the screen reporting points, but before checking the hardware, let’s first see if the InputReader and InputDispatcher threads are working properly.</p><p><img src="/en/images/media/performancecase/15482435458655.jpg"></p><p>From the figure, it can be seen that the InputReader thread is working properly, but the InputDispatcher thread has problems. You can see the correspondence between these two threads under normal circumstances:</p><p><img src="/en/images/media/performancecase/15482435564755.jpg"></p><p>Returning to the problematic figure, if you look closely, you will find that the cycle of the InputDispatcher thread is the same as Vsync. That is to say, the wake-up logic of InputDispatcher has changed from being woken up by InputReader to being woken up by Vsync.</p><p>If you look more closely, clicking on the cpu state of the InputDispatcher thread shows that the InputDispatcher thread waking up to execute tasks is not woken up by the InputReader thread, but by the UI Thread of System_Server.</p><p>So next, we need to look at why InputReader did not wake up InputDispatcher from the code perspective.</p><h1 id="Code-Analysis"><a href="#Code-Analysis" class="headerlink" title="Code Analysis"></a>Code Analysis</h1><p>The logic for InputReader to wake up the InputDispatcher thread is as follows (taking the Move gesture in this example accurately).</p><p>frameworks&#x2F;native&#x2F;services&#x2F;inputflinger&#x2F;InputDispatcher.cpp</p><figure class="highlight cpp"><table><tr><td class="gutter"><pre><span class="line">1</span><br><span class="line">2</span><br><span class="line">3</span><br><span class="line">4</span><br><span class="line">5</span><br><span class="line">6</span><br><span class="line">7</span><br><span class="line">8</span><br><span class="line">9</span><br><span class="line">10</span><br><span class="line">11</span><br><span class="line">12</span><br><span class="line">13</span><br><span class="line">14</span><br><span class="line">15</span><br><span class="line">16</span><br><span class="line">17</span><br><span class="line">18</span><br><span class="line">19</span><br><span class="line">20</span><br><span class="line">21</span><br><span class="line">22</span><br><span class="line">23</span><br><span class="line">24</span><br><span class="line">25</span><br><span class="line">26</span><br><span class="line">27</span><br><span class="line">28</span><br><span class="line">29</span><br><span class="line">30</span><br><span class="line">31</span><br><span class="line">32</span><br><span class="line">33</span><br><span class="line">34</span><br><span class="line">35</span><br><span class="line">36</span><br><span class="line">37</span><br><span class="line">38</span><br><span class="line">39</span><br><span class="line">40</span><br><span class="line">41</span><br><span class="line">42</span><br><span class="line">43</span><br><span class="line">44</span><br><span class="line">45</span><br><span class="line">46</span><br><span class="line">47</span><br><span class="line">48</span><br><span class="line">49</span><br><span class="line">50</span><br><span class="line">51</span><br><span class="line">52</span><br><span class="line">53</span><br><span class="line">54</span><br><span class="line">55</span><br><span class="line">56</span><br><span class="line">57</span><br></pre></td><td class="code"><pre><span class="line"><span class="function"><span class="type">void</span> <span class="title">InputDispatcher::notifyMotion</span><span class="params">(<span class="type">const</span> NotifyMotionArgs* args)</span> </span>&#123;</span><br><span class="line"></span><br><span class="line">    <span class="keyword">if</span> (!<span class="built_in">validateMotionEvent</span>(args-&gt;action, args-&gt;actionButton,</span><br><span class="line">                args-&gt;pointerCount, args-&gt;pointerProperties)) &#123;</span><br><span class="line">        <span class="keyword">return</span>;</span><br><span class="line">    &#125;</span><br><span class="line"></span><br><span class="line">    <span class="type">uint32_t</span> policyFlags = args-&gt;policyFlags;</span><br><span class="line">    policyFlags |= POLICY_FLAG_TRUSTED;</span><br><span class="line"></span><br><span class="line">    android::base::Timer t;</span><br><span class="line">    mPolicy-&gt;<span class="built_in">interceptMotionBeforeQueueing</span>(args-&gt;eventTime, <span class="comment">/*byref*/</span> policyFlags);</span><br><span class="line">    <span class="keyword">if</span> (t.<span class="built_in">duration</span>() &gt; SLOW_INTERCEPTION_THRESHOLD) &#123;</span><br><span class="line">        <span class="built_in">ALOGW</span>(<span class="string">&quot;Excessive delay in interceptMotionBeforeQueueing; took %s ms&quot;</span>,</span><br><span class="line">                std::<span class="built_in">to_string</span>(t.<span class="built_in">duration</span>().<span class="built_in">count</span>()).<span class="built_in">c_str</span>());</span><br><span class="line">    &#125;</span><br><span class="line"></span><br><span class="line">    <span class="type">bool</span> needWake; <span class="comment">// Whether to wake up</span></span><br><span class="line">    &#123; <span class="comment">// acquire lock</span></span><br><span class="line">        mLock.<span class="built_in">lock</span>();</span><br><span class="line"></span><br><span class="line">        <span class="keyword">if</span> (<span class="built_in">shouldSendMotionToInputFilterLocked</span>(args)) &#123;</span><br><span class="line">            mLock.<span class="built_in">unlock</span>();</span><br><span class="line"></span><br><span class="line">            MotionEvent event;</span><br><span class="line">            event.<span class="built_in">initialize</span>(args-&gt;deviceId, args-&gt;source, args-&gt;action, args-&gt;actionButton,</span><br><span class="line">                    args-&gt;flags, args-&gt;edgeFlags, args-&gt;metaState, args-&gt;buttonState,</span><br><span class="line">                    <span class="number">0</span>, <span class="number">0</span>, args-&gt;xPrecision, args-&gt;yPrecision,</span><br><span class="line">                    args-&gt;downTime, args-&gt;eventTime,</span><br><span class="line">                    args-&gt;pointerCount, args-&gt;pointerProperties, args-&gt;pointerCoords);</span><br><span class="line"></span><br><span class="line">            policyFlags |= POLICY_FLAG_FILTERED;</span><br><span class="line">            <span class="comment">// SystemServer upper layer needs to filter events</span></span><br><span class="line">            <span class="keyword">if</span> (!mPolicy-&gt;<span class="built_in">filterInputEvent</span>(&amp;event, policyFlags)) &#123;</span><br><span class="line">                <span class="keyword">return</span>; <span class="comment">// event was consumed by the filter</span></span><br><span class="line">            &#125;</span><br><span class="line"></span><br><span class="line">            mLock.<span class="built_in">lock</span>();</span><br><span class="line">        &#125;</span><br><span class="line"></span><br><span class="line">        <span class="comment">// Just enqueue a new motion event.</span></span><br><span class="line">        MotionEntry* newEntry = <span class="keyword">new</span> <span class="built_in">MotionEntry</span>(args-&gt;eventTime,</span><br><span class="line">                args-&gt;deviceId, args-&gt;source, policyFlags,</span><br><span class="line">                args-&gt;action, args-&gt;actionButton, args-&gt;flags,</span><br><span class="line">                args-&gt;metaState, args-&gt;buttonState,</span><br><span class="line">                args-&gt;edgeFlags, args-&gt;xPrecision, args-&gt;yPrecision, args-&gt;downTime,</span><br><span class="line">                args-&gt;displayId,</span><br><span class="line">                args-&gt;pointerCount, args-&gt;pointerProperties, args-&gt;pointerCoords, <span class="number">0</span>, <span class="number">0</span>);</span><br><span class="line"></span><br><span class="line">        needWake = <span class="built_in">enqueueInboundEventLocked</span>(newEntry);</span><br><span class="line">        mLock.<span class="built_in">unlock</span>();</span><br><span class="line">    &#125; <span class="comment">// release lock</span></span><br><span class="line"></span><br><span class="line">    <span class="keyword">if</span> (needWake) &#123;</span><br><span class="line">        mLooper-&gt;<span class="built_in">wake</span>();</span><br><span class="line">    &#125;</span><br><span class="line">&#125;</span><br></pre></td></tr></table></figure><p>Note here that <code>mPolicy-&gt;filterInputEvent</code> returns directly, which means if it returns false here, it returns directly and does not continue to execute the following steps.</p><p>Continue to look at <code>mPolicy-&gt;filterInputEvent</code></p><p>frameworks&#x2F;base&#x2F;services&#x2F;core&#x2F;jni&#x2F;com_android_server_input_InputManagerService.cpp</p><figure class="highlight cpp"><table><tr><td class="gutter"><pre><span class="line">1</span><br><span class="line">2</span><br><span class="line">3</span><br><span class="line">4</span><br><span class="line">5</span><br><span class="line">6</span><br><span class="line">7</span><br><span class="line">8</span><br><span class="line">9</span><br><span class="line">10</span><br><span class="line">11</span><br><span class="line">12</span><br><span class="line">13</span><br><span class="line">14</span><br><span class="line">15</span><br><span class="line">16</span><br><span class="line">17</span><br><span class="line">18</span><br><span class="line">19</span><br><span class="line">20</span><br><span class="line">21</span><br><span class="line">22</span><br><span class="line">23</span><br><span class="line">24</span><br><span class="line">25</span><br><span class="line">26</span><br><span class="line">27</span><br><span class="line">28</span><br><span class="line">29</span><br></pre></td><td class="code"><pre><span class="line"><span class="function"><span class="type">bool</span> <span class="title">NativeInputManager::filterInputEvent</span><span class="params">(<span class="type">const</span> InputEvent* inputEvent, <span class="type">uint32_t</span> policyFlags)</span> </span>&#123;</span><br><span class="line">    <span class="built_in">ATRACE_CALL</span>();</span><br><span class="line">    jobject inputEventObj;</span><br><span class="line"></span><br><span class="line">    JNIEnv* env = <span class="built_in">jniEnv</span>();</span><br><span class="line">    <span class="keyword">switch</span> (inputEvent-&gt;<span class="built_in">getType</span>()) &#123;</span><br><span class="line">    <span class="keyword">case</span> AINPUT_EVENT_TYPE_KEY:</span><br><span class="line">        inputEventObj = <span class="built_in">android_view_KeyEvent_fromNative</span>(env,</span><br><span class="line">                <span class="built_in">static_cast</span>&lt;<span class="type">const</span> KeyEvent*&gt;(inputEvent));</span><br><span class="line">        <span class="keyword">break</span>;</span><br><span class="line">    <span class="keyword">case</span> AINPUT_EVENT_TYPE_MOTION:</span><br><span class="line">        inputEventObj = <span class="built_in">android_view_MotionEvent_obtainAsCopy</span>(env,</span><br><span class="line">                <span class="built_in">static_cast</span>&lt;<span class="type">const</span> MotionEvent*&gt;(inputEvent));</span><br><span class="line">        <span class="keyword">break</span>;</span><br><span class="line">    <span class="keyword">default</span>:</span><br><span class="line">        <span class="keyword">return</span> <span class="literal">true</span>; <span class="comment">// dispatch the event normally</span></span><br><span class="line">    &#125;</span><br><span class="line"></span><br><span class="line"></span><br><span class="line"></span><br><span class="line">    <span class="comment">// The callee is responsible for recycling the event.</span></span><br><span class="line">    jboolean pass = env-&gt;<span class="built_in">CallBooleanMethod</span>(mServiceObj, gServiceClassInfo.filterInputEvent,</span><br><span class="line">            inputEventObj, policyFlags);</span><br><span class="line">    <span class="keyword">if</span> (<span class="built_in">checkAndClearExceptionFromCallback</span>(env, <span class="string">&quot;filterInputEvent&quot;</span>)) &#123;</span><br><span class="line">        pass = <span class="literal">true</span>;</span><br><span class="line">    &#125;</span><br><span class="line">    env-&gt;<span class="built_in">DeleteLocalRef</span>(inputEventObj);</span><br><span class="line">    <span class="keyword">return</span> pass;</span><br><span class="line">&#125;</span><br></pre></td></tr></table></figure><p>Here it calls back from jni to the java layer, which is the <code>filterInputEvent</code> method of InputManagerService.</p><p>com&#x2F;android&#x2F;server&#x2F;input&#x2F;InputManagerService.java</p><figure class="highlight cpp"><table><tr><td class="gutter"><pre><span class="line">1</span><br><span class="line">2</span><br><span class="line">3</span><br><span class="line">4</span><br><span class="line">5</span><br><span class="line">6</span><br><span class="line">7</span><br><span class="line">8</span><br><span class="line">9</span><br><span class="line">10</span><br><span class="line">11</span><br><span class="line">12</span><br><span class="line">13</span><br><span class="line">14</span><br><span class="line">15</span><br></pre></td><td class="code"><pre><span class="line"><span class="comment">// Native callback.</span></span><br><span class="line"><span class="function"><span class="keyword">final</span> boolean <span class="title">filterInputEvent</span><span class="params">(InputEvent event, <span class="type">int</span> policyFlags)</span> </span>&#123;</span><br><span class="line">    <span class="built_in">synchronized</span> (mInputFilterLock) &#123;</span><br><span class="line">        <span class="keyword">if</span> (mInputFilter != null) &#123;</span><br><span class="line">            <span class="keyword">try</span> &#123;</span><br><span class="line">                mInputFilter.<span class="built_in">filterInputEvent</span>(event, policyFlags);</span><br><span class="line">            &#125; <span class="built_in">catch</span> (RemoteException e) &#123;</span><br><span class="line">                <span class="comment">/* ignore */</span></span><br><span class="line">            &#125;</span><br><span class="line">            <span class="keyword">return</span> <span class="literal">false</span>;</span><br><span class="line">        &#125;</span><br><span class="line">    &#125;</span><br><span class="line">    event.<span class="built_in">recycle</span>();</span><br><span class="line">    <span class="keyword">return</span> <span class="literal">true</span>;</span><br><span class="line">&#125;</span><br></pre></td></tr></table></figure><p>Following the code flow, it is found that this <code>mInputFilter</code> is an instance of AccessibilityInputFilter. When the switch is turned on in Accessibility, the <code>updateInputFilter</code> method of AccessibilityManagerService is called to set the InputFilter.</p><p>android&#x2F;view&#x2F;InputFilter.java</p><figure class="highlight java"><table><tr><td class="gutter"><pre><span class="line">1</span><br><span class="line">2</span><br><span class="line">3</span><br><span class="line">4</span><br><span class="line">5</span><br><span class="line">6</span><br><span class="line">7</span><br><span class="line">8</span><br><span class="line">9</span><br><span class="line">10</span><br><span class="line">11</span><br><span class="line">12</span><br><span class="line">13</span><br><span class="line">14</span><br><span class="line">15</span><br><span class="line">16</span><br></pre></td><td class="code"><pre><span class="line"><span class="keyword">final</span> <span class="keyword">public</span> <span class="keyword">void</span> <span class="title function_">filterInputEvent</span><span class="params">(InputEvent event, <span class="type">int</span> policyFlags)</span> &#123;</span><br><span class="line">    mH.obtainMessage(MSG_INPUT_EVENT, policyFlags, <span class="number">0</span>, event).sendToTarget();</span><br><span class="line">&#125;</span><br><span class="line"></span><br><span class="line"><span class="keyword">case</span> MSG_INPUT_EVENT: &#123;</span><br><span class="line">    <span class="keyword">final</span> <span class="type">InputEvent</span> <span class="variable">event</span> <span class="operator">=</span> (InputEvent)msg.obj;</span><br><span class="line">    <span class="keyword">try</span> &#123;</span><br><span class="line">        <span class="keyword">if</span> (mInboundInputEventConsistencyVerifier != <span class="literal">null</span>) &#123;</span><br><span class="line">            mInboundInputEventConsistencyVerifier.onInputEvent(event, <span class="number">0</span>);</span><br><span class="line">        &#125;</span><br><span class="line">        onInputEvent(event, msg.arg1);</span><br><span class="line">    &#125; <span class="keyword">finally</span> &#123;</span><br><span class="line">        event.recycle();</span><br><span class="line">    &#125;</span><br><span class="line">    <span class="keyword">break</span>;</span><br><span class="line">&#125;</span><br></pre></td></tr></table></figure><p>Continue to look at <code>onInputEvent(event, msg.arg1);</code><br>com&#x2F;android&#x2F;server&#x2F;accessibility&#x2F;AccessibilityInputFilter.java</p><figure class="highlight java"><table><tr><td class="gutter"><pre><span class="line">1</span><br><span class="line">2</span><br><span class="line">3</span><br><span class="line">4</span><br><span class="line">5</span><br><span class="line">6</span><br><span class="line">7</span><br><span class="line">8</span><br><span class="line">9</span><br><span class="line">10</span><br><span class="line">11</span><br><span class="line">12</span><br><span class="line">13</span><br><span class="line">14</span><br><span class="line">15</span><br><span class="line">16</span><br><span class="line">17</span><br><span class="line">18</span><br><span class="line">19</span><br><span class="line">20</span><br><span class="line">21</span><br><span class="line">22</span><br><span class="line">23</span><br><span class="line">24</span><br><span class="line">25</span><br><span class="line">26</span><br><span class="line">27</span><br><span class="line">28</span><br><span class="line">29</span><br><span class="line">30</span><br><span class="line">31</span><br><span class="line">32</span><br><span class="line">33</span><br><span class="line">34</span><br><span class="line">35</span><br><span class="line">36</span><br><span class="line">37</span><br><span class="line">38</span><br><span class="line">39</span><br><span class="line">40</span><br><span class="line">41</span><br><span class="line">42</span><br><span class="line">43</span><br><span class="line">44</span><br></pre></td><td class="code"><pre><span class="line"><span class="meta">@Override</span></span><br><span class="line"><span class="keyword">public</span> <span class="keyword">void</span> <span class="title function_">onInputEvent</span><span class="params">(InputEvent event, <span class="type">int</span> policyFlags)</span> &#123;</span><br><span class="line">    <span class="keyword">if</span> (mEventHandler == <span class="literal">null</span>) &#123;</span><br><span class="line">        <span class="keyword">if</span> (DEBUG) Slog.d(TAG, <span class="string">&quot;mEventHandler == null for event &quot;</span> + event);</span><br><span class="line">        <span class="built_in">super</span>.onInputEvent(event, policyFlags);</span><br><span class="line">        <span class="keyword">return</span>;</span><br><span class="line">    &#125;</span><br><span class="line"></span><br><span class="line">    <span class="type">EventStreamState</span> <span class="variable">state</span> <span class="operator">=</span> getEventStreamState(event);</span><br><span class="line">    <span class="keyword">if</span> (state == <span class="literal">null</span>) &#123;</span><br><span class="line">        <span class="built_in">super</span>.onInputEvent(event, policyFlags);</span><br><span class="line">        <span class="keyword">return</span>;</span><br><span class="line">    &#125;</span><br><span class="line"></span><br><span class="line">    <span class="type">int</span> <span class="variable">eventSource</span> <span class="operator">=</span> event.getSource();</span><br><span class="line">    <span class="keyword">if</span> ((policyFlags &amp; WindowManagerPolicy.FLAG_PASS_TO_USER) == <span class="number">0</span>) &#123;</span><br><span class="line">        state.reset();</span><br><span class="line">        mEventHandler.clearEvents(eventSource);</span><br><span class="line">        <span class="built_in">super</span>.onInputEvent(event, policyFlags);</span><br><span class="line">        <span class="keyword">return</span>;</span><br><span class="line">    &#125;</span><br><span class="line"></span><br><span class="line">    <span class="keyword">if</span> (state.updateDeviceId(event.getDeviceId())) &#123;</span><br><span class="line">        mEventHandler.clearEvents(eventSource);</span><br><span class="line">    &#125;</span><br><span class="line"></span><br><span class="line">    <span class="keyword">if</span> (!state.deviceIdValid()) &#123;</span><br><span class="line">        <span class="built_in">super</span>.onInputEvent(event, policyFlags);</span><br><span class="line">        <span class="keyword">return</span>;</span><br><span class="line">    &#125;</span><br><span class="line"></span><br><span class="line">    <span class="keyword">if</span> (event <span class="keyword">instanceof</span> MotionEvent) &#123;</span><br><span class="line">        <span class="keyword">if</span> ((mEnabledFeatures &amp; FEATURES_AFFECTING_MOTION_EVENTS) != <span class="number">0</span>) &#123;</span><br><span class="line">            <span class="type">MotionEvent</span> <span class="variable">motionEvent</span> <span class="operator">=</span> (MotionEvent) event;</span><br><span class="line">            processMotionEvent(state, motionEvent, policyFlags);</span><br><span class="line">            <span class="keyword">return</span>;</span><br><span class="line">        &#125; <span class="keyword">else</span> &#123;</span><br><span class="line">            <span class="built_in">super</span>.onInputEvent(event, policyFlags);</span><br><span class="line">        &#125;</span><br><span class="line">    &#125; <span class="keyword">else</span> <span class="keyword">if</span> (event <span class="keyword">instanceof</span> KeyEvent) &#123;</span><br><span class="line">        <span class="type">KeyEvent</span> <span class="variable">keyEvent</span> <span class="operator">=</span> (KeyEvent) event;</span><br><span class="line">        processKeyEvent(state, keyEvent, policyFlags);</span><br><span class="line">    &#125;</span><br><span class="line">&#125;</span><br></pre></td></tr></table></figure><p>Continue to look at <code>processMotionEvent</code></p><figure class="highlight java"><table><tr><td class="gutter"><pre><span class="line">1</span><br><span class="line">2</span><br><span class="line">3</span><br><span class="line">4</span><br><span class="line">5</span><br><span class="line">6</span><br><span class="line">7</span><br><span class="line">8</span><br><span class="line">9</span><br><span class="line">10</span><br><span class="line">11</span><br><span class="line">12</span><br></pre></td><td class="code"><pre><span class="line"><span class="keyword">private</span> <span class="keyword">void</span> <span class="title function_">processMotionEvent</span><span class="params">(EventStreamState state, MotionEvent event, <span class="type">int</span> policyFlags)</span> &#123;</span><br><span class="line">    <span class="keyword">if</span> (!state.shouldProcessScroll() &amp;&amp; event.getActionMasked() == MotionEvent.ACTION_SCROLL) &#123;</span><br><span class="line">        <span class="built_in">super</span>.onInputEvent(event, policyFlags);</span><br><span class="line">        <span class="keyword">return</span>;</span><br><span class="line">    &#125;</span><br><span class="line"></span><br><span class="line">    <span class="keyword">if</span> (!state.shouldProcessMotionEvent(event)) &#123;</span><br><span class="line">        <span class="keyword">return</span>;</span><br><span class="line">    &#125;</span><br><span class="line"></span><br><span class="line">    batchMotionEvent(event, policyFlags);</span><br><span class="line">&#125;</span><br></pre></td></tr></table></figure><p>Continue to look at <code>batchMotionEvent</code></p><figure class="highlight java"><table><tr><td class="gutter"><pre><span class="line">1</span><br><span class="line">2</span><br><span class="line">3</span><br><span class="line">4</span><br><span class="line">5</span><br><span class="line">6</span><br><span class="line">7</span><br><span class="line">8</span><br><span class="line">9</span><br><span class="line">10</span><br><span class="line">11</span><br><span class="line">12</span><br><span class="line">13</span><br><span class="line">14</span><br><span class="line">15</span><br><span class="line">16</span><br><span class="line">17</span><br></pre></td><td class="code"><pre><span class="line"><span class="keyword">private</span> <span class="keyword">void</span> <span class="title function_">batchMotionEvent</span><span class="params">(MotionEvent event, <span class="type">int</span> policyFlags)</span> &#123;</span><br><span class="line">    <span class="keyword">if</span> (DEBUG) &#123;</span><br><span class="line">        Slog.i(TAG, <span class="string">&quot;Batching event: &quot;</span> + event + <span class="string">&quot;, policyFlags: &quot;</span> + policyFlags);</span><br><span class="line">    &#125;</span><br><span class="line">    <span class="keyword">if</span> (mEventQueue == <span class="literal">null</span>) &#123;</span><br><span class="line">        mEventQueue = MotionEventHolder.obtain(event, policyFlags);</span><br><span class="line">        scheduleProcessBatchedEvents();</span><br><span class="line">        <span class="keyword">return</span>;</span><br><span class="line">    &#125;</span><br><span class="line">    <span class="keyword">if</span> (mEventQueue.event.addBatch(event)) &#123;</span><br><span class="line">        <span class="keyword">return</span>;</span><br><span class="line">    &#125;</span><br><span class="line">    <span class="type">MotionEventHolder</span> <span class="variable">holder</span> <span class="operator">=</span> MotionEventHolder.obtain(event, policyFlags);</span><br><span class="line">    holder.next = mEventQueue;</span><br><span class="line">    mEventQueue.previous = holder;</span><br><span class="line">    mEventQueue = holder;</span><br><span class="line">&#125;</span><br></pre></td></tr></table></figure><p>Continue to look at <code>scheduleProcessBatchedEvents</code></p><figure class="highlight java"><table><tr><td class="gutter"><pre><span class="line">1</span><br><span class="line">2</span><br><span class="line">3</span><br><span class="line">4</span><br></pre></td><td class="code"><pre><span class="line"><span class="keyword">private</span> <span class="keyword">void</span> <span class="title function_">scheduleProcessBatchedEvents</span><span class="params">()</span> &#123;</span><br><span class="line">    mChoreographer.postCallback(Choreographer.CALLBACK_INPUT,</span><br><span class="line">            mProcessBatchedEventsRunnable, <span class="literal">null</span>);</span><br><span class="line">&#125;</span><br></pre></td></tr></table></figure><p><code>mProcessBatchedEventsRunnable</code> will be executed in the next Vsync cycle, which is <code>Choreographer.CALLBACK_INPUT</code>. Students familiar with Choregrapher should know what is happening here.</p><figure class="highlight java"><table><tr><td class="gutter"><pre><span class="line">1</span><br><span class="line">2</span><br><span class="line">3</span><br><span class="line">4</span><br><span class="line">5</span><br><span class="line">6</span><br><span class="line">7</span><br><span class="line">8</span><br><span class="line">9</span><br><span class="line">10</span><br><span class="line">11</span><br></pre></td><td class="code"><pre><span class="line"><span class="keyword">private</span> <span class="keyword">final</span> <span class="type">Runnable</span> <span class="variable">mProcessBatchedEventsRunnable</span> <span class="operator">=</span> <span class="keyword">new</span> <span class="title class_">Runnable</span>() &#123;</span><br><span class="line">    <span class="meta">@Override</span></span><br><span class="line">    <span class="keyword">public</span> <span class="keyword">void</span> <span class="title function_">run</span><span class="params">()</span> &#123;</span><br><span class="line">        <span class="keyword">final</span> <span class="type">long</span> <span class="variable">frameTimeNanos</span> <span class="operator">=</span> mChoreographer.getFrameTimeNanos();</span><br><span class="line">        &#125;</span><br><span class="line">        processBatchedEvents(frameTimeNanos);</span><br><span class="line">        <span class="keyword">if</span> (mEventQueue != <span class="literal">null</span>) &#123;</span><br><span class="line">            scheduleProcessBatchedEvents();</span><br><span class="line">        &#125;</span><br><span class="line">    &#125;</span><br><span class="line">&#125;;</span><br></pre></td></tr></table></figure><p>So the code is relatively clear here. It is because of the existence of AccessibilityInputFilter that the InputDispatcher thread was not woken up, but the event processing was put into the next Vsync for processing.<br>Conclusion</p><p>The problem lies in this Runnable. Normally, if AccessibilityInputFilter is not turned on, the upper layer will not intercept Input events at all. Once there is AccessibilityInputFilter, the logic above will be followed. At this time, InputDispatcher will not follow the rhythm of InputReader, but follow the rhythm of Vsync. This can also be seen from the Trace;</p><p><img src="/en/images/media/performancecase/15482437370372.jpg"></p><p>So where does this AccessibilityInputFilter come from? The answer is the Accessibility service, also known as the barrier-free service.</p><h1 id="The-Culprit"><a href="#The-Culprit" class="headerlink" title="The Culprit"></a>The Culprit</h1><p>Through the above analysis, we know that the cause of the problem is the Accessibility service. The essence of the Accessibility service is to serve those users who are inconvenient to operate, such as blind people. However, in order to implement specific functions, some Apps have also added their own Accessibility services, such as the “one-click installation” function of major mobile phone markets. It is convenient for users, but if not used well, it will also have negative effects, such as this case, causing the user’s mobile phone to stutter. Users who don’t know may want to return the phone.</p><p>So who is the culprit? Currently two have been found, one is iFlytek Input Method and the other is Yingyongbao. Open Settings - System - Accessibility, you can see that various software inside are involved, but this is turned off by default. Many applications will guide users to turn it on, and many users turn it on confusedly.</p><p>The Accessibility service page is as follows:<br><img src="/en/images/media/performancecase/15482437928005.jpg"></p><p>As for how awesome the Accessibility service is, everyone can look at the pop-up box below. This thing can detect your credit card number and password. As for SMS content and WeChat chat content, those are small cases.</p><p><img src="/en/images/media/performancecase/15482438028084.jpg"></p><p>As for what caused the whole machine to stutter in this example, it is the following listener “Perform Gesture”. Once an application listens to this, the InputDispatcher thread will follow the cycle of Vsync, resulting in untimely report processing, causing the sliding object to think that no event entered this frame, so there is no content change, and the page will not be updated, resulting in stuttering.<br><img src="/en/images/media/performancecase/15482438143185.jpg"></p><h1 id="Self-Check"><a href="#Self-Check" class="headerlink" title="Self-Check"></a>Self-Check</h1><p>If you are using an Android phone, it is strongly recommended that you turn off all Accessibility services (if you don’t need them). Functions like automatic application installation are not worth the huge risk you pay for them. This is a native Android problem, and we have found this problem on Pixel and other third-party phones.</p><ol><li><p>Close path: Settings - System - Accessibility, go in and close all the ones you have opened.</p></li><li><p>Strongly recommend <strong>Yingyongbao, iFlytek Input Method</strong>, do not listen to gesture events.</p></li></ol><h1 id="Zhihu-Address-of-this-article"><a href="#Zhihu-Address-of-this-article" class="headerlink" title="Zhihu Address of this article"></a>Zhihu Address of this article</h1><p>Since blog message communication is inconvenient, for likes or communication, please move to the Zhihu interface of this article<br><a href="https://zhuanlan.zhihu.com/p/55585722">Zhihu - Analysis of Global Stutter Caused by Accessibility Services of Yingyongbao and iFlytek Input Method on Android Platform</a></p><h1 id="About-Me-amp-amp-Blog"><a href="#About-Me-amp-amp-Blog" class="headerlink" title="About Me &amp;&amp; Blog"></a>About Me &amp;&amp; Blog</h1><p>Below are personal introduction and related links. I hope to communicate more with everyone in the industry. If three people walk together, there must be one who can be my teacher!</p><ol><li><a href="/en/about/">Blogger Personal Introduction</a>: There are personal WeChat and WeChat group links inside.</li><li><a href="/en/2019/12/01/BlogMap/">This Blog Content Navigation</a>: A navigation of personal blog content.</li><li><a href="/en/2018/05/07/Android-performance-optimization-skills-and-tools/">Excellent blog articles organized and collected by individuals - A must-know for Android efficiency optimization</a>: Everyone is welcome to recommend themselves and recommend others (WeChat private chat is fine)</li><li><a href="/en/2023/12/30/the-performance/">Android Performance Optimization Knowledge Planet</a>: Welcome to join, thanks for your support~</li></ol><blockquote><p><strong>One person can go faster, a group of people can go further</strong></p></blockquote><p><img src="/en/images/WechatIMG581.webp" alt="WeChat Scan"></p>]]></content>


    <summary type="html">&lt;h1 id=&quot;Phenomenon&quot;&gt;&lt;a href=&quot;#Phenomenon&quot; class=&quot;headerlink&quot; title=&quot;Phenomenon&quot;&gt;&lt;/a&gt;Phenomenon&lt;/h1&gt;&lt;p&gt;Some users reported that while scrolli</summary>


    <category term="Android" scheme="https://androidperformance.com/en/categories/Android/"/>
    
    
    <category term="Android" scheme="https://androidperformance.com/en/tags/Android/"/>
    
    <category term="Systrace" scheme="https://androidperformance.com/en/tags/Systrace/"/>
    
    <category term="Jank" scheme="https://androidperformance.com/en/tags/Jank/"/>
    
    <category term="RenderThread" scheme="https://androidperformance.com/en/tags/RenderThread/"/>
    
    <category term="Stutter" scheme="https://androidperformance.com/en/tags/Stutter/"/>
    
  </entry>
  
  <entry>
    <title>2018 Best Items Recommendations - A Reward for Your Hard Work</title>
    <link href="https://androidperformance.com/en/2019/01/12/recommend-of-2018/"/>
    <id>https://androidperformance.com/en/2019/01/12/recommend-of-2018/</id>
    <published>2019-01-12T02:51:05.000Z</published>
    <updated>2026-05-10T23:29:51.068Z</updated>
    
    <content type="html"><![CDATA[<p>At the beginning of 2018, I wrote <a href="https://www.androidperformance.com/en/2018/01/06/Most-Recommended-of-2017/">2017 Best Items Recommendations</a>. Recently, some people asked if I’d do one for 2018. Although 2018 was a tough year, there were still some great things worth recommending to everyone.</p><p>Just like in 2017, I’ll share things that I found helpful for work or life. The recommendations include apps, hardware, books, blogs, and columns. I hope they provide value to you in 2019.</p><span id="more"></span><h1 id="Recommended-Apps"><a href="#Recommended-Apps" class="headerlink" title="Recommended Apps"></a>Recommended Apps</h1><h2 id="RescueTime"><a href="#RescueTime" class="headerlink" title="RescueTime"></a>RescueTime</h2><p><a href="https://www.rescuetime.com/">RescueTime</a> is a time-tracking software that accurately records how you spend your day (requires a local client).</p><p>If you are a programmer and want to track your productivity, RescueTime is an absolute must. You can clearly see where your time goes. For instance, I spend most of my time in Android Studio, VS Code, and Terminator. Below is a screenshot from January 15th:</p><p><img src="/en/images/recomend-2018/15478860621933.jpg" alt="-w1049"></p><p><img src="/en/images/recomend-2018/15478860883680.jpg" alt="-w692"></p><p>Detailed Programming Info:<br><img src="/en/images/recomend-2018/15478861440328.jpg" alt="-w974"></p><p>With this data, you know exactly how much time you’re actually spending on the computer. It supports almost all platforms, including Linux (though on iOS, it can only view data, not record it).</p><h2 id="Shimo-Docs"><a href="#Shimo-Docs" class="headerlink" title="Shimo Docs"></a>Shimo Docs</h2><p>In 2018, I switched my daily work logging from MWeb to <a href="https://shimo.im/">Shimo Docs</a>. The main reason is its multi-platform support (Mac, iOS, Android, WeChat Mini Programs). More importantly, the web version is excellent. I can record and view notes in real-time, and sharing is seamless with read-only or collaborative permissions.</p><p><img src="/en/images/recomend-2018/15478867439552.jpg" alt="-w973"></p><p><img src="/en/images/recomend-2018/15478866944155.jpg" alt="-w949"></p><p>Another reason: A good web-based note app should respect programmers by handling <code>Ctrl+S</code>. Evernote often fails at this, while Shimo Docs correctly saves content.</p><h2 id="Nutstore-Jianguoyun"><a href="#Nutstore-Jianguoyun" class="headerlink" title="Nutstore (Jianguoyun)"></a>Nutstore (Jianguoyun)</h2><p>Nutstore is a reliable cloud sync service for teams and individuals. Finding a good folder-syncing software in China is tough, but I eventually settled on <a href="https://www.jianguoyun.com/#/">Nutstore</a> because it supports Linux. When working in Linux, I just drop files into the sync folder, and they are immediately available on all my other devices.</p><p><img src="/en/images/recomend-2018/15478871443953.jpg" alt="-w983"><br><img src="/en/images/recomend-2018/15478871670996.jpg" alt="-w953"></p><h1 id="Recommended-Technical-Books"><a href="#Recommended-Technical-Books" class="headerlink" title="Recommended Technical Books"></a>Recommended Technical Books</h1><h2 id="Understanding-Android-Architecture-2nd-Edition"><a href="#Understanding-Android-Architecture-2nd-Edition" class="headerlink" title="Understanding Android Architecture (2nd Edition)"></a>Understanding Android Architecture (2nd Edition)</h2><p><img src="/en/images/media/15152587790243.jpg" alt="Understanding Android Internals"></p><p>A classic for system developers. This year saw the second edition with new content. Whether you’re an app engineer or a system engineer, understanding Android’s architecture is crucial for deepening your knowledge. Given how fast Android evolves, I recommend reading this alongside the latest Android source code.</p><blockquote><p>“Understanding Android Internals” covers Android 4.3 and above. It analyzes core technologies like processes&#x2F;threads, memory management, Binder, GUI, multimedia, and input systems. Most knowledge points come from real-world R&amp;D projects.</p></blockquote><p>Douban: <a href="https://book.douban.com/subject/25921329/">https://book.douban.com/subject/25921329/</a></p><h2 id="Android-Advanced-Decryption"><a href="#Android-Advanced-Decryption" class="headerlink" title="Android Advanced Decryption"></a>Android Advanced Decryption</h2><p><img src="/en/images/recomend-2018/15478811989772.jpg" alt="Android Advanced Decryption"></p><p>This book targets Android 8.0 source code combined with practical application knowledge. It covers system source code, JNI, ClassLoader, JVM, DVM&#x2F;ART, Hook techniques, Hot-fixing, and performance optimizations (draw and memory). It builds a comprehensive knowledge system for developers.</p><p>JD: <a href="https://item.jd.com/12447229.html">https://item.jd.com/12447229.html</a></p><h2 id="Running-Linux-Kernel"><a href="#Running-Linux-Kernel" class="headerlink" title="Running Linux Kernel"></a>Running Linux Kernel</h2><p><img src="/en/images/media/15152591841672.jpg" alt="Running Linux Kernel"></p><p>Essential for Android system engineers. Based on Linux 4.x, it covers memory management, process management, concurrency, and interrupts. Each section poses a problem to solve through source code analysis, making it highly practical for embedded and Android low-level developers.</p><p>Douban: <a href="https://book.douban.com/subject/27108677/">https://book.douban.com/subject/27108677/</a></p><h1 id="Recommended-Non-Technical-Books"><a href="#Recommended-Non-Technical-Books" class="headerlink" title="Recommended Non-Technical Books"></a>Recommended Non-Technical Books</h1><h2 id="Blades-of-the-Guardians-Biaoren"><a href="#Blades-of-the-Guardians-Biaoren" class="headerlink" title="Blades of the Guardians (Biaoren)"></a>Blades of the Guardians (Biaoren)</h2><p><img src="/en/images/recomend-2018/15478820694446.jpg"></p><p>A top-tier Chinese manhua (comic) set in the Sui and Tang dynasties with a 8.3 Douban rating. It follows a skilled escort, Dao Ma, across the Western deserts as he takes on a high-stakes mission to the capital, Chang’an. Available on WeChat Read.</p><h2 id="Great-Defeats-2-Dabaiju-2"><a href="#Great-Defeats-2-Dabaiju-2" class="headerlink" title="Great Defeats 2 (Dabaiju 2)"></a>Great Defeats 2 (Dabaiju 2)</h2><p><img src="/en/images/recomend-2018/15478822095577.jpg"></p><p>After reading the first volume, I was hooked. As a Douban review states: “High-level reality. In the tide of the times, entrepreneurs and founders are no different from gamblers. Those with ambition get lost in the halo of success, only to see themselves clearly after a crushing defeat.” Volume 2 analyzes the downfall of nine famous Chinese enterprises.</p><h2 id="The-Passionate-Programmer-From-Good-to-Great"><a href="#The-Passionate-Programmer-From-Good-to-Great" class="headerlink" title="The Passionate Programmer: From Good to Great"></a>The Passionate Programmer: From Good to Great</h2><p><img src="/en/images/recomend-2018/15478826704343.jpg"></p><p>A companion to “The Productive Programmer,” featuring essays from the Coding Horror blog by Jeff Atwood. It covers time management, coding methods, testing, and tech reading. It’s a great guide for developers at all stages to refocus on the human aspect of software development.</p><p>My reading notes:</p><ol><li><a href="https://www.androidperformance.com/en/2018/09/19/how-to-stop-sucking-and-be-awesome-instead-1/">Part 1: How to Stop Sucking and Be Awesome Instead</a></li><li><a href="https://www.androidperformance.com/en/2018/09/20/how-to-stop-sucking-and-be-awesome-instead-2/">Part 2: The Way of Programming</a></li><li><a href="https://www.androidperformance.com/en/2018/09/26/how-to-stop-sucking-and-be-awesome-instead-3/">Part 3: Web Design Principles</a></li><li><a href="https://www.androidperformance.com/en/2018/09/27/how-to-stop-sucking-and-be-awesome-instead-4/">Part 4: Thoughts on Testing</a></li><li><a href="https://www.androidperformance.com/en/2018/09/28/how-to-stop-sucking-and-be-awesome-instead-5/">Part 5: Knowing Your Users</a></li><li><a href="https://www.androidperformance.com/en/2018/09/29/how-to-stop-sucking-and-be-awesome-instead-6/">Part 6: Understanding the Internet</a></li><li><a href="https://www.androidperformance.com/en/2018/09/30/how-to-stop-sucking-and-be-awesome-instead-7/">Part 7: Games and Programming</a></li><li><a href="https://www.androidperformance.com/en/2018/10/01/how-to-stop-sucking-and-be-awesome-instead-8/">Part 8: The Beauty of Reading</a></li></ol><h1 id="Recommended-WeChat-Accounts"><a href="#Recommended-WeChat-Accounts" class="headerlink" title="Recommended WeChat Accounts"></a>Recommended WeChat Accounts</h1><ol><li>hongyangAndroid</li><li>Google_Developers</li><li>guolin_blog</li><li>googdev</li><li>LinuxDev</li><li>hencoder</li><li>androidperf (Android Performance Optimization)</li><li>nanchen_android</li><li>flutter-io</li><li>Tencent Bugly</li></ol><h1 id="Software-Services"><a href="#Software-Services" class="headerlink" title="Software Services"></a>Software Services</h1><h2 id="WeChat-Read-Memberships"><a href="#WeChat-Read-Memberships" class="headerlink" title="WeChat Read (Memberships)"></a>WeChat Read (Memberships)</h2><p>The most valuable subscription I paid for this year. The annual membership covers almost all paid publications and audiobooks. I’ve read over 20 books here this year, including “The Three-Body Problem,” “Hacker and Painters,” and “The Grain Brain.”</p><h1 id="Recommended-Consumer-Goods"><a href="#Recommended-Consumer-Goods" class="headerlink" title="Recommended Consumer Goods"></a>Recommended Consumer Goods</h1><h2 id="12-9”-iPad-Pro"><a href="#12-9”-iPad-Pro" class="headerlink" title="12.9” iPad Pro"></a>12.9” iPad Pro</h2><p>The 2018 <a href="https://item.jd.com/100000206154.html">iPad Pro</a> is incredible in every way. It can almost replace a laptop for reading, taking notes, and watching videos. The 120Hz ProMotion display is a pure joy to use.</p><p><img src="/en/images/recomend-2018/15478853976136.jpg"></p><h1 id="Recommended-Online-Columns"><a href="#Recommended-Online-Columns" class="headerlink" title="Recommended Online Columns"></a>Recommended Online Columns</h1><h2 id="Geek-Time-Android-Development-Masterclass"><a href="#Geek-Time-Android-Development-Masterclass" class="headerlink" title="Geek Time: Android Development Masterclass"></a>Geek Time: Android Development Masterclass</h2><p>A custom course for Android developers covering complex topics like crashes, memory, jank, startup, I&#x2F;O, storage, network, power, and UI. Highly recommended for any serious Android engineer.</p><h2 id="Geek-Time-Linux-Performance-Optimization-in-Action"><a href="#Geek-Time-Linux-Performance-Optimization-in-Action" class="headerlink" title="Geek Time: Linux Performance Optimization in Action"></a>Geek Time: Linux Performance Optimization in Action</h2><p>Recommended for Linux and Android low-level developers. Taught by a senior Microsoft Azure engineer, it uses a case-driven approach to teach underlying principles and professional optimization techniques.</p><h1 id="About-Me-amp-amp-Blog"><a href="#About-Me-amp-amp-Blog" class="headerlink" title="About Me &amp;&amp; Blog"></a>About Me &amp;&amp; Blog</h1><p>Below is my personal intro and related links. I look forward to exchanging ideas with fellow professionals. “When three walk together, one can always be my teacher!”</p><ol><li><a href="https://www.androidperformance.com/en/about/">Blogger Intro</a></li><li><a href="https://www.androidperformance.com/en/2019/12/01/BlogMap/">Blog Content Navigation</a>: A guide for my blog content.</li><li><a href="https://www.androidperformance.com/en/2018/05/07/Android-performance-optimization-skills-and-tools/">Curated Excellent Blog Articles - Android Performance Optimization Must-Knows</a></li><li><a href="https://www.androidperformance.com/en/2023/12/30/the-performance/">Android Performance Optimization Knowledge Planet</a></li></ol><blockquote><p><strong>One walks faster alone, but a group walks further together.</strong></p></blockquote><p><img src="/en/images/WechatIMG581.webp" alt="Scan WeChat QR Code"></p>]]></content>
    
    
    <summary type="html">&lt;p&gt;At the beginning of 2018, I wrote &lt;a href=&quot;https://www.androidperformance.com/en/2018/01/06/Most-Recommended-of-2017/&quot;&gt;2017 Best Items Recommendations&lt;/a&gt;. Recently, some people asked if I’d do one for 2018. Although 2018 was a tough year, there were still some great things worth recommending to everyone.&lt;/p&gt;
&lt;p&gt;Just like in 2017, I’ll share things that I found helpful for work or life. The recommendations include apps, hardware, books, blogs, and columns. I hope they provide value to you in 2019.&lt;/p&gt;</summary>


    <category term="Essays" scheme="https://androidperformance.com/en/categories/Essays/"/>
    
    
    <category term="Android" scheme="https://androidperformance.com/en/tags/Android/"/>
    
    <category term="Memory" scheme="https://androidperformance.com/en/tags/Memory/"/>
    
    <category term="Linux" scheme="https://androidperformance.com/en/tags/Linux/"/>
    
    <category term="Annual Recommendations" scheme="https://androidperformance.com/en/tags/Annual-Recommendations/"/>
    
  </entry>
  
  <entry>
    <title>Setting Up the Android System Development Environment</title>
    <link href="https://androidperformance.com/en/2018/11/01/android-system-develop-0/"/>
    <id>https://androidperformance.com/en/2018/11/01/android-system-develop-0/</id>
    <published>2018-11-01T11:40:16.000Z</published>
    <updated>2026-06-02T15:40:34.521Z</updated>
    
    <content type="html"><![CDATA[<p>Whether you are an Android App developer or a System developer, having a foundational understanding of the Android system is extremely beneficial. I recently set up a development environment at home and decided to share the process for anyone interested.</p><p>The general steps involved are as follows:</p><ol><li>Installing Ubuntu</li><li>Configuring Ubuntu</li><li>Installing Essential Software</li><li>Configuring Network Access (Optional)</li><li>Downloading AOSP Code</li><li>Setting Up the Build Environment and Compiling Pixel Code</li><li>Flashing the Device</li><li>Modifying and Compiling Framework, Services, and Res</li></ol><h3 id="Recommended-Hardware"><a href="#Recommended-Hardware" class="headerlink" title="Recommended Hardware"></a>Recommended Hardware</h3><p>While not strictly required, having the following makes the process much smoother:</p><ol><li>A PC or Laptop</li><li>A 512GB SSD</li><li>A Pixel device</li></ol><hr><h2 id="1-Installing-Ubuntu"><a href="#1-Installing-Ubuntu" class="headerlink" title="1. Installing Ubuntu"></a>1. Installing Ubuntu</h2><p>For Linux development, I recommend using Ubuntu as your primary OS rather than a virtual machine. Installing it directly on your hardware provides better performance. The current recommended LTS version is 18.04. The installation process is fairly straightforward:</p><ol><li>Download Ubuntu 18.04: <a href="http://mirrors.opencas.cn/ubuntu-releases/18.04.1/ubuntu-18.04.1-desktop-amd64.iso">ubuntu 18.04</a></li><li>Create a bootable USB drive using the tool recommended by Ubuntu.</li><li>Install Ubuntu using the USB drive.</li></ol><p><img src="/en/images/android-system/mydesktop.webp" alt="Ubuntu Desktop"></p><hr><h2 id="2-Configuring-Ubuntu"><a href="#2-Configuring-Ubuntu" class="headerlink" title="2. Configuring Ubuntu"></a>2. Configuring Ubuntu</h2><ol><li>Install an input method (e.g., Sogou Pinyin).</li><li>Install vim: <code>sudo apt install vim</code></li><li>Install adb</li><li>Install fastboot</li></ol><hr><h2 id="3-Installing-Essential-Software"><a href="#3-Installing-Essential-Software" class="headerlink" title="3. Installing Essential Software"></a>3. Installing Essential Software</h2><ol><li>VS Code</li><li>Android Studio</li><li>Meld (for diffing)</li><li>Wine</li><li>WPS Office</li></ol><hr><h2 id="4-Configuring-Network-Access-Optional"><a href="#4-Configuring-Network-Access-Optional" class="headerlink" title="4. Configuring Network Access (Optional)"></a>4. Configuring Network Access (Optional)</h2><ol><li>Prepare a stable network access path for your local environment.</li></ol><hr><h2 id="5-Downloading-AOSP-Code"><a href="#5-Downloading-AOSP-Code" class="headerlink" title="5. Downloading AOSP Code"></a>5. Downloading AOSP Code</h2><p>If you cannot access Google servers directly, I recommend using the Tsinghua University mirror: <a href="https://mirror.tuna.tsinghua.edu.cn/help/AOSP/">https://mirror.tuna.tsinghua.edu.cn/help/AOSP/</a></p><h3 id="Download-repo"><a href="#Download-repo" class="headerlink" title="Download repo"></a>Download repo</h3><figure class="highlight bash"><table><tr><td class="gutter"><pre><span class="line">1</span><br><span class="line">2</span><br><span class="line">3</span><br><span class="line">4</span><br></pre></td><td class="code"><pre><span class="line"><span class="built_in">mkdir</span> ~/bin</span><br><span class="line">PATH=~/bin:<span class="variable">$PATH</span></span><br><span class="line">curl https://storage.googleapis.com/git-repo-downloads/repo &gt; ~/bin/repo</span><br><span class="line"><span class="built_in">chmod</span> a+x ~/bin/repo</span><br></pre></td></tr></table></figure><h3 id="Create-Working-Directory"><a href="#Create-Working-Directory" class="headerlink" title="Create Working Directory"></a>Create Working Directory</h3><figure class="highlight bash"><table><tr><td class="gutter"><pre><span class="line">1</span><br><span class="line">2</span><br></pre></td><td class="code"><pre><span class="line"><span class="built_in">mkdir</span> WORKING_DIRECTORY</span><br><span class="line"><span class="built_in">cd</span> WORKING_DIRECTORY</span><br></pre></td></tr></table></figure><h3 id="Initialize-the-Repository"><a href="#Initialize-the-Repository" class="headerlink" title="Initialize the Repository"></a>Initialize the Repository</h3><figure class="highlight bash"><table><tr><td class="gutter"><pre><span class="line">1</span><br></pre></td><td class="code"><pre><span class="line">repo init -u https://aosp.tuna.tsinghua.edu.cn/platform/manifest</span><br></pre></td></tr></table></figure><h3 id="Sync-the-Code"><a href="#Sync-the-Code" class="headerlink" title="Sync the Code"></a>Sync the Code</h3><p>(Using <code>-c --no-tags</code> downloads less data, speeding up the process)</p><figure class="highlight bash"><table><tr><td class="gutter"><pre><span class="line">1</span><br></pre></td><td class="code"><pre><span class="line">repo <span class="built_in">sync</span> -c --no-tags</span><br></pre></td></tr></table></figure><hr><h2 id="6-Setting-Up-the-Build-Environment-and-Compiling-Pixel-Code"><a href="#6-Setting-Up-the-Build-Environment-and-Compiling-Pixel-Code" class="headerlink" title="6. Setting Up the Build Environment and Compiling Pixel Code"></a>6. Setting Up the Build Environment and Compiling Pixel Code</h2><h3 id="Install-JDK"><a href="#Install-JDK" class="headerlink" title="Install JDK"></a>Install JDK</h3><figure class="highlight bash"><table><tr><td class="gutter"><pre><span class="line">1</span><br><span class="line">2</span><br></pre></td><td class="code"><pre><span class="line">sudo apt-get update</span><br><span class="line">sudo apt-get install openjdk-8-jdk</span><br></pre></td></tr></table></figure><h3 id="Install-Dependencies"><a href="#Install-Dependencies" class="headerlink" title="Install Dependencies"></a>Install Dependencies</h3><figure class="highlight bash"><table><tr><td class="gutter"><pre><span class="line">1</span><br></pre></td><td class="code"><pre><span class="line">sudo apt-get install git-core gnupg flex bison gperf build-essential zip curl zlib1g-dev gcc-multilib g++-multilib libc6-dev-i386 lib32ncurses5-dev x11proto-core-dev libx11-dev lib32z-dev libgl1-mesa-dev libxml2-utils xsltproc unzip</span><br></pre></td></tr></table></figure><h3 id="Download-Pixel-Drivers"><a href="#Download-Pixel-Drivers" class="headerlink" title="Download Pixel Drivers"></a>Download Pixel Drivers</h3><p>When compiling code for the Android Master branch (or specific versions), you need to download the drivers corresponding to your device. You can find them here:<br><a href="https://developers.google.cn/android/blobs-preview">https://developers.google.cn/android/blobs-preview</a></p><p><a href="/images/android-system/extract-qcom-sailfish.">Extracting drivers image</a></p><p>The extracted files should look like this:<br><img src="/en/images/android-system/extract-google_devices-sailfish-1.webp" alt="Extracted Google devices"></p><h3 id="Compile-the-Pixel-System-Image"><a href="#Compile-the-Pixel-System-Image" class="headerlink" title="Compile the Pixel System Image"></a>Compile the Pixel System Image</h3><p>Run the following at the root of your source directory:</p><figure class="highlight bash"><table><tr><td class="gutter"><pre><span class="line">1</span><br></pre></td><td class="code"><pre><span class="line"><span class="built_in">source</span> build/envsetup.sh</span><br></pre></td></tr></table></figure><p>Next, use the <code>lunch</code> command to select your device model and build type (<code>user</code>, <code>userdebug</code>, <code>eng</code>):</p><figure class="highlight bash"><table><tr><td class="gutter"><pre><span class="line">1</span><br></pre></td><td class="code"><pre><span class="line">lunch</span><br></pre></td></tr></table></figure><p><img src="/en/images/android-system/lunch.webp" alt="lunch command"></p><p>After making your selection, type the corresponding number and start the compilation with <code>make</code>. You can use the <code>-j</code> flag to specify the number of threads (e.g., <code>-j8</code> for 8 threads). Adjust based on your CPU performance:</p><figure class="highlight bash"><table><tr><td class="gutter"><pre><span class="line">1</span><br></pre></td><td class="code"><pre><span class="line">make -j8</span><br></pre></td></tr></table></figure><p><img src="/en/images/android-system/make-j8.webp" alt="make process"></p><h3 id="Successful-Compilation"><a href="#Successful-Compilation" class="headerlink" title="Successful Compilation"></a>Successful Compilation</h3><p>The <code>out</code> directory will contain the generated images.<br><img src="/en/images/android-system/out_folder.webp" alt="out folder"></p><hr><h2 id="7-Flashing-the-Device"><a href="#7-Flashing-the-Device" class="headerlink" title="7. Flashing the Device"></a>7. Flashing the Device</h2><p>From the root of your source directory, run the following command to flash the system onto your device:</p><p><img src="/en/images/android-system/fastboot.webp" alt="fastboot device"></p><figure class="highlight bash"><table><tr><td class="gutter"><pre><span class="line">1</span><br></pre></td><td class="code"><pre><span class="line">fastboot flashall</span><br></pre></td></tr></table></figure><p><img src="/en/images/android-system/fastboot-flashall.webp" alt="fastboot flashall output"></p><hr><h2 id="8-Modifying-and-Compiling-Framework-Services-and-Res"><a href="#8-Modifying-and-Compiling-Framework-Services-and-Res" class="headerlink" title="8. Modifying and Compiling Framework, Services, and Res"></a>8. Modifying and Compiling Framework, Services, and Res</h2><p>Run the following commands from the root of your source directory.</p><h3 id="Recommended-IDEs"><a href="#Recommended-IDEs" class="headerlink" title="Recommended IDEs"></a>Recommended IDEs</h3><ul><li><strong>Java Code</strong>: Use Android Studio for opening and editing.</li><li><strong>C&#x2F;C++ Code</strong>: Use SourceInsight, Eclipse, or VS Code.</li></ul><h3 id="Compiling-Framework"><a href="#Compiling-Framework" class="headerlink" title="Compiling Framework"></a>Compiling Framework</h3><figure class="highlight bash"><table><tr><td class="gutter"><pre><span class="line">1</span><br></pre></td><td class="code"><pre><span class="line">mmm frameworks/base</span><br></pre></td></tr></table></figure><h3 id="Compiling-Services"><a href="#Compiling-Services" class="headerlink" title="Compiling Services"></a>Compiling Services</h3><figure class="highlight bash"><table><tr><td class="gutter"><pre><span class="line">1</span><br></pre></td><td class="code"><pre><span class="line">mmm frameworks/base/services</span><br></pre></td></tr></table></figure><h3 id="Compiling-Res"><a href="#Compiling-Res" class="headerlink" title="Compiling Res"></a>Compiling Res</h3><figure class="highlight bash"><table><tr><td class="gutter"><pre><span class="line">1</span><br></pre></td><td class="code"><pre><span class="line">mmm frameworks/base/core/res</span><br></pre></td></tr></table></figure><h3 id="Root-and-Remount"><a href="#Root-and-Remount" class="headerlink" title="Root and Remount"></a>Root and Remount</h3><p><img src="/en/images/android-system/root--remount.webp" alt="root and remount"></p><h3 id="Push-Changes"><a href="#Push-Changes" class="headerlink" title="Push Changes"></a>Push Changes</h3><p>Once you have root and remount access, you can <code>adb push</code> the modified framework, services, or res files to the device. Restarting the shell or the device will apply the changes. Alternatively, use <code>adb sync system</code>. This synchronizes the <code>system</code> directory from your <code>out</code> folder to the device, which is extremely convenient.</p><p>Example:</p><figure class="highlight bash"><table><tr><td class="gutter"><pre><span class="line">1</span><br></pre></td><td class="code"><pre><span class="line">adb root &amp;&amp; adb remount &amp;&amp; adb shell stop &amp;&amp; adb <span class="built_in">sync</span> system &amp;&amp; adb shell start</span><br></pre></td></tr></table></figure><hr><h1 id="About-Me-amp-amp-Blog"><a href="#About-Me-amp-amp-Blog" class="headerlink" title="About Me &amp;&amp; Blog"></a>About Me &amp;&amp; Blog</h1><p>Below are my personal details and links. I look forward to connecting and sharing knowledge with fellow developers!</p><ol><li><a href="https://www.androidperformance.com/en/about/">About Me</a>: Includes my WeChat and WeChat group links.</li><li><a href="https://www.androidperformance.com/en/2019/12/01/BlogMap/">Blog Navigation</a>: A guide to the content on this blog.</li><li><a href="https://www.androidperformance.com/en/2018/05/07/Android-performance-optimization-skills-and-tools/">Curated Android Performance Articles</a>: A collection of must-read performance optimization articles. Self-nominations&#x2F;recommendations are welcome!</li><li><a href="https://www.androidperformance.com/en/2023/12/30/the-performance/">Android Performance Knowledge Planet</a>: Join our community for more insights.</li></ol><blockquote><p><strong>“If you want to go fast, go alone. If you want to go far, go together.”</strong></p></blockquote><p><img src="/en/images/WechatIMG581.webp" alt="WeChat QR Code"></p>]]></content>


    <summary type="html">&lt;p&gt;Whether you are an Android App developer or a System developer, having a foundational understanding of the Android system is extremely be</summary>


    <category term="Android" scheme="https://androidperformance.com/en/categories/Android/"/>
    
    
    <category term="Android" scheme="https://androidperformance.com/en/tags/Android/"/>
    
    <category term="Startup" scheme="https://androidperformance.com/en/tags/Startup/"/>
    
    <category term="Memory" scheme="https://androidperformance.com/en/tags/Memory/"/>
    
    <category term="Java" scheme="https://androidperformance.com/en/tags/Java/"/>
    
    <category term="Framework" scheme="https://androidperformance.com/en/tags/Framework/"/>
    
  </entry>
  
  <entry>
    <title>Lu Qi: Besides Good Code, What Makes an Engineer Excellent?</title>
    <link href="https://androidperformance.com/en/2018/10/25/How-do-engineers-count-well/"/>
    <id>https://androidperformance.com/en/2018/10/25/How-do-engineers-count-well/</id>
    <published>2018-10-25T02:37:34.000Z</published>
    <updated>2026-05-10T23:29:51.061Z</updated>
    
    <content type="html"><![CDATA[<blockquote><p>Reposted from: Baidu Family, based on Lu Qi’s internal sharing at Baidu in July 2017. It is highly worth learning and pondering for technical personnel.</p></blockquote><p>I personally admire <a href="https://en.wikipedia.org/wiki/Lu_Qi">Lu Qi</a>. “Lu Qi is known for his incredible energy. He typically wakes up at 4 AM, checks emails, and then runs 4 miles on a treadmill while listening to classical music or watching news. He arrives at the office between 5 AM and 6 AM, using that time to prepare for the day undisturbed, and usually works until 10 PM, sometimes sending emails to colleagues at midnight. LinkedIn CEO Jeff Weiner, who worked with Lu Qi at Yahoo for years, initially thought this schedule was unsustainable but eventually said: ‘Lu Qi is indeed the most driven person I have ever met.’ Former Yahoo engineer Amit Kumar also praised Lu’s popularity. Lu says: ‘I don’t feel tired; I love my job every day.’ Lu Qi holds 20 US patents.”</p><p><img src="/en/images/media/15404360836694.jpg" alt="Lu Qi"></p><p>The core ideas of Lu Qi’s speech can be summarized into the following five points. I have posted them on my study wall to remind myself constantly.</p><blockquote><ol><li>“We must have an unwavering and profound belief that the entire world is ultimately driven by technology.”</li><li>“Has anyone else already solved this problem? If so, put your time into better innovation.”</li><li>“Whatever you do, aim to be the best, to be the strongest in the industry.”</li><li>“I imagine myself as a piece of software, a piece of code. Today’s version must be better than yesterday’s, and tomorrow’s will surely be better than today’s.”</li><li>“If you see a problem, don’t just ask others—Fix it.”</li></ol></blockquote><h1 id="Believe-in-Technology"><a href="#Believe-in-Technology" class="headerlink" title="Believe in Technology"></a>Believe in Technology</h1><p>First, believe in technology. As I mentioned, for our industry, and especially for companies like Baidu, a steady and unwavering belief in technology is vital.</p><p>I’d also like to share that Bill Gates mentioned Microsoft’s mission as: writing software represents the future of the world.</p><p>Why? Because any industry in the future will become a software industry. Gates was right because the degree of automation in any industry will keep increasing, and ultimately, what you process is information and knowledge.</p><p>But the way software works has moved forward again. In the age of AI, it’s not just about writing code; you must understand algorithms, hardware, and data. The entire AI development process has advanced significantly. However, technology—especially the technology represented by our industry—will always be at the forefront of any future industry.</p><p>Therefore, we must have an unwavering and profound belief that <strong>the entire world is ultimately driven by technology</strong>.</p><h1 id="Innovate-on-the-Shoulders-of-Giants"><a href="#Innovate-on-the-Shoulders-of-Giants" class="headerlink" title="Innovate on the Shoulders of Giants"></a>Innovate on the Shoulders of Giants</h1><p>If we look at Silicon Valley in the US or China, whether it’s an internet startup or a large corporation, the starting point for everyone is getting higher. Why is the speed of innovation so fast now? Mainly because the starting point is high. The code modules and service capabilities we can use have greatly improved.</p><p>Internally, I want to emphasize this. Many large companies, including Microsoft, have rewritten internal code countless times.</p><p>My requirement now is: <strong>Every time you write a new line of code, the first thing to do is think about whether that line is worth writing. Has someone else already done the same work, perhaps even better? Has anyone else already solved this problem? Then you can put your time into better innovation.</strong></p><p>Especially in large companies, there is too much repeated or nearly repeated code, wasting too many resources. This isn’t good for anyone’s career.</p><p>Again, within a large company, think before you write code: Do I need to write this? Does someone else already have it? Stand on the shoulders of others to do this.</p><h1 id="Pursue-Engineering-Excellence"><a href="#Pursue-Engineering-Excellence" class="headerlink" title="Pursue Engineering Excellence"></a>Pursue Engineering Excellence</h1><p>Another thing I want to emphasize is Engineering Excellence—the technical excellence and capability in engineering.</p><p>Competition in any market is like war. It depends on the physical strength and quality of your troops, the level of training for each soldier, and the weapons you give them—machine guns, tanks, or something else.</p><p>Engineering Excellence is analogous to this. We want to build the world’s strongest force. Every soldier, every leader, everyone’s capability and training are top-notch, and the tools and weapons we provide are first-class.</p><p>Therefore, Engineering Excellence is a collective pursuit of individual and team capability, alongside innovation in tool platforms. Combined, they bring us long-term core competitiveness and create value for society—ultimately for every user, enterprise, and society as a whole.</p><p>I also want to emphasize here: Relentless pursuit of excellence—<strong>a never-ending, continuous pursuit.</strong></p><p><strong>We either don’t do it, or we do it best.</strong> This is my requirement for everyone. Whether it’s a database, a large platform, or big data, whatever we decide to do, we must be determined. Aim to be the best, to be the strongest in the industry.</p><h1 id="Learn-Every-Day"><a href="#Learn-Every-Day" class="headerlink" title="Learn Every Day"></a>Learn Every Day</h1><p>Learning every day is perhaps the most important thing for everyone.</p><p>Today, I’ll share how I think about myself. It’s a simple concept: I imagine myself as a piece of software, a piece of code. Today’s version must be better than yesterday’s, and tomorrow’s will surely be better than today’s, because even if I make a mistake, I have an <code>if</code> statement inside that says: If I see this error again, never repeat it.</p><p>In English, there is a saying: “Life is too short, don’t live the same day twice.” Every day should be different, and every day should be better. Today’s version must be better than yesterday’s. Every outstanding engineer and technical leader must maintain the ability to learn, especially the scope of their learning.</p><p>To expand on this, if you only study Computer Science, it’s certainly not enough. For example, you must study Economics. Why? Computer Science has a major limitation: it assumes that once you have an input, you get an output. This problem-solving approach has its benefits but also its limitations.</p><p>Take map navigation as an example. If you use a purely technical approach, you just move people from one congested area to another. Economics models problems differently. It starts by assuming an overall ecosystem where one person’s input is another person’s output. To describe a navigation problem through economics, you calculate an Equilibrium. Markets work the same way.</p><p>If you want to truly understand Deep Learning, you must relearn Physics, look at Biology, and study Evolutionary Theory. Because Deep Learning is closely related to these fields. You can’t figure it out on your own; to understand it thoroughly, you must study.</p><p>Also, study Product. I’ve always told engineers: if you don’t understand the product, you can’t be a top engineer. To truly be a world-class engineer, you need to understand not just the product but also the entire business and ecosystem. Your responsibility is to see the future—to project technology into future needs and prepare your platform, development flow, and team for that future. So, learning is incredibly important.</p><h1 id="Ownership"><a href="#Ownership" class="headerlink" title="Ownership"></a>Ownership</h1><p>Finally, it starts with me.</p><p>Our company has a grand mission: to simplify a complex world with technology. The world is very, very complex. Essentially, what humans do is “Reduce entropy.”</p><p>According to the Second Law of Thermodynamics, the world tends to become more chaotic. What we want to do is make it simpler and make our lives better.</p><p>Specifically, we can use AI technology to “awaken all things.” But all of this is built on the accumulated actions of every individual—starting with me. Then there is Ownership: if you see an opportunity, don’t ask others—just do it. If you see a problem, don’t ask others—Fix it.</p><p>Treat our mission and our company as your own personal career. I can tell you honestly: if you treat the company’s mission and business as your own and “Own everything,” your career will certainly move the fastest. Start with yourself, start with everything around you.</p><h1 id="About-Me-amp-amp-Blog"><a href="#About-Me-amp-amp-Blog" class="headerlink" title="About Me &amp;&amp; Blog"></a>About Me &amp;&amp; Blog</h1><p>Below is my personal introduction and related links. I look forward to exchanging ideas with fellow professionals. “When three walk together, one can always be my teacher!”</p><ol><li><a href="https://www.androidperformance.com/en/about/">Blogger Intro</a>: Includes personal WeChat and WeChat group links.</li><li><a href="https://www.androidperformance.com/en/2019/12/01/BlogMap/">Blog Content Navigation</a>: A guide for my blog content.</li><li><a href="https://www.androidperformance.com/en/2018/05/07/Android-performance-optimization-skills-and-tools/">Curated Excellent Blog Articles - Android Performance Optimization Must-Knows</a>: Welcome to recommend projects&#x2F;articles.</li><li><a href="https://www.androidperformance.com/en/2023/12/30/the-performance/">Android Performance Optimization Knowledge Planet</a>: Welcome to join and thank you for your support~</li></ol><blockquote><p><strong>One walks faster alone, but a group walks further together.</strong></p></blockquote><p><img src="/en/images/WechatIMG581.webp" alt="Scan WeChat QR Code"></p>]]></content>


    <summary type="html">&lt;blockquote&gt;
&lt;p&gt;Reposted from: Baidu Family, based on Lu Qi’s internal sharing at Baidu in July 2017. It is highly worth learning and ponder</summary>


    <category term="Essays" scheme="https://androidperformance.com/en/categories/Essays/"/>
    
    
    <category term="Programmer" scheme="https://androidperformance.com/en/tags/Programmer/"/>
    
  </entry>
  
  <entry>
    <title>The Programmer&#39;s Apprenticeship - 08: The Beauty of Reading</title>
    <link href="https://androidperformance.com/en/2018/10/01/how-to-stop-sucking-and-be-awesome-instead-8/"/>
    <id>https://androidperformance.com/en/2018/10/01/how-to-stop-sucking-and-be-awesome-instead-8/</id>
    <published>2018-10-01T06:34:15.000Z</published>
    <updated>2026-05-10T23:29:51.068Z</updated>
    
    <content type="html"><![CDATA[<p>This is the eighth post in the reading notes series for <em>The Programmer’s Apprenticeship: From Good to Great</em>. The author, Jeff Atwood, is one of the founders of Stack Overflow. His articles cover a wide range of topics. He is a seasoned programmer, manager, and entrepreneur. This book discusses many things beyond programming. Whether you are a junior engineer or a senior engineer, this book is worth reading. As your experience grows, every time you re-read this book, you will gain new insights. Just as the title “From Good to Great” suggests, the author points out the path for you, but whether you can succeed depends on your own cultivation.</p><p>I will excerpt some wonderful remarks from the book and sometimes add my own insights or experiences. The outline of the reading notes is consistent with the outline of the book itself. This is also a method I learned from another source and have been using: “How to Read a Book”. I record it for my own frequent review and for readers’ reference. Below is the <em>The Programmer’s Apprenticeship</em> reading note series:</p><ol><li><a href="https://www.androidperformance.com/en/2018/09/19/how-to-stop-sucking-and-be-awesome-instead-1/">The Programmer’s Apprenticeship - 01: The Art of Fighting Back</a></li><li><a href="https://www.androidperformance.com/en/2018/09/20/how-to-stop-sucking-and-be-awesome-instead-2/">The Programmer’s Apprenticeship - 02: The Way of Programming</a></li><li><a href="https://www.androidperformance.com/en/2018/09/26/how-to-stop-sucking-and-be-awesome-instead-3/">The Programmer’s Apprenticeship - 03: Web Design Principles</a></li><li><a href="https://www.androidperformance.com/en/2018/09/27/how-to-stop-sucking-and-be-awesome-instead-4/">The Programmer’s Apprenticeship - 04: Reflections on Testing</a></li><li><a href="https://www.androidperformance.com/en/2018/09/28/how-to-stop-sucking-and-be-awesome-instead-5/">The Programmer’s Apprenticeship - 05: Know Your Users</a></li><li><a href="https://www.androidperformance.com/en/2018/09/29/how-to-stop-sucking-and-be-awesome-instead-6/">The Programmer’s Apprenticeship - 06: All About the Internet</a></li><li><a href="https://www.androidperformance.com/en/2018/09/30/how-to-stop-sucking-and-be-awesome-instead-7/">The Programmer’s Apprenticeship - 07: Games and Programming</a></li><li><a href="https://www.androidperformance.com/en/2018/10/01/how-to-stop-sucking-and-be-awesome-instead-8/">The Programmer’s Apprenticeship - 08: The Beauty of Reading</a></li></ol><hr><h2 id="Not-Reading-Whose-Fault-Is-It"><a href="#Not-Reading-Whose-Fault-Is-It" class="headerlink" title="Not Reading, Whose Fault Is It?"></a>Not Reading, Whose Fault Is It?</h2><p><em>(Based on Jeff Atwood’s <a href="https://blog.codinghorror.com/programmers-dont-read-books-but-you-should/">Programmers Don’t Read Books – But You Should</a>)</em></p><p>There’s a saying: “Programmers don’t read books.” Jeff explores why this might be true. Often, technical books are dry, outdated by the time they are printed, or just plain boring. The Internet has replaced the reference book for many of us.</p><p>However, Jeff argues that <strong>we are missing out</strong>. Deep knowledge often requires the long-form structure that only a book (or a very long series of articles) can provide. Reading code is important, but reading <em>about</em> code—the philosophy, the architecture, the “why”—is equally vital.</p><p>We can’t just blame the industry or the medium. If we don’t read, it’s our own fault. We stagnate. We miss the wisdom of the “giants” upon whose shoulders we stand. Books like <em>The Pragmatic Programmer</em>, <em>Code Complete</em>, and <em>The Mythical Man-Month</em> are timeless for a reason.</p><h2 id="Heaven-Helps-Those-Who-Help-Themselves"><a href="#Heaven-Helps-Those-Who-Help-Themselves" class="headerlink" title="Heaven Helps Those Who Help Themselves"></a>Heaven Helps Those Who Help Themselves</h2><p><em>(Based on Jeff Atwood’s <a href="https://blog.codinghorror.com/how-to-ask-questions-the-smart-way/">How To Ask Questions The Smart Way</a> and <a href="https://blog.codinghorror.com/what-have-you-tried/">What have you tried?</a>)</em></p><p>This section echoes the core philosophy of Stack Overflow: <strong>Self-reliance</strong>.</p><p>Before you ask for help, you must demonstrate that you have tried to help yourself. “Heaven helps those who help themselves” implies that you shouldn’t expect others to solve your problems if you haven’t put in the effort first.</p><p>Jeff famously asks: <strong>“What have you tried?”</strong></p><p>If you encounter a bug, don’t just post the error message. Tell us:</p><ol><li>What you expected to happen.</li><li>What actually happened.</li><li>What you have already done to try to fix it.</li></ol><p>This isn’t just about etiquette; it’s about being a better engineer. The act of formulating the question and documenting your attempts often leads you to the answer before you even ask it (Rubber Duck Debugging).</p><h2 id="History-and-Status-Quo-of-Computer-Crime"><a href="#History-and-Status-Quo-of-Computer-Crime" class="headerlink" title="History and Status Quo of Computer Crime"></a>History and Status Quo of Computer Crime</h2><p><em>(Based on Jeff Atwood’s <a href="https://blog.codinghorror.com/computer-crime-then-and-now/">Computer Crime, Then and Now</a> and <a href="https://blog.codinghorror.com/i-was-a-teenage-hacker/">I Was a Teenage Hacker</a>)</em></p><p>In “I Was a Teenage Hacker,” Jeff recounts his own minor brush with the dark side of computing—writing a wardialer script in his youth. He uses this anecdote to discuss the evolution of computer crime.</p><p>Decades ago, hacking was often about curiosity or notoriety. Today, it is a massive, organized criminal industry. But interestingly, the <strong>techniques haven’t changed that much</strong>. Social engineering, weak passwords, and unpatched vulnerabilities are still the primary vectors.</p><p>What <em>has</em> changed is the scale and the stakes. We are now “digital by default,” meaning a breach isn’t just an annoyance; it’s a threat to our identity, our finances, and our infrastructure. Understanding the history of computer crime helps us realize that security isn’t a product you buy; it’s a process you practice providing.</p><h2 id="How-to-Communicate-with-People"><a href="#How-to-Communicate-with-People" class="headerlink" title="How to Communicate with People"></a>How to Communicate with People</h2><p><em>(Based on Jeff Atwood’s <a href="https://blog.codinghorror.com/the-art-of-speaking/">The Art of Speaking</a> and <a href="https://blog.codinghorror.com/communication-skills/">Communication Skills</a>)</em></p><p>Ideally, code would speak for itself. In reality, <strong>communication is the most important skill for a programmer.</strong></p><p>You can be the best coder in the world, but if you can’t explain your ideas to your team, persuade your manager, or understand your users, you will fail. Jeff emphasizes the importance of writing clearly (blogging helps with this!) and speaking confidently.</p><p>Soft skills are hard. They require empathy, patience, and practice. But they are force multipliers for your technical skills.</p><h2 id="Practice-Basic-Skills-Diligently"><a href="#Practice-Basic-Skills-Diligently" class="headerlink" title="Practice Basic Skills Diligently"></a>Practice Basic Skills Diligently</h2><p><em>(Based on Jeff Atwood’s <a href="https://blog.codinghorror.com/the-ten-commandments-of-egoless-programming/">The Ten Commandments of Egoless Programming</a> and <a href="https://blog.codinghorror.com/practice-makes-perfect/">Practice Makes Perfect</a>)</em></p><p>Finally, there are no shortcuts. To be awesome, you must practice.</p><p>But “practice” doesn’t just mean typing code for 10 hours a day. It means:</p><ul><li><strong>Deliberate Practice:</strong> Working on things you are <em>bad</em> at, not just things you are good at.</li><li><strong>Code Katas:</strong> Small exercises to keep your skills sharp.</li><li><strong>Reading Code:</strong> Reading other people’s code to learn new patterns.</li></ul><p>Excellence is a habit. It comes from the daily discipline of trying to suck a little less than you did yesterday.</p><hr><blockquote><p><em>The Programmer’s Apprenticeship</em> (or <em>Building a Career in Software</em>) is a compilation of the best articles from the Coding Horror blog. The book is divided into 8 chapters, covering topics such as time management, programming methods, web design, testing, user needs, the Internet, game programming, and technical reading. The topics selected by the author are all pain points in a programmer’s career. Many articles have high click-through rates and reply rates on blogs and the Internet. —— from Douban</p></blockquote><blockquote><p>Jeff Atwood founded the Coding Horror blog (codinghorror.com) in 2004 to record his thoughts and bits and pieces of his software development experience. Today, the blog has nearly 100,000 visits per day. Readers participate in comments, and various views and wisdom collide passionately there. —— from Douban</p></blockquote><blockquote><p>The writing style of <em>The Programmer’s Apprenticeship</em> is humorous, understanding, and caring; it is suitable for programmers at all stages from novice to veteran, and also suitable for students of computer science and related majors who are about to become programmers. <em>The Programmer’s Apprenticeship</em> can help readers pay more attention to the human nature and humanistic factors of technical work, thereby achieving a successful turning point in their programmer career. —— from Douban</p></blockquote><h1 id="About-Me-amp-amp-Blog"><a href="#About-Me-amp-amp-Blog" class="headerlink" title="About Me &amp;&amp; Blog"></a>About Me &amp;&amp; Blog</h1><p>Below is my personal introduction and related links. I look forward to exchanging ideas with fellow professionals. “When three walk together, one can always be my teacher!”</p><ol><li><a href="https://www.androidperformance.com/en/about/">Blogger Intro</a>: Includes personal WeChat and WeChat group links.</li><li><a href="https://www.androidperformance.com/en/2019/12/01/BlogMap/">Blog Content Navigation</a>: A guide for my blog content.</li><li><a href="https://www.androidperformance.com/en/2018/05/07/Android-performance-optimization-skills-and-tools/">Curated Excellent Blog Articles - Android Performance Optimization Must-Knows</a>: Welcome to recommend projects&#x2F;articles.</li><li><a href="https://www.androidperformance.com/en/2023/12/30/the-performance/">Android Performance Optimization Knowledge Planet</a>: Welcome to join and thank you for your support~</li></ol><blockquote><p><strong>One person can walk faster, a group can walk further</strong></p></blockquote><p><img src="/en/images/WechatIMG581.webp" alt="Scan WeChat QR Code"></p>]]></content>


    <summary type="html">&lt;p&gt;This is the eighth post in the reading notes series for &lt;em&gt;The Programmer’s Apprenticeship: From Good to Great&lt;/em&gt;. The author, Jeff At</summary>


    <category term="Reading Notes" scheme="https://androidperformance.com/en/categories/Reading-Notes/"/>
    
    
    <category term="Reading Notes" scheme="https://androidperformance.com/en/tags/Reading-Notes/"/>
    
    <category term="The Programmer&#39;s Apprenticeship" scheme="https://androidperformance.com/en/tags/The-Programmer-s-Apprenticeship/"/>
    
    <category term="Reading" scheme="https://androidperformance.com/en/tags/Reading/"/>
    
  </entry>
  
  <entry>
    <title>The Programmer&#39;s Apprenticeship - 07: Games and Programming</title>
    <link href="https://androidperformance.com/en/2018/09/30/how-to-stop-sucking-and-be-awesome-instead-7/"/>
    <id>https://androidperformance.com/en/2018/09/30/how-to-stop-sucking-and-be-awesome-instead-7/</id>
    <published>2018-09-30T06:34:15.000Z</published>
    <updated>2026-05-10T23:29:51.068Z</updated>
    
    <content type="html"><![CDATA[<p>This is the seventh post in the reading notes series for <em>The Programmer’s Apprenticeship: From Good to Great</em>. The author, Jeff Atwood, is one of the founders of Stack Overflow. His articles cover a wide range of topics. He is a seasoned programmer, manager, and entrepreneur. This book discusses many things beyond programming. Whether you are a junior engineer or a senior engineer, this book is worth reading. As your experience grows, every time you re-read this book, you will gain new insights. Just as the title “From Good to Great” suggests, the author points out the path for you, but whether you can succeed depends on your own cultivation.</p><p>I will excerpt some wonderful remarks from the book and sometimes add my own insights or experiences. The outline of the reading notes is consistent with the outline of the book itself. This is also a method I learned from another source and have been using: “How to Read a Book”. I record it for my own frequent review and for readers’ reference. Below is the <em>The Programmer’s Apprenticeship</em> reading note series:</p><ol><li><a href="https://www.androidperformance.com/en/2018/09/19/how-to-stop-sucking-and-be-awesome-instead-1/">The Programmer’s Apprenticeship - 01: The Art of Fighting Back</a></li><li><a href="https://www.androidperformance.com/en/2018/09/20/how-to-stop-sucking-and-be-awesome-instead-2/">The Programmer’s Apprenticeship - 02: The Way of Programming</a></li><li><a href="https://www.androidperformance.com/en/2018/09/26/how-to-stop-sucking-and-be-awesome-instead-3/">The Programmer’s Apprenticeship - 03: Web Design Principles</a></li><li><a href="https://www.androidperformance.com/en/2018/09/27/how-to-stop-sucking-and-be-awesome-instead-4/">The Programmer’s Apprenticeship - 04: Reflections on Testing</a></li><li><a href="https://www.androidperformance.com/en/2018/09/28/how-to-stop-sucking-and-be-awesome-instead-5/">The Programmer’s Apprenticeship - 05: Know Your Users</a></li><li><a href="https://www.androidperformance.com/en/2018/09/29/how-to-stop-sucking-and-be-awesome-instead-6/">The Programmer’s Apprenticeship - 06: All About the Internet</a></li><li><a href="https://www.androidperformance.com/en/2018/09/30/how-to-stop-sucking-and-be-awesome-instead-7/">The Programmer’s Apprenticeship - 07: Games and Programming</a></li><li><a href="https://www.androidperformance.com/en/2018/10/01/how-to-stop-sucking-and-be-awesome-instead-8/">The Programmer’s Apprenticeship - 08: The Beauty of Reading</a></li></ol><hr><h2 id="My-Programming-Career-Started-with-BASIC"><a href="#My-Programming-Career-Started-with-BASIC" class="headerlink" title="My Programming Career Started with BASIC"></a>My Programming Career Started with BASIC</h2><p><em>(Based on Jeff Atwood’s <a href="https://blog.codinghorror.com/about-me/">About Me</a> and <a href="https://blog.codinghorror.com/please-dont-learn-to-code/">Please Don’t Learn to Code</a>)</em></p><p>Jeff Atwood frequently mentions that his programming journey began with BASIC. His first computer was a <strong>Texas Instruments TI-99&#x2F;4a</strong>, and like many microcomputers of that era, it booted directly into a BASIC interpreter. This immediacy—turn on the machine, type a few lines of code, and see something happen—was crucial.</p><p>He argues that this low barrier to entry is something we’ve lost. In the “good old days,” the machine <em>invited</em> you to program it. Today, layers of abstraction and complex tooling can make the first step daunting.</p><p>However, he also famously wrote “Please Don’t Learn to Code,” arguing that not everyone <em>needs</em> to be a programmer. But for those who are drawn to it, that initial spark of creation—often fueled by simple tools like BASIC—is irreplaceable. It’s about the <strong>joy of building</strong>.</p><h2 id="If-You-Want-to-Play-a-Game-Write-It-Yourself"><a href="#If-You-Want-to-Play-a-Game-Write-It-Yourself" class="headerlink" title="If You Want to Play a Game, Write It Yourself"></a>If You Want to Play a Game, Write It Yourself</h2><p><em>(Based on Jeff Atwood’s <a href="https://blog.codinghorror.com/coding-horror-the-game/">Coding Horror: The Game</a> and related thoughts)</em></p><p>There is no better way to understand how software works than to try to build a game. Games are complex systems that require mastering loops, logic, graphics, and user interaction.</p><p>Jeff encourages aspiring programmers to try their hand at game development, not necessarily to become professional game developers, but to understand the <strong>mechanics of engagement</strong>. If you can build a game that is fun to play, you have learned valuable lessons about user experience (UX) and performance that apply to all software development.</p><blockquote><p>“The best way to learn is by doing. And the most fun thing to ‘do’ is a game.”</p></blockquote><h2 id="Metamorphosis-from-Gamer-to-Programmer"><a href="#Metamorphosis-from-Gamer-to-Programmer" class="headerlink" title="Metamorphosis from Gamer to Programmer"></a>Metamorphosis from Gamer to Programmer</h2><p><em>(Based on Jeff Atwood’s <a href="https://blog.codinghorror.com/the-gamer-programmer/">The Gamer &#x2F; Programmer</a> and <a href="https://blog.codinghorror.com/the-pc-weenies/">The PC Weenies</a>)</em></p><p>There is a huge overlap between gamers and programmers. Many of us got into this field because we wanted to understand how our favorite games worked—or because we wanted to mod them.</p><p>Jeff discusses how this background influences our mindset. Gamers are used to:</p><ol><li><strong>Problem Solving:</strong> Every game is a series of puzzles to be solved.</li><li><strong>Perseverance:</strong> We are used to failing (dying) and trying again until we succeed.</li><li><strong>Optimization:</strong> We are always looking for the “min-max” strategy to get the best result with the least effort.</li></ol><p>Transformation comes when we stop just <em>consuming</em> the content and start <em>creating</em> it. We peek behind the curtain. We realize that the “magic” is just code, and that we can wield that magic ourselves. The passion that drives a gamer to master a level is the same passion that drives a programmer to master a new language or framework.</p><hr><blockquote><p><em>The Programmer’s Apprenticeship</em> (or <em>Building a Career in Software</em>) is a compilation of the best articles from the Coding Horror blog. The book is divided into 8 chapters, covering topics such as time management, programming methods, web design, testing, user needs, the Internet, game programming, and technical reading. The topics selected by the author are all pain points in a programmer’s career. Many articles have high click-through rates and reply rates on blogs and the Internet. —— from Douban</p></blockquote><blockquote><p>Jeff Atwood founded the Coding Horror blog (codinghorror.com) in 2004 to record his thoughts and bits and pieces of his software development experience. Today, the blog has nearly 100,000 visits per day. Readers participate in comments, and various views and wisdom collide passionately there. —— from Douban</p></blockquote><blockquote><p>The writing style of <em>The Programmer’s Apprenticeship</em> is humorous, understanding, and caring; it is suitable for programmers at all stages from novice to veteran, and also suitable for students of computer science and related majors who are about to become programmers. <em>The Programmer’s Apprenticeship</em> can help readers pay more attention to the human nature and humanistic factors of technical work, thereby achieving a successful turning point in their programmer career. —— from Douban</p></blockquote><h1 id="About-Me-amp-amp-Blog"><a href="#About-Me-amp-amp-Blog" class="headerlink" title="About Me &amp;&amp; Blog"></a>About Me &amp;&amp; Blog</h1><p>Below is my personal introduction and related links. I look forward to exchanging ideas with fellow professionals. “When three walk together, one can always be my teacher!”</p><ol><li><a href="https://www.androidperformance.com/en/about/">Blogger Intro</a>: Includes personal WeChat and WeChat group links.</li><li><a href="https://www.androidperformance.com/en/2019/12/01/BlogMap/">Blog Content Navigation</a>: A guide for my blog content.</li><li><a href="https://www.androidperformance.com/en/2018/05/07/Android-performance-optimization-skills-and-tools/">Curated Excellent Blog Articles - Android Performance Optimization Must-Knows</a>: Welcome to recommend projects&#x2F;articles.</li><li><a href="https://www.androidperformance.com/en/2023/12/30/the-performance/">Android Performance Optimization Knowledge Planet</a>: Welcome to join and thank you for your support~</li></ol><blockquote><p><strong>One person can walk faster, a group can walk further</strong></p></blockquote><p><img src="/en/images/WechatIMG581.webp" alt="Scan WeChat QR Code"></p>]]></content>


    <summary type="html">&lt;p&gt;This is the seventh post in the reading notes series for &lt;em&gt;The Programmer’s Apprenticeship: From Good to Great&lt;/em&gt;. The author, Jeff A</summary>


    <category term="Reading Notes" scheme="https://androidperformance.com/en/categories/Reading-Notes/"/>
    
    
    <category term="Reading Notes" scheme="https://androidperformance.com/en/tags/Reading-Notes/"/>
    
    <category term="The Programmer&#39;s Apprenticeship" scheme="https://androidperformance.com/en/tags/The-Programmer-s-Apprenticeship/"/>
    
    <category term="Game Programming" scheme="https://androidperformance.com/en/tags/Game-Programming/"/>
    
  </entry>
  
  <entry>
    <title>The Programmer&#39;s Apprenticeship - 06: All About the Internet</title>
    <link href="https://androidperformance.com/en/2018/09/29/how-to-stop-sucking-and-be-awesome-instead-6/"/>
    <id>https://androidperformance.com/en/2018/09/29/how-to-stop-sucking-and-be-awesome-instead-6/</id>
    <published>2018-09-29T06:34:15.000Z</published>
    <updated>2026-05-10T23:29:51.067Z</updated>
    
    <content type="html"><![CDATA[<p>This is the sixth post in the reading notes series for <em>The Programmer’s Apprenticeship: From Good to Great</em>. The author, Jeff Atwood, is one of the founders of Stack Overflow. His articles cover a wide range of topics. He is a seasoned programmer, manager, and entrepreneur. This book discusses many things beyond programming. Whether you are a junior engineer or a senior engineer, this book is worth reading. As your experience grows, every time you re-read this book, you will gain new insights. Just as the title “From Good to Great” suggests, the author points out the path for you, but whether you can succeed depends on your own cultivation.</p><p>I will excerpt some wonderful remarks from the book and sometimes add my own insights or experiences. The outline of the reading notes is consistent with the outline of the book itself. This is also a method I learned from another source and have been using: “How to Read a Book”. I record it for my own frequent review and for readers’ reference. Below is the <em>The Programmer’s Apprenticeship</em> reading note series:</p><ol><li><a href="https://www.androidperformance.com/en/2018/09/19/how-to-stop-sucking-and-be-awesome-instead-1/">The Programmer’s Apprenticeship - 01: The Art of Fighting Back</a></li><li><a href="https://www.androidperformance.com/en/2018/09/20/how-to-stop-sucking-and-be-awesome-instead-2/">The Programmer’s Apprenticeship - 02: The Way of Programming</a></li><li><a href="https://www.androidperformance.com/en/2018/09/26/how-to-stop-sucking-and-be-awesome-instead-3/">The Programmer’s Apprenticeship - 03: Web Design Principles</a></li><li><a href="https://www.androidperformance.com/en/2018/09/27/how-to-stop-sucking-and-be-awesome-instead-4/">The Programmer’s Apprenticeship - 04: Reflections on Testing</a></li><li><a href="https://www.androidperformance.com/en/2018/09/28/how-to-stop-sucking-and-be-awesome-instead-5/">The Programmer’s Apprenticeship - 05: Know Your Users</a></li><li><a href="https://www.androidperformance.com/en/2018/09/29/how-to-stop-sucking-and-be-awesome-instead-6/">The Programmer’s Apprenticeship - 06: All About the Internet</a></li><li><a href="https://www.androidperformance.com/en/2018/09/30/how-to-stop-sucking-and-be-awesome-instead-7/">The Programmer’s Apprenticeship - 07: Games and Programming</a></li><li><a href="https://www.androidperformance.com/en/2018/10/01/how-to-stop-sucking-and-be-awesome-instead-8/">The Programmer’s Apprenticeship - 08: The Beauty of Reading</a></li></ol><hr><h2 id="Saving-the-Internet-Preserving-All-Memories"><a href="#Saving-the-Internet-Preserving-All-Memories" class="headerlink" title="Saving the Internet, Preserving All Memories"></a>Saving the Internet, Preserving All Memories</h2><p><em>(Based on Jeff Atwood’s <a href="https://blog.codinghorror.com/preserving-the-internet-and-everything-else/">Preserving The Internet… and Everything Else</a>)</em></p><p>In “Preserving Our Digital Pre-History”, Jeff nominated Jason Scott to be our generation’s digital historian in residence. It looks like a few people must have agreed, because in March 2011, he officially became an archivist at the Internet Archive.</p><p>Jason recently invited Jeff to visit the Internet Archive, and he walked away profoundly impressed with their mission. The Internet Archive is the beginning of a cure – the beginning of complete, detailed, accessible, searchable memory for society.</p><p>One of the most immediate benefits is <strong>curing linkrot</strong>. We’ve all experienced the frustration of clicking a link that’s dead. It’s a “digital heart attack.” The Internet Archive’s Wayback Machine allows us to travel back in time to see the web as it was.</p><p>But it goes beyond just web pages. They are archiving <em>everything</em>: books, audio, video, and even software. As Jeff notes:</p><blockquote><p>“If you care about the history of the Internet – and you should, because it’s the history of us – then you should support the Internet Archive.”</p></blockquote><h2 id="The-Importance-of-Net-Neutrality"><a href="#The-Importance-of-Net-Neutrality" class="headerlink" title="The Importance of Net Neutrality"></a>The Importance of Net Neutrality</h2><p><em>(Based on Jeff Atwood’s <a href="https://blog.codinghorror.com/the-importance-of-net-neutrality/">The Importance of Net Neutrality</a>)</em></p><p>Net neutrality is “the most important public policy you’ve probably never heard of.” It refers to the principle that Internet service providers should treat all data on the Internet the same, not discriminating or charging differentially by user, content, website, platform, application, type of attached equipment, or method of communication.</p><p>Jeff admits he didn’t fully understand its importance until reading Lawrence Lessig and Tim Wu. The core argument is simple: <strong>innovation depends on a neutral network.</strong></p><p>If the network owners can pick winners and losers (by throttling traffic or charging extra for fast lanes), then the next Google, Netflix, or Facebook might never get off the ground. The Internet was designed to be a dumb network that moves bits without prejudice. Keeping it that way is essential for the future of free speech and innovation.</p><blockquote><p>“The internet is the first medium that can truly compete with the broadcast monopolies of television and radio. It is the first medium that allows anyone to be a broadcaster. But that freedom is threatened if the network itself is not neutral.”</p></blockquote><h2 id="Copyright-Protection-on-YouTube"><a href="#Copyright-Protection-on-YouTube" class="headerlink" title="Copyright Protection on YouTube"></a>Copyright Protection on YouTube</h2><p><em>(Based on Jeff Atwood’s <a href="https://blog.codinghorror.com/youtube-vs-fair-use/">YouTube vs. Fair Use</a> and <a href="https://blog.codinghorror.com/youtube-the-big-copyright-lie/">YouTube: The Big Copyright Lie</a>)</em></p><p>YouTube is a massive repository of human creativity, but it’s also a battlefield for copyright. Jeff points out the “Big Copyright Lie” of YouTube: the vast majority of its most popular content is <em>not</em> 100% original. It’s remixes, clips, and mashups of existing copyrighted material.</p><p>This brings us to the concept of <strong>Fair Use</strong>. Fair use is a legal doctrine that permits limited use of copyrighted material without acquiring permission from the rights holders. It includes commentary, criticism, news reporting, research, teaching, or scholarship.</p><p>However, YouTube’s automated Content ID system often ignores Fair Use. It flags content based on digital fingerprints, regardless of context. This creates a “guilty until proven innocent” system where creators have to fight to get their lawful content reinstated.</p><p>Jeff argues that we need a better balance. We need to protect the rights of copyright holders, but we also need to protect the rights of creators to build upon culture. The current system is heavily weighted in favor of big media companies, often at the expense of individual creativity.</p><blockquote><p>“Culture is a remix. Everything is a remix. If we can’t build on what came before us, we stop progressing.”</p></blockquote><hr><blockquote><p><em>The Programmer’s Apprenticeship</em> (or <em>Building a Career in Software</em>) is a compilation of the best articles from the Coding Horror blog. The book is divided into 8 chapters, covering topics such as time management, programming methods, web design, testing, user needs, the Internet, game programming, and technical reading. The topics selected by the author are all pain points in a programmer’s career. Many articles have high click-through rates and reply rates on blogs and the Internet. —— from Douban</p></blockquote><blockquote><p>Jeff Atwood founded the Coding Horror blog (codinghorror.com) in 2004 to record his thoughts and bits and pieces of his software development experience. Today, the blog has nearly 100,000 visits per day. Readers participate in comments, and various views and wisdom collide passionately there. —— from Douban</p></blockquote><blockquote><p>The writing style of <em>The Programmer’s Apprenticeship</em> is humorous, understanding, and caring; it is suitable for programmers at all stages from novice to veteran, and also suitable for students of computer science and related majors who are about to become programmers. <em>The Programmer’s Apprenticeship</em> can help readers pay more attention to the human nature and humanistic factors of technical work, thereby achieving a successful turning point in their programmer career. —— from Douban</p></blockquote><h1 id="About-Me-amp-amp-Blog"><a href="#About-Me-amp-amp-Blog" class="headerlink" title="About Me &amp;&amp; Blog"></a>About Me &amp;&amp; Blog</h1><p>Below is my personal introduction and related links. I look forward to exchanging ideas with fellow professionals. “When three walk together, one can always be my teacher!”</p><ol><li><a href="https://www.androidperformance.com/en/about/">Blogger Intro</a>: Includes personal WeChat and WeChat group links.</li><li><a href="https://www.androidperformance.com/en/2019/12/01/BlogMap/">Blog Content Navigation</a>: A guide for my blog content.</li><li><a href="https://www.androidperformance.com/en/2018/05/07/Android-performance-optimization-skills-and-tools/">Curated Excellent Blog Articles - Android Performance Optimization Must-Knows</a>: Welcome to recommend projects&#x2F;articles.</li><li><a href="https://www.androidperformance.com/en/2023/12/30/the-performance/">Android Performance Optimization Knowledge Planet</a>: Welcome to join and thank you for your support~</li></ol><blockquote><p><strong>One person can walk faster, a group can walk further</strong></p></blockquote><p><img src="/en/images/WechatIMG581.webp" alt="Scan WeChat QR Code"></p>]]></content>


    <summary type="html">&lt;p&gt;This is the sixth post in the reading notes series for &lt;em&gt;The Programmer’s Apprenticeship: From Good to Great&lt;/em&gt;. The author, Jeff Atw</summary>


    <category term="Reading Notes" scheme="https://androidperformance.com/en/categories/Reading-Notes/"/>
    
    
    <category term="Reading Notes" scheme="https://androidperformance.com/en/tags/Reading-Notes/"/>
    
    <category term="The Programmer&#39;s Apprenticeship" scheme="https://androidperformance.com/en/tags/The-Programmer-s-Apprenticeship/"/>
    
    <category term="Internet" scheme="https://androidperformance.com/en/tags/Internet/"/>
    
  </entry>
  
  <entry>
    <title>The Programmer&#39;s Apprenticeship - 05: Know Your Users</title>
    <link href="https://androidperformance.com/en/2018/09/28/how-to-stop-sucking-and-be-awesome-instead-5/"/>
    <id>https://androidperformance.com/en/2018/09/28/how-to-stop-sucking-and-be-awesome-instead-5/</id>
    <published>2018-09-28T03:57:02.000Z</published>
    <updated>2026-05-10T23:29:51.067Z</updated>
    
    <content type="html"><![CDATA[<p>This is the fifth post in the reading notes series for <em>The Programmer’s Apprenticeship: From Good to Great</em>. The author, Jeff Atwood, is one of the founders of Stack Overflow. His articles cover a wide range of topics. He is a seasoned programmer, manager, and entrepreneur. This book discusses many things beyond programming. Whether you are a junior engineer or a senior engineer, this book is worth reading. As your experience grows, every time you re-read this book, you will gain new insights. Just as the title “From Good to Great” suggests, the author points out the path for you, but whether you can succeed depends on your own cultivation.</p><p>I will excerpt some wonderful remarks from the book and sometimes add my own insights or experiences. The outline of the reading notes is consistent with the outline of the book itself. This is also a method I learned from another source and have been using: “How to Read a Book”. I record it for my own frequent review and for readers’ reference. Below is the <em>The Programmer’s Apprenticeship</em> reading note series:</p><ol><li><a href="https://www.androidperformance.com/en/2018/09/19/how-to-stop-sucking-and-be-awesome-instead-1/">The Programmer’s Apprenticeship - 01: The Art of Fighting Back</a></li><li><a href="https://www.androidperformance.com/en/2018/09/20/how-to-stop-sucking-and-be-awesome-instead-2/">The Programmer’s Apprenticeship - 02: The Way of Programming</a></li><li><a href="https://www.androidperformance.com/en/2018/09/26/how-to-stop-sucking-and-be-awesome-instead-3/">The Programmer’s Apprenticeship - 03: Web Design Principles</a></li><li><a href="https://www.androidperformance.com/en/2018/09/27/how-to-stop-sucking-and-be-awesome-instead-4/">The Programmer’s Apprenticeship - 04: Reflections on Testing</a></li><li><a href="https://www.androidperformance.com/en/2018/09/28/how-to-stop-sucking-and-be-awesome-instead-5/">The Programmer’s Apprenticeship - 05: Know Your Users</a></li><li><a href="https://www.androidperformance.com/en/2018/09/29/how-to-stop-sucking-and-be-awesome-instead-6/">The Programmer’s Apprenticeship - 06: All About the Internet</a></li><li><a href="https://www.androidperformance.com/en/2018/09/30/how-to-stop-sucking-and-be-awesome-instead-7/">The Programmer’s Apprenticeship - 07: Games and Programming</a></li><li><a href="https://www.androidperformance.com/en/2018/10/01/how-to-stop-sucking-and-be-awesome-instead-8/">The Programmer’s Apprenticeship - 08: The Beauty of Reading</a></li></ol><hr><h2 id="The-Controversy-of-“homo-logicus”"><a href="#The-Controversy-of-“homo-logicus”" class="headerlink" title="The Controversy of “homo logicus”"></a>The Controversy of “homo logicus”</h2><p>Among all the “bad habits” of software developers, the most serious one is probably: <strong>We think we are typical users. However, what most developers don’t realize is that we are actually outliers. We are by no means ordinary people — we are margin dwellers.</strong></p><p>The author mentions the concepts of “homo logicus” (Logical Man) and “homo sapiens” (Modern Wise Man&#x2F;Ordinary User):</p><ul><li><p><strong>Logical Man</strong>: Logical people desire to control things that interest them, and those things are complex deterministic systems. Humans are complex, but they are not like machines; their behavior is not logical or predictable. The best machine is digital because it can become most complex and sophisticated, and can be easily changed by programmers.</p></li><li><p><strong>Homo Sapiens</strong>: Ordinary users who just want to use things simply, not control them.</p></li></ul><p>For logical people, control is their goal, and complexity is the price they are willing to pay. For ordinary people, simplicity is their goal, and losing control is the price they are willing to pay. Logical people are driven by an irresistible cognitive desire for how things work, while homo sapiens desire success.</p><p>Alan Cooper listed some typical characteristics of logical people. You can see if you fit:</p><ol><li>Willing to sacrifice simplicity for control.</li><li>Willing to fail in exchange for cognition.</li><li>Do not let go of any possibility.</li><li>Behave like sports students (treating technology as a competitive sport).</li></ol><p>Another sentence software engineers need to remember: Anyone can make a complex software that no one will use; it’s not hard! Making software simple and easy to use is the real skill. You must stop thinking like a logical person and learn to think like a homo sapiens.</p><h2 id="Ivory-Tower-Development"><a href="#Ivory-Tower-Development" class="headerlink" title="Ivory Tower Development"></a>Ivory Tower Development</h2><p>Ivory tower development refers to: development teams locked in a “high tower” all year round, bent on making magical software. Because of the lack of strong evidence, developers assume everyone else is a developer, which is dangerous.</p><p>The author suggests: Throughout the project cycle, try your best to expose your developers to users: attend user meetings, participate in usability testing and acceptance testing, communicate with users, and analyze user data and behavior.</p><p>The “mutual trust relationship” proposed by Eric: When people buy software from you, they have many expectations for the present and the future:</p><ol><li>They trust that your product works properly on their machines.</li><li>They trust that if they encounter problems, you will help them.</li><li>They trust that you will persistently improve the product.</li><li>They trust that you will provide them with improved versions at a fair and reasonable price.</li><li>They trust that your company will not go bankrupt in a short time.</li></ol><h2 id="Consequences-of-Letting-Programmers-Design-Interfaces"><a href="#Consequences-of-Letting-Programmers-Design-Interfaces" class="headerlink" title="Consequences of Letting Programmers Design Interfaces"></a>Consequences of Letting Programmers Design Interfaces</h2><p>Excellent programmers know themselves well and know what they can do and what they cannot do. They either copy existing excellent designs directly; or stick to coding and leave the interface design work to other experts.</p><p>If you are a friend, don’t let your friend create an interface that only programmers would use.</p><h2 id="Protect-“The-Intermediates”"><a href="#Protect-“The-Intermediates”" class="headerlink" title="Protect “The Intermediates”"></a>Protect “The Intermediates”</h2><p>Experts and novices are only a small part of the population. Most users with similar levels belong to the “intermediates.” You should value these <strong>intermediates</strong>. The number of intermediate users is so huge and dominant that you can give up on novice and expert users if needed.</p><p>To cater to the few novices and experts, you spend a lot of time in the software development process, ultimately just making the product worse, and neglecting the core user group.</p><h2 id="Every-User-Lies"><a href="#Every-User-Lies" class="headerlink" title="Every User Lies"></a>Every User Lies</h2><p>Users’ wishes and reality are almost always contradictory. We advocate observing users’ actual behavior rather than listening to their narration of what they did, because of this deviation. Observation is a powerful skill. Learn to judge by people’s behavior, not take what they say as truth.</p><p>The author mentioned the concept of “active user paradox”: The active user paradox is a contradiction because if users know a little more about the system, it will save time in the long run. But in the real world, people’s behavior patterns are not like that. Therefore, we cannot tolerate engineers developing products for idealized users, because people in reality are irrational. We must design products based on users’ actual behavior patterns.</p><p>Every user lies. Expecting to ask users if they like your software – they will certainly say they like it, because saying to your face how terrible your software is would be rude – you should follow Gregory House: Observe whether they use your software and how they use it. Design your software based on behavioral data, not on the “lies” users tell (no matter how well-intentioned those lies are).</p><h2 id="Don’t-Make-Product-Launch-the-Goal"><a href="#Don’t-Make-Product-Launch-the-Goal" class="headerlink" title="Don’t Make Product Launch the Goal"></a>Don’t Make Product Launch the Goal</h2><p>A standard for measuring whether a programmer is successful is to see how much code they have released, but just releasing is not enough. <strong>How many users are using your software is the ultimate goal of measuring success.</strong></p><p>Smart software developers know that their work is far more than writing code and releasing products; their work is to develop software that people really want to use. This certainly includes coding, but there are also a large number of other global things, such as writing technical documentation, interaction design, cultivating community users, and even product vision. These are crucial to the overall success of the software. If you don’t even understand this, then what kind of code you wrote doesn’t matter.</p><h2 id="Don’t-Ask-Observe"><a href="#Don’t-Ask-Observe" class="headerlink" title="Don’t Ask, Observe"></a>Don’t Ask, Observe</h2><p>What users say they want to do is often vastly different from what they actually do. From a usability perspective, asking users what they want is futile for this reason – you must observe what they are doing. In terms of usability, you cannot act on guesses; you must observe how users use your software. There is no other way.</p><p>When designing, wouldn’t it be more reasonable if decisions could be made based on how users actually use your software? Whether you are observing users in a “low-fidelity usability test” or collecting user behavior data and observing users invisibly, the purpose is the same: Don’t ask, observe.</p><h2 id="Is-More-Features-Better"><a href="#Is-More-Features-Better" class="headerlink" title="Is More Features Better?"></a>Is More Features Better?</h2><p>Software relies on new features to drive sales, but over time, those added features are precisely the culprits that make the software worse. That subtle “feature creep” that is slowly breeding – it will destroy people’s favorite software.</p><p>A bad trend is: software companies set the priority of fixing bugs in existing software relatively low, while regarding the development of new features for the next version as particularly important. The result is that the quality of the software goes from bad to worse. (Like Flyme and MIUI).</p><p><strong>Perhaps we shouldn’t blindly measure software as a pile of features</strong> – People always have a “capacity” limit, just like at a buffet, can you eat all that food? We should be result-oriented, measuring the productivity or effectiveness of software in helping us complete tasks.</p><h2 id="Living-Things-Will-Do-As-They-Please"><a href="#Living-Things-Will-Do-As-They-Please" class="headerlink" title="Living Things Will Do As They Please"></a>Living Things Will Do As They Please</h2><p>The author believes that social engineering is at best an inexact science, even in the cyberspace prototype. Someone once said, “In the most carefully prepared experiment,” even if conditions are strictly controlled, living things will do as they please.</p><p><strong>When building social software, people are the root of all problems, but solving problems ultimately depends on those people.</strong></p><h2 id="For-a-Little-Ribbon"><a href="#For-a-Little-Ribbon" class="headerlink" title="For a Little Ribbon"></a>For a Little Ribbon</h2><p>The author summarized his work at Stack Exchange: What I do, what I am best at, and what I love most and more than anything else in the world, is <strong>designing large massive multiplayer games for people who like to write a few paragraphs to each other</strong>. I guide their obsession to something positive; they can learn from it and create some reusable beautiful works for the whole world — this is still what I desire, because I still retain a steady stream of obsession.</p><h2 id="Building-Social-Software-for-Anti-Social-People"><a href="#Building-Social-Software-for-Anti-Social-People" class="headerlink" title="Building Social Software for Anti-Social People"></a>Building Social Software for Anti-Social People</h2><p>The author proposed “10 Terrible Ideas”:</p><ol><li>Fundamentally lower the barrier to participation.</li><li>Trust users.</li><li>Life is the world’s largest massive multiplayer online role-playing game.</li><li>Bad things always happen.</li><li>Preference over money.</li><li>Rules can be fun and social.</li><li>All modern websites are designed like games.</li><li>Thoughtful game design fosters sustainable communities.</li><li>The community’s point of view is not necessarily right.</li><li>Some mediation is needed.</li></ol><p><strong>If you want to learn something online, you must design your software well, guide people’s innate social group impulses, and refocus them on valuable things.</strong></p><hr><blockquote><p><em>The Programmer’s Apprenticeship</em> (or <em>Building a Career in Software</em>) is a compilation of the best articles from the Coding Horror blog. The book is divided into 8 chapters, covering topics such as time management, programming methods, web design, testing, user needs, the Internet, game programming, and technical reading. The topics selected by the author are all pain points in a programmer’s career. Many articles have high click-through rates and reply rates on blogs and the Internet. —— from Douban</p></blockquote><blockquote><p>Jeff Atwood founded the Coding Horror blog (codinghorror.com) in 2004 to record his thoughts and bits and pieces of his software development experience. Today, the blog has nearly 100,000 visits per day. Readers participate in comments, and various views and wisdom collide passionately there. —— from Douban</p></blockquote><blockquote><p>The writing style of <em>The Programmer’s Apprenticeship</em> is humorous, understanding, and caring; it is suitable for programmers at all stages from novice to veteran, and also suitable for students of computer science and related majors who are about to become programmers. <em>The Programmer’s Apprenticeship</em> can help readers pay more attention to the human nature and humanistic factors of technical work, thereby achieving a successful turning point in their programmer career. —— from Douban</p></blockquote><h1 id="About-Me-amp-amp-Blog"><a href="#About-Me-amp-amp-Blog" class="headerlink" title="About Me &amp;&amp; Blog"></a>About Me &amp;&amp; Blog</h1><p>Below is my personal introduction and related links. I look forward to exchanging ideas with fellow professionals. “When three walk together, one can always be my teacher!”</p><ol><li><a href="https://www.androidperformance.com/en/about/">Blogger Intro</a>: Includes personal WeChat and WeChat group links.</li><li><a href="https://www.androidperformance.com/en/2019/12/01/BlogMap/">Blog Content Navigation</a>: A guide for my blog content.</li><li><a href="https://www.androidperformance.com/en/2018/05/07/Android-performance-optimization-skills-and-tools/">Curated Excellent Blog Articles - Android Performance Optimization Must-Knows</a>: Welcome to recommend projects&#x2F;articles.</li><li><a href="https://www.androidperformance.com/en/2023/12/30/the-performance/">Android Performance Optimization Knowledge Planet</a>: Welcome to join and thank you for your support~</li></ol><blockquote><p><strong>One person can walk faster, a group can walk further</strong></p></blockquote><p><img src="/en/images/WechatIMG581.webp" alt="Scan WeChat QR Code"></p>]]></content>


    <summary type="html">&lt;p&gt;This is the fifth post in the reading notes series for &lt;em&gt;The Programmer’s Apprenticeship: From Good to Great&lt;/em&gt;. The author, Jeff Atw</summary>


    <category term="Reading Notes" scheme="https://androidperformance.com/en/categories/Reading-Notes/"/>
    
    
    <category term="Reading Notes" scheme="https://androidperformance.com/en/tags/Reading-Notes/"/>
    
    <category term="The Programmer&#39;s Apprenticeship" scheme="https://androidperformance.com/en/tags/The-Programmer-s-Apprenticeship/"/>
    
    <category term="User Experience" scheme="https://androidperformance.com/en/tags/User-Experience/"/>
    
  </entry>
  
  <entry>
    <title>The Programmer&#39;s Apprenticeship - 04: Reflections on Testing</title>
    <link href="https://androidperformance.com/en/2018/09/27/how-to-stop-sucking-and-be-awesome-instead-4/"/>
    <id>https://androidperformance.com/en/2018/09/27/how-to-stop-sucking-and-be-awesome-instead-4/</id>
    <published>2018-09-27T00:50:32.000Z</published>
    <updated>2026-05-10T23:29:51.067Z</updated>
    
    <content type="html"><![CDATA[<p>This is the fourth post in the reading notes series for <em>The Programmer’s Apprenticeship: From Good to Great</em>. The author, Jeff Atwood, is one of the founders of Stack Overflow. His articles cover a wide range of topics. He is a seasoned programmer, manager, and entrepreneur. This book discusses many things beyond programming. Whether you are a junior engineer or a senior engineer, this book is worth reading. As your experience grows, every time you re-read this book, you will gain new insights. Just as the title “From Good to Great” suggests, the author points out the path for you, but whether you can succeed depends on your own cultivation.</p><p>I will excerpt some wonderful remarks from the book and sometimes add my own insights or experiences. The outline of the reading notes is consistent with the outline of the book itself. This is also a method I learned from another source and have been using: “How to Read a Book”. I record it for my own frequent review and for readers’ reference. Below is the <em>The Programmer’s Apprenticeship</em> reading note series:</p><ol><li><a href="https://www.androidperformance.com/en/2018/09/19/how-to-stop-sucking-and-be-awesome-instead-1/">The Programmer’s Apprenticeship - 01: The Art of Fighting Back</a></li><li><a href="https://www.androidperformance.com/en/2018/09/20/how-to-stop-sucking-and-be-awesome-instead-2/">The Programmer’s Apprenticeship - 02: The Way of Programming</a></li><li><a href="https://www.androidperformance.com/en/2018/09/26/how-to-stop-sucking-and-be-awesome-instead-3/">The Programmer’s Apprenticeship - 03: Web Design Principles</a></li><li><a href="https://www.androidperformance.com/en/2018/09/27/how-to-stop-sucking-and-be-awesome-instead-4/">The Programmer’s Apprenticeship - 04: Reflections on Testing</a></li><li><a href="https://www.androidperformance.com/en/2018/09/28/how-to-stop-sucking-and-be-awesome-instead-5/">The Programmer’s Apprenticeship - 05: Know Your Users</a></li><li><a href="https://www.androidperformance.com/en/2018/09/29/how-to-stop-sucking-and-be-awesome-instead-6/">The Programmer’s Apprenticeship - 06: All About the Internet</a></li><li><a href="https://www.androidperformance.com/en/2018/09/30/how-to-stop-sucking-and-be-awesome-instead-7/">The Programmer’s Apprenticeship - 07: Games and Programming</a></li><li><a href="https://www.androidperformance.com/en/2018/10/01/how-to-stop-sucking-and-be-awesome-instead-8/">The Programmer’s Apprenticeship - 08: The Beauty of Reading</a></li></ol><hr><h2 id="Unit-Testing-Is-Necessary"><a href="#Unit-Testing-Is-Necessary" class="headerlink" title="Unit Testing Is Necessary"></a>Unit Testing Is Necessary</h2><p>The real value of unit testing is that it forces you to stop and think about testing. Most developers don’t test! They just input some numbers at random, click a few buttons, and if no unhandled exceptions are found during this process, they feel the code is good enough to be delivered to the testing team.</p><p>Unit testing forces you to think about a series of difficult but unavoidable questions for the code you just wrote:</p><ol><li>How should I test this code?</li><li>What kind of tests should I perform?</li><li>What is the normal situation?</li><li>What are the possible exceptions?</li><li>How many external dependencies do I have?</li><li>What system failures might I encounter?</li></ol><h2 id="Sometimes-It’s-a-Hardware-Problem"><a href="#Sometimes-It’s-a-Hardware-Problem" class="headerlink" title="Sometimes It’s a Hardware Problem"></a>Sometimes It’s a Hardware Problem</h2><p>In this section, the author mainly gave an example they actually encountered, a bug caused by hardware. Investigating directly was extremely difficult, but if the right tools were used, it would be twice the result with half the effort.</p><p>Although software is unreliable, we can’t always point the finger at software. Sometimes, what you are facing is indeed a hardware problem.</p><h2 id="Exception-Driven-Development"><a href="#Exception-Driven-Development" class="headerlink" title="Exception-Driven Development"></a>Exception-Driven Development</h2><p>As a developer, you shouldn’t let users point out errors. You should be more familiar with your system than your users. So you need to establish an exception and error reporting mechanism. You need to focus on handling all errors in one place. This place is something all developers in your team are very familiar with and come into contact with every day. For example, Stack Overflow uses ELMAH.</p><p>One thought on “Test-Driven Development” is the return on time investment: <strong>If you fix a bug that real users will never encounter, what is the value of your fix?</strong></p><p>The author suggests everyone use “Exception-Driven Development”:</p><ol><li>Release your software and let as many users as possible use it.</li><li>Then focus on studying the error logs they generate, use those exception logs to find the root cause of the problem, and focus on the problematic areas in your code.</li><li>Re-architect and refactor the code to eliminate the 3 most serious problems.</li><li>Iterate quickly, deploy, and repeat.</li></ol><p>This data-driven feedback mechanism is very effective. After a few iterations, your program will be very stable and solid as a rock.</p><hr><blockquote><p><em>The Programmer’s Apprenticeship</em> (or <em>Building a Career in Software</em>) is a compilation of the best articles from the Coding Horror blog. The book is divided into 8 chapters, covering topics such as time management, programming methods, web design, testing, user needs, the Internet, game programming, and technical reading. The topics selected by the author are all pain points in a programmer’s career. Many articles have high click-through rates and reply rates on blogs and the Internet. —— from Douban</p></blockquote><blockquote><p>Jeff Atwood founded the Coding Horror blog (codinghorror.com) in 2004 to record his thoughts and bits and pieces of his software development experience. Today, the blog has nearly 100,000 visits per day. Readers participate in comments, and various views and wisdom collide passionately there. —— from Douban</p></blockquote><blockquote><p>The writing style of <em>The Programmer’s Apprenticeship</em> is humorous, understanding, and caring; it is suitable for programmers at all stages from novice to veteran, and also suitable for students of computer science and related majors who are about to become programmers. <em>The Programmer’s Apprenticeship</em> can help readers pay more attention to the human nature and humanistic factors of technical work, thereby achieving a successful turning point in their programmer career. —— from Douban</p></blockquote><h1 id="About-Me-amp-amp-Blog"><a href="#About-Me-amp-amp-Blog" class="headerlink" title="About Me &amp;&amp; Blog"></a>About Me &amp;&amp; Blog</h1><p>Below is my personal introduction and related links. I look forward to exchanging ideas with fellow professionals. “When three walk together, one can always be my teacher!”</p><ol><li><a href="https://www.androidperformance.com/en/about/">Blogger Intro</a>: Includes personal WeChat and WeChat group links.</li><li><a href="https://www.androidperformance.com/en/2019/12/01/BlogMap/">Blog Content Navigation</a>: A guide for my blog content.</li><li><a href="https://www.androidperformance.com/en/2018/05/07/Android-performance-optimization-skills-and-tools/">Curated Excellent Blog Articles - Android Performance Optimization Must-Knows</a>: Welcome to recommend projects&#x2F;articles.</li><li><a href="https://www.androidperformance.com/en/2023/12/30/the-performance/">Android Performance Optimization Knowledge Planet</a>: Welcome to join and thank you for your support~</li></ol><blockquote><p><strong>One person can walk faster, a group can walk further</strong></p></blockquote><p><img src="/en/images/WechatIMG581.webp" alt="Scan WeChat QR Code"></p>]]></content>


    <summary type="html">&lt;p&gt;This is the fourth post in the reading notes series for &lt;em&gt;The Programmer’s Apprenticeship: From Good to Great&lt;/em&gt;. The author, Jeff At</summary>


    <category term="Reading Notes" scheme="https://androidperformance.com/en/categories/Reading-Notes/"/>
    
    
    <category term="Reading Notes" scheme="https://androidperformance.com/en/tags/Reading-Notes/"/>
    
    <category term="The Programmer&#39;s Apprenticeship" scheme="https://androidperformance.com/en/tags/The-Programmer-s-Apprenticeship/"/>
    
    <category term="Testing" scheme="https://androidperformance.com/en/tags/Testing/"/>
    
  </entry>
  
  <entry>
    <title>The Programmer&#39;s Apprenticeship - 03: Web Design Principles</title>
    <link href="https://androidperformance.com/en/2018/09/26/how-to-stop-sucking-and-be-awesome-instead-3/"/>
    <id>https://androidperformance.com/en/2018/09/26/how-to-stop-sucking-and-be-awesome-instead-3/</id>
    <published>2018-09-26T07:39:25.000Z</published>
    <updated>2026-05-10T23:29:51.067Z</updated>
    
    <content type="html"><![CDATA[<p>This is the third post in the reading notes series for <em>The Programmer’s Apprenticeship: From Good to Great</em>. The author, Jeff Atwood, is one of the founders of Stack Overflow. His articles cover a wide range of topics. He is a seasoned programmer, manager, and entrepreneur. This book discusses many things beyond programming. Whether you are a junior engineer or a senior engineer, this book is worth reading. As your experience grows, every time you re-read this book, you will gain new insights. Just as the title “From Good to Great” suggests, the author points out the path for you, but whether you can succeed depends on your own cultivation.</p><p>I will excerpt some wonderful remarks from the book and sometimes add my own insights or experiences. The outline of the reading notes is consistent with the outline of the book itself. This is also a method I learned from another source and have been using: “How to Read a Book”. I record it for my own frequent review and for readers’ reference. Below is the <em>The Programmer’s Apprenticeship</em> reading note series:</p><ol><li><a href="https://www.androidperformance.com/en/2018/09/19/how-to-stop-sucking-and-be-awesome-instead-1/">The Programmer’s Apprenticeship - 01: The Art of Fighting Back</a></li><li><a href="https://www.androidperformance.com/en/2018/09/20/how-to-stop-sucking-and-be-awesome-instead-2/">The Programmer’s Apprenticeship - 02: The Way of Programming</a></li><li><a href="https://www.androidperformance.com/en/2018/09/26/how-to-stop-sucking-and-be-awesome-instead-3/">The Programmer’s Apprenticeship - 03: Web Design Principles</a></li><li><a href="https://www.androidperformance.com/en/2018/09/27/how-to-stop-sucking-and-be-awesome-instead-4/">The Programmer’s Apprenticeship - 04: Reflections on Testing</a></li><li><a href="https://www.androidperformance.com/en/2018/09/28/how-to-stop-sucking-and-be-awesome-instead-5/">The Programmer’s Apprenticeship - 05: Know Your Users</a></li><li><a href="https://www.androidperformance.com/en/2018/09/29/how-to-stop-sucking-and-be-awesome-instead-6/">The Programmer’s Apprenticeship - 06: All About the Internet</a></li><li><a href="https://www.androidperformance.com/en/2018/09/30/how-to-stop-sucking-and-be-awesome-instead-7/">The Programmer’s Apprenticeship - 07: Games and Programming</a></li><li><a href="https://www.androidperformance.com/en/2018/10/01/how-to-stop-sucking-and-be-awesome-instead-8/">The Programmer’s Apprenticeship - 08: The Beauty of Reading</a></li></ol><hr><h2 id="Criteria-for-Judging-Websites"><a href="#Criteria-for-Judging-Websites" class="headerlink" title="Criteria for Judging Websites"></a>Criteria for Judging Websites</h2><p>When the author was a judge for websites, he only had 30 seconds for each participating website. Regarding this: “Judging in 30 seconds is completely unfair, but it accurately reflects the situation in the real world.”</p><p>The author offered some suggestions to the contestants. Your website homepage needs to give people a “wow” feeling at first sight:</p><ol><li>Loading speed must be fast, especially in the mobile Internet era. If it exceeds 1s, users will lose patience.</li><li>What on earth is this? Don’t leave incoming users in a fog. Let users know what this webpage is for as soon as they enter.</li><li>Show me an example.</li><li>Clearly tell me what to do, and clear away obstacles.</li><li>Embrace your audience, even if it means excluding other audiences.</li></ol><p>In any Web application, the basic sketch of the homepage design is the first thing you should do, because it is the crucial initial design draft and your vision statement.</p><h2 id="Pursue-Simplicity"><a href="#Pursue-Simplicity" class="headerlink" title="Pursue Simplicity"></a>Pursue Simplicity</h2><p><strong>Pursuing simplicity lies more in carrying simple through to the end.</strong> Comparing the Yahoo homepage and Google homepage over the years, Google has achieved very restrained simplicity on the homepage, while Yahoo’s homepage has become increasingly complex with more and more information. Looking at it now, this is simply a “disaster” for portal websites.</p><p>Google’s simplicity puts complex things behind the scenes, instead of dumping them all on the user.</p><h2 id="Will-Apps-Replace-Websites"><a href="#Will-Apps-Replace-Websites" class="headerlink" title="Will Apps Replace Websites?"></a>Will Apps Replace Websites?</h2><p>We should start with simple design and scale up proportionately when necessary, rather than making things complicated from the start and then being forced to shrink. This is similar to the current Mobile-First design philosophy.</p><p>Why are apps better than websites?</p><ol><li>Faster running speed</li><li>Use simple native UI controls</li><li>Better use of screen space</li><li>More suitable for mobile environments, even offline situations</li></ol><p>Why are websites better than apps?</p><ol><li>Websites can run on any device’s browser</li><li>Websites do not need installation</li><li>Websites do not need manual upgrades</li><li>Websites provide a unified user experience</li></ol><p>From the comparison above, essentially each has its pros and cons. However, looking at subsequent developments, webpages and Apps will become closer and closer. Their development languages and running environments are becoming more consistent. Various cross-platform frameworks make the development of Apps and webpages no longer hugely different. With the popularity of mobile Internet, any App and webpage will be developed from a mobile-first perspective.</p><p><strong>The boundary between webpages and Apps will be very blurred, and finally unified.</strong></p><h2 id="Remember-Not-to-Stick-to-Conventions"><a href="#Remember-Not-to-Stick-to-Conventions" class="headerlink" title="Remember Not to Stick to Conventions"></a>Remember Not to Stick to Conventions</h2><p>We need to adopt the “right” way of doing things, not the “standard” way:</p><ol><li>Fully understand the current specification and the reasons for its formation (Know what and also know why).</li><li>Deviation from this specification requires justification.</li><li>Collect user usage data during the experiment (A&#x2F;B Test).</li><li>Make decisions based on data.</li></ol><p><strong>Doing Android system optimization is best done following the steps above: first understand the code logic, then understand why the code is written this way, then think about how to optimize. During this period, you need to find bottlenecks, make changes, get user data, and compare user data to choose the optimal solution.</strong></p><h2 id="Weird-Single-Button-Design"><a href="#Weird-Single-Button-Design" class="headerlink" title="Weird Single-Button Design"></a>Weird Single-Button Design</h2><p>The iPhone’s single Home button setting has always been controversial because it makes the “back” operation more complicated. It’s okay on machines with smaller screens where you can use gestures, but on large-screen machines, backing up to the previous page is very inconvenient, and you have to use another hand to operate.</p><h2 id="Usability-Is-Not-Just-Highbrow-Art"><a href="#Usability-Is-Not-Just-Highbrow-Art" class="headerlink" title="Usability Is Not Just Highbrow Art"></a>Usability Is Not Just Highbrow Art</h2><p>If no one in your project cares about usability, then remember that the project is doomed to fail.</p><ol><li>Usability testing is one of the most effective measures people can take to improve a website.</li><li>Since most organizations have the financial resources to hire professionals to engage in routine testing work, everyone should learn to do usability testing themselves.</li></ol><p>The author recommends a book: <em>Web Usability involves Eye Tracking</em> (presumably referring to something like <em>Eye Tracking Web Usability</em>). Those interested can buy a copy to read.</p><h2 id="The-Other-Side-of-Fitts’s-Law"><a href="#The-Other-Side-of-Fitts’s-Law" class="headerlink" title="The Other Side of Fitts’s Law"></a>The Other Side of Fitts’s Law</h2><p>Fitts’s Law: The larger an object is and the closer it is to the cursor, the easier it is to click.</p><p>The author summarized the core idea of an article “Visualizing Fitts’s Law”:</p><ol><li><strong>Place commonly used UI elements at the edge of the screen, because the cursor automatically stops at the edge of the screen, so those UI elements will be easier to click.</strong></li><li><strong>Make the clickable area as large as possible. The larger the target, the easier it is to click.</strong></li></ol><p>Similarly, if there are necessary buttons that you do not want users to click, then making them smaller is never wrong. <strong>Make infrequently used or dangerous UI elements difficult to click.</strong></p><h2 id="Usability-and-Learnability"><a href="#Usability-and-Learnability" class="headerlink" title="Usability and Learnability"></a>Usability and Learnability</h2><p>Website writing should adopt the “inverted pyramid” style: <strong>Tell the reader the conclusion at the beginning of the article, then write the most important supporting information, and finally introduce the relevant background.</strong></p><p><strong>Undoubtedly, you should try to put the most important information at the top, whether you are making a webpage, writing a program, writing an email, or making a resume, etc.</strong></p><p>In addition, the author recommended a book <em>UI Design Guidelines for Programmers</em> (possibly <em>User Interface Design for Programmers</em> by Joel Spolsky). Those interested can take a look.</p><h2 id="Just-One-More"><a href="#Just-One-More" class="headerlink" title="Just One More"></a>Just One More</h2><p><strong>If you want to add another UI element, please be sure that the UI element you add is not the last straw that breaks the camel’s back.</strong></p><h2 id="Dare-to-Say-No"><a href="#Dare-to-Say-No" class="headerlink" title="Dare to Say No"></a>Dare to Say No</h2><p><strong>Innovation is not about accepting everything, but about saying no to everything except key features.</strong></p><h2 id="User-Interface-is-Hard"><a href="#User-Interface-is-Hard" class="headerlink" title="User Interface is Hard"></a>User Interface is Hard</h2><p>This primarily talks about how when programmers create user interfaces, they are often rough and not user-friendly. However, from current developments, user interface design is no longer that difficult, and various beautiful interface frameworks can be applied very easily.</p><hr><blockquote><p><em>The Programmer’s Apprenticeship</em> (or <em>Building a Career in Software</em>) is a compilation of the best articles from the Coding Horror blog. The book is divided into 8 chapters, covering topics such as time management, programming methods, web design, testing, user needs, the Internet, game programming, and technical reading. The topics selected by the author are all pain points in a programmer’s career. Many articles have high click-through rates and reply rates on blogs and the Internet. —— from Douban</p></blockquote><blockquote><p>Jeff Atwood founded the Coding Horror blog (codinghorror.com) in 2004 to record his thoughts and bits and pieces of his software development experience. Today, the blog has nearly 100,000 visits per day. Readers participate in comments, and various views and wisdom collide passionately there. —— from Douban</p></blockquote><blockquote><p>The writing style of <em>The Programmer’s Apprenticeship</em> is humorous, understanding, and caring; it is suitable for programmers at all stages from novice to veteran, and also suitable for students of computer science and related majors who are about to become programmers. <em>The Programmer’s Apprenticeship</em> can help readers pay more attention to the human nature and humanistic factors of technical work, thereby achieving a successful turning point in their programmer career. —— from Douban</p></blockquote><h1 id="About-Me-amp-amp-Blog"><a href="#About-Me-amp-amp-Blog" class="headerlink" title="About Me &amp;&amp; Blog"></a>About Me &amp;&amp; Blog</h1><p>Below is my personal introduction and related links. I look forward to exchanging ideas with fellow professionals. “When three walk together, one can always be my teacher!”</p><ol><li><a href="https://www.androidperformance.com/en/about/">Blogger Intro</a>: Includes personal WeChat and WeChat group links.</li><li><a href="https://www.androidperformance.com/en/2019/12/01/BlogMap/">Blog Content Navigation</a>: A guide for my blog content.</li><li><a href="https://www.androidperformance.com/en/2018/05/07/Android-performance-optimization-skills-and-tools/">Curated Excellent Blog Articles - Android Performance Optimization Must-Knows</a>: Welcome to recommend projects&#x2F;articles.</li><li><a href="https://www.androidperformance.com/en/2023/12/30/the-performance/">Android Performance Optimization Knowledge Planet</a>: Welcome to join and thank you for your support~</li></ol><blockquote><p><strong>One person can walk faster, a group can walk further</strong></p></blockquote><p><img src="/en/images/WechatIMG581.webp" alt="Scan WeChat QR Code"></p>]]></content>


    <summary type="html">&lt;p&gt;This is the third post in the reading notes series for &lt;em&gt;The Programmer’s Apprenticeship: From Good to Great&lt;/em&gt;. The author, Jeff Atw</summary>


    <category term="Reading Notes" scheme="https://androidperformance.com/en/categories/Reading-Notes/"/>
    
    
    <category term="The Programmer&#39;s Apprenticeship" scheme="https://androidperformance.com/en/tags/The-Programmer-s-Apprenticeship/"/>
    
    <category term="Design Principles" scheme="https://androidperformance.com/en/tags/Design-Principles/"/>
    
  </entry>
  
  <entry>
    <title>The Programmer&#39;s Apprenticeship - 02: The Way of Programming</title>
    <link href="https://androidperformance.com/en/2018/09/20/how-to-stop-sucking-and-be-awesome-instead-2/"/>
    <id>https://androidperformance.com/en/2018/09/20/how-to-stop-sucking-and-be-awesome-instead-2/</id>
    <published>2018-09-20T06:09:01.000Z</published>
    <updated>2026-05-10T23:29:51.067Z</updated>
    
    <content type="html"><![CDATA[<p>This is the second post in the reading notes series for <em>The Programmer’s Apprenticeship: From Good to Great</em>. The author, Jeff Atwood, is one of the founders of Stack Overflow. His articles cover a wide range of topics. He is a seasoned programmer, manager, and entrepreneur. This book discusses many things beyond programming. Whether you are a junior engineer or a senior engineer, this book is worth reading. As your experience grows, every time you re-read this book, you will gain new insights. Just as the title “From Good to Great” suggests, the author points out the path for you, but whether you can succeed depends on your own cultivation.</p><p>I will excerpt some wonderful remarks from the book and sometimes add my own insights or experiences. The outline of the reading notes is consistent with the outline of the book itself. This is also a method I learned from another source and have been using: “How to Read a Book”. I record it for my own frequent review and for readers’ reference. Below is the <em>The Programmer’s Apprenticeship</em> reading note series:</p><ol><li><a href="https://www.androidperformance.com/en/2018/09/19/how-to-stop-sucking-and-be-awesome-instead-1/">The Programmer’s Apprenticeship - 01: The Art of Fighting Back</a></li><li><a href="https://www.androidperformance.com/en/2018/09/20/how-to-stop-sucking-and-be-awesome-instead-2/">The Programmer’s Apprenticeship - 02: The Way of Programming</a></li><li><a href="https://www.androidperformance.com/en/2018/09/26/how-to-stop-sucking-and-be-awesome-instead-3/">The Programmer’s Apprenticeship - 03: Web Design Principles</a></li><li><a href="https://www.androidperformance.com/en/2018/09/27/how-to-stop-sucking-and-be-awesome-instead-4/">The Programmer’s Apprenticeship - 04: Reflections on Testing</a></li><li><a href="https://www.androidperformance.com/en/2018/09/28/how-to-stop-sucking-and-be-awesome-instead-5/">The Programmer’s Apprenticeship - 05: Know Your Users</a></li><li><a href="https://www.androidperformance.com/en/2018/09/29/how-to-stop-sucking-and-be-awesome-instead-6/">The Programmer’s Apprenticeship - 06: All About the Internet</a></li><li><a href="https://www.androidperformance.com/en/2018/09/30/how-to-stop-sucking-and-be-awesome-instead-7/">The Programmer’s Apprenticeship - 07: Games and Programming</a></li><li><a href="https://www.androidperformance.com/en/2018/10/01/how-to-stop-sucking-and-be-awesome-instead-8/">The Programmer’s Apprenticeship - 08: The Beauty of Reading</a></li></ol><hr><h2 id="Remember-Not-to-Be-One-Track-Minded"><a href="#Remember-Not-to-Be-One-Track-Minded" class="headerlink" title="Remember Not to Be One-Track Minded"></a>Remember Not to Be One-Track Minded</h2><p>Excellent programmers are good at programming. The way to become a more excellent programmer is to put aside programming. You must cultivate enthusiasm for everything surrounding programming.</p><p>Bill Gates mentioned in an interview in 2005: “The essence of work is not working behind closed doors. The most scarce talents are those who have super comprehension of engineering technology, can establish good relationships with core developers, and can act as a bridge between customers, marketing, etc.”</p><p>The wider your interests, the more competent you will be in your job.</p><h2 id="The-Broken-Windows-Theory"><a href="#The-Broken-Windows-Theory" class="headerlink" title="The Broken Windows Theory"></a>The Broken Windows Theory</h2><p>The Broken Windows Theory: If a window in a building is broken and left unrepaired, other windows in the building will soon be broken. A broken window that has not been repaired for a long time sends a signal that “no one cares,” which makes people feel that even if they break more windows, they will not pay any price.</p><p>From a programming perspective, the broken windows theory also exists, and you need to take timely measures: do not let “broken windows” (poor design, wrong decisions, or terrible code) go unchecked. Once discovered, they must be repaired as soon as possible. If there isn’t enough time, isolate them first. You can comment out these unpleasant codes, or display a “not yet implemented” message, or use fake data instead.</p><p>Programming pays great attention to detail! If you cannot master these details, you will have a feeling of losing control, and it is only a matter of time before your project goes out of control. Perhaps we should be cautious.</p><h2 id="Love-It-or-Leave-It"><a href="#Love-It-or-Leave-It" class="headerlink" title="Love It or Leave It"></a>Love It or Leave It</h2><p>The most outstanding programmers I know have a lifelong passion for what they do. They will never switch to other things because of a slight economic fluctuation.</p><p>For programming: Love it or leave it.</p><h2 id="The-Beauty-of-Simplicity"><a href="#The-Beauty-of-Simplicity" class="headerlink" title="The Beauty of Simplicity"></a>The Beauty of Simplicity</h2><p>In the field of programming and development, it is easy for people to fall into the mindset of “newer is better” and forget that “ideas are often more important than code.”</p><p>The evolution of Forth points out the guiding principles Charles had when inventing and implementing the Forth language:</p><ol><li>Stay firm</li><li>Don’t speculate</li><li>Do it yourself</li></ol><p>Charles believes: Simplicity must be enforced, not just as an optional goal. In reality, many developers find it difficult to keep programs simple because they don’t say “no” when they need to make tough decisions. Instead, promising everything and compromising everywhere is much easier.</p><p>Many people look down on OPPO (phones), but OPPO’s system maintains the beauty of simplicity in design, so the system feels very light and comfortable to use. Even after long-term use, there are rarely stutters. Its performance on low-end devices is also much better than competing products. This also fits OPPO’s development philosophy: prioritize basic experience (fast, power-saving, stable).</p><h2 id="Be-Happy-to-Delete-Code"><a href="#Be-Happy-to-Delete-Code" class="headerlink" title="Be Happy to Delete Code"></a>Be Happy to Delete Code</h2><p>If there is a piece of code you no longer need, please truly delete it instead of leaving it idle. The main reason is to remove noise and uncertainty. One of the most difficult things developers face is the noise or uncertainty of the code flow, because this will affect their future work efficiency. Useless code will trigger other developers to think:</p><ol><li>Why was this code written like this before?</li><li>Why is this new code better?</li><li>Will we reuse the old code in the future?</li><li>What are our criteria for judgment?</li></ol><p>In the current era where Git is rampant, you should not keep useless old code. If you want to see the previous writing, it’s just a few lines of Git commands. If you can’t have a good reason not to delete it, then deleting it is reasonable.</p><h2 id="Are-You-Cut-Out-to-Be-a-Programmer"><a href="#Are-You-Cut-Out-to-Be-a-Programmer" class="headerlink" title="Are You Cut Out to Be a Programmer?"></a>Are You Cut Out to Be a Programmer?</h2><p>This section mentions that not everyone is suitable for programming. In fact, most people cannot learn programming. The deciding factor is their attitude towards meaningless things.</p><p>Formal logical proof, expressed in a formal system called a programming language, yields results by performing specific calculations. This is actually completely meaningless. To write a computer program, you must compromise and give the program some meaning, but no matter what you want the program to do, the computer will run according to these meaningless rules and get some meaningless results. In tests, those with stable mental models showed innate acceptance in this regard. They all have the ability to see the mathematical calculation problems behind the rules, and follow those rules no matter what. On the other hand, those without stable mental models always can’t find a clue.</p><h2 id="Do-You-Follow-the-Rules"><a href="#Do-You-Follow-the-Rules" class="headerlink" title="Do You Follow the Rules?"></a>Do You Follow the Rules?</h2><p>I feel the title of this section isn’t great. “Xun Gui Dao Ju” (Follow the rules): Originally meant sticking to the rules and not daring to violate them. Now it also refers to sticking to old standards and not daring to make any changes. But the text talks about whether you follow basic rules.</p><p>This section can be interpreted as: Many things, including software development, have certain routines or basic rules. These routines or basic rules have been verified by everyone. When you want to do something, it is best to follow these routines or basic rules. For example, the author lists 12 steps to writing better code from a blog post:</p><ol><li>Do you use a source control system?</li><li>Can you complete a software build in one step?</li><li>Do you release a build every day?</li><li>Do you have a bug tracking database?</li><li>Do you fix bugs before writing new code?</li><li>Do you have an up-to-date software development schedule?</li><li>Do you have product specification documents?</li><li>Do programmers have a quiet working environment?</li><li>Are you using the best commercial tools?</li><li>Do you have testers?</li><li>During the interview process, do you ask candidates to write code?</li><li>Do you do usability testing?</li></ol><p>Although the above are all questions, the answers should be yes.</p><h2 id="Core’s-Law-Stick-to-One-Goal"><a href="#Core’s-Law-Stick-to-One-Goal" class="headerlink" title="Core’s Law: Stick to One Goal"></a>Core’s Law: Stick to One Goal</h2><p>Core’s Law: Stick to one goal. This law is reflected in several core principles of modern human settlement development:</p><ol><li>Don’t Repeat Yourself (DRY)</li><li>Once And Only Once (OAOO)</li><li>Single Point Of Truth (SPOT)</li></ol><p>Core’s Law also tells us to consciously choose what your code <em>doesn’t</em> do.</p><h2 id="The-Most-Awesome-Coding-Routine"><a href="#The-Most-Awesome-Coding-Routine" class="headerlink" title="The Most Awesome Coding Routine"></a>The Most Awesome Coding Routine</h2><p>Contrary to what you believe, simply burying your head in work every day is not true exercise – attending meetings does not exercise your interpersonal skills; replying to emails does not improve your typing skills. You must set aside time regularly for concentrated exercise so that you can do things better.</p><p>The above theory is also emphasized in two books I highly recommend, <em>Deep Work</em> and <em>Peak: Secrets from the New Science of Expertise</em> (if you haven’t read these two books, I suggest you take a look): Ten thousand hours is not repeating one hour ten thousand times, but putting your heart and soul into learning, thinking deeply, and summarizing every hour.</p><p>In addition, the author also mentioned “study hard”: constantly challenge things beyond your own ability. The main value of learning and training lies in discovering weaknesses and improving them specifically. <strong>“Studying hard” means often dealing with problems that are just at the limit of your ability, that is, things that have a high probability of failure for you.</strong> If you don’t experience some failure, you may not grow. You must constantly challenge yourself and exceed your limits.</p><p>The author listed some routines (those that can truly be implemented. Some are long, but I still copied all the items because I want to implement them myself):</p><ol><li>Write your own resume. List all your relevant skills, and then mark those that will still be useful in 100 years. Score each skill, out of 10.</li><li><strong>List the programmers you admire. Try to include those you work with, because you will gain some skills from them at work. Record 1 or 2 shining points about them, which are the areas you hope to improve.</strong></li><li>Check the “Computer Science” section on Wikipedia, find the “Pioneers in Logic and Computing” category, pick a person from this list, read about their deeds, and open any links you are interested in while reading.</li><li>Spend 20 minutes reading other people’s code. Reading excellent code and reading terrible code are both beneficial. Read both, switching in turns. If you can’t feel the difference between them, you can ask a programmer you respect to show you what excellent code is and what terrible code is. Show the code you have read to others and ask for their opinions.</li><li>List your 10 favorite programming tools—those you think you use the most and can’t live without. Randomly pick one tool and spend an hour reading its documentation. In this hour, try hard to learn a new function of this tool that you were not aware of, or discover a new way of using it.</li><li><strong>Think about it, what are you best at besides programming? Think again, how did you become so skilled and professional through exercise? What inspiration does this have for your programming work? (How to apply these experiences to programming?)</strong></li><li>Take out a stack of resumes and stay in the same room with a group of interviewers for an hour. Ensure that each resume is read by at least 3 interviewers and given a score of 1 to 3. Discuss resumes where judges’ judgments differ widely.</li><li>Participate in a phone interview. Write down your feedback afterwards, throw out your views, and then chat with the person hosting the phone interview to see if you reached a consistent conclusion.</li><li>Conduct a technical interview, and the interviewee should be an expert in a field you are not very familiar with. Ask them to assume the audience knows nothing about that field, so ask them to start from the basics. Try hard to understand what they say, and ask some questions if necessary.</li><li>Have the opportunity to participate in other people’s technical interviews. During the process, simply listen carefully and learn seriously. While the candidate tries to solve technical problems, try to solve these problems in your own mind.</li><li>Find someone who can exchange practical problems with you. Every other week, exchange programming problems with each other. Spend 10 to 15 minutes trying to solve these problems, and then spend 10 to 15 minutes discussing (whether solved or not).</li><li><strong>When you hear any interview question that you cannot solve immediately, hurry back to your seat and email the question to yourself as a reminder for the future. Find some time during that week to solve it in your favorite programming language.</strong></li></ol><p>In addition, the author also mentioned some suggestions listed by Peter Norvig:</p><ol><li>Communication with other programmers. Read other people’s code. This is more important than any book or training course.</li><li>Write programs! The best way to learn is to learn by doing.</li><li>Take programming courses during undergraduate or graduate studies.</li><li>Find some projects to do, and cooperate with other programmers to form a team. During the project, learn to distinguish the best programmers and the worst programmers.</li><li>Work with other programmers on projects, understand how to maintain code not written by you, and learn how to write code that is easy for others to maintain.</li><li>Learn many different programming languages, especially those with different worldviews and programming models from the languages you are currently familiar with.</li><li>Understand the impact of hardware on software. Know how long it takes for your computer to execute an instruction, how long it takes to fetch a word from memory (with or without cache), how long it takes to transmit data over Ethernet (or the Internet), how long it takes to read continuous data from disk or jump to another location on disk, etc.</li></ol><p>Finally, the author also expounded his own programming routine:</p><ol><li><strong>Write a blog</strong>. I started the CodingHorror.com blog in early 2004 as a form of my own effort to learn. It was humble at first, and later became one of the most important things I have done in my career. So, you should also write a blog. The people who finally “become famous” are often those who can write and communicate effectively. Their voices are the loudest; they are setting the rules of the game and leading the trends of the world.</li><li><strong>Actively participate in famous open source projects</strong>. All the high-flown talk sounds good, but are you a brag or a doer? Don’t just talk, do it. This is very important because people will measure you by your actions, not your words. Try hard to leave something tangible and useful in front of the public, so you can say, “I contributed to that project.”</li></ol><p>When you can write wonderful code and explain that code to the world with wonderful words, then I will feel that you have mastered the most awesome coding routine!</p><h2 id="Being-Alone-is-Shameful"><a href="#Being-Alone-is-Shameful" class="headerlink" title="Being Alone is Shameful"></a>Being Alone is Shameful</h2><p>I think the harm of programming alone expounded in “Creating My Own Personal Hell” cited by the author in this section is worth pondering:</p><blockquote><p>Some people declare that “working alone” provides an excellent opportunity to establish their own workflow. However, in my experience, there is no process when the team has only one person. Nothing prevents you from being overwhelmed by a flood of work. When your code is too eager for success, no one corrects your mistakes. No one checks your code. No one guarantees that your code can be submitted on time, tagged well, and subjected to routine unit testing. No one guarantees that you follow a certain coding standard. No one urges you to fix defects in the code in time. No one checks whether you have marked an existing problem as “unable to reproduce”. No one reviews your estimates, or drags you back when you neglect your duty.</p></blockquote><blockquote><p>No one takes over your work when you are sick or on a business trip. No one helps you when your work is heavy. When you are deeply trapped in harassment calls, boring meetings, and trivial tasks thrown at the last minute (but need to be solved immediately), no one can give you a hand. No one suddenly has a bright idea to help you out of trouble. No one cooperates with you on design, architecture, or technology. You work in a vacuum; in a vacuum, no one can hear your desperate screams.</p></blockquote><blockquote><p>If you read this content, please take it as a warning. If a company only recruits you as the only developer, please think twice before agreeing. That is simply another kind of hell. If there is a chance, please choose those positions where you can work with other developers, so that you can at least get guidance in the process of working with others, which helps you develop your own skills and keep up with the times in technology.</p></blockquote><p>If you can’t show it to others, what’s the point of beautiful coding skills? If you don’t contact other programmers’ different viewpoints, different methods, and different technologies, how can you learn more skills? Who can check your code and tell you that there is a simpler solution to that problem? If you are serious about programming, you should ask to work with partners.</p><p><strong>Individual ability is always limited, it determines that you can only go so far in this field. Find some other smart programmers and work with them. Try to keep yourself humble and low-key, and then you will soon discover that software development is actually a social activity—its social nature is much greater than most people imagine. You can learn a lot from those introverted companions.</strong></p><p>Just as we often say, <strong>one person can walk faster, but a group can walk further.</strong></p><h2 id="Do-You-Want-a-Programming-Partner"><a href="#Do-You-Want-a-Programming-Partner" class="headerlink" title="Do You Want a Programming Partner?"></a>Do You Want a Programming Partner?</h2><p>Under the influence of a healthy software engineering culture, team members improve their work quality and productivity through pair programming. They understand that the time they spend checking colleagues’ work will always be rewarded when others check their own deliverables in turn.</p><p>The author even gave data to illustrate the role of Code Review (a bit subversive to my cognition):</p><blockquote><p>In terms of average defect discovery rate, unit testing can only reach 25%, functional testing can reach 35%, and integration testing is only 45%. In contrast, the average efficacy of design and code review can reach 55% and 60%.</p></blockquote><p>There is a lot of fun in programming, one of which is: “You don’t have to do it alone.” So, who is your programming partner?</p><h2 id="Software-Apprenticeship"><a href="#Software-Apprenticeship" class="headerlink" title="Software Apprenticeship"></a>Software Apprenticeship</h2><p>Many companies will assign a mentor to new employees. Through this 1-on-1 guidance, new employees can integrate into the company as soon as possible, which is similar to the apprenticeship system.</p><p>Studying theory at night and programming during the day — this combination is particularly effective.</p><hr><blockquote><p><em>The Programmer’s Apprenticeship</em> (or <em>Building a Career in Software</em>) is a compilation of the best articles from the Coding Horror blog. The book is divided into 8 chapters, covering topics such as time management, programming methods, web design, testing, user needs, the Internet, game programming, and technical reading. The topics selected by the author are all pain points in a programmer’s career. Many articles have high click-through rates and reply rates on blogs and the Internet. —— from Douban</p></blockquote><blockquote><p>Jeff Atwood founded the Coding Horror blog (codinghorror.com) in 2004 to record his thoughts and bits and pieces of his software development experience. Today, the blog has nearly 100,000 visits per day. Readers participate in comments, and various views and wisdom collide passionately there. —— from Douban</p></blockquote><blockquote><p>The writing style of <em>The Programmer’s Apprenticeship</em> is humorous, understanding, and caring; it is suitable for programmers at all stages from novice to veteran, and also suitable for students of computer science and related majors who are about to become programmers. <em>The Programmer’s Apprenticeship</em> can help readers pay more attention to the human nature and humanistic factors of technical work, thereby achieving a successful turning point in their programmer career. —— from Douban</p></blockquote><h1 id="About-Me-amp-amp-Blog"><a href="#About-Me-amp-amp-Blog" class="headerlink" title="About Me &amp;&amp; Blog"></a>About Me &amp;&amp; Blog</h1><p>Below is my personal introduction and related links. I look forward to exchanging ideas with fellow professionals. “When three walk together, one can always be my teacher!”</p><ol><li><a href="https://www.androidperformance.com/en/about/">Blogger Intro</a>: Includes personal WeChat and WeChat group links.</li><li><a href="https://www.androidperformance.com/en/2019/12/01/BlogMap/">Blog Content Navigation</a>: A guide for my blog content.</li><li><a href="https://www.androidperformance.com/en/2018/05/07/Android-performance-optimization-skills-and-tools/">Curated Excellent Blog Articles - Android Performance Optimization Must-Knows</a>: Welcome to recommend projects&#x2F;articles.</li><li><a href="https://www.androidperformance.com/en/2023/12/30/the-performance/">Android Performance Optimization Knowledge Planet</a>: Welcome to join and thank you for your support~</li></ol><blockquote><p><strong>One person can walk faster, a group can walk further</strong></p></blockquote><p><img src="/en/images/WechatIMG581.webp" alt="Scan WeChat QR Code"></p>]]></content>


    <summary type="html">&lt;p&gt;This is the second post in the reading notes series for &lt;em&gt;The Programmer’s Apprenticeship: From Good to Great&lt;/em&gt;. The author, Jeff At</summary>


    <category term="Reading Notes" scheme="https://androidperformance.com/en/categories/Reading-Notes/"/>
    
    
    <category term="Android" scheme="https://androidperformance.com/en/tags/Android/"/>
    
    <category term="Jank" scheme="https://androidperformance.com/en/tags/Jank/"/>
    
    <category term="Reading Notes" scheme="https://androidperformance.com/en/tags/Reading-Notes/"/>
    
    <category term="The Programmer&#39;s Apprenticeship" scheme="https://androidperformance.com/en/tags/The-Programmer-s-Apprenticeship/"/>
    
  </entry>
  
  <entry>
    <title>The Programmer&#39;s Apprenticeship - 01: The Art of Fighting Back</title>
    <link href="https://androidperformance.com/en/2018/09/19/how-to-stop-sucking-and-be-awesome-instead-1/"/>
    <id>https://androidperformance.com/en/2018/09/19/how-to-stop-sucking-and-be-awesome-instead-1/</id>
    <published>2018-09-19T11:03:55.000Z</published>
    <updated>2026-05-10T23:29:51.067Z</updated>
    
    <content type="html"><![CDATA[<p>This is the first post in the reading notes series for <em>The Programmer’s Apprenticeship: From Good to Great</em> (a compilation of Jeff Atwood’s posts). The author, Jeff Atwood, is one of the founders of Stack Overflow. His articles cover a wide range of topics. He is a seasoned programmer, manager, and entrepreneur. This book discusses many things beyond programming. Whether you are a junior engineer or a senior engineer, this book is worth reading. As your experience grows, every time you re-read this book, you will gain new insights. Just as the title “From Good to Great” suggests, the author points out the path for you, but whether you can succeed depends on your own cultivation.</p><p>I will excerpt some wonderful remarks from the book and sometimes add my own insights or experiences. The outline of the reading notes is consistent with the outline of the book itself. This is also a method I learned from another source and have been using: “How to Read a Book”. I record it for my own frequent review and for readers’ reference. Below is the <em>The Programmer’s Apprenticeship</em> reading note series:</p><ol><li><a href="https://www.androidperformance.com/en/2018/09/19/how-to-stop-sucking-and-be-awesome-instead-1/">The Programmer’s Apprenticeship - 01: The Art of Fighting Back</a></li><li><a href="https://www.androidperformance.com/en/2018/09/20/how-to-stop-sucking-and-be-awesome-instead-2/">The Programmer’s Apprenticeship - 02: The Way of Programming</a></li><li><a href="https://www.androidperformance.com/en/2018/09/26/how-to-stop-sucking-and-be-awesome-instead-3/">The Programmer’s Apprenticeship - 03: Web Design Principles</a></li><li><a href="https://www.androidperformance.com/en/2018/09/27/how-to-stop-sucking-and-be-awesome-instead-4/">The Programmer’s Apprenticeship - 04: Reflections on Testing</a></li><li><a href="https://www.androidperformance.com/en/2018/09/28/how-to-stop-sucking-and-be-awesome-instead-5/">The Programmer’s Apprenticeship - 05: Know Your Users</a></li><li><a href="https://www.androidperformance.com/en/2018/09/29/how-to-stop-sucking-and-be-awesome-instead-6/">The Programmer’s Apprenticeship - 06: All About the Internet</a></li><li><a href="https://www.androidperformance.com/en/2018/09/30/how-to-stop-sucking-and-be-awesome-instead-7/">The Programmer’s Apprenticeship - 07: Games and Programming</a></li><li><a href="https://www.androidperformance.com/en/2018/10/01/how-to-stop-sucking-and-be-awesome-instead-8/">The Programmer’s Apprenticeship - 08: The Beauty of Reading</a></li></ol><hr><h2 id="To-Do-Lists-Are-Unreliable"><a href="#To-Do-Lists-Are-Unreliable" class="headerlink" title="To-Do Lists Are Unreliable"></a>To-Do Lists Are Unreliable</h2><p>The author complains that new TO-DO apps are born every day, yet many people still can’t manage their time well. TO-DO lists are becoming thankless tasks:</p><ol><li>The list gives you the illusion that you are making progress.</li><li>The list gives you the illusion of completion.</li><li>For those unfinished items, the list makes you feel guilty.</li><li>For those always-delayed items, the list makes you feel guilty.</li><li>For things you don’t want to do and haven’t done, the list makes you feel guilty.</li><li>You prioritize incorrectly based on the list.</li><li>Lists are not efficient enough.</li><li><strong>Lists devour the joy of doing things proactively, making you feel that doing things has become an obligation.</strong></li><li>In the long run, lists don’t make you more organized.</li><li>Lists make you lack initiative.</li></ol><p>The author’s suggestion is: when you wake up every morning, if you can’t use the brain God gave you to think of the <strong>three most important things</strong> you need to do today, then you must first solve this problem seriously. <strong>You have to figure out what is most important to you and what can fill you with passion.</strong></p><p>Tools are fleeting, but your brain will be with you for a lifetime. Trust it, train it.</p><h2 id="You-Can-Slacking-Off-at-Work-Today"><a href="#You-Can-Slacking-Off-at-Work-Today" class="headerlink" title="You Can Slacking Off at Work Today"></a>You Can Slacking Off at Work Today</h2><p>This section mainly discusses Google’s “20% time” theory: at Google, theoretically, you can use 20% of your work time to do whatever you want. many of Google’s great software products took shape during this 20% time, such as Gmail, Google News, Google Talk, AdSense, etc.</p><p>Whether it can really be implemented in a company depends on the company’s support:</p><ol><li>Is the company’s project schedule loose enough?</li><li>Does the company culture tolerate “daydreaming”?</li><li>Is failure acceptable?</li><li>Are personal experiments respected?</li></ol><p>It should be easier to implement in a company dominated by engineer culture. “<strong>Important innovations and improvements may come from anyone in the company at any time in a bottom-up manner—they won’t pop up by themselves at predetermined intervals according to a magical master plan.</strong>“</p><h2 id="You-Haven’t-Persuaded-Me"><a href="#You-Haven’t-Persuaded-Me" class="headerlink" title="You Haven’t Persuaded Me"></a>You Haven’t Persuaded Me</h2><p>This section uses an example from <em>The Last King of Scotland</em> to illustrate the importance of persuading others. If you want to implement something, you can’t just express your point of view and wait for others’ judgment. You have to persuade others to accept your point of view: <strong>If you want to influence others, you must have the ability to persuade them.</strong></p><p>For software engineers, what they need to know is not just how to write amazing code, but more importantly, how to sell their ideas and products.</p><p>The author gives a grassroots method specifically for persuading others:</p><ol><li>Overall, his point of view is quite excellent.</li><li>His way of doing things is bottom-up, not top-down.</li><li>He always takes the lead in doing things personally to win the trust of others.</li><li>He has enough patience to wait for opportunities.</li></ol><p><strong>If you keep silent blindly and always look on coldly like an outsider, you can’t change anything. If you want to change your work and life, you must learn to persuade others.</strong> For some people (like me), they are often trapped by this. I summarized the reasons, which can be considered as areas that need to be strengthened in my future career:</p><ol><li>Personality reasons</li><li>Lack of confidence</li><li>Insufficient preparation</li></ol><p>Of course, to forge iron, one must be strong oneself. Recently, a sentence from an interview left a deep impression on me: <strong>A recognized cow (awesome person) should be:</strong></p><ol><li><strong>You are capable yourself</strong>: Strong technical skills.</li><li><strong>Others say you are capable</strong>: Recognized by everyone.</li><li><strong>Those who say you are capable are also capable</strong>: Recognized by the industry.</li></ol><h2 id="Truly-Failed-Projects"><a href="#Truly-Failed-Projects" class="headerlink" title="Truly Failed Projects"></a>Truly Failed Projects</h2><p>Don’t be afraid of failure, and don’t actively seek failure; failure will come to you. No matter what project you are doing, do it with an attitude of learning and exercising. It is absolutely worth it. Compared with the result of the project, the process is the greatest wealeth.</p><p><strong>If you haven’t learned anything from the process of a project, this is the truly failed project.</strong> So in real work, projects should be reviewed in time after completion to summarize experience and lessons learned, so as to prevent stepping into the same pit next time. Even in failed projects, there is a wealth of experience.</p><h2 id="Passion-Creates-Genius"><a href="#Passion-Creates-Genius" class="headerlink" title="Passion Creates Genius"></a>Passion Creates Genius</h2><p>I really like this sentence: “I will dedicate the remaining 5 days of the course to making them smarter, rather than showing them how smart I am.” Whether doing training or writing a blog, you must have this mindset. You are not showing off how powerful you are, but letting those who read the blog or attend the training learn knowledge and gain real growth.</p><p>Don’t be intimidated by developers around you who are more talented than you. Diligence can make up for clumsiness; passion creates genius.</p><h2 id="Don’t-Call-Yourself-an-Expert"><a href="#Don’t-Call-Yourself-an-Expert" class="headerlink" title="Don’t Call Yourself an Expert"></a>Don’t Call Yourself an Expert</h2><p>The author uses Wikipedia as an example. Experts do not have more privileges. In front of knowledge, everyone is equal. Sometimes, precisely because you are an expert, more is expected or required of you.</p><p>As the ancients said: <strong>In a group of three, there must be a teacher for me; hearing the Dao has a sequence, and there is a specialization in skills, that’s all; nothing else, just practice makes perfect.</strong></p><p><strong>As an expert, the important thing is not to tell others what you know, but to be clear about what kind of questions you should ask, and to flexibly apply the knowledge you have mastered to solve the specific problems at hand. As an expert, your role is to provide intelligent, actionable direction.</strong></p><p>Recently, the issue of experts was also mentioned in interviews. The author also introduced several stages here. You can check yourself against them using the following stages. Remember to abandon your domain, professional knowledge, fame, and reputation, and then reshape yourself according to the following stages:</p><ol><li><strong>Stage 0: I overcame carelessness</strong><br>I understand now, I need to learn something.</li><li><strong>Stage 1: I overcame fear</strong><br>I think I can learn this subject or skill. I will become very knowledgeable about it, and will not be afraid of people who know more than me.</li><li><strong>Stage 2: I became organized</strong><br>I no longer feel like I’m pretending to know or incompetent. I feel I have the ability to participate in discussions or practice. I am confident in what I say.</li><li><strong>Stage 3: I surpassed my own abilities</strong><br>I now feel that I have higher requirements for myself. I no longer stop at “just getting by” and feeling complacent. I want to take some risks, be creative, keep learning, keep pushing myself to improve, and I want to work with enthusiastic people.</li></ol><h2 id="Ninety-Miles-is-Only-Half-of-a-Hundred"><a href="#Ninety-Miles-is-Only-Half-of-a-Hundred" class="headerlink" title="Ninety Miles is Only Half of a Hundred"></a>Ninety Miles is Only Half of a Hundred</h2><p>This section is mainly about project management, including personal project management and team project management. If you always say “it’s almost done,” then you need to think about whether there is a problem with your project management. The author suggests: <strong>Encourage and force programmers to create a list of everything they have to do, then list sub-items for each of them, and include all sub-items as much as possible.</strong></p><p>Here are specific possible measures. Use them in your project:</p><ol><li>List everything you need to do in a large project, including infrastructure work, such as configuring branches for the source control system.</li><li>Estimate the time required for each item in this list. This initial estimate can help you see the approximate time spent on the entire project.</li><li>Look at how much time each item in your list will take. If an item takes more than one day, break it down into several smaller items. This way of breaking down large tasks into small tasks is a key step in solving the “only 90% complete” problem.</li><li>Find a way to present the status of tasks so that interested people can understand.</li><li><strong>Track the progress of daily tasks, and put the original plan and actual completion time of each small task on the same table, so you can control the work progress.</strong></li></ol><h2 id="There-Must-Be-Trust-in-Management"><a href="#There-Must-Be-Trust-in-Management" class="headerlink" title="There Must Be Trust in Management"></a>There Must Be Trust in Management</h2><p>Trust can solve the problems of managing large software, but trust cannot replace management. The two complement each other.</p><h2 id="Boyd’s-Law-of-Iteration"><a href="#Boyd’s-Law-of-Iteration" class="headerlink" title="Boyd’s Law of Iteration"></a>Boyd’s Law of Iteration</h2><p>Boyd’s Law of Iteration: The speed of iteration beats the quality of iteration. That is what everyone often says: in the world of martial arts, only speed is unbreakable.</p><h2 id="Ten-Years-to-Sharpen-a-Sword"><a href="#Ten-Years-to-Sharpen-a-Sword" class="headerlink" title="Ten Years to Sharpen a Sword"></a>Ten Years to Sharpen a Sword</h2><p>Gmail’s road to success was long. Many people didn’t think much of it at first, but after the product was released, user feedback was very good.</p><p>Legends of overnight fame are easy to lead people astray and are very harmful. If you plan to make something brand new, be prepared for a protracted war.</p><p>The author believes that <strong>success requires years of hard work. You must steadily spend several years polishing this thing. Wake up every day and start working, stick to it day after day, constantly get feedback, and do better every day than in the past. Even if you are occasionally unhappy or even lose the fun, these are all necessary to achieve success.</strong></p><p>The author also cited the example of writing a blog. With day-after-day investment, it took the author 3 years to make his blog have a place in the industry. In this current impetuous environment, I believe that those who can calm down and continuously output knowledge will definitely have good results, as long as you believe: <strong>What you are doing is truly worth doing.</strong></p><hr><blockquote><p><em>The Programmer’s Apprenticeship</em> (or <em>Building a Career in Software</em>) is a compilation of the best articles from the Coding Horror blog. The book is divided into 8 chapters, covering topics such as time management, programming methods, web design, testing, user needs, the Internet, game programming, and technical reading. The topics selected by the author are all pain points in a programmer’s career. Many articles have high click-through rates and reply rates on blogs and the Internet. —— from Douban</p></blockquote><blockquote><p>Jeff Atwood founded the Coding Horror blog (codinghorror.com) in 2004 to record his thoughts and bits and pieces of his software development experience. Today, the blog has nearly 100,000 visits per day. Readers participate in comments, and various views and wisdom collide passionately there. —— from Douban</p></blockquote><blockquote><p>The writing style of <em>The Programmer’s Apprenticeship</em> is humorous, understanding, and caring; it is suitable for programmers at all stages from novice to veteran, and also suitable for students of computer science and related majors who are about to become programmers. <em>The Programmer’s Apprenticeship</em> can help readers pay more attention to the human nature and humanistic factors of technical work, thereby achieving a successful turning point in their programmer career. —— from Douban</p></blockquote><h1 id="About-Me-amp-amp-Blog"><a href="#About-Me-amp-amp-Blog" class="headerlink" title="About Me &amp;&amp; Blog"></a>About Me &amp;&amp; Blog</h1><p>Below is my personal introduction and related links. I look forward to exchanging ideas with fellow professionals. “When three walk together, one can always be my teacher!”</p><ol><li><a href="https://www.androidperformance.com/en/about/">Blogger Intro</a>: Includes personal WeChat and WeChat group links.</li><li><a href="https://www.androidperformance.com/en/2019/12/01/BlogMap/">Blog Content Navigation</a>: A guide for my blog content.</li><li><a href="https://www.androidperformance.com/en/2018/05/07/Android-performance-optimization-skills-and-tools/">Curated Excellent Blog Articles - Android Performance Optimization Must-Knows</a>: Welcome to recommend projects&#x2F;articles.</li><li><a href="https://www.androidperformance.com/en/2023/12/30/the-performance/">Android Performance Optimization Knowledge Planet</a>: Welcome to join and thank you for your support~</li></ol><blockquote><p><strong>One person can walk faster, a group can walk further</strong></p></blockquote><p><img src="/en/images/WechatIMG581.webp" alt="Scan WeChat QR Code"></p>]]></content>


    <summary type="html">&lt;p&gt;This is the first post in the reading notes series for &lt;em&gt;The Programmer’s Apprenticeship: From Good to Great&lt;/em&gt; (a compilation of Jef</summary>


    <category term="Reading Notes" scheme="https://androidperformance.com/en/categories/Reading-Notes/"/>
    
    
    <category term="Reading Notes" scheme="https://androidperformance.com/en/tags/Reading-Notes/"/>
    
    <category term="The Programmer&#39;s Apprenticeship" scheme="https://androidperformance.com/en/tags/The-Programmer-s-Apprenticeship/"/>
    
  </entry>
  
  <entry>
    <title>Does the Android System Not Release Memory?</title>
    <link href="https://androidperformance.com/en/2018/09/13/android-memory/"/>
    <id>https://androidperformance.com/en/2018/09/13/android-memory/</id>
    <published>2018-09-13T13:27:57.000Z</published>
    <updated>2026-05-10T23:29:51.064Z</updated>
    
    <content type="html"><![CDATA[<p>Besides the CPU, many users consider RAM size when buying a phone. Different RAM configurations come with different prices—but how much RAM do you actually need? How does Android manage its memory? Average users are often confused: How much RAM does this app use? How much does the system use? How does RAM affect my experience? And how much RAM should my next phone have?</p><p>A common question on Zhihu is: <a href="https://www.zhihu.com/question/24976909/answer/49711238">“Does the Android system not release memory?”</a>. It’s not that the user doesn’t know the system releases memory, but rather they want to understand the mechanics to optimize their experience. In this article, I’ll address these user concerns. More technical details will be covered in later articles.</p><span id="more"></span><p>This article explains Android memory management for general users, and the core conclusion still holds: whether a process remains and whether memory is immediately reclaimed depend on exit method, process priority, system memory pressure, and OEM policy. The technical investigation entry points have changed. Older workflows used task managers, <code>dumpsys meminfo</code>, and MAT to understand memory. Today, use Android Studio Memory Profiler and LeakCanary for app leaks, and combine <code>dumpsys meminfo</code>, LMK&#x2F;Android Vitals, Perfetto memory&#x2F;native heap evidence, process priority, and OEM background policy for system memory pressure. Do not judge Android health only by whether “free memory” goes up or down; modern systems intentionally use memory as cache to improve launch and switching speed.</p><h2 id="1-Does-the-System-Not-Release-Memory-After-Closing-an-App"><a href="#1-Does-the-System-Not-Release-Memory-After-Closing-an-App" class="headerlink" title="1. Does the System Not Release Memory After Closing an App?"></a>1. Does the System Not Release Memory After Closing an App?</h2><p>This is only half true. What do you mean by “closing” an app? There are several ways:</p><h3 id="Pressing-the-Back-Button"><a href="#Pressing-the-Back-Button" class="headerlink" title="Pressing the Back Button"></a>Pressing the Back Button</h3><p>Whether the process is killed depends on the app’s implementation. For example, if you create an empty app and check its memory (pid 5708, usage 13910KB):<br><img src="/en/images/media/15368461581041.jpg"><br>The process priority is <code>Foreground</code>.</p><p>If you press the Back button and check again:<br><img src="/en/images/media/15368462124980.jpg"><br>The process 5708 still exists. Its priority has shifted to <code>Cache</code>, and its usage dropped slightly to 12337KB. Most of the memory remains occupied.</p><h3 id="Using-the-Task-Manager"><a href="#Using-the-Task-Manager" class="headerlink" title="Using the Task Manager"></a>Using the Task Manager</h3><p>The result here depends on the OEM’s Task Manager implementation. Most Chinese manufacturers customize this to be quite aggressive—unless an app is on a whitelist, the Task Manager will kill the process immediately.</p><p>Opening the same test app and using the Task Manager (on a Meizu MX4 Pro):<br><img src="/en/images/media/15368463131512.jpg"><br>The entire process is wiped out.</p><h3 id="Using-ADB-or-Developer-Tools"><a href="#Using-ADB-or-Developer-Tools" class="headerlink" title="Using ADB or Developer Tools"></a>Using ADB or Developer Tools</h3><p>Running <code>adb shell am force-stop &lt;package_name&gt;</code> or using the “Stop” button in an IDE (like Android Studio) will immediately kill the process.</p><h2 id="2-Does-Memory-Not-Increase-Much-Even-After-Closing-Background-Tasks"><a href="#2-Does-Memory-Not-Increase-Much-Even-After-Closing-Background-Tasks" class="headerlink" title="2. Does Memory Not Increase Much Even After Closing Background Tasks?"></a>2. Does Memory Not Increase Much Even After Closing Background Tasks?</h2><p>This is incorrect. When a process is killed, its memory—including Virtual Machine memory, Native memory, and graphics resources—is reclaimed by the system and added back to the pool of available RAM.</p><p>Example with the Zhihu App:</p><ul><li>Before opening: 1.8GB Free RAM.</li><li>After opening: Free RAM decreases by the amount Zhihu uses.</li><li>After killing via Task Manager: Free RAM increases back to nearly its original state.<br><img src="/en/images/media/15368466879470.jpg"></li></ul><h2 id="3-Does-a-Process-Keep-Running-Even-After-Being-“Closed”-In-the-Foreground"><a href="#3-Does-a-Process-Keep-Running-Even-After-Being-“Closed”-In-the-Foreground" class="headerlink" title="3. Does a Process Keep Running Even After Being “Closed” In the Foreground?"></a>3. Does a Process Keep Running Even After Being “Closed” In the Foreground?</h2><p>This again depends on how you closed it:</p><ol><li><strong>Back Button</strong>: The process stays in the background. <strong>Whether it is “running” depends on its behavior.</strong> Some apps lower their priority to <code>Cache</code> and do nothing until the system kills them for space. Others trigger background <code>Services</code> (e.g., music players or navigation apps) and continue to run.</li><li><strong>Home Button</strong>: The process stays in the background with most resources (Activities, Services) intact. Its behavior is similar to pressing Back.</li><li><strong>Task Manager &#x2F; Force Stop</strong>: Unless the app has “Auto-start” capabilities (many Chinese apps attempt this, but most Chinese OEMs use “whitelists” to block unauthorized auto-starts), it will NOT run in the background.</li></ol><p><strong>Usage Tips</strong>:</p><ol><li>If you just need a short break and will return soon, use <strong>Home</strong>.</li><li>If you are done with the app for now, use <strong>Back</strong>.</li><li>If you want to ensure it’s not running or want to free up RAM, use the <strong>Task Manager</strong> (or the “Clear All” button).</li></ol><p>Manufacturers block unauthorized auto-starts and “mutual wake-ups” (where one app starts another) to prevent background apps from hogging CPU, I&#x2F;O, and Memory, which causes jank in the foreground app.<br><img src="/en/images/media/15368493914981.jpg"></p><h2 id="4-Do-I-Not-Need-to-Close-Apps-Manually-to-Save-Startup-Time"><a href="#4-Do-I-Not-Need-to-Close-Apps-Manually-to-Save-Startup-Time" class="headerlink" title="4. Do I Not Need to Close Apps Manually to Save Startup Time?"></a>4. Do I Not Need to Close Apps Manually to Save Startup Time?</h2><p>This is technically true if apps are “well-behaved” in the background. Unfortunately, many apps are not.</p><p>Android’s design philosophy is that users shouldn’t worry about memory. The system kills lower-priority apps when it needs space. When an app receives a “Low Memory” signal, it’s supposed to release its own unnecessary resources to stay alive. This avoids a <code>fork</code> from <code>zygote</code> the next time you open it, which is the difference between a “Cold Start” and a “Hot Start.”</p><p>However, reality is harsh. Many apps (especially in China) are not memory-sensitive and can easily hog 200MB-400MB. In low-memory situations, the system has no choice but to kill background apps. If you are reading a book, switch to WeChat to reply, take a photo to share, and check Weibo, you might find your e-book app was killed by the time you return.</p><p>This is why managing background processes—killing unimportant ones and blocking auto-starts—is crucial for a good user experience.</p><p><strong>Startup Analogy</strong>:</p><ol><li><strong>Cold Start</strong>: Get in car -&gt; Turn key -&gt; Wait for engine -&gt; Shift gears -&gt; Release handbrake -&gt; Go.</li><li><strong>Hot Start</strong>: Get in car -&gt; Shift gears -&gt; Release handbrake -&gt; Go.<br><img src="/en/images/media/15368489339779.jpg"></li></ol><h2 id="Quick-Q-amp-A"><a href="#Quick-Q-amp-A" class="headerlink" title="Quick Q&amp;A"></a>Quick Q&amp;A</h2><ul><li><strong>How does Android manage memory?</strong> (Covered in future articles).</li><li><strong>How much RAM does an app&#x2F;system use?</strong> (Covered in future articles).</li><li><strong>How does RAM affect experience?</strong> Low RAM causes jank, slow responsiveness, and frequent app restarts.</li><li><strong>How to use Android properly?</strong> Buy flagship models, use the “Clear All” task button regularly, and disable unauthorized background running.</li><li><strong>What RAM size should I buy?</strong> 6GB is the minimum; 8GB or more is ideal.</li></ul><h1 id="About-Me-amp-amp-Blog"><a href="#About-Me-amp-amp-Blog" class="headerlink" title="About Me &amp;&amp; Blog"></a>About Me &amp;&amp; Blog</h1><p>(Links and introduction)</p>]]></content>
    
    
    <summary type="html">&lt;p&gt;Besides the CPU, many users consider RAM size when buying a phone. Different RAM configurations come with different prices—but how much RAM do you actually need? How does Android manage its memory? Average users are often confused: How much RAM does this app use? How much does the system use? How does RAM affect my experience? And how much RAM should my next phone have?&lt;/p&gt;
&lt;p&gt;A common question on Zhihu is: &lt;a href=&quot;https://www.zhihu.com/question/24976909/answer/49711238&quot;&gt;“Does the Android system not release memory?”&lt;/a&gt;. It’s not that the user doesn’t know the system releases memory, but rather they want to understand the mechanics to optimize their experience. In this article, I’ll address these user concerns. More technical details will be covered in later articles.&lt;/p&gt;</summary>


    <category term="Android" scheme="https://androidperformance.com/en/categories/Android/"/>
    
    
    <category term="Android" scheme="https://androidperformance.com/en/tags/Android/"/>
    
    <category term="Startup" scheme="https://androidperformance.com/en/tags/Startup/"/>
    
    <category term="Jank" scheme="https://androidperformance.com/en/tags/Jank/"/>
    
    <category term="Memory" scheme="https://androidperformance.com/en/tags/Memory/"/>
    
    <category term="Process" scheme="https://androidperformance.com/en/tags/Process/"/>
    
  </entry>
  
  <entry>
    <title>Some Thoughts on Android System Fluency</title>
    <link href="https://androidperformance.com/en/2018/08/13/Some-Thoughts-on-the-Fluency-of-Android/"/>
    <id>https://androidperformance.com/en/2018/08/13/Some-Thoughts-on-the-Fluency-of-Android/</id>
    <published>2018-08-13T04:01:23.000Z</published>
    <updated>2026-05-10T23:29:51.063Z</updated>
    
    <content type="html"><![CDATA[<p>I’ve long wanted to write about Android system fluency because it’s the most direct aspect of the user experience. The long-standing criticism that Android “gets laggier over time” still casts a shadow over the platform, and it’s a primary reason many users default to iPhone.</p><p>Because Google keeps Android open, different manufacturers produce devices with vastly different hardware, and app quality varies wildly. Consequently, fluency is affected by countless factors. It’s rarely just “the system isn’t optimized.” Often, two devices with the same OS but different SOCs offer completely different experiences.</p><p>In this post, I want to discuss the factors affecting Android fluency from several perspectives:</p><ol><li>Hardware</li><li>System</li><li>Applications</li><li>The Optimization Loop</li></ol><span id="more"></span><h2 id="1-Hardware-Level"><a href="#1-Hardware-Level" class="headerlink" title="1. Hardware Level"></a>1. Hardware Level</h2><h3 id="CPU"><a href="#CPU" class="headerlink" title="CPU"></a>CPU</h3><p>The CPU is the most critical component. Most Android operations interact with it, and its performance directly determines a phone’s tier. Rankings generally follow: Qualcomm &gt; Huawei &gt; Samsung &gt; MediaTek.</p><h3 id="GPU"><a href="#GPU" class="headerlink" title="GPU"></a>GPU</h3><p>Integrated into the SoC, the GPU’s power primarily affects graphics-heavy tasks like PUBG Mobile, Honkai Impact 3rd, and racing games. Interestingly, games like Honor of Kings are often more CPU-bound than GPU-bound.</p><h3 id="RAM"><a href="#RAM" class="headerlink" title="RAM"></a>RAM</h3><p>As Android and hardware evolve, memory demand grows. 4GB is now the baseline, with 6GB or 8GB common in flagships. Larger RAM allows the system to “trade space for time”: caching more background processes, aggressive pre-loading, and relaxed tuning for VMs and rendering. This results in a “faster” feel for the user.</p><h3 id="Storage-UFS-vs-EMMC"><a href="#Storage-UFS-vs-EMMC" class="headerlink" title="Storage (UFS vs. EMMC)"></a>Storage (UFS vs. EMMC)</h3><p>UFS is the modern standard for mobile flash storage. For the best experience, avoid EMMC-based devices, as UFS significantly improves file reading, video loading, and file copying speeds.</p><h3 id="Screen-Resolution"><a href="#Screen-Resolution" class="headerlink" title="Screen Resolution"></a>Screen Resolution</h3><p>Higher resolutions (like 2K) impact performance in screenshots, recording, and composition. If hardware can’t support it—like the Meizu MX4 Pro—the result is a laggy, battery-hungry device. Many 2K phones now default to 1080P in certain scenarios to maintain performance.</p><h3 id="SoC-Platform"><a href="#SoC-Platform" class="headerlink" title="SoC Platform"></a>SoC Platform</h3><p>The SoC (System-on-a-Chip) is the foundation of the experience. Qualcomm’s platform is currently the most mature, providing extensive optimization code on top of AOSP and robust documentation, explains why so many Chinese OEMs prefer it.</p><hr><h2 id="2-System-Level"><a href="#2-System-Level" class="headerlink" title="2. System Level"></a>2. System Level</h2><h3 id="App-Management-Policies"><a href="#App-Management-Policies" class="headerlink" title="App Management Policies"></a>App Management Policies</h3><p>Chinese OEMs are known for aggressive background management. This is a reaction to “family buckets” (app clusters) that maliciously wake each other up. Most lag reported by users stems from rogue background apps consuming CPU and RAM that the average user doesn’t know how to manage.</p><p>Common system restrictions include:</p><ul><li>Preventing apps from silently launching other apps.</li><li>Preventing unnecessary background residency.</li><li>Restricting CPU usage during screen-off.</li></ul><h3 id="Memory-Strategy"><a href="#Memory-Strategy" class="headerlink" title="Memory Strategy"></a>Memory Strategy</h3><p>OEMs tune parameters like <code>LowMemoryKiller</code> thresholds and background process limits based on device RAM. In low-end devices, memory shortage leads to frequent process killing and heavy disk I&#x2F;O (swapping), which feels like “lag” to the user.</p><h3 id="Process-Scheduling"><a href="#Process-Scheduling" class="headerlink" title="Process Scheduling"></a>Process Scheduling</h3><p>If critical rendering tasks aren’t scheduled correctly, the app will stutter. Trace data usually shows this as “Runnable” states. Factors include:</p><ul><li>Too many concurrent processes.</li><li>Low process priority.</li><li>Insensitive schedulers failing to respond to heavy tasks.</li><li>Thermal or low-battery throttling limiting the “Big” cores.</li><li>WMS&#x2F;AMS lock contention.</li></ul><h3 id="Main-Thread-amp-Render-Thread"><a href="#Main-Thread-amp-Render-Thread" class="headerlink" title="Main Thread &amp; Render Thread"></a>Main Thread &amp; Render Thread</h3><p>Most application lag occurs here. Bottlenecks often include:</p><ul><li>Long input event processing.</li><li>Heavy animation logic (e.g., new Item generation in ListView).</li><li>Complex Measure&#x2F;Layout&#x2F;Draw cycles.</li><li>Frequent uploads of large Bitmaps.</li></ul><h3 id="Triple-Buffering"><a href="#Triple-Buffering" class="headerlink" title="Triple Buffering"></a>Triple Buffering</h3><p>Introduced in Project Butter, Vsync and Triple Buffering significantly improved Android smoothness. They allow the system to handle occasional frames that exceed the 16ms threshold without a visible stutter.</p><h3 id="Virtual-Machine-ART-vs-Dalvik"><a href="#Virtual-Machine-ART-vs-Dalvik" class="headerlink" title="Virtual Machine (ART vs. Dalvik)"></a>Virtual Machine (ART vs. Dalvik)</h3><p>ART significantly liberated the main thread by reducing “Stop-the-World” GC pauses, which were a primary source of jank in the Dalvik era.</p><hr><h2 id="3-Application-Level"><a href="#3-Application-Level" class="headerlink" title="3. Application Level"></a>3. Application Level</h2><h3 id="Complex-Layouts"><a href="#Complex-Layouts" class="headerlink" title="Complex Layouts"></a>Complex Layouts</h3><p>The primary culprit for app lag. Complex hierarchies mean slower Measure&#x2F;Layout&#x2F;Draw cycles, especially during scrolling where new items are initialized.</p><h3 id="Excessive-Business-Logic"><a href="#Excessive-Business-Logic" class="headerlink" title="Excessive Business Logic"></a>Excessive Business Logic</h3><p>Heavyweight apps like Taobao often feel sluggish during cold starts because they are busy dynamically loading modules and performing <code>dex2oat</code> operations in the background.</p><h3 id="Memory-Churn"><a href="#Memory-Churn" class="headerlink" title="Memory Churn"></a>Memory Churn</h3><p>Frequent allocation and deallocation lead to “memory churning,” visible as a sawtooth pattern in Android Studio’s memory monitor. This often indicates suboptimal code.</p><h3 id="Slow-Networking"><a href="#Slow-Networking" class="headerlink" title="Slow Networking"></a>Slow Networking</h3><p>Long network wait times are often perceived by users as “the app is laggy.”</p><h3 id="Suboptimal-Design"><a href="#Suboptimal-Design" class="headerlink" title="Suboptimal Design"></a>Suboptimal Design</h3><p>Sometimes design and performance are at odds. Complex, nested animations can be a nightmare to implement efficiently, working well on flagships but failing on low-end hardware.</p><hr><h2 id="4-The-Optimization-Loop"><a href="#4-The-Optimization-Loop" class="headerlink" title="4. The Optimization Loop"></a>4. The Optimization Loop</h2><h3 id="Laboratory-Monitoring"><a href="#Laboratory-Monitoring" class="headerlink" title="Laboratory Monitoring"></a>Laboratory Monitoring</h3><p>Use data to monitor performance during development, simulating user environments to catch problems early.</p><h3 id="Real-World-Data-Collection"><a href="#Real-World-Data-Collection" class="headerlink" title="Real-World Data Collection"></a>Real-World Data Collection</h3><p>Collect performance metrics from users to identify the most common issues. Be careful to avoid the “observer effect” where monitoring itself causes lag. Focus on system indicators that correlate with jank.</p><h3 id="Targeted-Optimization"><a href="#Targeted-Optimization" class="headerlink" title="Targeted Optimization"></a>Targeted Optimization</h3><p>Rank issues by frequency and impact. Often, this requires collaboration between OEMs and app developers. Incorporate these scenarios back into the lab environment to create a continuous improvement loop: <strong>Lab Monitor -&gt; User Simulation -&gt; Big Data Collection -&gt; Targeted Fix -&gt; Lab Update.</strong></p><h1 id="About-Me-amp-amp-Blog"><a href="#About-Me-amp-amp-Blog" class="headerlink" title="About Me &amp;&amp; Blog"></a>About Me &amp;&amp; Blog</h1><p>(Links and introduction)</p>]]></content>
    
    
    <summary type="html">&lt;p&gt;I’ve long wanted to write about Android system fluency because it’s the most direct aspect of the user experience. The long-standing criticism that Android “gets laggier over time” still casts a shadow over the platform, and it’s a primary reason many users default to iPhone.&lt;/p&gt;
&lt;p&gt;Because Google keeps Android open, different manufacturers produce devices with vastly different hardware, and app quality varies wildly. Consequently, fluency is affected by countless factors. It’s rarely just “the system isn’t optimized.” Often, two devices with the same OS but different SOCs offer completely different experiences.&lt;/p&gt;
&lt;p&gt;In this post, I want to discuss the factors affecting Android fluency from several perspectives:&lt;/p&gt;
&lt;ol&gt;
&lt;li&gt;Hardware&lt;/li&gt;
&lt;li&gt;System&lt;/li&gt;
&lt;li&gt;Applications&lt;/li&gt;
&lt;li&gt;The Optimization Loop&lt;/li&gt;
&lt;/ol&gt;</summary>


    <category term="Android" scheme="https://androidperformance.com/en/categories/Android/"/>
    
    
    <category term="Android" scheme="https://androidperformance.com/en/tags/Android/"/>
    
    <category term="Startup" scheme="https://androidperformance.com/en/tags/Startup/"/>
    
    <category term="Jank" scheme="https://androidperformance.com/en/tags/Jank/"/>
    
    <category term="Memory" scheme="https://androidperformance.com/en/tags/Memory/"/>
    
    <category term="RenderThread" scheme="https://androidperformance.com/en/tags/RenderThread/"/>
    
  </entry>
  
  <entry>
    <title>Zhihu: Save Your StartingWindow</title>
    <link href="https://androidperformance.com/en/2018/05/20/zhihu-startingwindow/"/>
    <id>https://androidperformance.com/en/2018/05/20/zhihu-startingwindow/</id>
    <published>2018-05-20T11:50:13.000Z</published>
    <updated>2026-05-10T23:29:51.069Z</updated>
    
    <content type="html"><![CDATA[<p>It’s often said that the overall iOS experience is superior to Android. This is partly due to third-party software quality (iOS versions are often more polished) and partly due to Apple’s tight control over its ecosystem. To get on the App Store, you must pass rigorous reviews.</p><p>Today, we’ll discuss a major differentiator between iOS and Android: the <strong>StartingWindow</strong> (colloquially, the Splash Screen). While both systems have them, their implementations vary wildly. iOS requires a StartingWindow—usually a static image—that displays immediately upon an icon tap with zero delay. Android, being open, allows developers to customize, disable, or even make the StartingWindow transparent.</p><span id="more"></span><h2 id="How-StartingWindow-Affects-User-Experience"><a href="#How-StartingWindow-Affects-User-Experience" class="headerlink" title="How StartingWindow Affects User Experience"></a>How StartingWindow Affects User Experience</h2><p>Because the StartingWindow is the first thing a user sees, its misuse can lead to a terrible first impression. Let’s look at three scenarios:</p><ol><li><strong>Default StartingWindow</strong>: User taps the icon -&gt; system immediately shows the default window (the one with the launch animation) -&gt; app frame renders -&gt; window disappears. This is seamless and provides immediate feedback. Most system apps and well-behaved apps like Jike (即刻) or Autohome (汽车之家) use this.</li><li><strong>Custom Simple StartingWindow</strong>: User taps icon -&gt; system shows a custom StartingWindow (e.g., brand logo) -&gt; app frame renders -&gt; custom window disappears. Since it’s custom, there’s a tiny overhead for decoding the bitmap or inflating the layout, but the experience is still top-tier. Examples: Taobao, JD, Weibo, Jinri Toutiao, Meituan.</li><li><strong>Disabled or Transparent StartingWindow</strong>: User taps icon -&gt; nothing happens (except maybe the icon’s touch state changing) -&gt; 1 to N seconds pass -&gt; main UI suddenly pops in. This is “cancerous” behavior. Examples: <strong>Wechat, Wechat Read, UC Browser, Alipay, ICBC, Mi Home</strong>.</li></ol><p>I strongly urge developers using the third approach to reconsider. It makes the system feel sluggish, leading users to blame the OS rather than the app. WeChat gets away with it because it’s a “super-app” that OEMs rarely kill, but if you <code>force-stop</code> it and try to relaunch, the delay is jarring.</p><h2 id="Case-Study-Zhihu’s-UX-Data"><a href="#Case-Study-Zhihu’s-UX-Data" class="headerlink" title="Case Study: Zhihu’s UX Data"></a>Case Study: Zhihu’s UX Data</h2><p>As a heavy Zhihu user, I’ve been frustrated by its deteriorating launch experience. Recently (v5.17.2), Zhihu uses the first approach (default window), but its startup is so slow that the user is stuck staring at a white screen for a significant amount of time.</p><p>Let’s look at the data from a Xiaomi Mix 2S (Snapdragon 845):</p><ol><li><p><strong>StartingWindow (White Screen) to First Frame (SurfaceFlinger view)</strong>:<br><img src="/en/images/media/15269126222428.jpg" alt="First Frame Trace"></p></li><li><p><strong>App Process View</strong>:<br><img src="/en/images/media/15269125336746.jpg" alt="Zhihu Cold Start Trace"></p></li><li><p><strong>Log Perspective (<code>am_activity_launch_time</code>)</strong>:<br>The system logs a launch time of <strong>2684ms</strong> on a high-end device.</p></li></ol><figure class="highlight plaintext"><table><tr><td class="gutter"><pre><span class="line">1</span><br><span class="line">2</span><br></pre></td><td class="code"><pre><span class="line">// ... logs showing LauncherActivity starting, then pausing, then MainActivity starting ...</span><br><span class="line">05-21 22:41:00.736  1252  1305 I am_activity_launch_time: [0,123681068,com.zhihu.android/.app.ui.activity.MainActivity,1078,2684]</span><br></pre></td></tr></table></figure><p>For nearly 1.9 seconds, the user sees nothing but a blank white screen. This is followed by a 3-second mandatory ad page before the main UI even appears. On low-end devices, this experience is exponentially worse.</p><h2 id="The-Visual-Journey"><a href="#The-Visual-Journey" class="headerlink" title="The Visual Journey"></a>The Visual Journey</h2><p>The user’s perspective on a Pro 7:</p><ol><li><p><strong>Icon Tap -&gt; Blank White StartingWindow (2s)</strong><br><img src="/en/images/media/S80521-222728-1.jpg" alt="StartingWindow"></p></li><li><p><strong>White Screen -&gt; Ad Page (3s)</strong><br><img src="/en/images/media/S80521-222748-1.jpg" alt="Ad Page"></p></li><li><p><strong>Ad Page -&gt; Main UI</strong><br><img src="/en/images/media/S80521-222753-1.jpg" alt="Main UI"></p></li></ol><p>I recommend Zhihu adopt a custom brand-themed StartingWindow like their iOS version does. It bridges the experience gap and feels far more premium than a system-default white screen.</p><p><img src="/en/images/media/Image-1-1.jpg" alt="Zhihu iOS Splash Screen"></p><h2 id="Parting-Thoughts"><a href="#Parting-Thoughts" class="headerlink" title="Parting Thoughts"></a>Parting Thoughts</h2><p>Android’s user experience depends heavily on third-party developers. While OEMs can optimize the hardware and OS, the moment a user enters an app, the developer is in the driver’s seat.</p><p>The StartingWindow is a small detail, but it’s the gateway to your app. If the gateway is broken or ugly, why would a user want to return? “Speed defines the winner” isn’t just a martial arts quote—it’s the core of performance optimization. When apps are optimized, the entire ecosystem shines.</p><h3 id="The-Hall-of-Shame-Apps-using-disabled-x2F-transparent-StartingWindows"><a href="#The-Hall-of-Shame-Apps-using-disabled-x2F-transparent-StartingWindows" class="headerlink" title="The Hall of Shame (Apps using disabled&#x2F;transparent StartingWindows):"></a>The Hall of Shame (Apps using disabled&#x2F;transparent StartingWindows):</h3><ol><li>WeChat</li><li>WeChat Read</li><li>UC Browser</li><li>Alipay</li><li>ICBC</li><li>Mi Home</li><li>… (Feel free to suggest more)</li></ol><h1 id="About-Me-amp-amp-Blog"><a href="#About-Me-amp-amp-Blog" class="headerlink" title="About Me &amp;&amp; Blog"></a>About Me &amp;&amp; Blog</h1><p>Below is my personal intro and related links. I look forward to exchanging ideas with fellow professionals. “When three walk together, one can always be my teacher!”</p><ol><li><a href="https://www.androidperformance.com/en/about/">Blogger Intro</a></li><li><a href="https://www.androidperformance.com/en/2019/12/01/BlogMap/">Blog Content Navigation</a>: A guide for my blog content.</li><li><a href="https://www.androidperformance.com/en/2018/05/07/Android-performance-optimization-skills-and-tools/">Curated Excellent Blog Articles - Android Performance Optimization Must-Knows</a></li><li><a href="https://www.androidperformance.com/en/2023/12/30/the-performance/">Android Performance Optimization Knowledge Planet</a></li></ol><blockquote><p><strong>One walks faster alone, but a group walks further together.</strong></p></blockquote><p><img src="/en/images/WechatIMG581.webp" alt="Scan WeChat QR Code"></p>]]></content>
    
    
    <summary type="html">&lt;p&gt;It’s often said that the overall iOS experience is superior to Android. This is partly due to third-party software quality (iOS versions are often more polished) and partly due to Apple’s tight control over its ecosystem. To get on the App Store, you must pass rigorous reviews.&lt;/p&gt;
&lt;p&gt;Today, we’ll discuss a major differentiator between iOS and Android: the &lt;strong&gt;StartingWindow&lt;/strong&gt; (colloquially, the Splash Screen). While both systems have them, their implementations vary wildly. iOS requires a StartingWindow—usually a static image—that displays immediately upon an icon tap with zero delay. Android, being open, allows developers to customize, disable, or even make the StartingWindow transparent.&lt;/p&gt;</summary>


    <category term="Android" scheme="https://androidperformance.com/en/categories/Android/"/>
    
    
    <category term="Android" scheme="https://androidperformance.com/en/tags/Android/"/>
    
    <category term="Systrace" scheme="https://androidperformance.com/en/tags/Systrace/"/>
    
    <category term="Startup" scheme="https://androidperformance.com/en/tags/Startup/"/>
    
    <category term="RenderThread" scheme="https://androidperformance.com/en/tags/RenderThread/"/>
    
    <category term="User Experience" scheme="https://androidperformance.com/en/tags/User-Experience/"/>
    
  </entry>
  
  <entry>
    <title>[Sticky] Android Performance Optimization: Must-Know Skills and Tools</title>
    <link href="https://androidperformance.com/en/2018/05/07/Android-performance-optimization-skills-and-tools/"/>
    <id>https://androidperformance.com/en/2018/05/07/Android-performance-optimization-skills-and-tools/</id>
    <published>2018-05-07T12:10:44.000Z</published>
    <updated>2026-05-03T16:00:00.000Z</updated>
    
    <content type="html"><![CDATA[<p>This article records the essential knowledge for Android performance optimization (mainly including outstanding articles, WeChat accounts, blogs, and technical teams), covering all aspects of performance optimization. This post will be continuously updated; personal recommendations are welcome.</p><span id="more"></span><p>Having worked on performance for a long time and touched many modules, I must say that doing a good job in performance isn’t easy. Why? Because the amount of knowledge required is immense. Android is a complex system; a single change can affect everything. You can’t excel by only knowing one module.</p><p>In my learning journey, besides reading source code, I’ve encountered a wealth of knowledge online. Many seniors have shared their insights and experiences, helping me avoid many pitfalls. I’ve saved many excellent technical articles and documents in my notes. Now, I’ve decided to share them online so that anyone wishing to enter the field of Android system development and optimization can get started quickly by reading this article. It also serves as a way for me to organize my knowledge and pursue lifelong learning.</p><p>This article lists the must-know skills and tools for Android performance optimization (if you have your own favorites, feel free to suggest them). Some articles may require specific access methods. Additionally, here is the <a href="https://www.androidperformance.com/en/2020/02/03/android-development-learning-path-2020-edition/">Android Developer Learning Path (2020 Edition)</a>.</p><p>This article is updated regularly. Latest update: 2026-05-04. This update adds recent resources on Perfetto, Macrobenchmark, Baseline Profiles, ADPF, simpleperf, ANR, memory, and the graphics stack. When reading the older posts linked below, separate the old tooling entry points from the current default workflow. MAT, Hierarchy Viewer, TraceView, Systrace HTML, and manual <code>am start -W</code> checks still explain real problem types, but the default investigation path has moved to Android Studio Profiler, Layout Inspector, Perfetto, Macrobenchmark, Baseline Profiles, and Android Vitals.</p><table><thead><tr><th>Optimization goal</th><th>Older entry points in these posts</th><th>Current preferred entry points</th></tr></thead><tbody><tr><td>Startup</td><td><code>am start -W</code>, logcat, Systrace</td><td>Macrobenchmark <code>StartupTimingMetric</code> for repeatable measurement, Baseline Profiles&#x2F;Startup Profiles for release optimization, Perfetto&#x2F;System Trace for root cause analysis, Android Vitals for field metrics</td></tr><tr><td>Smoothness&#x2F;jank</td><td>FPS, Profile GPU Rendering, manual Systrace inspection</td><td>Perfetto Frame Timeline, Macrobenchmark <code>FrameTimingMetric</code>, JankStats, Android Vitals slow&#x2F;frozen frames</td></tr><tr><td>Memory</td><td>DDMS, MAT, <code>hprof-conv</code></td><td>Android Studio Memory Profiler heap dumps, LeakCanary, <code>dumpsys meminfo</code>, Perfetto&#x2F;native heap profiling; MAT remains useful for large offline HPROF files and Dominator Tree analysis</td></tr><tr><td>ANR</td><td>logcat + <code>/data/anr/traces.txt</code></td><td>Android Vitals, <code>ApplicationExitInfo</code>, bugreports, <code>/data/anr/anr_*</code>, CPU&#x2F;Binder&#x2F;lock evidence in Perfetto</td></tr><tr><td>Layout&#x2F;rendering</td><td>Hierarchy Viewer, TraceView, GPU overdraw</td><td>Layout Inspector&#x2F;Compose Layout Inspector, Android Studio CPU Profiler&#x2F;System Trace, Profile GPU Rendering, Debug GPU overdraw</td></tr></tbody></table><p>Treat the older links as mechanism explanations and problem-type indexes. For real work, replace capture, measurement, field monitoring, and root-cause analysis with the current tools in the table above.</p><h1 id="Optimization-Experience-and-Insights"><a href="#Optimization-Experience-and-Insights" class="headerlink" title="Optimization Experience and Insights"></a>Optimization Experience and Insights</h1><ol><li><a href="https://mp.weixin.qq.com/s/-3uY3aSF67xTzWEJsa7e-A">Douyin Android Performance Optimization Series: Startup Optimization Practices</a></li><li><a href="https://www.youtube.com/playlist?list=PLWz5rJ2EKKc9CBxr3BVjPTPoDPLdPIFCE">Series Videos Android Performance Patterns</a></li><li><a href="https://juejin.im/entry/5aa24187518825557207f8e2">Accelerating Apps: Android Performance Optimization Summary</a></li><li><a href="https://tech.meituan.com/hertz.html">Hertz: A Mobile Performance Monitoring Solution</a></li><li><a href="https://www.androidperformance.com/en/2015/03/31/android-performance-case-study-follow-up/">Android Performance Optimization Follow-up</a></li><li><a href="http://weishu.me/2016/12/23/dive-into-android-optimize-vm-heap/">Android VM Performance Tuning</a></li><li><a href="https://zhuanlan.zhihu.com/p/27065828">Android UI Performance Optimization</a></li><li><a href="https://developer.android.google.cn/training/articles/perf-tips">Performance Tips</a></li><li><a href="https://mp.weixin.qq.com/s?__biz=MjM5NjQ5MTI5OA==&mid=2651747849&idx=1&sn=e6bb86aadb6b7146f3d9ecfb1469a94b&chksm=bd12af448a652652c2d9a8f38bcff5f61b44ad26d86d4d85f6187d6e13296765c1e23dd744f9&mpshare=1&scene=1&srcid=0412q53XS0opyXmxjPp2thAv%23rd">Meituan Waimai: Android Lint Code Check Practices</a></li><li><a href="https://www.youtube.com/watch?v=VC2Hlb22mZM">Android battery and memory optimizations - Google I&#x2F;O 2016</a></li><li><a href="https://www.udacity.com/course/android-performance--ud825">Google Free Public Course: Android Performance</a></li><li><a href="http://imgtec.eetrend.com/blog/11583">Thoughts on Android App Performance Optimization</a></li><li><a href="https://zhuanlan.zhihu.com/p/27593816">Memory Leak Analysis with Android Studio and MAT</a></li><li><a href="https://mp.weixin.qq.com/s?__biz=MzAxNDEwNjk5OQ==&mid=2650403370&idx=1&sn=b4297b138eb7f73c95a6279c3458f025&chksm=83953a32b4e2b3247fc18cbee08a2682d8b09720a1c5fef0c36257ae92b1e201cb1ad3125455&mpshare=1&scene=1&srcid=#rd">Full-link Performance Optimization of Mobile Taobao (Part 1)</a></li><li><a href="https://wemp.app/posts/cb3c5a67-0502-4d0a-8afa-b0e9863d8b83?utm_source=latest-posts">Full-link Performance Optimization of Mobile Taobao (Part 2)</a></li><li><a href="https://time.geekbang.org/column/intro/142">Android Development Master Course (Geek Time)</a></li><li><a href="https://mp.weixin.qq.com/s?__biz=MzA3NTYzODYzMg==&mid=2653579716&idx=1&sn=2f65e52559ae46b42222f72219a52198&chksm=84b3bbc3b3c432d52e3d01cc7b686877100556d18610eb80906596d5efa9c0284d1d38c44078&mpshare=1&scene=1&srcid=0311Jtai5vFmqNwNp8WUgsRT#rd">Mobile QQ Android Cache Monitoring and Optimization</a></li><li><a href="https://www.infoq.cn/article/weixin-reading-stuck-monitor-and-test?useSponsorshipSuggestions=true&utm_source=articles_about_architecture-design&utm_medium=link&utm_campaign=architecture-design">WeChat Reading (Android) Engine Jitter Monitoring and Testing</a></li><li><a href="http://www.caveman.work/2019/06/01/Data-science-for-mobile-OS-system-optimization/">Data science for mobile OS system optimization</a></li><li><a href="https://mp.weixin.qq.com/s?__biz=MzAwNDY1ODY2OQ==&mid=2649287054&idx=1&sn=40f1b9935c280547926fc5f799c0b9c2&chksm=8334cd0cb443441aad977bd462df6cafcb20ae55bf9d70c99a7b3045178c848a7e75b6e02aa1&mpshare=1&scene=1&srcid=#rd">Matrix TraceCanary: Stutter Monitoring</a></li><li><a href="https://mp.weixin.qq.com/s?__biz=MzAwNDY1ODY2OQ==&mid=2649287034&idx=1&sn=6706196ff0824578f1400fdf9906c025&chksm=8334cdf8b44344ee51bc30820756ea737d2615fc5b30122c91a88dd7f7e7694847071a7c3b9c&mpshare=1&scene=1&srcid=#rd">Matrix IOCanary: I&#x2F;O Quality Monitoring</a></li><li><a href="https://mp.weixin.qq.com/s?__biz=MzAwNTAzMjcxNg==&mid=2651425463&idx=1&sn=778b483ee453f0ba987e5c9edd85c3a4">Polishing Google Photos Web UI</a></li><li><a href="https://mp.weixin.qq.com/s/KtGfi5th-4YHOZsEmTOsjg">WeChat Android Memory Optimization Practices</a></li><li><a href="https://juejin.im/post/5be1077d518825171140dbfa">Alipay Architecture: G.C. Optimization for App Launch</a></li><li><a href="https://juejin.im/post/5e5b9466518825494b3cd5aa">Douyin BoostMultiDex: Reducing Cold Start Time by 80% on Low Android Versions</a></li><li><a href="https://juejin.im/post/5e809cf46fb9a03c763cf348">Douyin APK Size Optimization: Resources</a></li><li><a href="https://mp.weixin.qq.com/s/YJJdh3220y7TvBu3hAE3dQ">Performance Terminator “Olympic”</a></li><li><a href="https://zhuanlan.zhihu.com/p/123328822">Meituan Java Thread Pool Implementation and Practices</a></li><li><a href="https://mp.weixin.qq.com/s/tO1yxFs2qNQlQ2bJ8vGzQA">Probe: An Online OOM Diagnostic Component</a></li><li><a href="https://link.zhihu.com/?target=https://mp.weixin.qq.com/s/Kc1BSlbJgAUxOSIkPF4GzA">Optimization Practice: Stutter in Lists at High Refresh Rates</a></li><li><a href="https://mp.weixin.qq.com/s/gMxTq0_nmE-xW7GA3pkBJg">iOS High Refresh Rate Monitoring + Optimization: A Comprehensive Analysis from Theory to Practice</a></li><li><a href="https://juejin.cn/post/6844904136266219534">Large Image Monitoring via ASM</a></li><li><a href="https://www.jianshu.com/p/b0de542204f8">Native Memory Leak in Android S Source Code</a></li><li><a href="https://proandroiddev.com/can-you-trust-time-measurements-in-profiler-5b3566a55e0c">Can you trust time measurements in Profiler?</a></li><li><a href="https://mp.weixin.qq.com/s/UizFbjIjrOzDLmLc0uLkbA">Observability Architecture and Key Technologies for Mobile</a></li></ol><h1 id="Responsiveness-Startup"><a href="#Responsiveness-Startup" class="headerlink" title="Responsiveness (Startup)"></a>Responsiveness (Startup)</h1><ol><li><a href="https://www.jianshu.com/p/37370c1d17fc">Full Analysis of Android App Startup Process (Source Code Deep Dive)</a></li><li><a href="https://www.androidperformance.com/en/2019/11/18/Android-App-Lunch-Optimize/">Android App Launch Optimization Record</a></li><li><a href="https://source.android.com/devices/tech/perf/boot-times">Optimizing Boot Times</a></li><li><a href="https://www.androidperformance.com/en/2015/12/31/How-to-calculation-android-app-lunch-time/">How to Calculate App Startup Time in Android</a></li><li><a href="https://developer.android.google.cn/topic/performance/launch-time">Google Official Documentation - Launch-time performance</a></li><li><a href="https://mp.weixin.qq.com/s?__biz=MzAxMTI4MTkwNQ==&mid=2650829097&idx=2&sn=e59841d4b1ed7e12a30e29ec51072d70&chksm=80b7a5b7b7c02ca184e0c06289d90823d589e738c55712318875f51e4aeb8646294b8d426299&mpshare=1&scene=1&srcid=&sharer_sharetime=1571275213308&sharer_shareid=60bd7acea7881a97fbf9a6126d3e88d3#rd">Android Cold Start Optimization: New Tricks Beyond the Usual Three</a></li><li><a href="https://mp.weixin.qq.com/s/79tAFx6zi3JRG-ewoapIVQ">Alipay App Build Optimization: Improving Android Startup via Installation Package Rearrangement</a></li><li><a href="https://mp.weixin.qq.com/s/Bf41Kez_OLZTyty4EondHA">Cold Start Optimization: Exploring Redex and Interdex</a></li><li><a href="https://juejin.im/post/5c21ea325188254eaa5c45b1#heading-5">Android Performance Optimization Notes (1): Startup Optimization</a></li><li><a href="https://mp.weixin.qq.com/s?__biz=MzI1MzYzMjE0MQ==&mid=2247485101&idx=1&sn=abbbb6da1aba37a04047fc210363bcc9&chksm=e9d0cd4fdea7445989cf26623a16fc8ce2876bf3bda95a5532bb0e5e5b1420765653df0b94d1&mpshare=1&scene=1&srcid=&sharer_sharetime=1565403851018&sharer_shareid=60bd7acea7881a97fbf9a6126d3e88d3#rd">Douyin R&amp;D: Improving App Start Speed over 15% via Binary File Rearrangement</a></li><li><a href="https://mp.weixin.qq.com/s?__biz=MzI4MTQyNDg3Mg==&mid=2247485301&idx=2&sn=bb1e9c17b705d0dce176f127e539dd97&chksm=eba821f2dcdfa8e4890696f0870a6f48306c0bdb7bffaab146f7250446494470245647a4eb09&mpshare=1&scene=1&srcid=0114JKmlCgbw5D3pMso2K2i8#rd">iQIYI Android Client Startup Optimization and Analysis</a></li><li><a href="https://juejin.im/post/5e6f18a951882549422ef333">In-depth Exploration of Android Startup Speed Optimization</a></li><li><a href="https://mp.weixin.qq.com/s?__biz=MzI1MzYzMjE0MQ==&mid=2247491335&idx=1&sn=e3eabd9253ab2f83925af974db3f3072&chksm=e9d0d4e5dea75df3f718744d1f5fe3aa518f7c119d3d1a7392952274fc0d90a07fad88cad133&scene=178&cur_album_id=1659632937832595461#rd">Douyin Android Performance Optimization Series: Startup Optimization Theory and Tools</a></li><li><a href="https://mp.weixin.qq.com/s/Hgjm0GaI27he7VWbPB56YA">APM Page Load Time Calibration</a></li><li><a href="https://android-developers.googleblog.com/2022/01/improving-app-performance-with-baseline.html">Improving App Performance with Baseline Profiles</a></li><li><a href="https://developer.android.google.cn/topic/performance/benchmarking/macrobenchmark-overview?hl=zh-cn">Writing Macrobenchmark</a></li><li><a href="https://mp.weixin.qq.com/s?__biz=MzkyNTUyNDA5Nw==&mid=2247486981&idx=1&sn=eb1d76b87a2f502f1f3513c6875a35a5&chksm=c0d934562b94b31bd5b3b2d683b31127a5864263c45f977653fc585b8ae77ad5ada0fa5feba4&mpshare=1&scene=1&srcid=0421huevaeKtuyzuKcIsqLmm&sharer_shareinfo=4275ded9d4ba996e20f60c901d2a9d05&sharer_shareinfo_first=4275ded9d4ba996e20f60c901d2a9d05">Startup Bottleneck Analysis with Perfetto + Macrobenchmark</a></li><li><a href="https://juejin.cn/post/7315265525772124223?share_token=47417A89-CEDC-48F3-9B99-86DD0AF8E1FE">FullyDrawnReporter: An Official Cold Start Time Tracking Helper</a></li><li><a href="https://juejin.cn/post/7389209265947754548">NetEase Cloud Music Android Baseline Profiles Practice</a></li><li><a href="https://android-developers.googleblog.com/2024/12/reddit-improved-app-startup-speed-using-baseline-profiles-r8.html?m=1&s=09">Reddit improved app startup speed by over 50% using Baseline Profiles and R8</a></li></ol><h1 id="Smoothness-Jank"><a href="#Smoothness-Jank" class="headerlink" title="Smoothness (Jank)"></a>Smoothness (Jank)</h1><ol><li><a href="https://www.androidperformance.com/en/2019/09/05/Android-Jank-Debug/">Overview of Jank and Dropped Frames in Android - Methodology</a></li><li><a href="https://www.androidperformance.com/en/2019/09/05/Android-Jank-Due-To-System/">Overview of Jank and Dropped Frames in Android - System Side</a></li><li><a href="https://www.androidperformance.com/en/2019/09/05/Android-Jank-Due-To-App/">Overview of Jank and Dropped Frames in Android - App Side</a></li><li><a href="https://www.jianshu.com/p/386bbb5fa29a">Analysis of Android Jank and Dropped Frames: Principles</a></li><li><a href="https://www.jianshu.com/p/cf531a3af828">Analysis of Android Jank and Dropped Frames: Tools</a></li><li><a href="https://www.jianshu.com/p/f1a777551b70">Analysis of Android Jank and Dropped Frames: Practice</a></li><li><a href="https://www.androidperformance.com/en/2019/01/21/android-performance-case-jank-accessbility/">Analysis of Global Jank Caused by Accessibility Services in Yingyongbao and Xunfei Input</a></li><li><a href="https://source.android.com/devices/tech/debug/eval_perf">Evaluating Performance</a></li><li><a href="https://source.android.com/devices/tech/debug/systrace">Understanding Systrace</a></li><li><a href="https://source.android.com/devices/tech/debug/ftrace">Using ftrace</a></li><li><a href="https://source.android.com/devices/tech/debug/jank_capacity">Identifying Capacity-Related Jank</a></li><li><a href="https://source.android.com/devices/tech/debug/jank_jitter">Identifying Jitter-Related Jank</a></li><li><a href="http://blog.csdn.net/tencent_bugly/article/details/51354517">Display Performance Metrics We Have Used</a></li><li><a href="https://developer.android.google.cn/topic/performance/vitals/render">Slow rendering</a></li><li><a href="https://juejin.im/post/5ae98d33518825670b33e5e6">Brief Analysis of Android Smoothness Detection Principles</a></li><li><a href="https://blog.csdn.net/msf568834002/article/details/79015497">Analysis of Android JankTracker Principles</a></li><li><a href="https://juejin.im/entry/56dce0bb5bbb50004cce752d">Android UI Performance Tuning Handbook</a></li><li><a href="https://juejin.im/post/5da33dc56fb9a04e35597a47">App Smoothness Optimization: A Tool for Quickly Identifying Time-Consuming Methods via Bytecode Instrumentation</a></li><li><a href="https://juejin.cn/post/6844904182898524168">Perhaps the First Article Explaining FPS Calculation Principles</a></li><li><a href="https://perfdog.qq.com/article_detail?id=10162&issue_id=0&plat_id=1">Explanations of Jank and Stutter Rate</a></li><li><a href="https://mp.weixin.qq.com/s?__biz=MzI1MzYzMjE0MQ==&mid=2247491520&idx=1&sn=dbd14f1d0d6107c87c137433ef435b5b">Everything You Need to Know About Live Stream Stutter Optimization</a></li><li><a href="https://mp.weixin.qq.com/s?__biz=Mzg3NTA3MDIxOA==&mid=2247487058&idx=1&sn=bce6335762c69359f4070334da589586&chksm=cec65837f9b1d121d725ade0cda57318723301b8f694151552f60ef548163f9023031d8071ca&mpshare=1&scene=1&srcid=0214DQAJPdo7lizAVpl82hZb&sharer_sharetime=1644801585009&sharer_shareid=60bd7acea7881a97fbf9a6126d3e88d3">Android JankStats Alpha Announcement</a></li><li><a href="https://juejin.cn/post/7484456544223920180?share_token=4bbeb24f-faf2-4095-ad47-fd1870228f01">Smoothness Analysis with Perfetto</a></li><li><a href="https://juejin.cn/post/7217801491188809789">Android Smoothness Toolkit: Frame Rate Monitoring</a></li><li><a href="https://mp.weixin.qq.com/s?__biz=MzAxMDM0NjExNA==&mid=2247495119&idx=1&sn=644d045571115f034f9e2c0df911dd76&chksm=9ad97e8f51e4d88401eeee990d0fbaf7ff1a101effdb3fcdea975d9e156cf4ad41d61540163d&mpshare=1&scene=1&srcid=1206Wuciv5lyPMz9a5VTG3Nj&sharer_shareinfo=984cf1d625423551241d2e9ff5cae20f&sharer_shareinfo_first=984cf1d625423551241d2e9ff5cae20f">Improving Android App Experience with ADPF Performance Hints</a></li><li><a href="https://mp.weixin.qq.com/s?__biz=MzA3MjMwMDIzNg==&mid=2649080963&idx=1&sn=a8c0938a359eaf8c96bc278d96740cb6&chksm=863a8db4097f2ab34cd78e175658386d1e22d8f2e00ed351d5732338c9cb4b5cb4104696e37a&mpshare=1&scene=1&srcid=0227cBZIXUFq2VhzuAzEc6HO&sharer_shareinfo=cc42b823dae51be07e97697888646bc3&sharer_shareinfo_first=cc42b823dae51be07e97697888646bc3">Using a Poor Input Response Issue to Demonstrate Perfetto Trace Analysis</a></li></ol><h1 id="Memory"><a href="#Memory" class="headerlink" title="Memory"></a>Memory</h1><ol><li><a href="https://mp.weixin.qq.com/s/S-YJ72qW_amYgIkBSEnsGg">Douyin Android Performance Optimization Series: NativeBitmap Solution for Java OOM</a></li><li><a href="https://mp.weixin.qq.com/s?__biz=MzI1MzYzMjE0MQ==&mid=2247491166&idx=1&sn=eca012171fbdf0a4e79f6d3dfe72d8d3&chksm=e9d0d5bcdea75caa9a5b34499cc462b461c2fe886087065df1c9f32d09a3f25620bb54c0dbbf&scene=178&cur_album_id=2220817947374174211#rd">Saving OOM! Bytedance’s Self-developed Android VM Memory Management Optimization: mSponge</a></li><li><a href="https://mp.weixin.qq.com/s?__biz=MzI1MzYzMjE0MQ==&mid=2247487267&idx=1&sn=64858e39d3c0ac3b344213856f0d9a3&chksm=e9d0c4c1dea74dd72482c94f936fa31d5609eff5f09b7ee2405e95eecba7ce00bbbb5657730b&scene=178&cur_album_id=1590407741716611075#rd">Douyin Android Performance Optimization Series: Java Memory Optimization</a></li><li><a href="https://mp.weixin.qq.com/s?__biz=MzI1MzYzMjE0MQ==&mid=2247486499&idx=1&sn=1f38a8dd301d6fe1d0b62f7e027113de&chksm=e9d0c7c1dea74ed70621fb46b1f081626177610d98e1fbb4c4867099eb43edc051f61f1a2371&scene=178&cur_album_id=1568330323321470981#rd">Analysis of Android Camera Memory Issues</a></li><li><a href="https://mp.weixin.qq.com/s/yYb4pkkb30SCEGrb2w_evQ">Analysis of a Massive JVM Native Memory Leak (64M Issue)</a></li><li><a href="https://juejin.cn/post/7027025137320853534">Android Native | GWP-ASan: A Sampling-based Memory Debugging Tool</a></li><li><a href="https://juejin.cn/post/7013595058125406238">Android Native | MTE: The Ultimate Weapon for Memory Issues</a></li><li><a href="https://www.androidperformance.com/en/2019/09/18/Android-Jank-Due-To-Low-Memory/">Impact of Low Memory on Performance in Android</a></li><li><a href="https://source.android.com/devices/tech/perf/low-ram">Low RAM Configuration</a></li><li><a href="http://www.tinylab.cn/linux-swap-and-zramfs/#zram-">Detailed Explanation of Linux Swap and Zram</a></li><li><a href="http://www.tinylab.cn/android-loading-a-different-relationship-between-dpi-and-memory-consumption-of-resources/">Relationship Between Loading Different DPI Resources and Memory Consumption in Android</a></li><li><a href="https://nekosc.com/technology/zram.html">Explanation of ZRAM SWAP Memory</a></li><li><a href="https://tech.meituan.com/oom_analysis.html">Analysis of Android OOM Cases</a></li><li><a href="https://www.androidperformance.com/en/2015/07/20/Android-Performance-Memory-AndroidResource/">Android Code Memory Optimization Suggestions: Resources</a></li><li><a href="https://www.androidperformance.com/en/2015/07/20/Android-Performance-Memory-Google/">Android Code Memory Optimization Suggestions: Google Official</a></li><li><a href="https://www.androidperformance.com/en/2015/07/20/Android-Performance-Memory-Java/">Android Code Memory Optimization Suggestions: Java Official</a></li><li><a href="https://www.androidperformance.com/en/2015/04/11/AndroidMemory-Usage-Of-MAT/">Android Memory Optimization (1): Introduction to MAT</a></li><li><a href="https://www.androidperformance.com/en/2015/04/11/AndroidMemory-Usage-Of-MAT-Pro/">Android Memory Optimization (2): Advanced MAT Usage</a></li><li><a href="https://www.androidperformance.com/en/2015/04/11/AndroidMemory-Open-Bitmap-Object-In-MAT/">Android Memory Optimization (3): Viewing Bitmap Images in MAT</a></li><li><a href="https://www.androidperformance.com/en/2015/07/20/Android-Performance-Memory-onTrimMemory/">Android Code Memory Optimization Suggestions: OnTrimMemory</a></li><li><a href="http://gityuan.com/2016/09/17/android-lowmemorykiller/">Analysis of Android LowMemoryKiller Principles</a></li><li><a href="https://juejin.im/post/59e818bb6fb9a044fd10de38">Principles of Android Anonymous Shared Memory (Ashmem)</a></li><li><a href="https://mp.weixin.qq.com/s?__biz=MzAwMDUwNDgxOA==&mid=2652664286&idx=1&sn=370af253ab45e8ce6da7c7eaeae0fbd1&chksm=810f3743b678be55df8f08dd554586e7e6a4e93fe61a9c557f5b161a6242eee6cd463f68a7e9&mpshare=1&scene=1&srcid=0425PBKSCz1pnccS17NcC4GX%23rd">Hao Jian: Linux Memory Management Study Notes - Lecture 1</a></li><li><a href="https://mp.weixin.qq.com/s?__biz=MzAwMDUwNDgxOA==&mid=2652664286&idx=2&sn=d6f22ef91a616e8e9232217e6dea96d4&chksm=810f3743b678be559350754a23bae993303f785ab9a46e71c09dc52ac980dd53b0d8ea7d2892&mpshare=1&scene=1&srcid=0425t2vpFk5Q1h02R7jrapFy%23rd">Hao Jian: Linux Memory Management Study Notes - Lecture 2</a></li><li><a href="https://mp.weixin.qq.com/s?__biz=MzAwMDUwNDgxOA==&mid=2652664286&idx=3&sn=9124b05c129eedc47e6dd222779a4ea6&chksm=810f3743b678be556d267e68102911aaaa68a31299705c5714a184e97478f45c8aa69cb96472&mpshare=1&scene=1&srcid=0425yjP3kUsqYPi4WgBMNs0q%23rd">Hao Jian: Linux Memory Management Study Notes - Lecture 3</a></li><li><a href="https://mp.weixin.qq.com/s?__biz=MzAwMDUwNDgxOA==&mid=2652664305&idx=1&sn=4f6de1dedec10704704ece849d395525&chksm=810f376cb678be7a7a18a7a3626615e5b8ecedae737a3f18d01db6a1af59cc04529832d1f7cb&mpshare=1&scene=1&srcid=0425iqjnsJkZEnueYQGAhWkj%23rd">Hao Jian: Linux Memory Management Study Notes - Lecture 4</a></li><li><a href="https://mp.weixin.qq.com/s?__biz=MzAwMDUwNDgxOA==&mid=2652664329&idx=1&sn=6b7841d49a5ddff8383097a3c60490e9&chksm=810f3494b678bd82fa38e95fa07e411820499f5a4a772ac60a9ade35bde48c248a30929758a1&mpshare=1&scene=1&srcid=0425aPqzRj0bES2nCueOQMqb%23rd">Hao Jian: Linux Memory Management Study Notes - Lecture 5</a></li><li><a href="https://mp.weixin.qq.com/s?__biz=MzAwMDUwNDgxOA==&mid=2652664344&idx=1&sn=e5975e775e25e2ad1612c9dda5df52f4&chksm=810f3485b678bd933fa0c4a5bcad4298ae797724614018933f426a53b952d130557badd19518&mpshare=1&scene=1&srcid=04262p3N4EDsCVq23hxqLteY%23rd">Hao Jian: Linux Memory Management Study Notes - Lecture 6</a></li><li><a href="https://developer.android.google.cn/topic/performance/memory">Manage your app’s memory</a></li><li><a href="https://developer.android.google.cn/topic/performance/memory-overview">Overview of memory management</a></li><li><a href="https://mp.weixin.qq.com/s?__biz=MjM5NzMyMjAwMA==&mid=2651481746&idx=1&sn=17ffd1a167e6cd4abb71ef84a1d78dac&chksm=bd250aed8a5283fb9a09a166b58606dc7bccf03eef3e28594470a84f94ef4db1b0c2cc5e5fb6&mpshare=1&scene=1&srcid=0916ILFD69CAZIwr7fzDjip8%23rd">Summary of Checking Process Memory Consumption in Linux</a></li><li><a href="https://blog.csdn.net/mychen/article/details/80001687">Tracing Native Heap Memory Leaks on the Android Platform</a></li><li><a href="http://www.wowotech.net/memory_management/458.html">Brief Discussion on Cache Memory</a></li><li><a href="https://juejin.im/post/5bfbd5406fb9a049be5d2a20">Detailed Discussion on Bitmap Optimization</a></li><li><a href="https://mp.weixin.qq.com/s/EerrwaRGdTkOFPLrg8_-oQ">Exploring Android Memory Optimization Methods</a></li><li><a href="https://mp.weixin.qq.com/s?__biz=MzAxMTI4MTkwNQ==&mid=2650828463&idx=1&sn=414bdd7012ed465664d3b99ec8f55566&chksm=80b7ba31b7c03327e86c08a9be9216b51788bce46a33be3444e1f306802be3f62d9f72a3e45d&mpshare=1&scene=1&srcid=#rd">Solve 90% of App Memory Abnormalities with This Article</a></li><li><a href="https://juejin.im/post/5b1b5e29f265da6e01174b84">Practicing App Memory Optimization: Orderly Analysis and Optimization</a></li><li><a href="https://mp.weixin.qq.com/s/dUCrkGGSvIzYwOxBNd-Ltw">Talking About Memory Compression</a></li><li><a href="https://mp.weixin.qq.com/s/pwOFI-l2seDrZgik-KvIMg">Principles and Applications of dumpsys meminfo</a></li><li><a href="https://juejin.cn/post/6844904113046568973">Binder | Essence and Evolution of Memory Copying</a></li><li><a href="https://mp.weixin.qq.com/s/V7sK1WwQ4D3LikK2AHgrZQ">Memory Optimization: Texture Compression Techniques</a></li><li><a href="https://www.jianshu.com/p/f25539c80768">Using Perfetto to Analyze Android Native Physical Memory Leaks</a></li><li><a href="https://www.jianshu.com/p/b609f34f77c4">Using Android Profiler to Analyze Android Native Physical Memory Leaks</a></li><li><a href="https://www.jianshu.com/p/ab7bbc319dd9">Dynamic App Memory Detection via Android JVMTI</a></li><li><a href="https://juejin.cn/post/7065931214120550413">ThreadLocal Source Code Analysis and Potential Memory Leak Issues</a></li><li><a href="https://juejin.cn/post/7063068797304832030">Can Activities Be Reclaimed Even If the App Is in the Foreground?</a></li><li><a href="https://mp.weixin.qq.com/s?__biz=MjM5ODYwMjI2MA==&mid=2649784368&idx=1&sn=387c3ecda352f1dff29c41a5edb4fd04&chksm=becc134b89bb9a5dd72305133375e0062375326bae512ecb825472b28aea139283298cf06c83&mpshare=1&scene=1&srcid=0702L35luROWWJuiZ45TDkuJ&sharer_shareinfo=e68161a0d00350ead5ec087e1336e3cc&sharer_shareinfo_first=e68161a0d00350ead5ec087e1336e3cc">Android Native Memory Leak Detection: Detailed Solution</a></li><li><a href="https://juejin.cn/post/7510900838765248522?share_token=4b12aa26-8395-4f2b-a38e-e11fe4e501e8">Android Native Memory Leak Detection: Principles and Tools in Practice</a></li><li><a href="https://mp.weixin.qq.com/s?__biz=MzA3MjMwMDIzNg==&mid=2649081126&idx=1&sn=d95efb99c39e96db31f87e5253b95a54&chksm=86cf5aa8bd1ad6a8ebef73687546b75d04e6e0145fcf4be49c989a1752e34e23a94f72fb0f56&mpshare=1&scene=1&srcid=0517JAncRkP7gGhG1WzxWBvU&sharer_shareinfo=ecd5e79211853de7ce50ddf7f4413c68&sharer_shareinfo_first=ecd5e79211853de7ce50ddf7f4413c68">Android App VM Memory Performance Optimization Ideas</a></li><li><a href="https://mp.weixin.qq.com/s?__biz=MzkzOTQ4NDUyNg==&mid=2247492856&idx=1&sn=2d2e771928552f941b48a94b0a289af0&chksm=c3d7aaffbde0f9cd1744282ad5e1ef8cd73bb5e831244e9234b40fc6d73969a1027dc2759046&mpshare=1&scene=1&srcid=12043kpkgyxdxrRdorAwH09n&sharer_shareinfo=9f678d8c6523bcadbd869d653892c503&sharer_shareinfo_first=9f678d8c6523bcadbd869d653892c503">Perfetto Native Memory Leak Analysis Practice Notes</a></li><li><a href="https://android-developers.googleblog.com/2024/12/get-your-apps-ready-for-16-kb-page-size-devices.html?m=1">Get your apps ready for 16 KB page size devices</a></li></ol><h1 id="Graphics-Stack"><a href="#Graphics-Stack" class="headerlink" title="Graphics Stack"></a>Graphics Stack</h1><ol><li><a href="https://www.cnblogs.com/roger-yu/p/15641545.html">Android 12(S) Graphics System - Introduction</a></li><li><a href="https://www.cnblogs.com/roger-yu/p/15702027.html">Android 12(S) Graphics System - Basic Concepts (1)</a></li><li><a href="https://www.cnblogs.com/roger-yu/p/15707940.html">Android 12(S) Graphics System - Sample Apps (2)</a></li><li><a href="https://www.cnblogs.com/roger-yu/p/15714247.html">Android 12(S) Graphics System - Communication Between App and SurfaceFlinger (3)</a></li><li><a href="https://www.cnblogs.com/roger-yu/p/15761646.html">Android 12(S) Graphics System - SurfaceFlinger Startup and Message Queue (4)</a></li><li><a href="https://www.cnblogs.com/roger-yu/p/15768028.html">Android 12(S) Graphics System - createSurface Flow (5)</a></li><li><a href="https://www.cnblogs.com/roger-yu/p/15773008.html">Android 12(S) Graphics System - Intro to BufferQueue&#x2F;BLASTBufferQueue (6)</a></li><li><a href="https://www.cnblogs.com/roger-yu/p/15773010.html">Android 12(S) Graphics System - Common Classes (7)</a></li><li><a href="https://mp.weixin.qq.com/s/MuPX4s46tR7Hn_ak51x95Q">Android Display Pipeline and Process Scheduling</a></li><li><a href="https://www.androidperformance.com/en/2019/07/27/Android-Hardware-Layer/">Detailed Explanation of Hardware Layer in Android</a></li><li><a href="https://zhuanlan.zhihu.com/p/25477828">Introduction to Hardware Acceleration Principles and Implementation in Android</a></li><li><a href="http://gityuan.com/2017/02/05/graphic_arch/">Overview of Android Graphics System</a></li><li><a href="http://gityuan.com/2017/02/25/choreographer/">Choreographer Principles</a></li><li><a href="http://gityuan.com/2017/02/11/surface_flinger/">SurfaceFlinger Startup</a></li><li><a href="http://gityuan.com/2017/02/18/surface_flinger_2/">SurfaceFlinger Drawing</a></li><li><a href="http://blog.csdn.net/luoshengyang/article/details/45601143">Brief Intro and Study Plan for Android App UI Hardware Acceleration</a></li><li><a href="http://blog.csdn.net/luoshengyang/article/details/45769759">Initialization Process of Android App UI Hardware Acceleration</a></li><li><a href="http://blog.csdn.net/luoshengyang/article/details/45831269">Asset Atlas Service in Android App UI Hardware Acceleration</a></li><li><a href="http://blog.csdn.net/luoshengyang/article/details/45943255">Display List Construction in Android App UI Hardware Acceleration</a></li><li><a href="http://blog.csdn.net/luoshengyang/article/details/46281499">Display List Rendering in Android App UI Hardware Acceleration</a></li><li><a href="http://blog.csdn.net/luoshengyang/article/details/46449677">Animation Execution in Android App UI Hardware Acceleration</a></li><li><a href="https://www.jianshu.com/p/40f660e17a73">Android Hardware Acceleration (1): A Simple Explanation of Principles</a></li><li><a href="https://www.jianshu.com/p/dd800800145b">Android Hardware Acceleration (2): RenderThread and OpenGL GPU Rendering</a></li><li><a href="https://blog.csdn.net/jinzhuojun/article/details/39698317">GraphicBuffer Sync Mechanism in Android: Fence</a></li><li><a href="https://www.jianshu.com/p/824a9ddf68b9">Android P Graphics System (1): Hardware Compositor HWC2</a></li><li><a href="https://www.jianshu.com/p/dd0b38832346">Android P Graphics System (2): GraphicBuffer and Gralloc Analysis</a></li><li><a href="https://www.jianshu.com/p/abfaea892611">Android P Graphics System (3): Android HWUI Rendering Flow</a></li><li><a href="https://www.jianshu.com/p/c4ea60bc73d2">Android P Graphics System (4): Android VirtualDisplay Analysis</a></li><li><a href="https://www.jianshu.com/p/8e7a9a0b5726">Android P Graphics System (5): Interaction Between Client and SurfaceFlinger</a></li><li><a href="https://www.jianshu.com/p/fa115146949f">Android P Graphics System (6): SurfaceFlinger Composition (1)</a></li><li><a href="https://www.jianshu.com/p/fd16dcb4dfb6">Android P Graphics System (7): SurfaceFlinger Composition (2)</a></li><li><a href="https://www.jianshu.com/p/cf4455021fd5">Android P Graphics System (8): SurfaceFlinger Composition (3)</a></li><li><a href="https://www.jianshu.com/p/b1b75ab6f17f">Android P Graphics System (9): Overview of Android Graphics Output</a></li><li><a href="https://www.jianshu.com/p/81e9c814f10a">Android P Graphics System (10): BufferQueue (1)</a></li><li><a href="https://www.jianshu.com/p/f808813880b0">Android P Graphics System (11): BufferQueue (2)</a></li><li><a href="https://www.jianshu.com/p/6d83dea3652b">Android P Graphics System (12): BufferQueue (3)</a></li><li><a href="https://zhuanlan.zhihu.com/p/78758247">Rasterization in Rendering Pipeline (1)</a></li><li><a href="https://zhuanlan.zhihu.com/p/81974121">Rasterization in Rendering Pipeline (2)</a></li><li><a href="https://mp.weixin.qq.com/s?__biz=MzU5NjkxMjE5Mg==&mid=2247485393&idx=1&sn=025f763f5eec1a7114a18212b9dc2b08&chksm=ff0c0b28c37466e199e41e267a0757f7dc7bb9875fd61707040d2148934e43d4c26391f80b2d&mpshare=1&scene=1&srcid=0207tZ5rj2V8SmvHj67hLNhA&sharer_shareinfo=50710108b04b3ee345ca7ee8516ff516&sharer_shareinfo_first=50710108b04b3ee345ca7ee8516ff516">Analyzing Android Rendering with Source Code and Perfetto</a></li><li><a href="https://mp.weixin.qq.com/s?__biz=MzA3MjMwMDIzNg==&mid=2649081083&idx=1&sn=cc039a2de0eea9d595563dc6c27fa1dd&chksm=86303bc59f6bb42c7a2c030c72b2455b82b7310f44d22ef0d527d25745e2182958e7c5731a92&mpshare=1&scene=1&srcid=0512vTiEXcrUaXEUYsU06jTf&sharer_shareinfo=469eebccdb5589c9612d1ec373b99d10&sharer_shareinfo_first=469eebccdb5589c9612d1ec373b99d10">Android App System Rendering Pipeline Optimization Notes</a></li><li><a href="https://mp.weixin.qq.com/s?__biz=MzA3MjMwMDIzNg==&mid=2649081101&idx=1&sn=721f5251cc6318b3cc9c4a8145d162d5&chksm=86455efc8def655916536d269a4d4c4501b2610ed4651782c6365e64e32df4e93bb8d996d21e&mpshare=1&scene=1&srcid=0513vjOINYOUNME0yx9KjuVu&sharer_shareinfo=d6281fc299d49c83c46e16747629a4b9&sharer_shareinfo_first=d6281fc299d49c83c46e16747629a4b9">Android App System Rendering Pipeline Main Flow Optimization</a></li><li><a href="https://mp.weixin.qq.com/s?__biz=MzIyMDg5MzEyMA==&mid=2247489288&idx=1&sn=17a54ce60dc4d9eb18b6d52f50cade2e&chksm=966652c0924b5c94beaef74d064f916134f7cda6318d4a25f176cf27855f5518583ffccc49ca&mpshare=1&scene=1&srcid=0704nMl8fxYymCsjMBA24lE1&sharer_shareinfo=2300d39c53cf1829cc5ef6716a7b4293&sharer_shareinfo_first=2300d39c53cf1829cc5ef6716a7b4293">Deep Dive into SurfaceFlinger: Overview</a></li><li><a href="https://mp.weixin.qq.com/s?__biz=MzA3MjMwMDIzNg==&mid=2649081051&idx=1&sn=1a2f379bf23af5de78fb6fd2ecda16f3&chksm=86b6aa0d954b10d345c0d2163cf2b5a6fa5681442709de0cbc5f4a9928a51cd1afbfa5677896&mpshare=1&scene=1&srcid=0423jRRyCqm6MAKq1o8XEUB1&sharer_shareinfo=261579247e24b4d887dc7c3d057e0fe2&sharer_shareinfo_first=261579247e24b4d887dc7c3d057e0fe2">OPPO ColorOS Aurora Engine Parallel Rendering Architecture</a></li></ol><h1 id="Virtual-Machine-ART-x2F-Dalvik"><a href="#Virtual-Machine-ART-x2F-Dalvik" class="headerlink" title="Virtual Machine (ART&#x2F;Dalvik)"></a>Virtual Machine (ART&#x2F;Dalvik)</h1><ol><li><a href="https://juejin.cn/post/6875678394332217357">ART VM | GC Trigger Timing and Conditions</a></li><li><a href="https://juejin.cn/post/7088976209387716622">ART VM | Large Object Space</a></li><li><a href="https://juejin.cn/post/6888987190857039885">ART VM | Intermediate Links in JNI Calls</a></li><li><a href="https://juejin.cn/post/6891918738846105614">ART VM | Finalize’s Replacement Cleaner</a></li><li><a href="https://juejin.cn/post/6894153239907237902">ART VM | Making GC Synchronously Reclaim Native Memory</a></li><li><a href="https://juejin.cn/post/6950920684768296996">ART VM | Memory Structure of Java Objects and Classes</a></li><li><a href="https://juejin.cn/post/6955322183895908366">ART VM | Static vs. Dynamic JNI Registration</a></li><li><a href="https://juejin.cn/post/6956213033806872606">ART VM | Locks</a></li><li><a href="https://juejin.cn/post/6966169836703449119">ART VM | SIGSEGV Signal Handling Flow in Android Apps</a></li><li><a href="http://lihaizhou.top/2021/11/01/%E7%AC%AC%E4%B8%89%E8%A7%86%E8%A7%92-%E4%B8%80%E4%B8%AAART-GC%E7%9A%84%E4%BC%98%E5%8C%96%E6%95%85%E4%BA%8B/">Third Perspective: An ART GC Optimization Story</a></li><li><a href="http://lihaizhou.top/2021/09/08/GC%E8%B6%85%E6%97%B6%E5%AF%BC%E8%87%B4%E7%9A%84%E5%90%8E%E5%8F%B0%E5%BA%94%E7%94%A8%E5%B4%A9%E6%BA%83%E9%97%AE%E9%A2%98%E5%88%86%E6%9E%90/">Analysis of Background App Crashes Due to GC Timeout</a></li><li><a href="https://mp.weixin.qq.com/s/ayhmYTbmnIThGQ-GH5cP2A">Understanding ART in Android 10 (Part 1)</a></li><li><a href="https://mp.weixin.qq.com/s/Vea97ljPww8QfAEmATtKGg">Understanding ART in Android 10 (Part 2)</a></li><li><a href="https://mp.weixin.qq.com/s/rBxBoOUyXtUBcFqfYdxl_g">Understanding ART in Android 10 (Part 3)</a></li><li><a href="https://mp.weixin.qq.com/s/K3JFUIKYfO4hrqLA-4BqfA">Understanding ART in Android 10 (Part 4)</a></li><li><a href="https://mp.weixin.qq.com/s/06uEMSVo-nnynNj5FbXQKA">Understanding ART in Android 10 (Part 5)</a></li><li><a href="https://source.android.com/devices/tech/dalvik/">ART and Dalvik</a></li><li><a href="https://source.android.com/devices/tech/dalvik/improvements">Android 8.0 ART Improvements</a></li><li><a href="https://source.android.com/devices/tech/dalvik/dalvik-bytecode">Dalvik bytecode</a></li><li><a href="https://source.android.com/devices/tech/dalvik/dex-format">Dalvik Executable format</a></li><li><a href="https://source.android.com/devices/tech/dalvik/instruction-formats">Dalvik Executable instruction formats</a></li><li><a href="https://source.android.com/devices/tech/dalvik/constraints">Constraints</a></li><li><a href="https://source.android.com/devices/tech/dalvik/configure">Configuring ART</a></li><li><a href="https://source.android.com/devices/tech/dalvik/gc-debug">Debugging ART Garbage Collection </a></li><li><a href="https://source.android.com/devices/tech/dalvik/jit-compiler">Implementing ART Just-In-Time (JIT) Compiler</a></li><li><a href="https://zhuanlan.zhihu.com/p/24414378">Deep Learning Android: VM &amp; Runtime</a></li><li><a href="https://zhuanlan.zhihu.com/p/24534940">Android Performance Optimization: VM Tuning</a></li><li><a href="https://paul.pub/android-dalvik-vm/">Dalvik VM on Android</a></li><li><a href="https://paul.pub/android-art-vm/">ART VM on Android</a></li><li><a href="https://zhuanlan.zhihu.com/p/89536376">Android ART Concurrent Copying GC</a></li><li><a href="https://mp.weixin.qq.com/s/pmtbK8aezOcd_yBjGu4n7g">Brief Analysis of Android ART dex2oat</a></li><li><a href="https://developer.android.google.cn/reference/dalvik/annotation/optimization/FastNative">FastNative</a></li><li><a href="https://mp.weixin.qq.com/s?__biz=MzI4NTk1NzYwNg==&mid=2247483677&idx=1&sn=cf95915bdb0fd8f189f8135127b41ae3&chksm=ebe50d94dc92848242e96fbb1d99873ab5e80174dc7cd92ad6e0ce3e9db352c586afc0d8bcc4&mpshare=1&scene=1&srcid=0522HWs0JfKKm4CBWfbTDwU2&sharer_shareinfo=9977bbe21c9c8f9f854eed586025c6fd&sharer_shareinfo_first=660cfede50bd58b5de96bf8051837281">Android ART: Falling Back to Interpretation</a></li></ol><h1 id="System-Framework"><a href="#System-Framework" class="headerlink" title="System Framework"></a>System Framework</h1><ol><li><a href="https://www.jianshu.com/p/df46e4b39428">Android Screen Display Process Analysis (1)</a></li><li><a href="https://www.jianshu.com/p/f96ab6646ae3">Android Screen Display Process Analysis (2)</a></li><li><a href="https://www.jianshu.com/p/3c61375cc15b">Android Screen Display Process Analysis (3)</a></li><li><a href="https://www.jianshu.com/p/7a18666a43ce">Android Screen Display Process Analysis (4)</a></li><li><a href="https://www.jianshu.com/p/dcaf1eeddeb1">Android Screen Display Process Analysis (5)</a></li><li><a href="https://source.android.com/devices/tech/perf/task-snapshots">Task Snapshots</a></li><li><a href="https://zhuanlan.zhihu.com/p/29152319">Android Input Subsystem: Creation of Input Process, Startup of Listening Thread</a></li><li><a href="https://zhuanlan.zhihu.com/p/29386642">Android Input Subsystem: Generation, Reading, and Dispatch of Input Events, InputReader, InputDispatcher</a></li><li><a href="https://zhuanlan.zhihu.com/p/30127752">EventHub and Interaction with Devices, Input Events</a></li><li><a href="https://zhuanlan.zhihu.com/p/29929031">Android Message Mechanism: Analysis from Java Layer to Native Layer</a></li><li><a href="https://paul.pub/android-binder-driver/">Understanding Android Binder Mechanism (1&#x2F;3): Driver Chapter</a></li><li><a href="https://paul.pub/android-binder-cpp/">Understanding Android Binder Mechanism (2&#x2F;3): C++ Layer</a></li><li><a href="https://paul.pub/android-binder-java/">Understanding Android Binder Mechanism (3&#x2F;3): Java Layer</a></li><li><a href="http://blog.csdn.net/universus/article/details/6211589">Android Binder Design and Implementation - Design Chapter</a></li><li><a href="http://gityuan.com/2017/05/19/ams-abstract/">Overview of the Four Major Components</a></li><li><a href="http://gityuan.com/2017/06/11/activity_record/">The Four Major Components: ActivityRecord</a></li><li><a href="http://gityuan.com/2017/06/04/content_provider_record/">The Four Major Components: ContentProviderRecord</a></li><li><a href="http://gityuan.com/2017/06/03/broadcast_record/">The Four Major Components: BroadcastRecord</a></li><li><a href="http://gityuan.com/2017/05/25/service_record/">The Four Major Components: ServiceRecord</a></li><li><a href="http://gityuan.com/2017/04/16/activity-with-window/">Brief Introduction to the Relationship Between Activity and Window</a></li><li><a href="http://gityuan.com/2017/04/09/android_context/">Understanding Android Context</a></li><li><a href="http://gityuan.com/2017/04/02/android-application/">Understanding the Application Creation Process</a></li><li><a href="http://gityuan.com/2017/01/22/start-activity-wms/">Viewing startActivity from a Window Perspective</a></li><li><a href="http://gityuan.com/2017/01/15/wms_starting_window/">WMS—Starting Window</a></li><li><a href="http://gityuan.com/2017/01/08/windowmanger/">WMS—Startup Process</a></li><li><a href="https://zhuanlan.zhihu.com/p/35519585">Analysis of Binder Principles for Android Application Engineers</a></li><li><a href="http://gityuan.com/2015/10/31/binder-prepare/">Binder Series—Introduction</a></li><li><a href="http://gityuan.com/2015/11/01/binder-driver/">Binder Series 1—First Look at Binder Driver</a></li><li><a href="http://gityuan.com/2015/11/02/binder-driver-2/">Binder Series 2—Second Look at Binder Driver</a></li><li><a href="http://gityuan.com/2015/11/07/binder-start-sm/">Binder Series 3—Starting ServiceManager</a></li><li><a href="http://gityuan.com/2015/11/08/binder-get-sm/">Binder Series 4—Getting ServiceManager</a></li><li><a href="http://gityuan.com/2015/11/14/binder-add-service/">Binder Series 5—Registering Service (addService)</a></li><li><a href="http://gityuan.com/2015/11/15/binder-get-service/">Binder Series 6—Getting Service (getService)</a></li><li><a href="http://gityuan.com/2015/11/21/binder-framework/">Binder Series 7—Framework Layer Analysis</a></li><li><a href="http://gityuan.com/2015/11/22/binder-use/">Binder Series 8—How to Use Binder</a></li><li><a href="http://gityuan.com/2015/11/23/binder-aidl/">Binder Series 9—How to Use AIDL</a></li><li><a href="http://gityuan.com/2015/11/28/binder-summary/">Binder Series 10—Summary</a></li><li><a href="http://gityuan.com/2016/09/04/binder-start-service/">Thorough Understanding of Android Binder Communication Architecture</a></li><li><a href="http://weishu.me/2016/01/12/binder-index-for-newer/">Binder Learning Guide</a></li><li><a href="https://wetest.qq.com/lab/view/352.html">Do you know Android’s MessageQueue.IdleHandler?</a></li><li><a href="https://my.oschina.net/youranhongcha/blog/492591?p=2">Let’s Talk About Android’s Message Mechanism</a></li><li><a href="https://mp.weixin.qq.com/s/69ndd2NCx27JWxJGEqTQBg">Talking About APK (Part 1) —— The Black Magic of Directly Running Dex Files</a></li><li><a href="https://mp.weixin.qq.com/s?__biz=MzIxNDE1NjQ2Mw==&mid=2649872639&idx=1&sn=94bd74f4fe5d18c839c14e2cb8c2856b&chksm=8faead3fb8d924293764698889f419bdde71c9b523acf98edba313f3ec6b75b7d8332f43c9c6&mpshare=1&scene=1&srcid=&sharer_sharetime=1565860096242&sharer_shareid=60bd7acea7881a97fbf9a6126d3e88d3#rd">Talking About APK (Part 2) —— Dex Hotfix and Classpath</a></li><li><a href="https://mp.weixin.qq.com/s?__biz=MzIxNDE1NjQ2Mw==&mid=2649872646&idx=1&sn=61f3f4bf96a9244292f264de3a60bc34&chksm=8faeacc6b8d925d0aaa93141e3232e5c125307fe2e731dd63a4a0740eb71c54275739daf0ab1&mpshare=1&scene=1&srcid=&sharer_sharetime=1565860101974&sharer_shareid=60bd7acea7881a97fbf9a6126d3e88d3#rd">Talking About APK (Part 3) —— The Secret of Android Resource Compilation</a></li><li><a href="https://juejin.im/post/5e9728c5e51d4547185f919e?utm_source=gold_browser_extension">Lu Banshan - Reflection | Design and Implementation of Android Event Interception Mechanism</a></li><li><a href="https://juejin.im/post/5e85aa5e6fb9a03c341d9737">Lu Banshan - The Essence and Evolution of Binder Memory Copying</a></li><li><a href="https://juejin.im/post/5e8caa97518825738a5ace08">Lu Banshan - The Essence of inout in AIDL</a></li><li><a href="https://juejin.im/post/5e993b87e51d4546d962075c">Lu Banshan - Binder’s Exception Mechanism</a></li><li><a href="https://juejin.im/post/5daaf2b1e51d4524b601bb0b">Lu Banshan - Proxy Mechanism in the Binder World (Part 1)</a></li><li><a href="https://juejin.im/post/5d9fea976fb9a04de237a5af">Lu Banshan - Binder Overview</a></li><li><a href="https://juejin.cn/post/7021558328421515271">Lu Banshan - Binder | Object Lifecycle</a></li><li><a href="https://juejin.cn/post/7024432171779620894">Lu Banshan - Binder | Proxy Object Leaks and Their Detection</a></li><li><a href="https://sharrychoo.github.io/blog/android-source/graphic-choreographer">Android System Architecture —— Choreographer’s Working Mechanism</a></li><li><a href="https://mp.weixin.qq.com/s/IHQDWKYJY6lbEGZZxPT8lw">Looper’s Wake Mechanism Upgrade</a></li><li><a href="https://mp.weixin.qq.com/s?__biz=MjM5NDk5ODQwNA==&mid=2652469018&idx=1&sn=b6a21164fffda38bf1fe423a8bba4a57&chksm=bd12e6f18a656fe7c59b3b1af47b436bd2472b51e2b12477ab9e87175688299e58c59a2582c5&scene=21#wechat_redirect">Android 10.0 Binder Communication Principle (1) Binder, HwBinder, VndBinder Overview</a></li><li><a href="https://mp.weixin.qq.com/s?__biz=MjM5NDk5ODQwNA==&mid=2652469152&idx=1&sn=ca5f0873cccd3413af1b822ea9fdcaae&chksm=bd12e64b8a656f5d44b8199ce8e16af0a72742071f44a34d68d790a1f93dd9bc9344d57162a4&scene=21#wechat_redirect">Android 10.0 Binder Communication Principle (2) - Binder Introduction</a></li><li><a href="https://mp.weixin.qq.com/s?__biz=MjM5NDk5ODQwNA==&mid=2652469154&idx=1&sn=ddab595f47b4f9ae228d174b447a2fd2&chksm=bd12e6498a656f5fadb1ad10c7e92d4b5d50bc0f08387fa7069aeb0be96264dc05891b8787ef&scene=21#wechat_redirect">Android 10.0 Binder Communication Principle (3) - ServiceManager Chapter</a></li><li><a href="https://mp.weixin.qq.com/s?__biz=MjM5NDk5ODQwNA==&mid=2652469156&idx=1&sn=7793b15df568f2d28e270bf1092ee37d&chksm=bd12e64f8a656f59a0596e00de96db582556cca78b38b334164aad64c804731cedb579b396e4&scene=21#wechat_redirect">Android 10.0 Binder Communication Principle (4) - Native-C\C++ Example Analysis</a></li><li><a href="https://mp.weixin.qq.com/s?__biz=MjM5NDk5ODQwNA==&mid=2652469158&idx=1&sn=20e56da97c531da01f96515da9777159&chksm=bd12e64d8a656f5bc34a3b5017517016661b289d0b1b08493da574f8da942586f17fa1478637&scene=21#wechat_redirect">Android 10.0 Binder Communication Principle (5) - Binder Driver Analysis</a></li><li><a href="https://mp.weixin.qq.com/s?__biz=MjM5NDk5ODQwNA==&mid=2652469160&idx=1&sn=c799a8dea63903e8d2293d352c958a51&chksm=bd12e6438a656f5593941640f5f29937066a96a3038b2c51e5f7f912d987f3f13a7c19ac42e0&scene=21#wechat_redirect">Android 10.0 Binder Communication Principle (6) - How Binder Data Achieves Targeted Delivery</a></li><li><a href="https://mp.weixin.qq.com/s?__biz=MjM5NDk5ODQwNA==&mid=2652469166&idx=1&sn=79603ed6eabd767320be1374da82be3a&chksm=bd12e6458a656f53d37f4108fd4ba576a2c5722773bca293544cd4a18739a6a775e3d4ae4536&scene=21#wechat_redirect">Android 10.0 Binder Communication Principle (7) - Framework Binder Example</a></li><li><a href="https://mp.weixin.qq.com/s?__biz=MjM5NDk5ODQwNA==&mid=2652469168&idx=1&sn=6360b7fd3c4b93e426ec232e7dfe23d4&chksm=bd12e65b8a656f4de0ec426d381dba2b8dd969b03c83e18e6f002a55bf7af7c4616139567d3b&scene=21#wechat_redirect">Android 10.0 Binder Communication Principle (8) - Framework Layer Analysis</a></li><li><a href="https://mp.weixin.qq.com/s?__biz=MjM5NDk5ODQwNA==&mid=2652469170&idx=1&sn=c9c4ff24bec544d8435b55fe87274b7e&chksm=bd12e6598a656f4f9daa31544126182d6ac86f7efe8f4031359867b7651247eea00ef486c0c5&scene=21#wechat_redirect">Android 10.0 Binder Communication Principle (9) - AIDL Binder Example</a></li><li><a href="https://mp.weixin.qq.com/s?__biz=MjM5NDk5ODQwNA==&mid=2652469171&idx=1&sn=6b8498ad20051d343d6f4808d021aa52&chksm=bd12e6588a656f4eb5ec89dff303b8525091696e56e529dd22ffb9512f02b67b5b1546cb2f93&scene=21#wechat_redirect">Android 10.0 Binder Communication Principle (10) - AIDL Principle Analysis - Proxy-Stub Design Pattern</a></li><li><a href="https://juejin.cn/post/6922704248195153927">Android Framework | A New Application Startup Mechanism: USAP</a></li><li><a href="https://carsonho.blog.csdn.net/article/details/73560642">Android Inter-process Communication: Illustrated Explanation of Binder Mechanism Principles</a></li><li><a href="https://www.cnblogs.com/roger-yu/p/15099541.html">Android Native – Message&#x2F;Handler&#x2F;Looper Mechanism (Principle Chapter)</a></li><li><a href="https://www.cnblogs.com/roger-yu/p/15100416.html">Android Native – Message&#x2F;Handler&#x2F;Looper Mechanism (Application Chapter)</a></li><li><a href="https://blog.csdn.net/learnframework/article/details/123032419">Android P&#x2F;Q&#x2F;R&#x2F;S 9&#x2F;10&#x2F;11&#x2F;12 Multi-task Gesture Animation OtherActivityInputConsumer Situation</a></li><li><a href="https://developer.android.google.cn/guide/topics/ui/splash-screen">Android Splash Screen</a></li></ol><h1 id="Stability-Crash-x2F-ANR"><a href="#Stability-Crash-x2F-ANR" class="headerlink" title="Stability (Crash&#x2F;ANR)"></a>Stability (Crash&#x2F;ANR)</h1><ol><li><a href="https://mp.weixin.qq.com/s/40T6ITvJNWR8F42530k4DA">Android ANR|Principle Analysis and Common Cases</a></li><li><a href="http://gityuan.com/2019/04/06/android-anr/">Thorough Understanding of Android Application Not Responding Mechanism</a></li><li><a href="https://www.jianshu.com/p/18f16aba79dd">Application and System Stability Part 1 — General Routine for ANR Problem Analysis</a></li><li><a href="https://www.jianshu.com/p/ac545e10e39e">Application and System Stability Part 2 — ANR Monitoring and Information Collection</a></li><li><a href="https://www.jianshu.com/p/1f9cff12b84f">Application and System Stability Part 3 — Discussion on FD Leakage Issues</a></li><li><a href="https://www.jianshu.com/p/3017487b881f">Application and System Stability Part 4 — Analysis of Null Pointer Issues Caused by Single Thread</a></li><li><a href="https://www.jianshu.com/p/f2713f371589">Application and System Stability Part 5 — Watchdog Principles and Problem Analysis</a></li><li><a href="https://www.jianshu.com/p/e398e450c597">Application and System Stability Part 6 — Analysis of JVM Garbage Collection finalize Execution Causing Timed Out Crash</a></li><li><a href="https://www.jianshu.com/p/2addc08cb84b">Application and System Stability Part 7 — Solving NDK Difficult Crashes in Advance with Asan</a></li><li><a href="https://juejin.cn/post/7076326625436467214">Process Names and Thread Names in Android</a></li><li><a href="https://juejin.cn/post/7041834777229393934">Android Runtime | Trace File Generation Mechanism</a></li><li><a href="https://juejin.cn/post/7028518916355801101">Discussion | Special Handling of Main Thread for FP-based Stack Backtrace</a></li><li><a href="https://juejin.cn/post/7018153262482194446">Android Resource Overflow Crash Easily Solved</a></li><li><a href="https://juejin.cn/post/7025432746382065678">ByteDance Android Native Crash Governance: Memory Corruption Tool Principles and Practice</a></li><li><a href="https://mp.weixin.qq.com/s?__biz=MzI1MzYzMjE0MQ==&mid=2247487203&idx=1&sn=182584b69910c843ae95f60e74127249&chksm=e9d0c501dea74c178e16f95a2ffc5007c5dbca89a02d56895ed9b05883cf0562da689ac6146b&token=2044639920&lang=zh_CN&scene=21#wechat_redirect">Xigua Video Stability Governance System Construction 1: Tailor Principles and Practice</a></li><li><a href="https://mp.weixin.qq.com/s/RF3m9_v5bYTYbwY-d1RloQ">Xigua Video Stability Governance System Construction 2: Raphael Principles and Practice</a></li><li><a href="https://mp.weixin.qq.com/s?__biz=MzI1MzYzMjE0MQ==&mid=2247489902&idx=1&sn=bfdf9f48dc6dc973722b5dcab9cd5882&chksm=e9d0d28cdea75b9ad255eb5de227240d2e6f0e9d66e562d3f49cf69f8ed4127c9954ef21bb6d&scene=178&cur_album_id=1833937688379310087#rd">Xigua Video Stability Governance System Construction 3: Sliver Principles and Practice</a></li><li><a href="https://mp.weixin.qq.com/s?__biz=MzI1MzYzMjE0MQ==&mid=2247489949&idx=1&sn=01948c047c0ce203956a3cf81dd20e83&chksm=e9d0d27fdea75b697e70a665b4c6912a8081649700766cf007a7b75d420a57089fe06d2e85b0&scene=178&cur_album_id=1833937688379310087#rd">Xigua Stutter &amp; ANR Optimization Governance and Monitoring System Construction</a></li><li><a href="https://mp.weixin.qq.com/s?__biz=MzI1MzYzMjE0MQ==&mid=2247488116&idx=1&sn=fdf80fa52c57a3360ad1999da2a9656b&chksm=e9d0d996dea750807aadc62d7ed442948ad197607afb9409dd5a296b16fb3d5243f9224b5763&scene=178&cur_album_id=1780091311874686979#rd">Toutiao ANR Optimization Practice Series - Design Principles and Influencing Factors</a></li><li><a href="https://mp.weixin.qq.com/s?__biz=MzI1MzYzMjE0MQ==&mid=2247488182&idx=1&sn=6337f1b51d487057b162064c3e24c439&chksm=e9d0d954dea75042193ed09f30eb8ba0acd93870227c5d33b33361b739a03562afb685df9215&scene=178&cur_album_id=1780091311874686979#rd">Toutiao ANR Optimization Practice Series - Monitoring Tools and Analysis Ideas</a></li><li><a href="https://mp.weixin.qq.com/s?__biz=MzI1MzYzMjE0MQ==&mid=2247488243&idx=1&sn=1f948e0ef616c6dfe54513a2a94357be&chksm=e9d0d911dea75007f36b3701b51842b9fa40969fe8175c2cb4aecf96793504602c574945d636&scene=178&cur_album_id=1780091311874686979#rd">Toutiao ANR Optimization Practice Series - Case Analysis Collection</a></li><li><a href="https://mp.weixin.qq.com/s?__biz=MzI1MzYzMjE0MQ==&mid=2247488314&idx=1&sn=559e52288ae2730a580fcd550f22d895&chksm=e9d0d8d8dea751ceecb715d472796f0c678a9358abf91eb279cdb0576329595e87531e221438&scene=178&cur_album_id=1780091311874686979#rd">Toutiao ANR Optimization Practice Series - Barrier Causing Main Thread Freeze</a></li><li><a href="https://mp.weixin.qq.com/s?__biz=MzI1MzYzMjE0MQ==&mid=2247488558&idx=1&sn=27dda3c3630116d37ab56a8c7bdf1382&chksm=e9d0dfccdea756daed46b340fb8021b57ea8cc300e58bdb59f0305f8290704984308a089bf2d&scene=178&cur_album_id=1780091311874686979#rd">Toutiao ANR Optimization Practice Series - Bidding Farewell to SharedPreference Waiting</a></li><li><a href="https://mp.weixin.qq.com/s/FuZ2CBVB_tQgvYyH66Ehcw">Automatically Intercepting 50% of Crashes: How ByteDance’s Self-developed Fastbot Helps Toutiao’s Stability Testing</a></li><li><a href="https://mp.weixin.qq.com/s/2d8017af87b906ab9fa8f6387ded0a45">Online Fault - Analysis and Localization via System Logs</a></li><li><a href="https://mp.weixin.qq.com/s?__biz=Mzg4MjE5OTI4Mw==&mid=2247499757&idx=1&sn=2d00c1f6cbaf99ab56295ed2bf8f7502&chksm=cf58e071f82f6967b23cfa6f0a61af5a5446d486ad89ca3acca63bfb530403a00a67bebbd214&mpshare=1&scene=1&srcid=0215rS5oKRnICZLGx17zVdsg&sharer_sharetime=1676449461248&sharer_shareid=b7cc12eb3054f40795517e846030e3c8">DingTalk ANR Practice Pitfalls and Lessons</a></li><li><a href="https://mp.weixin.qq.com/s?__biz=Mzg4MjE5OTI4Mw==&mid=2247499065&idx=1&sn=2dd9332fe0e49f947e38d5852527d245&chksm=cf58e2a5f82f6bb3b954bec4121c22f7223f79cdcdf750ac81e4426c7a137cf3b4ce852ba2ae&mpshare=1&scene=1&srcid=0215L0D8FeLqDvC1W06U7ICN&sharer_sharetime=1676449508589&sharer_shareid=b7cc12eb3054f40795517e846030e3c8">Stopping nativePollOnce from Always Ranking First</a></li><li><a href="https://juejin.cn/post/7252589598152491069?share_token=a98b828c-9713-4698-bc76-88dde6b29e6e">How xCrash and Matrix Handle ANRs Without Long Operations</a></li><li><a href="https://mp.weixin.qq.com/s?__biz=MzA3ODMzMTM1NA==&mid=2247488613&idx=1&sn=5190a1860fe36e0014c08723d5265cc9&chksm=9f4538d0a832b1c620e6b12756d28ebf0b3a67e84daca3bb530d9b160d2f49bf8706c99d41a5&mpshare=1&scene=1&srcid=0201NAu370ALgrJ33cBH9HC7&sharer_shareinfo=560311570437ce58a2435ea62f5df4af&sharer_shareinfo_first=560311570437ce58a2435ea62f5df4af">Android bugreport Analysis Method</a></li></ol><h1 id="Power-Consumption"><a href="#Power-Consumption" class="headerlink" title="Power Consumption"></a>Power Consumption</h1><ol><li><a href="https://mp.weixin.qq.com/s/ATppCpaKh1GcJCdts_EsyA">Linux Scheduler (EAS) that can perceive power consumption</a></li><li><a href="https://paul.pub/android-power">Android Power Consumption Improvement</a></li><li><a href="https://www.bilibili.com/video/BV1qf4y1c74A">Video - Why is iPhone 13 Pro&#x2F;Max Power Efficient? - ProMotion Technology Analysis</a></li></ol><h1 id="Process-Management"><a href="#Process-Management" class="headerlink" title="Process Management"></a>Process Management</h1><ol><li><a href="https://www.kernel.org/doc/Documentation/cgroup-v1/cpusets.txt">cpuset</a></li><li><a href="https://www.kernel.org/doc/Documentation/cgroup-v1/cgroups.txt">cgroup</a></li><li><a href="http://gityuan.com/2016/08/07/android-adj/">Android Process Scheduling: adj Algorithm</a></li><li><a href="http://gityuan.com/2017/07/30/linux-process/">Linux Process Management (1)</a></li><li><a href="http://gityuan.com/2017/08/05/linux-process-fork/">Linux Process Management (2)–fork</a></li><li><a href="http://gityuan.com/2017/08/06/linux_process_pid/">Linux Process PID Allocation Method</a></li><li><a href="http://edu.csdn.net/course/detail/5995">Paid Training Video: Understanding the Linux Core Series: Processes, Threads, and Scheduling</a></li><li><a href="https://paul.pub/android-process-creation/">Android System Process Management: Process Creation</a></li><li><a href="https://paul.pub/android-process-priority/">Android System Process Management: Process Priority</a></li><li><a href="https://paul.pub/android-process-recycle/">Android System Process Management: Memory Reclamation</a></li><li><a href="https://paul.pub/android-process-schedule/">Android System Process Management: Process Scheduling</a></li><li><a href="https://paul.pub/android-init/">Android System Startup: init Process and init Language</a></li><li><a href="https://segmentfault.com/a/1190000006251859">Android Process Persistence Techniques</a></li><li><a href="https://developer.android.google.cn/guide/components/processes-and-threads">Processes and Threads</a></li><li><a href="https://developer.android.google.cn/topic/performance/threads">Improving Performance with Threads</a></li><li><a href="http://gityuan.com/2018/05/19/android-process-adj/">Interpreting Android Process Priority ADJ Algorithm</a></li><li><a href="https://mp.weixin.qq.com/s?__biz=MzA3NTYzODYzMg==&mid=2653580105&idx=1&sn=e2845d214f71ba46116b7ab5eff02f53&chksm=84b3b94eb3c43058fced637158b728ea14063d5b00234fda187620ac01df06b9be61a7828ef9&mpshare=1&scene=1&srcid=#rd">Discussion on Android Thread Priority</a></li><li><a href="https://kernel.meizu.com/2024/12/25/%E7%89%A9%E6%A0%BC%E8%80%8C%E5%90%8E%E7%9F%A5%E8%87%B3-WALT%E8%B0%83%E5%BA%A6%E5%99%A8%E4%B9%8BRTG/">WALT Scheduler RTG from the Meizu Kernel Team</a></li><li><a href="https://mp.weixin.qq.com/s?__biz=MzkzOTUwMTQ5NQ==&mid=2247484527&idx=1&sn=03b80d74121590d5b6994faddfbe76db&chksm=c304d30627d823bf270275a6787606740af261a8346fc68a93afebf5cdc5707f8916948d29ed&mpshare=1&scene=1&srcid=0222qkLq5W9Ljvye8fn2tu4n&sharer_shareinfo=7cbbe142d4f7b9b0d650577e4a352664&sharer_shareinfo_first=7cbbe142d4f7b9b0d650577e4a352664">Energy-Aware Scheduling Archaeology Notes, Part 9</a></li></ol><h1 id="I-x2F-O"><a href="#I-x2F-O" class="headerlink" title="I&#x2F;O"></a>I&#x2F;O</h1><ol><li><a href="https://sharrychoo.github.io/blog/android-performance-opt/io">Android Performance Optimization: I&#x2F;O Monitoring and Optimization</a></li><li><a href="https://www.cnblogs.com/huxiao-tee/p/4657851.html">Understanding File Read&#x2F;Write Process from Kernel Filesystem Perspective</a></li><li><a href="https://www.cnblogs.com/huxiao-tee/p/4660352.html">In-depth Analysis of mmap: What it is, Why it’s used, How to use it</a></li><li><a href="https://mp.weixin.qq.com/s/HNgoXqlXQC-lGU_yjxYixA">Android IO Monitoring | Performance Monitoring Series</a></li></ol><h1 id="Debugging-Tools"><a href="#Debugging-Tools" class="headerlink" title="Debugging Tools"></a>Debugging Tools</h1><ol><li><p><a href="https://zhuanlan.zhihu.com/p/25277481">Another Android Performance Profiling Tool - simpleperf</a></p></li><li><p><a href="https://android.googlesource.com/platform/system/extras/+/master/simpleperf/doc/README.md">Simpleperf</a></p></li><li><p><a href="http://weishu.me/2016/05/30/how-to-debug-android-framework/">How to Debug Android Framework</a></p></li><li><p><a href="http://weishu.me/2017/01/14/how-to-debug-android-native-framework-source/">How to Debug Android Native Framework</a></p></li><li><p><a href="https://catapult.gsrc.io/README.md">Catapult Project</a></p></li><li><p><a href="https://zhuanlan.zhihu.com/p/27331842">Hands-on Guide to Using Systrace (Part 1)</a></p></li><li><p><a href="https://zhuanlan.zhihu.com/p/27535205">Hands-on Guide to Using Systrace (Part 2) - Lock Optimization</a></p></li><li><p><a href="https://zhuanlan.zhihu.com/p/27593816">Memory Leak Analysis with Android Studio and MAT</a></p></li><li><p><a href="https://www.androidperformance.com/en/2019/05/28/Android-Systrace-About/">Introduction to Systrace</a></p></li><li><p><a href="https://www.androidperformance.com/en/2019/07/23/Android-Systrace-Pre/">Systrace Basics - Systrace Prerequisites</a></p></li><li><p><a href="https://www.androidperformance.com/en/2019/05/27/why-60-fps/">Systrace Basics - Why 60 fps ?</a></p></li><li><p><a href="https://www.androidperformance.com/en/2019/06/29/Android-Systrace-SystemServer/">Systrace Basics - SystemServer Interpretation</a></p></li><li><p><a href="https://www.androidperformance.com/en/2019/11/04/Android-Systrace-Input/">Systrace Basics - Input Interpretation</a></p></li><li><p><a href="https://www.androidperformance.com/en/2019/12/01/Android-Systrace-Vsync/">Systrace Basics - Vsync Generation and Working Mechanism Interpretation</a></p></li><li><p><a href="https://www.androidperformance.com/en/2019/10/22/Android-Choreographer/">Systrace Basics - Vsync-App: Detailed Explanation of Choreographer-based Rendering Mechanism</a></p></li><li><p><a href="https://www.androidperformance.com/en/2019/11/06/Android-Systrace-MainThread-And-RenderThread/">Systrace Basics - MainThread and RenderThread Interpretation</a></p></li><li><p><a href="https://www.androidperformance.com/en/2019/12/06/Android-Systrace-Binder/">Systrace Basics - Binder and Lock Contention Interpretation</a></p></li><li><p><a href="https://www.androidperformance.com/en/2019/12/15/Android-Systrace-Triple-Buffer">Systrace Basics - Triple Buffer Interpretation</a></p></li><li><p><a href="https://www.androidperformance.com/en/2019/12/21/Android-Systrace-CPU">Systrace Basics - CPU Info Interpretation</a></p></li><li><p><a href="https://www.androidperformance.com/en/2021/04/24/android-systrace-smooth-in-action-1/">Systrace Smoothness Practice 1: Understanding Jank Principles</a></p></li><li><p><a href="https://www.androidperformance.com/en/2021/04/24/android-systrace-smooth-in-action-2/">Systrace Smoothness Practice 2: Case Study: MIUI Desktop Scrolling Jank Analysis</a></p></li><li><p><a href="https://www.androidperformance.com/en/2021/04/24/android-systrace-smooth-in-action-3/">Systrace Smoothness Practice 3: Some Questions During Jank Analysis</a></p></li><li><p><a href="https://www.androidperformance.com/en/2021/09/13/android-systrace-Responsiveness-in-action-1/">Systrace Responsiveness Practice 1: Understanding Responsiveness Principles</a></p></li><li><p><a href="https://www.androidperformance.com/en/2021/09/13/android-systrace-Responsiveness-in-action-2/">Systrace Responsiveness Practice 2: Responsiveness Practice Analysis - Taking Startup Speed as an Example</a></p></li><li><p><a href="https://www.androidperformance.com/en/2021/09/13/android-systrace-Responsiveness-in-action-3/">Systrace Responsiveness Practice 3: Extended Knowledge of Responsiveness</a></p></li><li><p><a href="https://www.androidperformance.com/en/2022/01/21/android-systrace-cpu-state-runnable/">Systrace Thread CPU Run State Analysis Techniques - Runnable Chapter</a></p></li><li><p><a href="https://www.androidperformance.com/en/2022/03/13/android-systrace-cpu-state-running/">Systrace Thread CPU Run State Analysis Techniques - Running Chapter</a></p></li><li><p><a href="https://www.androidperformance.com/en/2022/03/13/android-systrace-cpu-state-sleep/">Systrace Thread CPU Run State Analysis Techniques - Sleep and Uninterruptible Sleep Chapter</a></p></li><li><p><a href="https://source.android.google.cn/devices/graphics/tracing-win-transitions">Tracing Window Transitions</a></p></li><li><p><a href="https://zhuanlan.zhihu.com/p/108260089">Android Performance Problem Analysis - bugreport</a></p></li><li><p><a href="https://www.jianshu.com/p/95dfe1f41971">Tencent APM Framework Matrix Source Code Reading - Gradle Plugin</a></p></li><li><p><a href="https://www.jianshu.com/p/768b14dc0ffe">Tencent APM Framework Matrix Source Code Reading - TracePlugin Architecture Analysis</a></p></li><li><p><a href="https://www.jianshu.com/p/6dad2f9be403">Tencent APM Framework Matrix Source Code Reading - TracePlugin’s AnrTracer</a></p></li><li><p><a href="https://www.jianshu.com/p/5721f5d11ae5">Tencent APM Framework Matrix Source Code Reading - TracePlugin’s StartupTracer</a></p></li><li><p><a href="https://www.jianshu.com/p/731a5f4b4cd3">Tencent APM Framework Matrix Source Code Reading - TracePlugin’s FrameTracer</a></p></li><li><p><a href="https://www.jianshu.com/p/d0f2164dd053">Tencent APM Framework Matrix Source Code Reading - Architecture Analysis</a></p></li><li><p><a href="https://ui.perfetto.dev/#!/viewer">PerfettoViewer</a></p></li><li><p><a href="https://mp.weixin.qq.com/s/zT5bEYBbXd6U1E9bFd26RA">Android Performance Analysis Tools Introduction | Developer Talk · DTalk</a></p></li><li><p><a href="https://mp.weixin.qq.com/s?__biz=Mzg4MDc0MTg5Mg==&mid=2247484286&idx=1&sn=1bd1f99955bda95e1c0830e2f6026403&chksm=ceb92233dd544de435c80e326214c9000313dc7392fb21f1dcef828fb74c2a576a8af5a597df&mpshare=1&scene=1&srcid=0406wn2iPX2PmoeCewC421H8&sharer_shareinfo=ba637eab71bd4630f6715abfe63b1dd5&sharer_shareinfo_first=ba637eab71bd4630f6715abfe63b1dd5">System-Level Performance Analysis and Tuning (Systrace&#x2F;Perfetto)</a></p></li><li><p><a href="https://zhuanlan.zhihu.com/p/1939338242630591486">Core Data Concepts in Perfetto</a></p></li><li><p><a href="https://mp.weixin.qq.com/s?__biz=MzAxMDM0NjExNA==&mid=2247492116&idx=1&sn=41fb40fb2f3569943c80886254666aa7&chksm=9b5369f9ac24e0ef73a4163701956f6688fdc98400957ee146f7841c5e4f59c6344c3f976581&mpshare=1&scene=1&srcid=0223NQooM2YOIhl0F8xudg9i&sharer_shareinfo=532982104594e0192650dc43e8d9ef21&sharer_shareinfo_first=532982104594e0192650dc43e8d9ef21">Perfetto Dataflow Architecture Failure Analysis: Why Trace Data Gets Lost</a></p></li><li><p><a href="https://zhuanlan.zhihu.com/p/666315598">Simpleperf Theory and Practice Guide (Summary)</a></p></li><li><p><a href="https://mp.weixin.qq.com/s?__biz=MzkzOTQ4NDUyNg==&mid=2247489782&idx=1&sn=9bfdaffab42ae3c58be9267b0eab08df&chksm=c31c0c188db1fb213acff0e69432523779b58f2197416bd575ff70db8b0fa8c68b2e70b03dfc&mpshare=1&scene=1&srcid=0420J0L1l4cvnyYmNwbrHPYG&sharer_shareinfo=f82a652a83dd0aa020b661cd74fb9071&sharer_shareinfo_first=f82a652a83dd0aa020b661cd74fb9071">Efficient Native Debugging with Perfetto + simpleperf &#x2F; VSCode &#x2F; CallStack</a></p></li></ol><h1 id="Hardware-Related"><a href="#Hardware-Related" class="headerlink" title="Hardware Related"></a>Hardware Related</h1><ol><li><a href="https://source.android.com/devices/tech/perf/flash-wear">Flash Wear Management in Android Automotive </a></li><li><a href="http://www.10tiao.com/html/431/201706/2650236929/1.html">Cortex-A75 and Cortex-A55</a></li><li><a href="http://www.brendangregg.com/blog/2017-05-09/cpu-utilization-is-wrong.html">CPU Utilization is Wrong</a></li></ol><h1 id="Programming-Languages"><a href="#Programming-Languages" class="headerlink" title="Programming Languages"></a>Programming Languages</h1><ol><li><a href="https://academy.realm.io/cn/posts/360andev-jake-wharton-java-hidden-costs-android/">Exploring Hidden Costs of Java</a></li><li><a href="https://github.com/LyndonChin/kotlin-docs-zh">Kotlin Chinese Documentation</a></li><li><a href="https://zhuanlan.zhihu.com/p/112082107">Java Polymorphism Implementation in Android</a></li><li>Cancellation and Exceptions in Coroutines<ol><li><a href="https://medium.com/androiddevelopers/coroutines-first-things-first-e6187bf3bb21">Coroutines: First things first</a></li><li><a href="https://medium.com/androiddevelopers/cancellation-in-coroutines-aa6b90163629">Cancellation in coroutines</a></li><li><a href="https://medium.com/androiddevelopers/exceptions-in-coroutines-ce8da1ec060c">Exceptions in Coroutines</a></li><li><a href="https://medium.com/androiddevelopers/coroutines-patterns-for-work-that-shouldnt-be-cancelled-e26c40f142ad">Coroutines &amp; Patterns for work that shouldn’t be cancelled</a></li></ol></li><li><a href="https://zhuanlan.zhihu.com/p/24344559">Thorough Understanding of References in Android and Java</a></li><li><a href="https://juejin.cn/post/7068901166456766472">Coroutines, Context, and Scopes in Kotlin</a></li><li><a href="https://juejin.cn/post/7064541449332719647">In-depth Understanding of Continuation Principle in Coroutines</a></li><li><a href="https://medium.com/team-pratilipi/android-architecture-pattern-82aa0cf7e236">Android Architecture Pattern</a></li><li><a href="https://magdamiu.medium.com/high-performance-with-idiomatic-kotlin-d52e099d0df0">High performance with idiomatic Kotlin</a></li></ol><h1 id="Linux"><a href="#Linux" class="headerlink" title="Linux"></a>Linux</h1><ol><li><a href="http://www.tinylab.cn/kernel-explore-regmap-framework/">Kernel Exploration: Regmap Framework: Simplifying Slow I&#x2F;O Interface Optimization for Performance</a></li><li><a href="http://www.tinylab.cn/elinux-org-boot-time-optimization/">Embedded Linux Boot Time Optimization</a></li><li><a href="https://mp.weixin.qq.com/s?__biz=MzAwMDUwNDgxOA==&mid=2652664066&idx=1&sn=f5bcfbb40c8b1672e64625190b795598&chksm=810f379fb678be89aa169bc8b9ba0ddfdedb88fe191522f71330a5b394c5ff7869284643608c&mpshare=1&scene=1&srcid=0406LVWw9jQVgsGymk0i3gDf%23rd">Scenario Analysis of Linux Filesystem Read-ahead</a></li><li><a href="https://mp.weixin.qq.com/s?__biz=MzAwMDUwNDgxOA==&mid=2652663878&idx=1&sn=0b4118e88de5eb5b38c4ebcfa242a442&chksm=810f36dbb678bfcd3314ec8f6da1fd1caeb588a513fb307880ff228ca89d7a99d962b64739ba&mpshare=1&scene=1&srcid=0316x6fEMYpnFompZLcxdIy3%23rd">Using blktrace to Count Disk Block I&#x2F;O Access Frequency</a></li><li><a href="http://gityuan.com/2016/05/21/syscall/">Linux System Call (syscall) Principle</a></li><li><a href="https://mp.weixin.qq.com/s?__biz=MzAwMDUwNDgxOA==&mid=2652665068&idx=1&sn=6255885e49a552e14a89fa5f94263f4b&chksm=810f3271b678bb67f7cb02b6624e079952fda5f157cfd1079eb76315bde70f31fd25743db98f&mpshare=1&scene=1&srcid=0903PU0uqOmk4BvoBtfiK7MN%23rd">Qian Mo: Talking About Linux IO (Part 1)</a></li><li><a href="https://mp.weixin.qq.com/s?__biz=MzAwMDUwNDgxOA==&mid=2652665073&idx=1&sn=479f6947d845ab3823bf35fd3a74d8fe&chksm=810f326cb678bb7a6f91a63134712e1951d9d93299a2fb10a7a09779599f161b9a3bac9bf7f5&mpshare=1&scene=1&srcid=0903obSJikgzRQkacWruVHxM%23rd">Qian Mo: Talking About Linux IO (Part 2) - IO Stack in Linux Kernel</a></li><li><a href="https://mp.weixin.qq.com/s?__biz=MzAwMDUwNDgxOA==&mid=2652665103&idx=1&sn=ffffddab091250808ec273c0fb441c4c&chksm=810f3392b678ba8430b6e46b8b61e114dee92df997793657fa28e91944e37043edaf35e7a948&mpshare=1&scene=1&srcid=09036uYavdTQwV2xoxT415kt%23rd">Qian Mo: Talking About Linux IO (Part 3)</a></li><li><a href="https://mp.weixin.qq.com/s?__biz=MzAwMDUwNDgxOA==&mid=2652664862&idx=1&sn=ff5b5e3ff12eff9933b02d056090bb64&chksm=810f3283b678bb95601a679fe633acbe8a8e5458ed3b0a172a8abf7e9748569fa2543576e9e1&mpshare=1&scene=1&srcid=0710GsjvDmQvomT82BnqUtc2%23rd">Guo Jian: Deadline Scheduler (Part 1): Principles</a></li><li><a href="https://mp.weixin.qq.com/s?__biz=MzAwMDUwNDgxOA==&mid=2652664880&idx=1&sn=b1e97835b702359e20e0fb2c1218f55f&chksm=810f32adb678bbbbb8efea4902a42ae66187785b4483de4f743ea8daaee2d0d59eb73ea69747&mpshare=1&scene=1&srcid=07126zFuAiF9Bt8GHRRfDVQH%23rd">Guo Jian: Deadline Scheduler (Part 2): Details and Usage</a></li><li><a href="https://mp.weixin.qq.com/s?__biz=MzAwMDUwNDgxOA==&mid=2652664678&idx=1&sn=4dd68ee13fcea183ddcd6576cf7d8245&chksm=810f35fbb678bcedc592e820663fd02a0f829c6a99173fb327b0a2016256d94f5a922c2436a8&mpshare=1&scene=1&srcid=0611Qm6agWbldRTrn8E6EdA2%23rd">Guo Jian: Linux Memory Model - Flat, Non-contiguous, and Sparse</a></li><li><a href="https://www.cnblogs.com/tianguiyu/articles/6091378.html">Linux Kernel Analysis - CFS (Completely Fair Scheduler)</a></li><li><a href="http://linuxperf.com/?p=42">Understanding CFS Scheduler from a Few Questions</a></li><li><a href="http://www.wowotech.net/process_management/447.html">CFS Scheduler (1) - Basic Principles</a></li><li><a href="http://www.wowotech.net/process_management/448.html">CFS Scheduler (2) - Source Code Analysis</a></li><li><a href="http://www.wowotech.net/process_management/449.html">CFS Scheduler (3) - Group Scheduling</a></li><li><a href="http://www.wowotech.net/process_management/450.html">CFS Scheduler (4) - PELT (per entity load tracking)</a></li><li><a href="http://www.wowotech.net/process_management/451.html">CFS Scheduler (5) - Bandwidth Control</a></li><li><a href="http://www.wowotech.net/process_management/452.html">CFS Scheduler (6) - Summary</a></li><li><a href="https://mp.weixin.qq.com/s?__biz=MzU3MTkwMDU1NQ==&mid=2247483748&idx=1&sn=d8308e7138decad8340900db3494e98d&chksm=fcd85680cbafdf96f9ff3be4a8b13b6b174f5372c760527fec90ca7feba1cc22f1d0f3aa28b5&mpshare=1&scene=1&srcid=&sharer_sharetime=1569745222548&sharer_shareid=60bd7acea7881a97fbf9a6126d3e88d3#rd">Brief Knowledge About Threads and I&#x2F;O Models</a></li><li><a href="https://mp.weixin.qq.com/s?__biz=MzA3NTYzODYzMg==&amp;mid=404234343&amp;idx=1&amp;sn=b297b01ee7c656b900417f14a2a0ccae&amp;scene=1&amp;srcid=0303naEsx6F7zikbq8zK2REV#rd">TRIM: Improving Disk Performance, Alleviating Android Jank</a></li><li><a href="https://tinylab.org/lwn-456904/?from=groupmessage&isappinstalled=0">LWN 456904: Avoiding Disk Writeback, Throttling Page Cache Writes</a></li><li><a href="https://tinylab.org/lwn-384093/?from=groupmessage&isappinstalled=0">LWN 384093: Discussion on “Writeback” Issues</a></li><li><a href="https://tinylab.org/lwn-211505/?from=groupmessage&isappinstalled=0">LWN 211505: Avoiding and Solving Memory Fragmentation</a></li><li><a href="https://developer.android.google.cn/training/articles/smp#more">SMP Primer for Android</a></li><li><a href="https://zhuanlan.zhihu.com/p/73468738">Memory Allocation 1 - Free List and Memory Pool</a></li><li><a href="https://zhuanlan.zhihu.com/p/73562347">Memory Allocation 2 - Buddy System Principles</a></li><li><a href="https://zhuanlan.zhihu.com/p/105589621">Memory Allocation 3 - Buddy System Implementation in Linux</a></li><li><a href="https://zhuanlan.zhihu.com/p/83945844">Memory Compression in Linux</a></li><li><a href="https://zhuanlan.zhihu.com/p/97319402">The Fun of Studying Linux Kernel</a></li><li><a href="https://mp.weixin.qq.com/s/j2fTXYX0-IDTeD-LhHecAw">Linux IO Block Layer Analysis</a></li><li><a href="https://mp.weixin.qq.com/s/pLAFcD23qBP4iZxvek7xlg">CFS Task Load Balancing (Framework Chapter)</a></li><li><a href="https://mp.weixin.qq.com/s/c9Sg68iSvOPRJItFQgfZyg">Understanding Memory Defragmentation with One Diagram</a></li><li><a href="https://mp.weixin.qq.com/s/ppKf8nfOBjKwosieEOezYA">Brief Talk on New Non-Volatile Memory</a></li><li><a href="https://mp.weixin.qq.com/s/4xY19jzL0tPYsf5fsoR4Bw">Linux devfreq framework Analysis</a></li><li><a href="https://mp.weixin.qq.com/s/SuKRPYTMUbC5PRw9NnvUTg">Memory Leak (Growth) Flame Graph</a></li><li><a href="https://mp.weixin.qq.com/s/nkiE4CEo_zSN35I_qITAvQ">Linux System Performance Benchmarking System Configuration and Principles</a></li><li><a href="https://mp.weixin.qq.com/s/38ki8Rx0LLtHUAURJgUJpw">Cgroups and Systemd</a></li><li><a href="https://mp.weixin.qq.com/s/zUPcVOyP6mCtTMub5imf1w">Devfreq Bus Dcvs</a></li><li><a href="https://mp.weixin.qq.com/s/sO1MBsDyYyDOtA_aGq-YXw">Development of a Small Tool for Accurate CPU Utilization Calculation Based on eBPF</a></li><li><a href="https://mp.weixin.qq.com/s/udpHAaB27DpVPm1ynvUxuA">Some Superficial Understandings of eBPF</a></li><li><a href="https://mp.weixin.qq.com/s/yEMp70FmFYn6qL8kCZgS8A">Analyzing Function Performance with ftrace</a></li><li><a href="http://mp.weixin.qq.com/s?__biz=MzAwMDUwNDgxOA==&mid=2652681492&idx=1&sn=008c3ed95cf1c5985700d52c47f68c42">What is eBPF? Why is it Important for Observability</a></li></ol><h1 id="Flutter"><a href="#Flutter" class="headerlink" title="Flutter"></a>Flutter</h1><ol><li><a href="https://zhuanlan.zhihu.com/p/62335468">In-depth High-Performance Graphics Rendering in Flutter</a></li><li><a href="https://juejin.im/post/5db29887e51d452a39002adb">Cross-platform Technology Evolution and Flutter’s Future</a></li><li><a href="https://mp.weixin.qq.com/s/IZ6rUfg3_-zvopc7jZZobg">Cross-platform Technology Trends and ByteDance Flutter Architecture Practice</a></li><li><a href="https://mp.weixin.qq.com/s?__biz=MzUyMjg5NTI3NQ==&mid=2247484105&idx=1&sn=7cb3d5816507290caa6338ac9b593440&chksm=f9c5a80dceb2211bd5bc130158fa1f009d927548aa9b6b7b1452b4066b7e8ddab5c4b8a70cc2&mpshare=1&scene=1&srcid=&sharer_sharetime=1565751189915&sharer_shareid=60bd7acea7881a97fbf9a6126d3e88d3#rd">Flutter Performance Testing and Theory</a></li><li><a href="https://mp.weixin.qq.com/s?__biz=MzAwODY4OTk2Mg==&mid=2652049970&idx=2&sn=1160c3e2df1a2659e8f8a921c7978ebc&chksm=808cb277b7fb3b61c420cfd6e5b9be7acbecb57a794029665ac4baa6d7db649e6d34e0656182&mpshare=1&scene=1&srcid=&sharer_sharetime=1563846371830&sharer_shareid=60bd7acea7881a97fbf9a6126d3e88d3#rd">In-depth Understanding of Flutter Multi-threading</a></li><li><a href="http://gityuan.com/2019/06/22/flutter_booting/">In-depth Understanding of Flutter Engine Startup</a></li><li><a href="http://gityuan.com/2019/06/15/flutter_ui_draw/">Flutter Rendering Mechanism - UI Thread</a></li><li><a href="http://gityuan.com/2019/06/16/flutter_gpu_draw/">Flutter Rendering Mechanism - GPU Thread</a></li><li><a href="https://mp.weixin.qq.com/s/p3epzBC-ZRr2V9Yh1GH7tw">In-depth Exploration of Flutter Performance Optimization</a></li></ol><h1 id="Fuchsia"><a href="#Fuchsia" class="headerlink" title="Fuchsia"></a>Fuchsia</h1><ol><li><a href="https://zhuanlan.zhihu.com/p/55690708?utm_source=ZHShareTargetIDMore&utm_medium=social&utm_oi=27871238160384">Dr. Xu Zhongxing’s Speech: Introduction to Fuchsia OS</a></li></ol><h1 id="Beyond-Technology"><a href="#Beyond-Technology" class="headerlink" title="Beyond Technology"></a>Beyond Technology</h1><ol><li><a href="https://ichn.xyz/blog/how-to-start-learning-in-a-new-area">How to Start Learning in a New Area</a></li><li><a href="https://mp.weixin.qq.com/s?__biz=MzU3ODAxNDcwNQ==&mid=2247484147&idx=1&sn=cd5f8fead3bcaac2d22a3dd699d2e79f&chksm=fd7a9e6dca0d177b27095d3d12720e83ba1638028799a89a8879929c1ad442529a62a46c5fe3&mpshare=1&scene=1&srcid=1027hi7FsUIG3AirEiJg198C#rd">How Hard Do I Work</a></li><li><a href="https://zhuanlan.zhihu.com/zmywly8866/20711335">Some Insights Since Starting Work</a></li><li><a href="https://zhuanlan.zhihu.com/p/20708611">How to Self-Learn Android?</a></li><li><a href="https://mp.weixin.qq.com/s?__biz=MjM5ODQ2MDIyMA==&mid=2650714160&idx=1&sn=5ea68a672a3b4df567951a09a264dfd3&chksm=bec07e6389b7f7758f438618c5dfb91e193a39446e0864bca2ed00fcbf363ea4caa5f8391d99&mpshare=1&scene=1&srcid=0507RZEnGNhAlCveVh01K3db%23rd">What is the Most Important Ability for a Technologist?</a></li><li><a href="https://blog.csdn.net/wetest_tencent/article/details/80361126">Brief Talk on Software Engineer’s Code Literacy</a></li><li><a href="https://mp.weixin.qq.com/s?__biz=MzA3MDMyMjkzNg==&mid=2652262721&idx=1&sn=978d9d94b5417ef4841d54d64fcf2776&chksm=84dc6ed6b3abe7c07990422648df4617458d50818968b247ef1aea5b077fa114c532adf79f85&mpshare=1&scene=1&srcid=0803qDDSrV6EIlW5aMuzUfv4%23rd">Lu Qi: Besides Good Code, How Else Can Engineers Be Excellent?</a></li><li><a href="https://coolshell.cn/articles/20276.html">Don’t “Wall” Yourself</a></li><li><a href="https://mp.weixin.qq.com/s?__biz=MzIwMTAzMTMxMg==&mid=2649494737&idx=1&sn=8e1f94c24768deb3ddd926c4fd5df986&chksm=8eec9f2eb99b16386cbd677e0545d71f0863cc77f21dd9250dda8f7a31c4a206167b510118c0&mpshare=1&scene=1&srcid=&sharer_sharetime=1568602769162&sharer_shareid=60bd7acea7881a97fbf9a6126d3e88d3#rd">How to Become a 100% Successful Offer Harvester?</a></li><li><a href="https://coolshell.cn/articles/20533.html">Independent Thinking Using Simple Logical Methods</a></li><li><a href="https://mp.weixin.qq.com/s/RWdiiYC423ocH-iuaiqr2w">Underlying Internal Skills Developed This Year</a></li><li><a href="https://xiao.do/issues/084-1059071">084 Create Your Own Field, Steve Jobs’ Life Rules, Voice and Exit, Benefits of Insomnia</a></li><li><a href="https://mp.weixin.qq.com/s/aA6xf6deR20QlhJxXNJVgw">I Mastered How to Watch English Technical Videos Without Barriers</a></li><li><a href="https://www.bilibili.com/video/BV1vW411Z7Qf">Video - Tal Ben-Shahar “Positive Leadership”</a></li><li><a href="https://medium.com/@codecungtrung/why-did-i-choose-to-be-an-android-developer-not-an-ios-developer-eb67809fa704">Why did I choose to be an Android developer, not an IOS developer ?</a></li><li><a href="https://mp.weixin.qq.com/s/5lpb9ZASj7ioBXWaUaEOQg">Should Technical Leads Stop Writing Code?</a></li><li><a href="https://www.kenshinji.me/wo-shi-ru-he-cong-ya-ba-ying-yu-dao-wu-zhang-ai-ying-wen-gong-zuo-gou-tong-de/">How I Went from “Mute English” to Barrier-Free English Work Communication</a></li><li><a href="https://www.cnblogs.com/zhoujg/archive/2011/03/01/1968366.html">English: Lou Wu - Real Methods and Misconceptions in English Learning</a></li><li><a href="https://mp.weixin.qq.com/s/G2ib7f87dCsRyEejaYk-6Q">Tearing Down the Wall of Knowledge</a></li><li><a href="http://mp.weixin.qq.com/s?__biz=MzIxNDQ3NDI5OQ==&mid=2247486068&idx=1&sn=934b4db38a852bf5cde0cee972e59885">5000 Words Detailed Explanation of Performance Requirements</a></li></ol><h1 id="Interview-Questions"><a href="#Interview-Questions" class="headerlink" title="Interview Questions"></a>Interview Questions</h1><ol><li><a href="https://mp.weixin.qq.com/s?__biz=MzAxMTg2MjA2OA==&mid=2649842075&idx=1&sn=668f0ddceab52c961f1ac20a77165429">Android 2018 Latest Interview Questions</a></li><li><a href="https://zhuanlan.zhihu.com/p/34878265">How to Measure the Ability of an Android App Developer</a></li><li><a href="https://juejin.im/post/5b97ab465188255c865e030a">2018 Android Interview Summary</a></li><li><a href="https://www.jianshu.com/p/8608b172b103">Android 2017-2018 Latest Interview Questions (3-5 Years Experience Personal Interview Experience)</a></li><li><a href="https://www.diycode.cc/wiki/androidinterview">Android Development Engineer Interview Guide</a></li><li><a href="https://mp.weixin.qq.com/s?__biz=MzA3NzMxODEyMQ==&mid=2666454354&idx=2&sn=b08cfa0ba5d403c92bce5e7fb57f233f&chksm=8449afd4b33e26c2b04adad207e9bf93fa7af46be75cfb860aeba30bed5bc93340ca8965d2bc&mpshare=1&scene=1&srcid=0815726HCm2RAyWr0mKdKiHL%23rd">Alibaba Phone Interview Questions Summary, with Answers!</a></li><li><a href="https://github.com/francistao/LearningNotes/blob/master/Part6/InterviewExperience/Alibaba.md">Alibaba Interview Questions</a></li><li><a href="https://github.com/francistao/LearningNotes/blob/master/Part6/InterviewExperience/%E7%BE%8E%E5%9B%A2.md">Meituan Interview Questions</a></li><li><a href="https://github.com/francistao/LearningNotes/blob/master/Part6/InterviewExperience/%E8%B1%8C%E8%B1%86%E8%8D%9A.md">Wandoujia Three Interview Questions</a></li><li><a href="https://github.com/francistao/LearningNotes/blob/master/Part6/InterviewExperience/%E8%9C%BB%E8%9C%93FM.md">Qingting FM Interview Questions</a></li><li><a href="https://github.com/francistao/LearningNotes/blob/master/Part6/InterviewExperience/%E6%96%B0%E6%B5%AA%E5%BE%AE%E5%8D%9A.md">Sina Weibo Interview Questions</a></li><li><a href="https://github.com/francistao/LearningNotes/blob/master/Part6/InterviewExperience/%E7%BD%91%E6%98%93%E6%9D%AD%E7%A0%94.md">NetEase Hangzhou R&amp;D Interview Questions</a></li><li><a href="https://mp.weixin.qq.com/s/A2RzPsdkfHNGlsnFsJbe-g">Why do you want to work for our company? - Common Interview Questions Analysis</a></li><li><a href="https://mp.weixin.qq.com/s?__biz=MzUzMjUyMDQ5Mw==&mid=2247484057&idx=1&sn=ca225ba9b647206d391624f9f7f9300a&chksm=fab349dbcdc4c0cd0ede64a8dc956e6fe1b6a7cd370a638010792185826c55264d3db1bcdac5&mpshare=1&scene=1&srcid=0918xJfW9762pd5y9E56E4Bh%23rd">Today’s Toutiao Senior Interviewer Interviewed 2000 People in Ten Years, Summarized These 5 Points</a></li><li><a href="https://mp.weixin.qq.com/s/4qA_FrPKUQrgDu_ITVYt-A">2019 Meituan-Dianping Senior Android Development Winter Job Hopping Salary Increase Experience Sharing</a></li><li><a href="https://mp.weixin.qq.com/s?__biz=MzIzOTU0NTQ0MA==&mid=2247492338&idx=1&sn=1b261f2eda75163e0878d3b5e4373834&chksm=e92adffdde5d56eb4720f9ee0b3b81795ee31bedb2ebe6a3112e0e1b538242e69076ff5aa715&mpshare=1&scene=1&srcid=&sharer_sharetime=1574306357287&sharer_shareid=60bd7acea7881a97fbf9a6126d3e88d3#rd">How to Answer Performance Optimization Questions to Impress Alibaba Interviewers?</a></li><li><a href="https://juejin.im/post/5d4e40a5f265da03ef7a02a1">2019.07 Android Interview Real Questions Collection</a></li><li><a href="https://mp.weixin.qq.com/s?__biz=MzI3NzE1NDcyNQ==&mid=2247485232&idx=1&sn=b7abd39999034bed76a8b849b968faa3&chksm=eb6bd9fadc1c50ec24d8dccf80d94d8cc745d2e2c69b7add3b36a12aafd5b87b2f5e7480317f&mpshare=1&scene=1&srcid=&sharer_sharetime=1570589981034&sharer_shareid=60bd7acea7881a97fbf9a6126d3e88d3#rd">How do Interviewers Evaluate Candidates in Technical Interviews?</a></li><li><a href="https://mp.weixin.qq.com/s?__biz=MzI3Mzc4ODQ3Mw==&mid=2247484333&idx=1&sn=03271692d0f713272baa16270f11b8d0&chksm=eb1cb8fbdc6b31edbffb8a7c01fb886e3689f5e0204f71b75908cfdfadef92333bb3c91df281&mpshare=1&scene=1&srcid=11297lZR9ijR5xUFAyStvw65#rd">Text Version of a Sharing Session for HenCoder Plus Students</a></li><li><a href="https://juejin.im/post/5e9102f9e51d4546d6357fde">Kuaishou, ByteDance, Baidu, Meituan Offer Journey</a></li><li><a href="https://zhuanlan.zhihu.com/p/31209029">Interview Musings in the US</a></li><li><a href="https://www.tsaiggo.life/posts/thinking-in-interview/">Interview Thoughts</a></li></ol><h1 id="Open-Source-Libraries"><a href="#Open-Source-Libraries" class="headerlink" title="Open Source Libraries"></a>Open Source Libraries</h1><ol><li><a href="https://mp.weixin.qq.com/s?__biz=MzI1MzYzMjE0MQ==&mid=2247487720&idx=1&sn=4c1dc31b6201e420dcac49250b81055f&chksm=e9d0db0adea7521c9337aacc22877d4e6f33a774499c650f3bfb12ad23ffdc0b8ab6ef40a9a5&scene=21#wechat_redirect">Douyin Android Performance Optimization Series: Rhea, a New Generation All-round Performance Analysis Tool</a></li><li><a href="https://github.com/bytedance/memory-leak-detector">Raphael: An Android Native Memory Leak Detection Tool</a></li><li><a href="https://github.com/bytedance/tailor">Tailor: A Universal Memory Snapshot Minimizer for Android</a></li><li><a href="https://github.com/iqiyi/xHook">xHook</a></li><li><a href="https://github.com/hexhacking/xDL">xDL Link</a></li><li><a href="https://github.com/ele7enxxh/Android-Inline-Hook">Android-Inline-Hook Link</a></li><li><a href="https://github.com/Rprop/And64InlineHook">And64InlineHook Link</a></li><li><a href="https://android.googlesource.com/platform/bionic/+/master/libc/malloc_debug/README.md">malloc debug Link</a></li><li><a href="http://www.andreasen.org/LeakTracer/">LeakTracer Link</a></li><li><a href="https://github.com/uber/nanoscope">Nanoscope</a></li><li><a href="https://github.com/facebookincubator/profilo">Profilo</a></li><li><a href="https://gpeal.medium.com/lottie-android-5-0-7d468e36d882">Lottie Android 5.0</a></li></ol><h1 id="Technical-Weeklies"><a href="#Technical-Weeklies" class="headerlink" title="Technical Weeklies"></a>Technical Weeklies</h1><ol><li><a href="http://www.kotlinweekly.net/">Kotlin Weekly</a></li><li><a href="http://androidweekly.net/">Android Weekly</a></li><li><a href="https://androidweekly.zhubai.love/">Android Weekly - CN</a></li><li><a href="https://www.oncreatedigest.com/">onCreate Digest</a></li><li><a href="https://mp.weixin.qq.com/mp/appmsgalbum?__biz=MjM5NTMzNzQxMw==&action=getalbum&album_id=1788609729372438534&scene=173&from_msgid=2650976227&from_itemidx=1&count=3&nolastread=1#wechat_redirect">软件测试周刊</a></li><li><a href="https://mp.weixin.qq.com/mp/appmsgalbum?__biz=MzAwMjgwMTEzNw==&action=getalbum&album_id=2226497928947367940&scene=173&from_msgid=2652227850&from_itemidx=1&count=3&nolastread=1#wechat_redirect">CodeDump 的网络日志</a></li><li><a href="https://mp.weixin.qq.com/mp/appmsgalbum?__biz=MzIwNDQ2NjUyMQ==&action=getalbum&album_id=1340386474226958336&scene=173&from_msgid=2247490138&from_itemidx=1&count=3&nolastread=1#wechat_redirect">体验碎周报</a></li></ol><h1 id="Technical-Teams-and-Individuals"><a href="#Technical-Teams-and-Individuals" class="headerlink" title="Technical Teams and Individuals"></a>Technical Teams and Individuals</h1><h1 id="WeChat-Official-Accounts"><a href="#WeChat-Official-Accounts" class="headerlink" title="WeChat Official Accounts"></a>WeChat Official Accounts</h1><h1 id="Other-Links"><a href="#Other-Links" class="headerlink" title="Other Links"></a>Other Links</h1><p>Since the blog comment section is difficult to use, you can go to the Zhihu or Juejin pages of this article for likes or discussions:<br><a href="https://zhuanlan.zhihu.com/p/30691789">Zhihu - Android Performance Optimization: Must-Know Skills and Tools</a><br><a href="https://juejin.im/post/5ebf4f21f265da7bad355036">Juejin - Android Performance Optimization: Must-Know Skills and Tools</a></p><h1 id="About-Me-amp-amp-Blog"><a href="#About-Me-amp-amp-Blog" class="headerlink" title="About Me &amp;&amp; Blog"></a>About Me &amp;&amp; Blog</h1><p>Below is my personal intro and related links. I look forward to exchanging ideas with fellow professionals. “When three walk together, one can always be my teacher!”</p><ol><li><a href="https://www.androidperformance.com/en/about/">Blogger Intro</a></li><li><a href="https://www.androidperformance.com/en/2019/12/01/BlogMap/">Blog Content Navigation</a>: A guide for my blog content.</li><li><a href="https://www.androidperformance.com/en/2018/05/07/Android-performance-optimization-skills-and-tools/">Curated Excellent Blog Articles - Android Performance Optimization Must-Knows</a></li><li><a href="https://www.androidperformance.com/en/2023/12/30/the-performance/">Android Performance Optimization Knowledge Planet</a></li></ol><blockquote><p><strong>One walks faster alone, but a group walks further together.</strong></p></blockquote><p><img src="/en/images/WechatIMG581.webp" alt="Scan WeChat QR Code"></p>]]></content>
    
    
    <summary type="html">&lt;p&gt;This article records the essential knowledge for Android performance optimization (mainly including outstanding articles, WeChat accounts, blogs, and technical teams), covering all aspects of performance optimization. This post will be continuously updated; personal recommendations are welcome.&lt;/p&gt;</summary>


    <category term="Android" scheme="https://androidperformance.com/en/categories/Android/"/>
    
    
    <category term="Android" scheme="https://androidperformance.com/en/tags/Android/"/>
    
    <category term="Startup" scheme="https://androidperformance.com/en/tags/Startup/"/>
    
    <category term="Jank" scheme="https://androidperformance.com/en/tags/Jank/"/>
    
    <category term="Memory" scheme="https://androidperformance.com/en/tags/Memory/"/>
    
    <category term="Performance" scheme="https://androidperformance.com/en/tags/Performance/"/>
    
  </entry>
  
  <entry>
    <title>2017 Best Recommendations - A Reward for Hard-Working Self</title>
    <link href="https://androidperformance.com/en/2018/01/06/2017-most-recommended/"/>
    <id>https://androidperformance.com/en/2018/01/06/2017-most-recommended/</id>
    <published>2018-01-06T07:40:01.000Z</published>
    <updated>2026-06-02T15:43:42.542Z</updated>
    
    <content type="html"><![CDATA[<p>2017 has unknowingly passed, and the blog hasn’t been updated for a long time. One reason is that I increasingly feel my knowledge is shallow, fearing I might mislead everyone with technical articles; another reason is that I’m too lazy. Given these two reasons, I decided that this blog’s updates should no longer be limited to technical articles—some meaningful things, thoughts, etc., will also be updated here. On one hand, this is a record for myself; if it can also bring some help to readers along the way, that would naturally be the best (although there aren’t many readers…)</p><p>Since 2017 has just passed, I feel it’s necessary to recommend to everyone the things that I think had excellent experiences in 2017 or were very helpful to my work life—perhaps you’ll need them in 2018. The recommended content includes apps, hardware, books, equipment, etc. It should be noted that these are things that brought me great help in 2017, which might not necessarily suit you. Let’s not say too much, let’s get straight to the content!</p><span id="more"></span><h1 id="2017-Best-iOS-Apps"><a href="#2017-Best-iOS-Apps" class="headerlink" title="2017 Best iOS Apps"></a>2017 Best iOS Apps</h1><p><strong>Keywords</strong>: Weight Loss Learning Knowledge</p><h2 id="Keep"><a href="#Keep" class="headerlink" title="Keep"></a>Keep</h2><p><img src="/en/images/media/15152276589894.jpg" alt="Keep"></p><p>If you’re a fitness enthusiast, a weight-loss planner looking for an app to record your workouts, then I recommend Keep to you. Keep has a very famous slogan, I don’t know if you’ve heard it: <strong>“Discipline gives me freedom!”</strong> I also like another quote: <strong>“Don’t let work ruin your life—there’s always someone busier than you who’s exercising.”</strong></p><p>The software is just an assistant—the most important thing is self-discipline. Life needs self-discipline, exercise needs self-discipline, diet needs self-discipline. Self-discipline doesn’t mean losing the fun in life; on the contrary, self-discipline brings freedom and confidence. People always long for a perfect version of themselves. Keep at it!</p><p>In 2017, with Keep’s help, my weight went from 78kg at my heaviest to my current 70kg. In terms of numbers, it might not seem significant, but looking back at photo comparisons, I really have much more confidence now.</p><h2 id="Dedao"><a href="#Dedao" class="headerlink" title="Dedao"></a>Dedao</h2><p><img src="/en/images/media/1_9Z-KgmC_qnkI3YqbLbrjuQ.webp" alt="Dedao"></p><p>As our leader said: some people—you just know they’re amazing, that’s all.</p><p>The Dedao app gives us a path to get close to those really amazing people, to know their learning methods and ways of thinking. You’ll discover that people smarter than you work even harder than you do—so what reason do you have to be lazy?</p><p>In 2017, I listened to Wu Jun’s “Letters from Silicon Valley,” listened to Xue Zhaofeng’s “Peking University Economics Course,” listened to Wan Weigang’s “Elite Daily Class” for a year, listened to many books.</p><p>In terms of both broadened horizons and thinking, I already gained far more than the subscription fees for these columns.</p><h2 id="WeChat-Reading"><a href="#WeChat-Reading" class="headerlink" title="WeChat Reading"></a>WeChat Reading</h2><p><img src="/en/images/media/15152618857230.jpg" alt="WeChat Reading"></p><p>There are many reading platforms; choosing one and sticking with it is most important. I have books on all three platforms: WeChat Reading, Duokan Reading, and Kindle—neither is better or worse, what’s important is actually acquiring knowledge.</p><p>The current generation of低头族 (people constantly looking down at their phones) is being criticized by everyone. Instead of swiping Weibo, Zhihu, Jike on the subway, it’s better to open a book, calm down, and read carefully.</p><h1 id="2017-Best-Mac-Apps"><a href="#2017-Best-Mac-Apps" class="headerlink" title="2017 Best Mac Apps"></a>2017 Best Mac Apps</h1><p><strong>Keywords</strong>: Work Arrangement Work Recording</p><h2 id="Things-3"><a href="#Things-3" class="headerlink" title="Things 3"></a>Things 3</h2><p><img src="/en/images/media/appicon-ios.webp" alt="Things 3"></p><p>This thing is a bit expensive, but it’s truly useful. Various functions are complete, and data across all platform versions (iPhone, iPad, Mac) is synced.</p><p>Things mainly completes the first ring of my work three-ring cycle: <strong>task arrangement</strong>. There are often many tasks, and sometimes I might forget to do some important things. Now I’ll record all things I need to do in Things. Every morning, based on priority, I’ll screen out what needs to be done today. If there are other sudden tasks, I’ll also record them, so I won’t attend to one thing and lose another.</p><p>Additionally, Things’ repeating tasks, task priorities, task timing, etc., are quite easy to use. I was previously using the web version of Tower, but I decisively migrated all data to Things.</p><h2 id="MWeb"><a href="#MWeb" class="headerlink" title="MWeb"></a>MWeb</h2><p><img src="/en/images/media/512-1.webp" alt="MWeb"></p><p>MWeb is a Markdown software. I also switched through several before settling on this one. Complete functions, beautiful interface, comfortable to write Markdown in, and very good support for images.</p><p>MWeb mainly completes the second ring of my work three-ring cycle: <strong>task recording</strong>, including daily task completion records. Things is for arranging tasks, but after tasks are completed, records and summaries need to be done—this is daily task recording. Things records the flow, while MWeb records the thoughts.</p><p>I also use MWeb to write blogs, company documents, summaries, etc. In short, it’s a very usable Markdown software.</p><h2 id="Evernote"><a href="#Evernote" class="headerlink" title="Evernote"></a>Evernote</h2><p><img src="/en/images/media/15152276977516.jpg" alt="EverNote"></p><p>I don’t need to introduce Evernote much. Its powerful browser clip-in plugin helped me save many excellent technical articles; the team sharing function helped me share notes in the team.</p><p>Evernote mainly completes the third ring of my work three-ring cycle: <strong>archiving</strong>. Whether it’s technical articles, meeting minutes, project planning, or PDFs—if you need a place for long-term storage, then Evernote is a quite reliable software. Sometimes I don’t make PPTs for meetings—Evernote’s presentation function can handle it just fine.</p><h1 id="2017-Best-Android-Apps"><a href="#2017-Best-Android-Apps" class="headerlink" title="2017 Best Android Apps"></a>2017 Best Android Apps</h1><p><strong>Keywords</strong>: Android Tools</p><h2 id="Android-Network-and-Resource-Access-Tools"><a href="#Android-Network-and-Resource-Access-Tools" class="headerlink" title="Android Network and Resource Access Tools"></a>Android Network and Resource Access Tools</h2><p>For Android developers, stable access to official docs, source code, issues, videos, and community resources matters. The exact tooling depends on your local environment, so I won’t expand on it here. The core idea is to prepare the resource access path so environment issues do not interrupt learning and debugging.</p><h2 id="Green-Guard"><a href="#Green-Guard" class="headerlink" title="Green Guard"></a>Green Guard</h2><p><img src="/en/images/media/15152613218534.jpg" alt="Green Guard"></p><p>The流氓程度 (rogue behavior) of domestic Android apps is obvious to everyone, especially the BAT bucket. If you don’t manage these apps well, the Android experience will be greatly discounted. Although many manufacturers now have restrictions on rogue software, Green Guard is still a software you must install after getting a new phone.</p><p>I had the privilege to discuss issues with Green Guard’s author Feng in the WeChat group. The depth of Feng’s knowledge and passion for technology—we can only look up to him with admiration. We all owe Feng a donation version.</p><blockquote><p>No need to envy friends’ iPhones anymore—even if they install many apps, their phones won’t become laggy or drain battery. With “Green Guard,” your Android device can also maintain the smoothness and battery life it had on day one!</p></blockquote><blockquote><p>Highest user-rated Android power-saving app on Zhihu: <a href="http://www.zhihu.com/question/21007772">http://www.zhihu.com/question/21007772</a></p></blockquote><blockquote><p>“Green Guard” helps you identify and prevent app programs that have negative impacts on overall system performance and power consumption. Through unique “greenification” technology, it prevents these apps from consuming your battery power and occupying your precious memory. Apps processed by “greenification” technology cannot “secretly” run when you don’t actively launch them, while still having complete functions and experience when you normally launch them—just like iPhone apps!</p></blockquote><h1 id="2017-Best-Non-Technical-Books"><a href="#2017-Best-Non-Technical-Books" class="headerlink" title="2017 Best Non-Technical Books"></a>2017 Best Non-Technical Books</h1><p><strong>Keywords</strong>: Self-Improvement Elevation</p><h2 id="Deep-Work"><a href="#Deep-Work" class="headerlink" title="Deep Work"></a>Deep Work</h2><p><img src="/en/images/media/15152579958065.jpg" alt="Deep Work"></p><p>I strongly recommend this book, especially for programmers who need lifelong learning. Everyone might have different feelings after finishing reading it, but I was definitely inspired by some work methods in it, combined with my own abilities and work situation, made targeted improvements, and achieved relatively good results. Personally, I think this is the best book I read in 2017. In this era of serious fragmentation of the internet, quick knowledge consumption and satisfaction made me produce laziness, thinking I know a lot, but actually those knowledge without deep processing, what I absorbed is just fragments, which dissipate with time.</p><blockquote><p>Checking emails at any time and place, participating nonstop in large and small meetings, busy hands and feet in the scream of instant messaging software, constantly switching attention in the cluttered multi-thread work… You appear very busy, perhaps even unconsciously enjoying this busyness—but can your busyness really be converted into productivity?</p></blockquote><blockquote><p>This book’s author, Cal Newport, PhD in Computer Science at MIT, sharply reveals the shocking truth of the information economy era—more than 60% of knowledge workers’ working hours are spent handling such shallow tasks, and these tasks not only produce limited value but also permanently damage people’s ability to do deep work!</p></blockquote><blockquote><p>The author founded the concept of “deep work,” with its meaning being to engage in focused professional activities in an undisturbed state, maximizing personal cognitive capabilities. And precisely because deep work capabilities are increasingly scarce in today’s society, their relationship with economic success is becoming increasingly tight. All discussions in the book revolve around “deep work,” and the book is divided into two parts: in the first part, the author objectively analyzes from neuroscience, psychology, philosophy, and other angles the importance of implementing deep work in the new economic situation. The second part systematically teaches specific strategies for practicing deep work in daily life, such as incorporating deep work into daily work processes, improving brain’s deep thinking ability, staying away from social networks, etc.</p></blockquote><blockquote><p>The author also emphasizes that deep work is not an overtime skill, but a good medicine that rescues people from the mental alienation state caused by technology monopoly. In today’s shallow information era centered on the internet, advocating for deep work is no different from calling for a return to craftsman spirit.</p></blockquote><blockquote><p>Douban: <a href="https://book.douban.com/subject/27056409/">https://book.douban.com/subject/27056409/</a></p></blockquote><h2 id="Deliberate-Practice-From-Novice-to-Master"><a href="#Deliberate-Practice-From-Novice-to-Master" class="headerlink" title="Deliberate Practice - From Novice to Master"></a>Deliberate Practice - From Novice to Master</h2><p><img src="/en/images/media/15152576721372.jpg" alt="Deliberate Practice"></p><p>This book is also quite famous externally. Actually, this book tells us a very simple truth: if you want to become an expert in any industry or field, you need to do a large amount of deliberate practice, not simply piling up time.</p><blockquote><p>For anyone hoping to improve themselves in any industry or field, deliberate practice is the golden standard—the most powerful learning method discovered to date.</p></blockquote><blockquote><p>Douban: <a href="https://book.douban.com/subject/26895993/">https://book.douban.com/subject/26895993/</a></p></blockquote><h1 id="2017-Best-Technical-Books"><a href="#2017-Best-Technical-Books" class="headerlink" title="2017 Best Technical Books"></a>2017 Best Technical Books</h1><p><strong>Keywords</strong>:</p><p>To be honest, in 2017 I didn’t seriously finish reading even one technical book. But out of so many technical books I’ve read, there are still two I can recommend to everyone—though the technical books I read are more related to my own work, not necessarily suitable for you.</p><h2 id="Deep-Understanding-of-Android-Kernel-Design-Thoughts-Second-Edition"><a href="#Deep-Understanding-of-Android-Kernel-Design-Thoughts-Second-Edition" class="headerlink" title="Deep Understanding of Android Kernel Design Thoughts (Second Edition)"></a>Deep Understanding of Android Kernel Design Thoughts (Second Edition)</h2><p><img src="/en/images/media/15152587790243.jpg" alt="Deep Understanding of Android Kernel Design Thoughts"></p><p>It can be considered a classic book for system development. This book had its second edition this year, adding some new content. Whether you’re an application development engineer or a system development engineer, knowing more about Android system’s architecture and design is very helpful for the depth of your knowledge.</p><p>However, Android’s version development is really too fast. When reading this book, it’s recommended to combine it with the latest Android source code. While combing through the processes, also think deeply about the design thoughts.</p><blockquote><p>“Deep Understanding of Android Kernel Design Thoughts” applies to Android 4.3 and above versions. The book starts with basic operating system knowledge, comprehensively analyzes implementation principles of core technologies in Android such as processes&#x2F;threads, memory management, Binder mechanism, GUI display system, multimedia management, input system, etc. Most knowledge points in the book come from engineering project R&amp;D, thus having strong practicality, hoping to let readers “know what is and why it’s so.” The book is divided into four parts: compilation chapter, system principles chapter, application principles chapter, and system tools chapter, with a total of 22 chapters, basically covering all knowledge required to participate in Android development, and guiding readers’ learning through many illustrations and examples, in order to provide readers with more easily understandable thinking methods beyond source code analysis.</p></blockquote><blockquote><p>“Deep Understanding of Android Kernel Design Thoughts” is suitable for both Android system engineers and application development engineers to read to improve Android development capabilities. Readers can more deeply understand the Android system in the subtle learning process of “Deep Understanding of Android Kernel Design Thoughts,” and naturally apply learned knowledge to actual development problem-solving.</p></blockquote><blockquote><p>Douban: <a href="https://book.douban.com/subject/25921329/">https://book.douban.com/subject/25921329/</a></p></blockquote><h2 id="Running-Linux-Kernel"><a href="#Running-Linux-Kernel" class="headerlink" title="Running Linux Kernel"></a>Running Linux Kernel</h2><p><img src="/en/images/media/15152591841672.jpg" alt="Running Linux Kernel"></p><p>I’m still reading this book, and due to lack of relevant knowledge, the progress is a bit slow. Essential for Android system engineers.</p><blockquote><p>This book’s content is based on Linux 4.x kernel, mainly selecting relatively basic and commonly used memory management, process management, concurrency and synchronization, and interrupt management these four kernel modules to explain. The book is divided into 6 chapters, sequentially introducing ARM system architecture, Linux memory management, process scheduling management, concurrency and synchronization, interrupt management, kernel debugging techniques, etc. Each section’s content is a Linux kernel topic or technical point, and readers can think based on questions before each small section, then conduct kernel source code analysis around the questions.</p></blockquote><blockquote><p>This book has rich content and clear thorough explanations, not only suitable for personnel with certain Linux-related foundations, including personnel engaged in Linux-related development, operating system researchers, embedded development personnel, and Android bottom-layer development personnel to learn and use, but also suitable as a learning book for programmers interested in Linux and as a teaching material and training textbook for related majors in colleges and universities.</p></blockquote><blockquote><p>Douban: <a href="https://book.douban.com/subject/27108677/">https://book.douban.com/subject/27108677/</a></p></blockquote><h1 id="2017-Best-Phone-–-Meizu-Pro-7-Plus"><a href="#2017-Best-Phone-–-Meizu-Pro-7-Plus" class="headerlink" title="2017 Best Phone – Meizu Pro 7 Plus"></a>2017 Best Phone – Meizu Pro 7 Plus</h1><p><strong>Keywords</strong>: Flagship</p><p><img src="/en/images/media/15152597921570.jpg" alt="Meizu Pro 7 Plus"></p><p>I don’t want to recommend iPhone X, only because I can’t afford it…</p><p>Although Meizu’s Pro 7 Plus has been complained about by netizens from all sides, you can’t deny this is a very excellent flagship phone. The comfortable Flyme system plus good hardware configuration, innovative small window, full of thoughtful details—whether it deserves the Pro + Plus title, wise see wisdom.</p><h1 id="2017-Best-Router-–-Xiaomi-Router-Pro"><a href="#2017-Best-Router-–-Xiaomi-Router-Pro" class="headerlink" title="2017 Best Router – Xiaomi Router Pro"></a>2017 Best Router – Xiaomi Router Pro</h1><p><strong>Keywords</strong>: Drama</p><p><img src="/en/images/media/15152601645070.jpg" alt="Xiaomi Router"></p><p>Xiaomi router + Xiaomi home theater, the biggest benefit is convenience. There are many drama websites now, and resource downloads will all have a <strong>“download to Xiaomi router”</strong> link—click it to download to your own router, go home and you can watch. It highlights one word: convenient.</p><h1 id="2017-Best-Tablet-–-iPad-Pro"><a href="#2017-Best-Tablet-–-iPad-Pro" class="headerlink" title="2017 Best Tablet – iPad Pro"></a>2017 Best Tablet – iPad Pro</h1><p><strong>Keywords</strong>: Perfect</p><p><img src="/en/images/media/verge-10.5.jpg" alt="iPad Pro"></p><p>In my eyes, iPad Pro has both iPhone’s advantages and Mac’s advantages. From usage scenarios, attending meetings, sending&#x2F;receiving emails, reading e-books, reading technical documents, reading PDFs, etc.—it can handle all.</p><p>iPad Pro with a keyboard (don’t buy a pen, it’s useless) is essentially a shrunken version of Mac. Except for writing code, it can satisfy all my other needs. Since I got this good thing, my usage rate of that Mac I’ve been using for several good years has been lower.</p><p>Those apps I mentioned earlier: Keep, Dedao, WeChat Reading, Things, MWeb, Evernote all have iPad versions, much better than the iOS versions.</p><p>Apple’s products are always精品. Two words for iPad Pro: perfect!</p><h1 id="2017-Best-Wearable-Device-–-iWatch"><a href="#2017-Best-Wearable-Device-–-iWatch" class="headerlink" title="2017 Best Wearable Device – iWatch"></a>2017 Best Wearable Device – iWatch</h1><p><strong>Keywords</strong>: Recording</p><p><img src="/en/images/media/il_570xN.1294603892_67xk.jpg" alt="iWatch"></p><p>iWatch is the weakest existence feeling among Apple’s four-piece suite. Personally, I think the biggest problem is battery life. First generation charges once a day, second generation charges once every two days—it’s really a bit helpless to complain about it. Since switching my main phone from iOS to Android, the phone call, SMS, alarm clock reminder functions are completely unused, but this thing solved one of my pain points: workout recording.</p><p>Treadmill + iWatch is simply a weight loss artifact. Every detail of workout recording pushes me to not be lazy. In short, iWatch is indispensable in my life.</p><h1 id="2017-Best-Headphones-–-MDR-1000X"><a href="#2017-Best-Headphones-–-MDR-1000X" class="headerlink" title="2017 Best Headphones – MDR-1000X"></a>2017 Best Headphones – MDR-1000X</h1><p><strong>Keywords</strong>: Noise Cancellation</p><p><img src="/en/images/media/Sony_MDR1000X_Photo_Main.jpg" alt="Sony_MDR1000X"></p><p>In a cluttered office, having a pair of wireless headphones with noise cancellation is really important. Noise cancellation can give you a quiet environment—whether thinking, writing code, or reading books, the feeling of not being disturbed by the outside world is really great; wireless brings simplicity, without the shackles of cables, it’s more convenient, and you also won’t have the trouble of chairs and cables wrapping around.</p><p>I’ve used MDR-1000X for so long, and I’m satisfied with all three aspects: noise cancellation, usability, and sound quality. It’s said that wearing headphones can reduce the rate of being disturbed by 50%—I recommend you get a pair of noise-canceling headphones too.</p><h1 id="2017-Best-Weight-Loss-Companion-–-Treadmill"><a href="#2017-Best-Weight-Loss-Companion-–-Treadmill" class="headerlink" title="2017 Best Weight Loss Companion – Treadmill"></a>2017 Best Weight Loss Companion – Treadmill</h1><p><strong>Keywords</strong>: Persistence</p><p>People always have laziness—everyone knows running helps with weight loss, but they just can’t persist. Also, outdoor running is too affected by the environment—too cold, too hot, snowing, raining.</p><p>I forced a treadmill into my already crowded home. The benefits of a treadmill: you can run anytime, and the psychological resistance to running isn’t as severe. Every day after work, open Keep, start running—five kilometers every day isn’t difficult, the important thing is to persist.</p><h1 id="Others"><a href="#Others" class="headerlink" title="Others"></a>Others</h1><p>Of course, there are still some things that can significantly improve happiness, but I won’t list them one by one. I think I’ll update them below as I think of them.</p><ol><li>Beef sauce from Kylin, choose <strong>bull with correct three views</strong>—once you try this package, you’ll fall in love</li><li>Rice cooker, who uses knows, they also won’t resist cooking at home</li><li>Floor-sweeping robot, who doesn’t want the floor at home to be clean every day? Especially when you have a long-haired monster and two cats at home</li></ol><hr><h1 id="About-Me-amp-amp-Blog"><a href="#About-Me-amp-amp-Blog" class="headerlink" title="About Me &amp;&amp; Blog"></a>About Me &amp;&amp; Blog</h1><p>Below is a personal introduction and related links. I look forward to communicating with colleagues in the same field. When three walk together, there must be my teacher!</p><ol><li><a href="https://www.androidperformance.com/about/">Blogger Personal Introduction</a>: Inside are personal WeChat and WeChat group links.</li><li><a href="https://androidperformance.com/2019/12/01/BlogMap/">Blog Content Navigation</a>: A navigation of personal blog content.</li><li><a href="https://androidperformance.com/2018/05/07/Android-performance-optimization-skills-and-tools/">Personally Organized and Collected Excellent Blog Articles - Essential Skills and Tools for Android Performance Optimization</a>: Everyone is welcome to self-recommend and recommend (private WeChat chat is fine).</li><li><a href="https://www.androidperformance.com/2023/12/30/the-performance/">Android Performance Optimization Knowledge Planet</a>: Welcome to join, thank you for your support~</li></ol><hr><blockquote><p><strong>“An individual can move faster, a group can go further.”</strong></p></blockquote><p><img src="/en/images/WechatIMG581.webp" alt="Wechat QR"></p>]]></content>
    
    
    <summary type="html">&lt;p&gt;2017 has unknowingly passed, and the blog hasn’t been updated for a long time. One reason is that I increasingly feel my knowledge is shallow, fearing I might mislead everyone with technical articles; another reason is that I’m too lazy. Given these two reasons, I decided that this blog’s updates should no longer be limited to technical articles—some meaningful things, thoughts, etc., will also be updated here. On one hand, this is a record for myself; if it can also bring some help to readers along the way, that would naturally be the best (although there aren’t many readers…)&lt;/p&gt;
&lt;p&gt;Since 2017 has just passed, I feel it’s necessary to recommend to everyone the things that I think had excellent experiences in 2017 or were very helpful to my work life—perhaps you’ll need them in 2018. The recommended content includes apps, hardware, books, equipment, etc. It should be noted that these are things that brought me great help in 2017, which might not necessarily suit you. Let’s not say too much, let’s get straight to the content!&lt;/p&gt;</summary>


    <category term="Casual Notes" scheme="https://androidperformance.com/en/categories/Casual-Notes/"/>
    
    
    <category term="Android" scheme="https://androidperformance.com/en/tags/Android/"/>
    
    <category term="Startup" scheme="https://androidperformance.com/en/tags/Startup/"/>
    
    <category term="Yearly Recommendations" scheme="https://androidperformance.com/en/tags/Yearly-Recommendations/"/>
    
    <category term="Memory" scheme="https://androidperformance.com/en/tags/Memory/"/>
    
  </entry>
  
  <entry>
    <title>2017 Annual Best Recommendations - Reward Yourself for Hard Work</title>
    <link href="https://androidperformance.com/en/2018/01/06/Most-Recommended-of-2017/"/>
    <id>https://androidperformance.com/en/2018/01/06/Most-Recommended-of-2017/</id>
    <published>2018-01-06T07:40:01.000Z</published>
    <updated>2026-06-02T15:43:42.541Z</updated>
    
    <content type="html"><![CDATA[<p>2017 has passed before we knew it. The blog hasn’t been updated for a while - one reason is that I increasingly realize how shallow my knowledge is and fear that writing about technical topics might mislead readers, and another reason is simply that I’ve been too lazy. Given these two reasons, I’ve decided that blog updates no longer need to be limited to technical articles - things I find meaningful, thoughts, and reflections will also be shared here. On one hand, it serves as my own record, and if it happens to help readers along the way, that would be even better (though there aren’t many readers anyway…).</p><p>Since 2017 has just passed, I feel it’s necessary to recommend to everyone the things that I found to be great experiences or very helpful for work and life in 2017 - perhaps you’ll need them in 2018. The recommendations include Apps, hardware, books, equipment, etc. It should be noted that these are things that brought me great help in 2017 - what works for me may not work for you. Without further ado, let’s get into it!</p><span id="more"></span><h1 id="2017-Best-iOS-App-Recommendation"><a href="#2017-Best-iOS-App-Recommendation" class="headerlink" title="2017 Best iOS App Recommendation"></a>2017 Best iOS App Recommendation</h1><p><strong>Keywords: Weight Loss, Learning, Knowledge</strong></p><h2 id="Keep"><a href="#Keep" class="headerlink" title="Keep"></a>Keep</h2><p><img src="/en/images/media/15152276589894.jpg" alt="Keep"></p><p>If you’re a fitness enthusiast, planning to lose weight, or looking for an app to track your exercise, I recommend Keep. You may have heard Keep’s famous slogan: <strong>Self-discipline gives me freedom!</strong> I also love another quote: <strong>Don’t let work ruin your life - there’s always someone busier than you who’s still exercising</strong>.</p><p>The software is just an aid - the most important thing is self-discipline. Life requires self-discipline, exercise requires self-discipline, diet requires self-discipline. Self-discipline doesn’t mean life loses its fun - on the contrary, self-discipline gives me freedom and confidence. People always aspire to be their best selves. Keep It!</p><p>In 2017, with Keep’s help, my weight went from a peak of 78 kg to 70 kg. The numbers might not seem like a big deal, but looking back at photo comparisons, I’m really much more confident now.</p><h2 id="Dedao-iGet"><a href="#Dedao-iGet" class="headerlink" title="Dedao (iGet)"></a>Dedao (iGet)</h2><p><img src="/en/images/media/1_9Z-KgmC_qnkI3YqbLbrjuQ.webp" alt="Dedao"></p><p>As my wife says, some people you know are impressive - and that’s about it.</p><p>Dedao actually gives us a way to get closer to those impressive people and understand their learning methods and ways of thinking. You’ll find that people smarter than you work even harder - so what excuse do you have to slack off?</p><p>In 2017, I listened to Wu Jun’s “Letters from Silicon Valley,” Xue Zhaofeng’s “PKU Economics Course,” Wan Weigang’s “Elite Daily Lesson,” Luo Pang’s year-long “Logical Thinking,” and many audiobooks.</p><p>In terms of expanding horizons and stimulating thought, what I gained far exceeded the subscription price of these columns.</p><h2 id="WeRead"><a href="#WeRead" class="headerlink" title="WeRead"></a>WeRead</h2><p><img src="/en/images/media/15152618857230.jpg" alt="WeRead"></p><p>There are many reading platforms - the most important thing is to pick one and stick with it. I read on WeRead, Duokan, and Kindle. There’s no absolute better or worse - what matters is actually gaining knowledge.</p><p>People who constantly look at their phones are often criticized nowadays. Instead of scrolling through Weibo, Zhihu, or Jike on the subway, why not open a book and read quietly?</p><h1 id="2017-Best-Mac-App-Recommendation"><a href="#2017-Best-Mac-App-Recommendation" class="headerlink" title="2017 Best Mac App Recommendation"></a>2017 Best Mac App Recommendation</h1><p><strong>Keywords: Work Planning, Work Recording</strong></p><h2 id="Things-3"><a href="#Things-3" class="headerlink" title="Things 3"></a>Things 3</h2><p><img src="/en/images/media/appicon-ios.webp" alt="Things 3"></p><p>It’s a bit pricey, but it’s really useful. All the features are complete, and data syncs across all platform versions (iPhone, iPad, Mac).</p><p>Things mainly handles the first part of my work trinity: task planning. Often there are many tasks, and sometimes important things get forgotten. Now I record everything I need to do in Things, and every morning I filter out what to do today based on priority. If other urgent matters come up, they also get recorded, so nothing gets overlooked.</p><p>Things’ recurring tasks, task priorities, and task timing are all quite useful. After using the web-based Tower, I decisively migrated all my data to Things.</p><h2 id="MWeb"><a href="#MWeb" class="headerlink" title="MWeb"></a>MWeb</h2><p><img src="/en/images/media/512-1.webp" alt="MWeb"></p><p>MWeb is a Markdown software. I tried several before settling on this one. It’s feature-complete, has a beautiful interface, makes Markdown writing comfortable, and has excellent image support.</p><p>MWeb handles the second part of my work trinity: task recording, including daily task completion records. Things is for planning tasks, but after completing tasks, you need to record and summarize - that’s the daily task record. Things records the workflow, while MWeb records the thoughts.</p><p>I also use MWeb to write blog posts, company documents, summaries, etc. In short, it’s a great Markdown software.</p><h2 id="Evernote"><a href="#Evernote" class="headerlink" title="Evernote"></a>Evernote</h2><p><img src="/en/images/media/15152276977516.jpg" alt="EverNote"></p><p>No need to introduce Evernote much. Its powerful browser clipping plugin has helped me store many excellent technical articles; team sharing features help me share notes within the team.</p><p>Evernote handles the third part of my work trinity: archiving. Whether it’s technical articles, meeting minutes, project plans, or PDFs - if you need a place for long-term storage, Evernote is a very reliable choice. Sometimes during meetings without making PPTs, Evernote’s presentation feature can also do the job.</p><h1 id="2017-Best-Android-App-Recommendation"><a href="#2017-Best-Android-App-Recommendation" class="headerlink" title="2017 Best Android App Recommendation"></a>2017 Best Android App Recommendation</h1><p><strong>Keywords: Android Tools</strong></p><h2 id="Android-Network-and-Resource-Access-Tools"><a href="#Android-Network-and-Resource-Access-Tools" class="headerlink" title="Android Network and Resource Access Tools"></a>Android Network and Resource Access Tools</h2><p>For Android developers, stable access to official docs, source code, issues, videos, and community resources matters. The exact tooling depends on your local environment, so I won’t expand on it here. The core idea is to prepare the resource access path so environment issues do not interrupt learning and debugging.</p><h2 id="Greenify"><a href="#Greenify" class="headerlink" title="Greenify"></a>Greenify</h2><p><img src="/en/images/media/15152613218534.jpg" alt="Greenify"></p><p>Everyone can see how rogue domestic Android apps are, especially the BAT family. Without managing these apps well, the Android experience suffers greatly. Even though many manufacturers have now implemented restrictions on rogue software, Greenify is still a must-install app when you get a new phone.</p><p>I had the privilege of discussing issues with Mr. Feng, the author of Greenify, in a WeChat group. Mr. Feng’s depth and passion for technology is something I can only aspire to. We all owe Mr. Feng a donation for the paid version.</p><blockquote><p>No more need to envy friends with iPhones - even with many apps installed, your phone won’t become slow and battery-draining. With ‘Greenify’, your Android device can stay as smooth and long-lasting as the first day you got it!</p></blockquote><blockquote><p>The most endorsed Android battery-saving software on Zhihu: <a href="http://www.zhihu.com/question/21007772">http://www.zhihu.com/question/21007772</a></p></blockquote><blockquote><p>‘Greenify’ helps you identify apps that negatively impact overall system performance and battery consumption, and uses unique ‘hibernation’ technology to prevent them from draining your battery and occupying precious memory. Apps processed with ‘hibernation’ cannot ‘secretly’ run when you haven’t actively launched them, yet retain full functionality and experience when you do launch them normally - just like iPhone apps!</p></blockquote><h1 id="2017-Best-Non-Technical-Book-Recommendation"><a href="#2017-Best-Non-Technical-Book-Recommendation" class="headerlink" title="2017 Best Non-Technical Book Recommendation"></a>2017 Best Non-Technical Book Recommendation</h1><p><strong>Keywords: Self-Improvement</strong></p><h2 id="Deep-Work"><a href="#Deep-Work" class="headerlink" title="Deep Work"></a>Deep Work</h2><p><img src="/en/images/media/15152579958065.jpg" alt="Deep Work"></p><p>Strongly recommend this book, especially for programmers who need to learn throughout their lives. Different people may have different impressions after reading it, but I was definitely inspired by some of the methods in it. Combined with my own abilities and work, I made targeted improvements and achieved good results. Personally, I think it’s the best book I read in 2017. In this era of serious fragmentation, the consumption and satisfaction of quick knowledge has made us lazy, thinking we know many things, but without deep processing, the knowledge absorbed is just fragments that fade away with time.</p><blockquote><p>Constantly sending and receiving emails, attending endless meetings, scrambling with instant messaging pings, constantly switching attention among complex multi-threaded work… You appear very busy, even unconsciously enjoying this busyness, but can your busyness really translate into productivity?</p></blockquote><blockquote><p>The author, Cal Newport with a PhD from MIT, sharply reveals the astonishing truth of the information economy - knowledge workers spend over 60% of their working hours on such shallow tasks, which not only produce limited value but also permanently damage people’s ability to do deep work!</p></blockquote><blockquote><p>The author created the concept of “deep work,” meaning focused professional activities in an undistracted state that push your cognitive capabilities to their limits. And precisely because deep work ability is increasingly rare in today’s society, its relationship with economic success is becoming increasingly close. All discussions in this book revolve around “deep work,” divided into two parts: In the first part, the author objectively analyzes the importance of achieving deep work in the new economic landscape from perspectives of neuroscience, psychology, and philosophy. The second part systematically teaches specific strategies for practicing deep work in daily life, such as incorporating deep work into daily work processes, improving the brain’s deep thinking ability, and staying away from social networks.</p></blockquote><blockquote><p>The author also emphasizes that deep work is not an outdated skill, but rather a remedy to rescue people from the spiritual alienation caused by technological monopoly. In this current network-centered shallow information age, advocating deep work is tantamount to calling for a return to craftsmanship.</p></blockquote><p>Douban: <a href="https://book.douban.com/subject/27056409/">https://book.douban.com/subject/27056409/</a></p><h2 id="Peak-Secrets-from-the-New-Science-of-Expertise"><a href="#Peak-Secrets-from-the-New-Science-of-Expertise" class="headerlink" title="Peak: Secrets from the New Science of Expertise"></a>Peak: Secrets from the New Science of Expertise</h2><p><img src="/en/images/media/15152576721372.jpg" alt="Peak"></p><p>This book is quite well-known. Actually, this book tells us a simple truth: to become an expert in any field, you need extensive deliberate practice, not just accumulating time.</p><blockquote><p>For anyone who wants to improve themselves in any industry or field, deliberate practice is the gold standard - the most powerful learning method discovered so far.</p></blockquote><p>Douban: <a href="https://book.douban.com/subject/26895993/">https://book.douban.com/subject/26895993/</a></p><h1 id="2017-Best-Technical-Book-Recommendation"><a href="#2017-Best-Technical-Book-Recommendation" class="headerlink" title="2017 Best Technical Book Recommendation"></a>2017 Best Technical Book Recommendation</h1><p><strong>Keywords:</strong><br>To be honest, I didn’t finish reading a single technical book properly in 2017, but from all the technical books I’ve read, there are still two I can recommend. However, the technical books I read are mostly related to my own work, so they may not be suitable for you.</p><h2 id="Understanding-Android-Kernel-Design-2nd-Edition"><a href="#Understanding-Android-Kernel-Design-2nd-Edition" class="headerlink" title="Understanding Android Kernel Design (2nd Edition)"></a>Understanding Android Kernel Design (2nd Edition)</h2><p><img src="/en/images/media/15152587790243.jpg" alt="Understanding Android Kernel Design"></p><p>A classic book for system development. This book released its second edition this year with some new content. Whether you’re an app developer or a system developer, understanding more about Android system architecture and design is very helpful for deepening your knowledge.</p><p>However, Android versions evolve too fast. It’s recommended to read this book alongside the latest Android source code. While sorting out the flow, also think deeply about the design philosophy.</p><blockquote><p>“Understanding Android Kernel Design” applies to Android 4.3 and above versions. The whole book starts from the basic knowledge of operating systems and comprehensively analyzes how core technologies such as process&#x2F;thread management, memory management, Binder mechanism, GUI display system, multimedia management, and input system are implemented in Android. The knowledge points in the book mostly come from engineering projects, making it highly practical, hoping to help readers “know why and how.” The book is divided into 4 parts with 22 chapters covering compilation, system principles, application principles, and system tools, basically covering the knowledge needed for Android development, and guides readers through numerous illustrations and examples to make it easier to understand beyond source code analysis.</p></blockquote><blockquote><p>“Understanding Android Kernel Design” is suitable for both Android system engineers and application developers to read and enhance Android development capabilities. Readers can more deeply understand the Android system through the subtle learning process of “Understanding Android Kernel Design” and naturally apply the knowledge to solving actual development challenges.</p></blockquote><p>Douban: <a href="https://book.douban.com/subject/25921329/">https://book.douban.com/subject/25921329/</a></p><h2 id="Running-Linux-Kernel"><a href="#Running-Linux-Kernel" class="headerlink" title="Running Linux Kernel"></a>Running Linux Kernel</h2><p><img src="/en/images/media/15152591841672.jpg" alt="Running Linux Kernel"></p><p>I’m still reading this book. Due to lack of related knowledge, progress is a bit slow. A must-have for Android system engineers.</p><blockquote><p>This book’s content is based on the Linux 4.x kernel, mainly selecting four basic and commonly used kernel modules: memory management, process management, concurrency and synchronization, and interrupt management. The book is divided into 6 chapters, introducing ARM architecture, Linux memory management, process scheduling management, concurrency and synchronization, interrupt management, and kernel debugging techniques. Each section is a Linux kernel topic or technical point. Readers can think about the questions before each section and then analyze the kernel source code around the problems.</p></blockquote><blockquote><p>This book is rich in content with clear and thorough explanations. It’s suitable not only for people with some Linux foundation, including developers involved in Linux-related development, operating system researchers, embedded developers, and Android underlying developers, but also as a learning book for programmers interested in Linux, and can serve as textbooks for colleges and training schools.</p></blockquote><p>Douban: <a href="https://book.douban.com/subject/27108677/">https://book.douban.com/subject/27108677/</a></p><h1 id="2017-Best-Phone-Recommendation-–-Meizu-Pro7-Plus"><a href="#2017-Best-Phone-Recommendation-–-Meizu-Pro7-Plus" class="headerlink" title="2017 Best Phone Recommendation – Meizu Pro7 Plus"></a>2017 Best Phone Recommendation – Meizu Pro7 Plus</h1><p><strong>Keywords: Flagship</strong></p><p><img src="/en/images/media/15152597921570.jpg" alt="Meizu Pro7 Plus"></p><p>It’s not that I don’t want to recommend iPhone X - it’s that I can’t afford it…</p><p>Despite Meizu’s Pro7 Plus being criticized by netizens, you can’t deny it’s an excellent flagship phone. The smooth Flyme system combined with decent hardware, the innovative secondary display is full of style. Whether it deserves the Pro + Plus title is up to individual judgment.</p><h1 id="2017-Best-Router-Recommendation-–-Xiaomi-Router-Pro"><a href="#2017-Best-Router-Recommendation-–-Xiaomi-Router-Pro" class="headerlink" title="2017 Best Router Recommendation – Xiaomi Router Pro"></a>2017 Best Router Recommendation – Xiaomi Router Pro</h1><p><strong>Keywords: American TV Shows</strong></p><p><img src="/en/images/media/15152601645070.jpg" alt="Xiaomi Router"></p><p>The biggest benefit of Xiaomi Router + Xiaomi Home Theater is convenience. Now many American TV show sites have a “Download to Xiaomi Router” link for resource downloads - just click to download to your router at home, and you can watch when you get home. Convenience is the highlight.</p><h1 id="2017-Best-Tablet-Recommendation-–-iPad-Pro"><a href="#2017-Best-Tablet-Recommendation-–-iPad-Pro" class="headerlink" title="2017 Best Tablet Recommendation – iPad Pro"></a>2017 Best Tablet Recommendation – iPad Pro</h1><p><strong>Keywords: Perfect</strong></p><p><img src="/en/images/media/verge-10.0.jpg" alt="iPad Pro"></p><p>In my eyes, iPad Pro has both the advantages of iPhone and Mac. In terms of use cases - meetings, email, e-books, technical documentation, PDFs - it can handle them all.</p><p>iPad Pro paired with a keyboard (don’t buy the pencil, useless) is basically a smaller version of a Mac. Besides coding, it can meet all my needs. After getting this device, my several-year-old near-retirement Mac is used even less.</p><p>The software I mentioned earlier: Keep, Dedao, WeRead, Things, MWeb, Evernote - all have iPad versions, and the experience is much better than the iOS versions.</p><p>Apple product, must be a quality product. Two words for iPad Pro: Perfect!</p><h1 id="2017-Best-Wearable-Device-Recommendation-–-Apple-Watch"><a href="#2017-Best-Wearable-Device-Recommendation-–-Apple-Watch" class="headerlink" title="2017 Best Wearable Device Recommendation – Apple Watch"></a>2017 Best Wearable Device Recommendation – Apple Watch</h1><p><strong>Keywords: Recording</strong></p><p><img src="/en/images/media/il_570xN.1294603892_67xk.jpg" alt="iWatch"></p><p>Apple Watch has the weakest presence among Apple’s four-piece set. Personally, I think the biggest issue is battery life - Gen 1 needs daily charging, Gen 2 every two days, which is really frustrating. After switching my main phone from iOS to Android, phone calls, texts, and alarm reminders became completely useless. However, this device solved a pain point for me: exercise tracking.</p><p>Treadmill + Apple Watch is simply a weight-loss weapon. The detailed exercise records also push me not to slack off. In short, Apple Watch is indispensable in my life.</p><h1 id="2017-Best-Headphone-Recommendation-–-MDR-1000X"><a href="#2017-Best-Headphone-Recommendation-–-MDR-1000X" class="headerlink" title="2017 Best Headphone Recommendation – MDR-1000X"></a>2017 Best Headphone Recommendation – MDR-1000X</h1><p><strong>Keywords: Noise Cancellation</strong></p><p><img src="/en/images/media/Sony_MDR1000X_Photo_Main.jpg" alt="Sony_MDR1000X"></p><p>Having wireless noise-canceling headphones in a noisy office is really important. Noise cancellation gives you a quiet environment - whether you’re thinking, coding, or reading, the feeling of not being disturbed by the outside world is great. Wireless brings simplicity - without the cable constraints, it’s much more convenient and avoids the annoyance of cables tangling around chairs.</p><p>I’ve been using the MDR-1000X for a while now, and I’m very satisfied with the noise cancellation, ease of use, and sound quality. Apparently wearing headphones reduces interruptions by 50% - I recommend you get a pair of noise-canceling headphones too.</p><h1 id="2017-Best-Weight-Loss-Companion-–-Treadmill"><a href="#2017-Best-Weight-Loss-Companion-–-Treadmill" class="headerlink" title="2017 Best Weight Loss Companion – Treadmill"></a>2017 Best Weight Loss Companion – Treadmill</h1><p><strong>Keywords: Persistence</strong></p><p>People always tend to be lazy. Everyone knows running helps with weight loss, but just can’t stick with it. Plus outdoor running is too affected by environment - too cold, too hot, rain, snow.</p><p>I forced a treadmill into my already crowded home. The benefit of a treadmill is that you can run anytime, and the resistance to running isn’t as strong. After work every day, open Keep, start running - five kilometers a day isn’t hard. What’s important is persistence.</p><h1 id="Other"><a href="#Other" class="headerlink" title="Other"></a>Other</h1><p>Of course there are some other things that can significantly improve quality of life. I won’t list them all - I’ll update below as I think of them:</p><ol><li>Rouqilin’s beef sauce - choose the “Beef from righteous cows” version - guaranteed you’ll love it</li><li>Dishwasher - whoever uses it knows - no more resistance to cooking at home</li><li>Robot vacuum - who doesn’t want clean floors when they get home? Especially when you have a long-haired creature and two cats at home</li></ol><h1 id="About-Me-amp-amp-Blog"><a href="#About-Me-amp-amp-Blog" class="headerlink" title="About Me &amp;&amp; Blog"></a>About Me &amp;&amp; Blog</h1><p>Below is my personal introduction and related links. I look forward to exchanging ideas with peers - when three people walk together, there must be a teacher among them!</p><ol><li><a href="https://www.androidperformance.com/en/about/">Blogger’s Personal Introduction</a>: Contains my WeChat and WeChat group links.</li><li><a href="https://www.androidperformance.com/en/2019/12/01/BlogMap/">Blog Content Navigation</a>: A navigation guide for my blog content.</li><li><a href="https://www.androidperformance.com/en/2018/05/07/Android-performance-optimization-skills-and-tools/">Personally Curated Excellent Blog Posts - Android Performance Optimization Must-Knows</a>: Recommendations and self-recommendations welcome (just WeChat message me)</li><li><a href="https://www.androidperformance.com/en/2023/12/30/the-performance/">Android Performance Optimization Knowledge Planet</a>: Welcome to join, thanks for the support~</li></ol><blockquote><p><strong>One person can walk faster, a group can walk further</strong></p></blockquote><p><img src="/en/images/WechatIMG581.webp" alt="Scan WeChat QR Code"></p>]]></content>
    
    
    <summary type="html">&lt;p&gt;2017 has passed before we knew it. The blog hasn’t been updated for a while - one reason is that I increasingly realize how shallow my knowledge is and fear that writing about technical topics might mislead readers, and another reason is simply that I’ve been too lazy. Given these two reasons, I’ve decided that blog updates no longer need to be limited to technical articles - things I find meaningful, thoughts, and reflections will also be shared here. On one hand, it serves as my own record, and if it happens to help readers along the way, that would be even better (though there aren’t many readers anyway…).&lt;/p&gt;
&lt;p&gt;Since 2017 has just passed, I feel it’s necessary to recommend to everyone the things that I found to be great experiences or very helpful for work and life in 2017 - perhaps you’ll need them in 2018. The recommendations include Apps, hardware, books, equipment, etc. It should be noted that these are things that brought me great help in 2017 - what works for me may not work for you. Without further ado, let’s get into it!&lt;/p&gt;</summary>


    <category term="Essays" scheme="https://androidperformance.com/en/categories/Essays/"/>
    
    
    <category term="Android" scheme="https://androidperformance.com/en/tags/Android/"/>
    
    <category term="Startup" scheme="https://androidperformance.com/en/tags/Startup/"/>
    
    <category term="Memory" scheme="https://androidperformance.com/en/tags/Memory/"/>
    
    <category term="Annual Recommendations" scheme="https://androidperformance.com/en/tags/Annual-Recommendations/"/>
    
  </entry>
  
  <entry>
    <title>Reflections on Work and Growth (2017)</title>
    <link href="https://androidperformance.com/en/2017/04/23/About-work/"/>
    <id>https://androidperformance.com/en/2017/04/23/About-work/</id>
    <published>2017-04-23T14:02:29.000Z</published>
    <updated>2026-05-10T23:29:51.052Z</updated>
    
    <content type="html"><![CDATA[<p>In the blink of an eye, it’s 2017. I’ve been working for nearly four years. I went to school in Weihai in 2009, started my internship in Shanghai in 2012, stayed in Shanghai after graduating in 2013, joined Meizu in Zhuhai in 2014, and have been here ever since.</p><p>I’ve been writing on this blog since graduation—writing, deleting, and rewriting—recording my journey from App development to System App development, and finally to System Framework development. Looking back after a few years is a great way to appreciate how far I’ve come.</p><p>This post records my thoughts on my blog, my job, my work habits, and my expectations for 2017. It’s a mix of confusion and ambition.</p><p>We are already 30% through 2017. I hope it’s not too late to share this.</p><span id="more"></span><h2 id="About-the-Blog"><a href="#About-the-Blog" class="headerlink" title="About the Blog"></a>About the Blog</h2><p>Looking at the timestamp of my last post, it’s been exactly a year. I’m quite ashamed. Every time I intended to start writing again, something always got in the way.</p><p>When I first graduated, I loved writing. Study notes, tutorials, everything went up on the blog. But as my career progressed and I learned more, I wrote less. One reason is that as my technical level improved, I realized my depth was still lacking. I knew the “how” but often not the “why.” In that state, I worried my writing might mislead others.</p><p>However, now that I have some accumulation, I feel it’s necessary to share my summarized experiences and tips. It’s also for my own record. Ideas and logic are easily forgotten if they aren’t written down.</p><h2 id="About-Work"><a href="#About-Work" class="headerlink" title="About Work"></a>About Work</h2><p>From my internship at HTC, a short stay at Firefly Lewa, to Meizu, I’ve worked for several years now—all in Android. Moving from App to System development has taught me that software engineering is fascinating, especially when your features are used by millions. That excitement and responsibility drive me to be better. I believe Android’s dominance in the smartphone world won’t be shaken for at least another five years, so it’s worth investing time here.</p><p>Beyond specific technical points, learning Android’s design philosophy, software architecture, and cultivating the ability to solve general problems is even more important. That is my current focus.</p><p>Regarding technical specifics, I’m currently very interested in Android and Linux process management and CPU scheduling. On the performance side, I’m leaning toward responsiveness, smoothness analysis, and tuning. These areas alone are enough to keep me busy for a long time.</p><p>Visiting the headquarters a few days ago, I saw that our company released 15 phones in 2016. Each one required performance tuning. Between the massive list of performance features and the unique performance bugs on every model, the team barely had time for deep, meaningful work. It felt like we were standing still. I hope to change this in 2017—starting with myself.</p><h2 id="About-Work-Scope"><a href="#About-Work-Scope" class="headerlink" title="About Work Scope"></a>About Work Scope</h2><p>My work mainly involves system-level optimization. I cover a lot of ground but lack extreme depth in one area. This year, I want to dive deep into a few specifics:</p><ol><li>System-level performance optimization (Framework and App layers).</li><li>Optimizing responsiveness, smoothness, memory, startup speed, overdraw, HWUI, and SurfaceFlinger.</li><li>Defining performance test cases and standards.</li><li>Identifying and implementing new performance optimization points.</li><li>Developing key system projects like the Intelligent System Tuner and process priority optimization.</li><li>Analyzing performance issues for both legacy and new devices.</li><li>Training new employees and hosting internal tech sharing sessions.</li><li>Competitive analysis.</li><li>Documentation and summaries.</li></ol><h2 id="About-Habits"><a href="#About-Habits" class="headerlink" title="About Habits"></a>About Habits</h2><p>Since 2016, I’ve developed a set of work habits, but I haven’t always followed them strictly. In 2017, I need to be more disciplined.</p><h3 id="Daily-Schedule"><a href="#Daily-Schedule" class="headerlink" title="Daily Schedule"></a>Daily Schedule</h3><p>Every morning, I plan out my day based on yesterday’s records and emails:</p><ul><li><strong>Priority</strong>: Identifying the priority of each task and doing the most important ones first.</li><li><strong>Time Estimation</strong>: Estimating the time for each task, down to 30-minute blocks.</li></ul><p>I also leave a buffer for emergencies—like someone needing an urgent analysis that disrupts my plan. Managing time is a skill. Based on my experience at the company, my schedule usually looks like this:</p><ul><li><strong>Morning</strong>: Fewer interruptions. I focus on developing important features or researching new technologies.</li><li><strong>Afternoon</strong>: Handling bugs, emails, and less critical features.</li><li><strong>Evening</strong>: Technical research.</li></ul><p>Of course, reality often gets in the way of the ideal. Software development is unpredictable. Someone suggested using a Pomodoro timer to avoid interruptions, but my personal tip is: just wear headphones!</p><p>I use <strong>Tower</strong> to manage my personal tasks. Although it’s a team collaboration tool, my team didn’t really take to it, so I use it alone. Priorities and times are displayed as tags:</p><p><img src="/en/images/media/14929591578368.jpg"></p><h3 id="Work-Logging"><a href="#Work-Logging" class="headerlink" title="Work Logging"></a>Work Logging</h3><p>After arriving home, I record the day’s work. While Tower is great for planning, it’s not ideal for logging. It’s hard to review, and personal logic or ideas get lost in it.</p><p>I use <strong>MWeb</strong> for logging. I record every task completed, no matter how small. For important tasks, I record my logic and solution. I also do weekly summaries, pulling from Redmine, email, and Tower. This ensures I don’t miss important data.</p><h3 id="Article-Clipping"><a href="#Article-Clipping" class="headerlink" title="Article Clipping"></a>Article Clipping</h3><p>I use <strong>Evernote</strong> to clip good articles or important findings, which I organize and review periodically.</p><h2 id="About-2017"><a href="#About-2017" class="headerlink" title="About 2017"></a>About 2017</h2><p>The company has been quite turbulent lately. Several colleagues have left, and we are in a painful transition phase. I’ve had my hesitations, but I’m not spending too much time overthinking it. I’ll just do every task at hand well. Opportunity favors the prepared.</p><p>As a software engineer, coding ability must always come first. I need to learn from my idol, Million (whose coding time is 51 hours a week, as shown below)!</p><p><img src="/en/images/media/14929935518939.jpg" alt="Million"></p><h1 id="About-Me-amp-amp-Blog"><a href="#About-Me-amp-amp-Blog" class="headerlink" title="About Me &amp;&amp; Blog"></a>About Me &amp;&amp; Blog</h1><p>Below is my personal intro and related links. I look forward to exchanging ideas with fellow professionals. “When three walk together, one can always be my teacher!”</p><ol><li><a href="https://www.androidperformance.com/en/about/">Blogger Intro</a></li><li><a href="https://www.androidperformance.com/en/2019/12/01/BlogMap/">Blog Content Navigation</a>: A guide for my blog content.</li><li><a href="https://www.androidperformance.com/en/2018/05/07/Android-performance-optimization-skills-and-tools/">Curated Excellent Blog Articles - Android Performance Optimization Must-Knows</a></li><li><a href="https://www.androidperformance.com/en/2023/12/30/the-performance/">Android Performance Optimization Knowledge Planet</a></li></ol><blockquote><p><strong>One walks faster alone, but a group walks further together.</strong></p></blockquote><p><img src="/en/images/WechatIMG581.webp" alt="Scan WeChat QR Code"></p>]]></content>
    
    
    <summary type="html">&lt;p&gt;In the blink of an eye, it’s 2017. I’ve been working for nearly four years. I went to school in Weihai in 2009, started my internship in Shanghai in 2012, stayed in Shanghai after graduating in 2013, joined Meizu in Zhuhai in 2014, and have been here ever since.&lt;/p&gt;
&lt;p&gt;I’ve been writing on this blog since graduation—writing, deleting, and rewriting—recording my journey from App development to System App development, and finally to System Framework development. Looking back after a few years is a great way to appreciate how far I’ve come.&lt;/p&gt;
&lt;p&gt;This post records my thoughts on my blog, my job, my work habits, and my expectations for 2017. It’s a mix of confusion and ambition.&lt;/p&gt;
&lt;p&gt;We are already 30% through 2017. I hope it’s not too late to share this.&lt;/p&gt;</summary>


    <category term="Essays" scheme="https://androidperformance.com/en/categories/Essays/"/>
    
    
    <category term="Essays" scheme="https://androidperformance.com/en/tags/Essays/"/>
    
  </entry>
  
  <entry>
    <title>Android Bottom Navigation Spec Part 2: Style, Behavior, and Dimensions</title>
    <link href="https://androidperformance.com/en/2016/04/05/android-bottom-bar-2/"/>
    <id>https://androidperformance.com/en/2016/04/05/android-bottom-bar-2/</id>
    <published>2016-04-05T15:10:25.000Z</published>
    <updated>2026-05-10T23:29:51.063Z</updated>
    
    <content type="html"><![CDATA[<p>One day in March, Google updated its design guidelines with a new component: Bottom Navigation. This release was quite surprising to many, as Bottom Navigation hadn’t been mentioned in previous Material Design iterations. Traditionally, one of the biggest differences between Android and iOS design was the use of bottom bars; while they were essential for iOS, Android apps following MD guidelines generally avoided them.</p><p>This is the second article in a series on Android Bottom Navigation, covering style, behavior, and dimensions.</p><span id="more"></span><p>The dimensions, colors, and motion rules in this article come from the early Material Design spec. For new projects, use Material 3 as the baseline: in Compose, use <code>NavigationBar</code>&#x2F;<code>NavigationBarItem</code>, and let Material 3 components handle system-bar insets where applicable. When migrating from Material 2, <code>BottomNavigation</code>&#x2F;<code>BottomNavigationItem</code> map to Material 3 <code>NavigationBar</code>&#x2F;<code>NavigationBarItem</code>. Bottom navigation still fits compact widths, but medium and expanded windows should switch to a navigation rail, drawer, or adaptive navigation component so the bar does not stretch awkwardly across wide screens.</p><h1 id="1-Style"><a href="#1-Style" class="headerlink" title="1. Style"></a>1. Style</h1><h2 id="1-1-Icons-and-Text"><a href="#1-1-Icons-and-Text" class="headerlink" title="1.1. Icons and Text"></a>1.1. Icons and Text</h2><p>Because bottom navigation actions are presented as icons, they should be used for content that can be suitably communicated with icons. Use icons that follow these styling rules:</p><ul><li>Show the icon and text label for the focused (active) item.</li><li>If there are only three items, show icons and text labels for all items.</li><li>If there are four or five items, show only the icon for inactive items.</li></ul><h2 id="1-2-Color"><a href="#1-2-Color" class="headerlink" title="1.2. Color"></a>1.2. Color</h2><p>Tint the current bottom navigation action (including the icon and any text label present) with the app’s primary color.</p><p><img src="/en/images/bottombar2/1.webp" alt="Do: Use the app’s primary color to indicate the view in focus."></p><p><img src="/en/images/bottombar2/2.webp" alt="Don&#39;t: Avoid using different colored icons and text labels."></p><p>If the bottom navigation bar is colored, use black or white for the icons and text labels.</p><p><img src="/en/images/bottombar2/3.webp" alt="Do: Use black or white iconography if the bottom navigation bar is colored."></p><p><img src="/en/images/bottombar2/4.webp" alt="Don&#39;t: Avoid pairing colored icons with a colored bottom navigation bar."></p><h2 id="1-3-Text-Labels"><a href="#1-3-Text-Labels" class="headerlink" title="1.3. Text Labels"></a>1.3. Text Labels</h2><p>Text labels provide concise definitions for navigation icons. Avoid long text that may be truncated or obscured.</p><p><img src="/en/images/bottombar2/5.webp" alt="Do: Use short labels."></p><p><img src="/en/images/bottombar2/6.webp" alt="Don&#39;t: Avoid labels with wrapping text."></p><p><img src="/en/images/bottombar2/7.webp" alt="Don&#39;t: Avoid truncating text labels."></p><p><img src="/en/images/bottombar2/8.webp" alt="Don&#39;t: Avoid shrinking text labels to fit on a single line."></p><h1 id="2-Behavior"><a href="#2-Behavior" class="headerlink" title="2. Behavior"></a>2. Behavior</h1><p>Tapping a bottom navigation icon will navigate directly to that view or refresh the current view.</p><ul><li>Each icon must point to a target and should not open a menu or a separate window.</li><li>The navigation bar can be shown or hidden dynamically during scrolling:<ul><li>Hide the bar when scrolling down.</li><li>Show the bar when scrolling up.</li></ul></li><li>Swipe gestures on the content area should not trigger navigation.</li><li>Use cross-fading animations when transitioning between views.</li></ul><h1 id="3-Dimensions"><a href="#3-Dimensions" class="headerlink" title="3. Dimensions"></a>3. Dimensions</h1><h2 id="3-1-Fixed-Bottom-Navigation-Bar"><a href="#3-1-Fixed-Bottom-Navigation-Bar" class="headerlink" title="3.1. Fixed Bottom Navigation Bar"></a>3.1. Fixed Bottom Navigation Bar</h2><p>Divide the total length of the bar by the number of icons to calculate the width of each item. Ensure each item has sufficient space.</p><p><img src="/en/images/bottombar2/9.webp" alt="Fixed bottom navigation bar on mobile"></p><p>Width constraints (including padding):</p><ul><li>Maximum: 168dp</li><li>Minimum: 120dp for large screens, 104dp for small screens</li></ul><p>Height: 56dp<br>Icon size: 24x24dp</p><p><img src="/en/images/bottombar2/11.webp" alt="168dp max width"></p><p>Alignment: Items should be centered both horizontally and vertically.</p><p>Padding:</p><ul><li>6dp above icon (active view), 8dp above icon (inactive view)</li><li>10dp below text label</li><li>12dp left and right of text label</li></ul><p>Text Labels:</p><ul><li>Roboto Regular: 14sp (active view)</li><li>Roboto Regular: 12sp (inactive view)</li></ul><p><img src="/en/images/bottombar2/12.webp" alt="12dp left and right of text"></p><p><img src="/en/images/bottombar2/13.webp" alt="12dp left and right of text"></p><p><img src="/en/images/bottombar2/14.webp" alt="Fixed bottom navigation bar on landscape mobile"></p><p><img src="/en/images/bottombar2/15.webp" alt="Fixed bottom navigation bar on tablet"></p><h2 id="3-2-Shifting-Bottom-Navigation-Bar"><a href="#3-2-Shifting-Bottom-Navigation-Bar" class="headerlink" title="3.2. Shifting Bottom Navigation Bar"></a>3.2. Shifting Bottom Navigation Bar</h2><p><img src="/en/images/bottombar2/16.webp" alt="Shifting bottom navigation bar on mobile"></p><p>Width constraints (including padding):<br>Active Item:</p><ul><li>Maximum: 168dp</li><li>Minimum: 96dp</li></ul><p>Inactive Item:</p><ul><li>Maximum: 96dp</li><li>Minimum: 64dp</li></ul><p><img src="/en/images/bottombar2/17.webp" alt="Active view: 96dp min width"></p><p><img src="/en/images/bottombar2/18.webp" alt="Active view: 168dp max width"></p><p><img src="/en/images/bottombar2/19.webp" alt="Inactive view: 64dp min width"></p><p><img src="/en/images/bottombar2/20.webp" alt="Inactive view: 96dp max width"></p><p>Height: 56dp<br>Icon size: 24x24dp<br>Alignment: Centered horizontally and vertically.</p><p>Padding:</p><ul><li>6dp above icon (active view), 16dp above and below icon (inactive view)</li><li>10dp below text label</li></ul><p>Text Labels:</p><ul><li>Roboto Regular: 14sp (active view)</li></ul><p><img src="/en/images/bottombar2/21.webp" alt="Shifting bottom navigation bar on landscape mobile"></p><p><img src="/en/images/bottombar2/22.webp" alt="Shifting bottom navigation bar on tablet"></p><h1 id="4-Elevation-and-Hierarchy"><a href="#4-Elevation-and-Hierarchy" class="headerlink" title="4. Elevation and Hierarchy"></a>4. Elevation and Hierarchy</h1><p>Since snackbars have an elevation of 6dp and the navigation bar has 8dp, snackbars appear behind the navigation bar. Bottom sheets, navigation drawers, and keyboards have higher elevations and will cover the navigation bar completely.</p><p><img src="/en/images/bottombar2/23.webp" alt="Snackbars appear behind the bottom navigation bar."></p><p><img src="/en/images/bottombar2/24.webp" alt="Orthographic view of app structure"></p><h1 id="About-Me-amp-amp-Blog"><a href="#About-Me-amp-amp-Blog" class="headerlink" title="About Me &amp;&amp; Blog"></a>About Me &amp;&amp; Blog</h1><p>Below is my personal intro and related links. I look forward to exchanging ideas with fellow professionals. “When three walk together, one can always be my teacher!”</p><ol><li><a href="https://www.androidperformance.com/en/about/">Blogger Intro</a></li><li><a href="https://www.androidperformance.com/en/2019/12/01/BlogMap/">Blog Content Navigation</a>: A guide for my blog content.</li><li><a href="https://www.androidperformance.com/en/2018/05/07/Android-performance-optimization-skills-and-tools/">Curated Excellent Blog Articles - Android Performance Optimization Must-Knows</a></li><li><a href="https://www.androidperformance.com/en/2023/12/30/the-performance/">Android Performance Optimization Knowledge Planet</a></li></ol><blockquote><p><strong>One walks faster alone, but a group walks further together.</strong></p></blockquote><p><img src="/en/images/WechatIMG581.webp" alt="Scan WeChat QR Code"></p>]]></content>
    
    
    <summary type="html">&lt;p&gt;One day in March, Google updated its design guidelines with a new component: Bottom Navigation. This release was quite surprising to many, as Bottom Navigation hadn’t been mentioned in previous Material Design iterations. Traditionally, one of the biggest differences between Android and iOS design was the use of bottom bars; while they were essential for iOS, Android apps following MD guidelines generally avoided them.&lt;/p&gt;
&lt;p&gt;This is the second article in a series on Android Bottom Navigation, covering style, behavior, and dimensions.&lt;/p&gt;</summary>


    <category term="Android" scheme="https://androidperformance.com/en/categories/Android/"/>
    
    
    <category term="Android" scheme="https://androidperformance.com/en/tags/Android/"/>
    
    <category term="Design Specs" scheme="https://androidperformance.com/en/tags/Design-Specs/"/>
    
  </entry>
  
  <entry>
    <title>Android Bottom Navigation Spec Part 1: Usage</title>
    <link href="https://androidperformance.com/en/2016/04/05/android-bottom-bar-1/"/>
    <id>https://androidperformance.com/en/2016/04/05/android-bottom-bar-1/</id>
    <published>2016-04-05T14:57:58.000Z</published>
    <updated>2026-05-10T23:29:51.063Z</updated>
    
    <content type="html"><![CDATA[<p>One day in March, Google updated its design guidelines with a new component: Bottom Navigation. This release was quite surprising to many, as Bottom Navigation hadn’t been mentioned in previous Material Design iterations. Traditionally, one of the biggest differences between Android and iOS design was the use of bottom bars; while they were essential for iOS, Android apps following MD guidelines generally avoided them.</p><p>This is the first article in a series on Android Bottom Navigation, covering its usage and historical evolution.</p><span id="more"></span><p>This article captures the 2016 moment when Material Design first embraced bottom navigation. In current implementations, map “Bottom navigation” to Material 3 Navigation bar: use <code>NavigationBar</code>&#x2F;<code>NavigationBarItem</code> in Compose, or Material Components <code>BottomNavigationView</code> in the View system. The usage rule is still similar: three to five equally important top-level destinations that need persistent access on compact widths. For large screens, foldables, landscape, and desktop-sized windows, prefer a navigation rail, navigation drawer, or adaptive NavigationSuite instead of applying phone bottom-bar rules to every window size.</p><h2 id="1-Previous-Android-Bottom-Bar-Design-Specs"><a href="#1-Previous-Android-Bottom-Bar-Design-Specs" class="headerlink" title="1. Previous Android Bottom Bar Design Specs"></a>1. Previous Android Bottom Bar Design Specs</h2><p><img src="/en/images/bottombar1/14598674457055.jpg" alt="Google&#39;s previous design guidelines for the bottom bar"></p><h2 id="2-WeChat’s-Redesign"><a href="#2-WeChat’s-Redesign" class="headerlink" title="2. WeChat’s Redesign"></a>2. WeChat’s Redesign</h2><p>Before Google’s official support, WeChat caused quite a stir in the Android community when it moved away from the bottom bar in version 5.2, only to quickly bring it back after testing.</p><p><img src="/en/images/bottombar1/14598674884766.jpg" alt="WeChat experiment with tab design"></p><p><img src="/en/images/bottombar1/14598675383016.jpg" alt="WeChat after returning to bottom navigation"></p><h2 id="3-Google-’s-Redesign"><a href="#3-Google-’s-Redesign" class="headerlink" title="3. Google+’s Redesign"></a>3. Google+’s Redesign</h2><p>The most recent major app to adopt Bottom Navigation before it became official was Google+:</p><p><img src="/en/images/bottombar1/14598675580793.jpg" alt="Google+ redesign with bottom navigation"></p><p>While it felt like a reversal of previous design philosophies, rules are made to be refined. WeChat, for instance, proved that user experience often trumps rigid adherence to a single design language.</p><h2 id="4-Bottom-Navigation-Design-Specs"><a href="#4-Bottom-Navigation-Design-Specs" class="headerlink" title="4. Bottom Navigation Design Specs"></a>4. Bottom Navigation Design Specs</h2><p>Let’s look at the official <a href="https://material.io/components/bottom-navigation">Bottom Navigation Design Guidelines</a>. For developers, following these specs ensures that our apps look professional even without a dedicated designer.</p><h3 id="4-1-Usage"><a href="#4-1-Usage" class="headerlink" title="4.1. Usage"></a>4.1. Usage</h3><p>Bottom Navigation is primarily designed for mobile apps, providing quick navigation between top-level views. Larger displays, such as tablets or desktops, should use side navigation instead.</p><p><img src="/en/images/bottombar1/14598675822179.jpg" alt="The bottom navigation bar on mobile"><br><img src="/en/images/bottombar1/14598676008074.jpg" alt="Left navigation on a larger display, such as tablet or desktop"></p><h4 id="4-1-1-When-to-Use"><a href="#4-1-1-When-to-Use" class="headerlink" title="4.1.1. When to Use"></a>4.1.1. When to Use</h4><p>Use Bottom Navigation when:</p><ul><li>There are three to five top-level destinations of equal importance.</li><li>These destinations need to be accessible from anywhere in the app.</li></ul><h5 id="Do-and-Don’t-1-Number-of-Items"><a href="#Do-and-Don’t-1-Number-of-Items" class="headerlink" title="[Do and Don’t] 1. Number of Items"></a>[Do and Don’t] 1. Number of Items</h5><p>Don’t use Bottom Navigation for fewer than three destinations; use tabs instead.</p><p><img src="/en/images/bottombar1/14598676393637.jpg" alt="Do: Use three to five top-level destinations."><br><img src="/en/images/bottombar1/14598676746527.jpg" alt="Don&#39;t: If there are fewer than three destinations, use tabs."></p><h5 id="Do-and-Don’t-2-No-Horizontal-Scrolling"><a href="#Do-and-Don’t-2-No-Horizontal-Scrolling" class="headerlink" title="[Do and Don’t] 2. No Horizontal Scrolling"></a>[Do and Don’t] 2. No Horizontal Scrolling</h5><p>If you have more than five items, move the extra ones to a navigation drawer. Never make the bottom bar scrollable.</p><p><img src="/en/images/bottombar1/14598676965667.jpg" alt="Do: Views are fixed in a bottom navigation bar."><br><img src="/en/images/bottombar1/14598677161097.jpg" alt="Don&#39;t: Avoid scrollable content in the bottom navigation bar."></p><h5 id="Do-and-Don’t-3-Optimal-Item-Count"><a href="#Do-and-Don’t-3-Optimal-Item-Count" class="headerlink" title="[Do and Don’t] 3. Optimal Item Count"></a>[Do and Don’t] 3. Optimal Item Count</h5><p>Keep the count between 3 and 5. More than five makes the targets too small and crowded.</p><p><img src="/en/images/bottombar1/14598677362029.jpg" alt="Do: Use up to five top-level destinations."><br><img src="/en/images/bottombar1/14598677540938.jpg" alt="Don&#39;t: Avoid using more than five destinations."></p><h2 id="5-Bottom-Navigation-vs-Tabs"><a href="#5-Bottom-Navigation-vs-Tabs" class="headerlink" title="5. Bottom Navigation vs. Tabs"></a>5. Bottom Navigation vs. Tabs</h2><p>Mixing Bottom Navigation and tabs can be confusing for users. For example, clicking a tab that changes the entire bottom navigation state (or vice-versa) leads to a poor experience.</p><p>Tabs rely more on swiping gestures, whereas Bottom Navigation is designed for convenient tapping due to its proximity to the user’s thumb.</p><h1 id="About-Me-amp-amp-Blog"><a href="#About-Me-amp-amp-Blog" class="headerlink" title="About Me &amp;&amp; Blog"></a>About Me &amp;&amp; Blog</h1><p>Below is my personal intro and related links. I look forward to exchanging ideas with fellow professionals. “When three walk together, one can always be my teacher!”</p><ol><li><a href="https://www.androidperformance.com/en/about/">Blogger Intro</a></li><li><a href="https://www.androidperformance.com/en/2019/12/01/BlogMap/">Blog Content Navigation</a>: A guide for my blog content.</li><li><a href="https://www.androidperformance.com/en/2018/05/07/Android-performance-optimization-skills-and-tools/">Curated Excellent Blog Articles - Android Performance Optimization Must-Knows</a></li><li><a href="https://www.androidperformance.com/en/2023/12/30/the-performance/">Android Performance Optimization Knowledge Planet</a></li></ol><blockquote><p><strong>One walks faster alone, but a group walks further together.</strong></p></blockquote><p><img src="/en/images/WechatIMG581.webp" alt="Scan WeChat QR Code"></p>]]></content>
    
    
    <summary type="html">&lt;p&gt;One day in March, Google updated its design guidelines with a new component: Bottom Navigation. This release was quite surprising to many, as Bottom Navigation hadn’t been mentioned in previous Material Design iterations. Traditionally, one of the biggest differences between Android and iOS design was the use of bottom bars; while they were essential for iOS, Android apps following MD guidelines generally avoided them.&lt;/p&gt;
&lt;p&gt;This is the first article in a series on Android Bottom Navigation, covering its usage and historical evolution.&lt;/p&gt;</summary>


    <category term="Android" scheme="https://androidperformance.com/en/categories/Android/"/>
    
    
    <category term="Android" scheme="https://androidperformance.com/en/tags/Android/"/>
    
    <category term="Design Specs" scheme="https://androidperformance.com/en/tags/Design-Specs/"/>
    
  </entry>
  
  <entry>
    <title>How to Calculate App Startup Time in Android?</title>
    <link href="https://androidperformance.com/en/2015/12/31/How-to-calculation-android-app-lunch-time/"/>
    <id>https://androidperformance.com/en/2015/12/31/How-to-calculation-android-app-lunch-time/</id>
    <published>2015-12-31T05:52:30.000Z</published>
    <updated>2026-05-10T23:29:51.061Z</updated>
    
    <content type="html"><![CDATA[<p>Someone recently asked on Zhihu: <a href="https://www.zhihu.com/question/35487841/answer/63011462">“How to calculate APK startup time?”</a></p><blockquote><p>“How can I use Python or direct ADB commands to calculate APK startup time? I want to measure the time from clicking the icon to the APK being fully started. For example, in a game, this would be from the icon tap to entering the login screen. Existing methods like <code>adb shell am start -W</code> provide <code>ThisTime</code> and <code>TotalTime</code>, but I’m unsure of the difference and they don’t seem to match visual reality.”</p></blockquote><p>My colleague <a href="https://www.zhihu.com/people/guo-qi-fa">Guo Qifa</a> and I provided detailed answers. Since Zhihu reach can be limited, I’ve compiled our responses here with his permission as a guide for other developers.</p><span id="more"></span><p>The explanation of <code>ThisTime</code>, <code>TotalTime</code>, and <code>WaitTime</code> from <code>am start -W</code> is still useful, but today this command is best treated as a local rough check and a way to understand AMS launch accounting. For comparing startup performance across versions, use Macrobenchmark <code>StartupTimingMetric</code> so startup mode, compilation mode, warmup steps, and iteration count are controlled. For field quality, also check Android Vitals startup metrics. When <code>am start -W</code> does not match user perception, do not focus only on the three numbers; capture Perfetto&#x2F;System Trace and align first frame, first content, RenderThread, Binder, I&#x2F;O, GC, and SystemServer scheduling evidence.</p><h1 id="1-Startup-Scenarios"><a href="#1-Startup-Scenarios" class="headerlink" title="1. Startup Scenarios"></a>1. Startup Scenarios</h1><p>Startup time can be accurately measured, but the method differs significantly between standard <strong>apps</strong> and <strong>games</strong> due to how they are developed and rendered on Android.</p><h2 id="1-1-App-Startup"><a href="#1-1-App-Startup" class="headerlink" title="1.1 App Startup"></a>1.1 App Startup</h2><p>For standard apps, we define a <code>MainActivity</code>. When a user taps the icon, the system launches this Activity, triggering lifecycle callbacks: <code>onCreate</code>, <code>onStart</code>, and <code>onResume</code>.</p><p>Many textbooks claim the app is “displayed” once <code>onResume</code> finishes. This is technically inaccurate. From the system’s perspective, <code>onResume</code> only completes the app’s internal configuration (window attributes, inflation of the View tree). Afterward, <code>ViewRootImpl</code> still triggers multiple <code>performTraversals</code> cycles for EGL initialization, measurement, layout, and drawing.</p><p>True startup time should be measured from the moment of the icon tap until the user sees the first frame of the layout defined in <code>setContentView</code>—the “App First Frame.”</p><p>The command <code>adb shell am start -W packagename/activity</code> is indeed the standard tool for this, but you must understand its output.</p><h2 id="1-2-Cold-Startup-First-Launch"><a href="#1-2-Cold-Startup-First-Launch" class="headerlink" title="1.2 Cold Startup (First Launch)"></a>1.2 Cold Startup (First Launch)</h2><p>This is the most common scenario: starting the app when its process doesn’t exist. The system must create the process before starting the <code>MainActivity</code>.</p><p>Running the command on Android 5.0+ returns three values:</p><figure class="highlight shell"><table><tr><td class="gutter"><pre><span class="line">1</span><br><span class="line">2</span><br><span class="line">3</span><br><span class="line">4</span><br><span class="line">5</span><br><span class="line">6</span><br><span class="line">7</span><br><span class="line">8</span><br></pre></td><td class="code"><pre><span class="line">➜ adb shell am start -W com.media.painter/com.media.painter.PainterMainActivity</span><br><span class="line">Starting: Intent &#123; act=android.intent.action.MAIN cat=[android.intent.category.LAUNCHER] cmp=com.media.painter/.PainterMainActivity &#125;</span><br><span class="line">Status: ok</span><br><span class="line">Activity: com.media.painter/.PainterMainActivity</span><br><span class="line">ThisTime: 355</span><br><span class="line">TotalTime: 355</span><br><span class="line">WaitTime: 365</span><br><span class="line">Complete</span><br></pre></td></tr></table></figure><p><strong>What do these mean?</strong><br>The command implementation exists in <code>Am.java</code>. It makes a Binder call to <code>ActivityManagerService.startActivityAndWait()</code>.</p><ul><li><strong>WaitTime</strong>: The total time elapsed from the perspective of the <code>am</code> command. It includes the time taken to pause the previous activity and the time taken to start the new one.</li><li><strong>TotalTime</strong>: The time taken to start the new process and the Activity. <strong>This is usually the value developers should care about most.</strong></li><li><strong>ThisTime</strong>: The time taken to start the <em>last</em> Activity in a sequence.</li></ul><p><strong>Why is <code>ThisTime</code> different from <code>TotalTime</code>?</strong><br>If you tap an icon and it launches a single Activity, <code>ThisTime</code> will equal <code>TotalTime</code>. However, if your app launches a transparent “logic” Activity first, which then starts the real UI Activity (a common pattern in apps like Zhihu), <code>TotalTime</code> tracks from the start of the <em>first</em> (logic) Activity, while <code>ThisTime</code> only tracks the <em>last</em> (UI) Activity.</p><p><img src="/en/images/applunch3/3.webp" alt="ThisTime vs TotalTime"></p><ol><li><strong>Segment ①</strong>: AMS creates the ActivityRecord, chooses a Task, and pauses the current foreground activity.</li><li><strong>Segment ②</strong>: Process creation, calling <code>onCreate</code> of the non-UI Activity, and then pausing&#x2F;finishing it.</li><li><strong>Segment ③</strong>: Calling <code>onCreate</code> and <code>onResume</code> of the UI Activity.</li></ol><p><strong>Understanding the “End Point”:</strong><br>The system considers a launch “finished” only after the window is added to the Window Manager Service (WMS) and the first frame is fully drawn. WMS then calls <code>reportLaunchTimeLocked()</code> to notify AMS, which stops the timer.</p><p><strong>Summary:</strong></p><ul><li>For app-specific launch performance: use <strong>TotalTime</strong>.</li><li>For system-wide perceived delay: use <strong>WaitTime</strong>.</li><li>For a specific UI Activity’s transition time: use <strong>ThisTime</strong>.</li></ul><h1 id="2-Game-Startup"><a href="#2-Game-Startup" class="headerlink" title="2. Game Startup"></a>2. Game Startup</h1><p>Command-line tools are less effective for games because a significant portion of the “loading” happens inside the game engine, invisible to the Android View system.</p><h2 id="2-1-System-Phase"><a href="#2-1-System-Phase" class="headerlink" title="2.1 System Phase"></a>2.1 System Phase</h2><p>The system launches the game’s main Activity. This part can be measured via ADB.</p><h2 id="2-2-Game-Phase"><a href="#2-2-Game-Phase" class="headerlink" title="2.2 Game Phase"></a>2.2 Game Phase</h2><p>Once the Activity is “started,” the game engine typically performs heavy tasks while showing a splash screen: loading assets, networking for updates, initializing the engine, etc. The game is only “loaded” when the user can interact with the menu.</p><p>Because these tasks are internal game logic, you must use <strong>Logs</strong> to mark the start and end points of these specific operations. We define game startup as the duration from the <strong>icon tap</strong> to the <strong>interactive state</strong>.</p><h1 id="3-Conclusion"><a href="#3-Conclusion" class="headerlink" title="3. Conclusion"></a>3. Conclusion</h1><p>The beauty of computer science is its precision. While every launch might vary slightly due to system conditions, each measurement is a factual record of that specific instance.</p><p>Every company has different priorities. ROM developers prioritize lightning-fast launches of built-in apps to create a perception of smoothness. Internet apps often prioritize monetizable “Startup Pages” (ads) before showing the main UI. Regardless of your strategy, startup speed is a vital performance KPI.</p><p>As they say:</p><blockquote><p>“In the world of Kung Fu, speed defines the winner!”</p></blockquote><h1 id="About-Me-amp-amp-Blog"><a href="#About-Me-amp-amp-Blog" class="headerlink" title="About Me &amp;&amp; Blog"></a>About Me &amp;&amp; Blog</h1><p>(Links and introduction)</p>]]></content>
    
    
    <summary type="html">&lt;p&gt;Someone recently asked on Zhihu: &lt;a href=&quot;https://www.zhihu.com/question/35487841/answer/63011462&quot;&gt;“How to calculate APK startup time?”&lt;/a&gt;&lt;/p&gt;
&lt;blockquote&gt;
&lt;p&gt;“How can I use Python or direct ADB commands to calculate APK startup time? I want to measure the time from clicking the icon to the APK being fully started. For example, in a game, this would be from the icon tap to entering the login screen. Existing methods like &lt;code&gt;adb shell am start -W&lt;/code&gt; provide &lt;code&gt;ThisTime&lt;/code&gt; and &lt;code&gt;TotalTime&lt;/code&gt;, but I’m unsure of the difference and they don’t seem to match visual reality.”&lt;/p&gt;
&lt;/blockquote&gt;
&lt;p&gt;My colleague &lt;a href=&quot;https://www.zhihu.com/people/guo-qi-fa&quot;&gt;Guo Qifa&lt;/a&gt; and I provided detailed answers. Since Zhihu reach can be limited, I’ve compiled our responses here with his permission as a guide for other developers.&lt;/p&gt;</summary>


    <category term="Android" scheme="https://androidperformance.com/en/categories/Android/"/>
    
    
    <category term="Android" scheme="https://androidperformance.com/en/tags/Android/"/>
    
    <category term="Startup" scheme="https://androidperformance.com/en/tags/Startup/"/>
    
    <category term="Memory" scheme="https://androidperformance.com/en/tags/Memory/"/>
    
    <category term="Java" scheme="https://androidperformance.com/en/tags/Java/"/>
    
  </entry>
  
  <entry>
    <title>Android App Launch Optimization: Implementation and Principles of DelayLoad (Part 2)</title>
    <link href="https://androidperformance.com/en/2015/12/29/Android-App-Launch-Optimization-DelayLoad-Part-2/"/>
    <id>https://androidperformance.com/en/2015/12/29/Android-App-Launch-Optimization-DelayLoad-Part-2/</id>
    <published>2015-12-29T08:34:06.000Z</published>
    <updated>2026-05-10T23:29:51.053Z</updated>
    
    <content type="html"><![CDATA[<p>In the <a href="https://www.androidperformance.com/2015/11/18/Android-app-lunch-optimize-delay-load/">previous article</a>, we used the third method to implement DelayLoad. However, the previous article was written relatively simply and only explained how to implement. This article will explain why we need to do this and the principles behind it.</p><p>This will involve some relatively important classes in Android, as well as several relatively important functions in Activity lifecycle.</p><p>Actually, the principles here are quite simple, but to clarify the implementation process, it’s still a quite interesting thing. It will involve using some tools, adding debug code ourselves, and proceeding step by step. Through this, our understanding of Activity launch will be one layer deeper. I hope that after reading this, everyone will also get some help from it.</p><span id="more"></span><p>The following analysis of <code>DecorView.post</code>, MessageQueue, VSYNC, and Activity startup order is still useful for understanding why work can be moved after the first frame. In current practice, add one more validation layer: use Macrobenchmark <code>StartupTimingMetric</code> to quantify startup, and Perfetto&#x2F;System Trace to check whether delayed work actually runs after the first frame, whether it affects the next few frames, and whether it introduces Binder, I&#x2F;O, or GC jitter. DelayLoad counts as an optimization only when both the metric and the timeline support it; otherwise it may simply turn startup delay into post-entry jank.</p><p>In the previous article, the core method of DelayLoad we ultimately used was to add the following method in the Activity’s onCreate function:</p><figure class="highlight java"><table><tr><td class="gutter"><pre><span class="line">1</span><br><span class="line">2</span><br><span class="line">3</span><br><span class="line">4</span><br><span class="line">5</span><br><span class="line">6</span><br></pre></td><td class="code"><pre><span class="line">getWindow().getDecorView().post(<span class="keyword">new</span> <span class="title class_">Runnable</span>() &#123;</span><br><span class="line">    <span class="meta">@Override</span></span><br><span class="line">    <span class="keyword">public</span> <span class="keyword">void</span> <span class="title function_">run</span><span class="params">()</span> &#123;</span><br><span class="line">                myHandler.post(mLoadingRunnable);</span><br><span class="line">            &#125;</span><br><span class="line">        &#125;);</span><br></pre></td></tr></table></figure><p>Let’s look at the involved classes and methods one by one.</p><h2 id="1-Activity-getWindow-and-PhoneWindow-Initialization-Timing"><a href="#1-Activity-getWindow-and-PhoneWindow-Initialization-Timing" class="headerlink" title="1. Activity.getWindow and PhoneWindow Initialization Timing"></a>1. Activity.getWindow and PhoneWindow Initialization Timing</h2><p>Activity’s getWindow method obtains a PhoneWindow object:</p><figure class="highlight java"><table><tr><td class="gutter"><pre><span class="line">1</span><br><span class="line">2</span><br><span class="line">3</span><br></pre></td><td class="code"><pre><span class="line"><span class="keyword">public</span> Window <span class="title function_">getWindow</span><span class="params">()</span> &#123;</span><br><span class="line">    <span class="keyword">return</span> mWindow;</span><br><span class="line">&#125;</span><br></pre></td></tr></table></figure><p>This mWindow is a PhoneWindow object, and its initialization timing is when this Activity attaches:</p><figure class="highlight java"><table><tr><td class="gutter"><pre><span class="line">1</span><br><span class="line">2</span><br><span class="line">3</span><br><span class="line">4</span><br><span class="line">5</span><br><span class="line">6</span><br><span class="line">7</span><br><span class="line">8</span><br><span class="line">9</span><br><span class="line">10</span><br><span class="line">11</span><br><span class="line">12</span><br><span class="line">13</span><br><span class="line">14</span><br><span class="line">15</span><br><span class="line">16</span><br><span class="line">17</span><br><span class="line">18</span><br><span class="line">19</span><br><span class="line">20</span><br><span class="line">21</span><br><span class="line">22</span><br></pre></td><td class="code"><pre><span class="line"><span class="keyword">final</span> <span class="keyword">void</span> <span class="title function_">attach</span><span class="params">(Context context, ActivityThread aThread,</span></span><br><span class="line"><span class="params">        Instrumentation instr, IBinder token, <span class="type">int</span> ident,</span></span><br><span class="line"><span class="params">        Application application, Intent intent, ActivityInfo info,</span></span><br><span class="line"><span class="params">        CharSequence title, Activity parent, String id,</span></span><br><span class="line"><span class="params">        NonConfigurationInstances lastNonConfigurationInstances,</span></span><br><span class="line"><span class="params">        Configuration config, String referrer, IVoiceInteractor voiceInteractor)</span> &#123;</span><br><span class="line">    attachBaseContext(context);</span><br><span class="line"></span><br><span class="line">    mFragments.attachActivity(<span class="built_in">this</span>, mContainer, <span class="literal">null</span>);</span><br><span class="line"></span><br><span class="line">    mWindow = PolicyManager.makeNewWindow(<span class="built_in">this</span>);</span><br><span class="line">    mWindow.setCallback(<span class="built_in">this</span>);</span><br><span class="line">    mWindow.setOnWindowDismissedCallback(<span class="built_in">this</span>);</span><br><span class="line">    mWindow.getLayoutInflater().setPrivateFactory(<span class="built_in">this</span>);</span><br><span class="line">    ........</span><br><span class="line"></span><br><span class="line">    <span class="comment">// PolicyManager.makeNewWindow(this) will ultimately call Policy&#x27;s makeNewWindow method</span></span><br><span class="line">    <span class="keyword">public</span> Window <span class="title function_">makeNewWindow</span><span class="params">(Context context)</span> &#123;</span><br><span class="line">    <span class="keyword">return</span> <span class="keyword">new</span> <span class="title class_">PhoneWindow</span>(context);</span><br><span class="line">    &#125;</span><br><span class="line"></span><br><span class="line">&#125;</span><br></pre></td></tr></table></figure><p>Note that Activity’s attach method is called quite early, earlier than Activity’s onCreate method.</p><h3 id="Summary"><a href="#Summary" class="headerlink" title="Summary:"></a>Summary:</h3><ul><li>The one-to-one relationship between PhoneWindow and Activity should be clearer through the above initialization process.</li><li>Android’s comment on PhoneWindow is: “Android-specific Window,” visible its importance.</li><li>PhoneWindow has many methods that everyone is relatively familiar with, such as setContentView&#x2F;addContentView, etc.; it also has several important internal classes, such as: DecorView;</li></ul><h2 id="2-PhoneWindow-getDecorView-and-DecorView-Initialization-Timing"><a href="#2-PhoneWindow-getDecorView-and-DecorView-Initialization-Timing" class="headerlink" title="2. PhoneWindow.getDecorView and DecorView Initialization Timing"></a>2. PhoneWindow.getDecorView and DecorView Initialization Timing</h2><p>Earlier we said that DecorView is an internal class of PhoneWindow, and its definition is as follows:</p><figure class="highlight java"><table><tr><td class="gutter"><pre><span class="line">1</span><br></pre></td><td class="code"><pre><span class="line"><span class="keyword">private</span> <span class="keyword">final</span> <span class="keyword">class</span> <span class="title class_">DecorView</span> <span class="keyword">extends</span> <span class="title class_">FrameLayout</span> <span class="keyword">implements</span> <span class="title class_">RootViewSurfaceTaker</span></span><br></pre></td></tr></table></figure><p>So when is DecorView initialized? DecorView is initialized in the Activity’s parent class’s onCreate method. For example, MainActivity in my example inherits from android.support.v7.app.AppCompatActivity. When we call MainActivity’s super.onCreate(savedInstanceState);, the following will be called:</p><figure class="highlight java"><table><tr><td class="gutter"><pre><span class="line">1</span><br><span class="line">2</span><br><span class="line">3</span><br><span class="line">4</span><br><span class="line">5</span><br></pre></td><td class="code"><pre><span class="line"><span class="keyword">protected</span> <span class="keyword">void</span> <span class="title function_">onCreate</span><span class="params">(<span class="meta">@Nullable</span> Bundle savedInstanceState)</span> &#123;</span><br><span class="line">    getDelegate().installViewFactory();</span><br><span class="line">    getDelegate().onCreate(savedInstanceState);</span><br><span class="line">    <span class="built_in">super</span>.onCreate(savedInstanceState);</span><br><span class="line">&#125;</span><br></pre></td></tr></table></figure><p>Since we imported the AppCompatActivity from the support.v7 package, getDelegate() gets us AppCompatDelegateImplV7, and its onCreate method is as follows:</p><figure class="highlight java"><table><tr><td class="gutter"><pre><span class="line">1</span><br><span class="line">2</span><br><span class="line">3</span><br><span class="line">4</span><br><span class="line">5</span><br><span class="line">6</span><br></pre></td><td class="code"><pre><span class="line"><span class="keyword">public</span> <span class="keyword">void</span> <span class="title function_">onCreate</span><span class="params">(Bundle savedInstanceState)</span> &#123;</span><br><span class="line">    <span class="built_in">super</span>.onCreate(savedInstanceState);</span><br><span class="line"></span><br><span class="line">    mWindowDecor = (ViewGroup) mWindow.getDecorView();</span><br><span class="line">    ......</span><br><span class="line">&#125;</span><br></pre></td></tr></table></figure><p>That is, here’s mWindow.getDecorView(), which instantiates the DecorView:</p><figure class="highlight java"><table><tr><td class="gutter"><pre><span class="line">1</span><br><span class="line">2</span><br><span class="line">3</span><br><span class="line">4</span><br><span class="line">5</span><br><span class="line">6</span><br></pre></td><td class="code"><pre><span class="line"><span class="keyword">public</span> <span class="keyword">final</span> View <span class="title function_">getDecorView</span><span class="params">()</span> &#123;</span><br><span class="line">    <span class="keyword">if</span> (mDecor == <span class="literal">null</span>) &#123;</span><br><span class="line">        installDecor();</span><br><span class="line">    &#125;</span><br><span class="line">    <span class="keyword">return</span> mDecor;</span><br><span class="line">&#125;</span><br></pre></td></tr></table></figure><p>When getDecorView is called for the first time, it enters the installDecor method, which performs a series of initializations on the DecorView. Among the more important methods are: generateLayout&#x2F;generateLayout, etc. generateLayout will retrieve relevant attributes from the current Activity’s Theme and set them to the Window, while also initializing a startingView and adding it to the DecorView—that’s what we call the startingWindow.</p><h3 id="Summary-1"><a href="#Summary-1" class="headerlink" title="Summary"></a>Summary</h3><ul><li>Decor has the meaning of decoration. DecorView’s official comment is “This is the top-level view of the window, containing the window decor.” We can understand that DecorView is the layout at the very bottom of our current Activity. So when we open DDMS to view the Tree Overview, we can discover that the rootmost View is the DecorView:<br><img src="/en/images/applunch2/1.webp" alt="DelayLoad"></li><li>When the application launches from the desktop, before the main Activity is displayed, if the theme doesn’t set the window background, then we’ll see white (this is also related to the phone’s ROM). If the app launch is very slow, then users have to watch the white screen for a while. If you want to avoid this, you can set WindowBackground in the Application or Activity’s Theme, so you can avoid the white screen (of course, now various manufacturers all have SplashActivity + ads, which I can also understand)</li></ul><h2 id="3-Post"><a href="#3-Post" class="headerlink" title="3. Post"></a>3. Post</h2><p>When we call DecorView’s Post method, it will ultimately call View’s Post method because DecorView ultimately inherits from View:</p><figure class="highlight java"><table><tr><td class="gutter"><pre><span class="line">1</span><br><span class="line">2</span><br><span class="line">3</span><br><span class="line">4</span><br><span class="line">5</span><br><span class="line">6</span><br><span class="line">7</span><br><span class="line">8</span><br><span class="line">9</span><br></pre></td><td class="code"><pre><span class="line"><span class="keyword">public</span> <span class="type">boolean</span> <span class="title function_">post</span><span class="params">(Runnable action)</span> &#123;</span><br><span class="line">    <span class="keyword">final</span> <span class="type">AttachInfo</span> <span class="variable">attachInfo</span> <span class="operator">=</span> mAttachInfo;</span><br><span class="line">    <span class="keyword">if</span> (attachInfo != <span class="literal">null</span>) &#123;</span><br><span class="line">        <span class="keyword">return</span> attachInfo.mHandler.post(action);</span><br><span class="line">    &#125;</span><br><span class="line">    <span class="comment">// Assume that post will succeed later</span></span><br><span class="line">    ViewRootImpl.getRunQueue().post(action);</span><br><span class="line">    <span class="keyword">return</span> <span class="literal">true</span>;</span><br><span class="line">&#125;</span><br></pre></td></tr></table></figure><p>Note the mAttachInfo here. When we call post in Activity’s onCreate, is mAttachInfo null at this time? The answer is that mAttachInfo is null at this time.</p><p>There’s a point here: what are Activity’s various callback functions for? Usually when we write apps ourselves, it seems like we handle everything in onCreate—is onResume? onStart? We don’t seem to involve them much, right? Actually, that’s not the case.</p><p>onCreate, as the name suggests, is Create. Earlier we saw that Activity’s onCreate function performed many initialization operations, including PhoneWindow&#x2F;DecorView&#x2F;StartingView&#x2F;setContentView, etc., but onCreate only initialized these objects. What actually needs to be set as visible is in Resume. However, this is transparent to developers. Specifically, you can look at ActivityThread’s handleResumeActivity function. Besides calling Activity’s onResume callback, handleResumeActivity also initializes several relatively important classes: ViewRootImpl&#x2F;ThreadedRenderer.</p><p>ActivityThread.handleResumeActivity:</p><figure class="highlight java"><table><tr><td class="gutter"><pre><span class="line">1</span><br><span class="line">2</span><br><span class="line">3</span><br><span class="line">4</span><br><span class="line">5</span><br><span class="line">6</span><br><span class="line">7</span><br><span class="line">8</span><br><span class="line">9</span><br><span class="line">10</span><br><span class="line">11</span><br><span class="line">12</span><br><span class="line">13</span><br><span class="line">14</span><br></pre></td><td class="code"><pre><span class="line"><span class="keyword">if</span> (r.window == <span class="literal">null</span> &amp;&amp; !a.mFinished &amp;&amp; willBeVisible) &#123;</span><br><span class="line">    r.window = r.activity.getWindow();</span><br><span class="line">    <span class="type">View</span> <span class="variable">decor</span> <span class="operator">=</span> r.window.getDecorView();</span><br><span class="line">    decor.setVisibility(View.INVISIBLE);</span><br><span class="line">    <span class="type">ViewManager</span> <span class="variable">wm</span> <span class="operator">=</span> a.getWindowManager();</span><br><span class="line">    WindowManager.<span class="type">LayoutParams</span> <span class="variable">l</span> <span class="operator">=</span> r.window.getAttributes();</span><br><span class="line">    a.mDecor = decor;</span><br><span class="line">    l.type = WindowManager.LayoutParams.TYPE_BASE_APPLICATION;</span><br><span class="line">    l.softInputMode |= forwardBit;</span><br><span class="line">    <span class="keyword">if</span> (a.mVisibleFromClient) &#123;</span><br><span class="line">        a.mWindowAdded = <span class="literal">true</span>;</span><br><span class="line">        wm.addView(decor, l);</span><br><span class="line">    &#125;</span><br><span class="line">&#125;</span><br></pre></td></tr></table></figure><p>It’s mainly wm.addView(decor, l); this sentence connects the decorView with WindowManagerImpl. This sentence will ultimately call to WindowManagerGlobal’s addView function:</p><figure class="highlight java"><table><tr><td class="gutter"><pre><span class="line">1</span><br><span class="line">2</span><br><span class="line">3</span><br><span class="line">4</span><br><span class="line">5</span><br><span class="line">6</span><br><span class="line">7</span><br><span class="line">8</span><br><span class="line">9</span><br><span class="line">10</span><br><span class="line">11</span><br><span class="line">12</span><br><span class="line">13</span><br><span class="line">14</span><br><span class="line">15</span><br><span class="line">16</span><br><span class="line">17</span><br><span class="line">18</span><br><span class="line">19</span><br><span class="line">20</span><br><span class="line">21</span><br></pre></td><td class="code"><pre><span class="line"><span class="keyword">public</span> <span class="keyword">void</span> <span class="title function_">addView</span><span class="params">(View view, ViewGroup.LayoutParams params,</span></span><br><span class="line"><span class="params">        Display display, Window parentWindow)</span> &#123;</span><br><span class="line">    ......</span><br><span class="line">    ViewRootImpl root;</span><br><span class="line">    <span class="type">View</span> <span class="variable">panelParentView</span> <span class="operator">=</span> <span class="literal">null</span>;</span><br><span class="line">    ......</span><br><span class="line">        root = <span class="keyword">new</span> <span class="title class_">ViewRootImpl</span>(view.getContext(), display);</span><br><span class="line">        view.setLayoutParams(wparams);</span><br><span class="line"></span><br><span class="line">        mViews.add(view);</span><br><span class="line">        mRoots.add(root);</span><br><span class="line">        mParams.add(wparams);</span><br><span class="line">    &#125;</span><br><span class="line"></span><br><span class="line">    <span class="comment">// do this last because it fires off messages to start doing things</span></span><br><span class="line">    <span class="keyword">try</span> &#123;</span><br><span class="line">        root.setView(view, wparams, panelParentView);</span><br><span class="line">    &#125; <span class="keyword">catch</span> (RuntimeException e) &#123;</span><br><span class="line">      ......</span><br><span class="line">    &#125;</span><br><span class="line">&#125;</span><br></pre></td></tr></table></figure><p>We know that ViewRootImpl is a core class in the View system, and its definition is as follows:</p><figure class="highlight java"><table><tr><td class="gutter"><pre><span class="line">1</span><br><span class="line">2</span><br></pre></td><td class="code"><pre><span class="line"><span class="keyword">public</span> <span class="keyword">final</span> <span class="keyword">class</span> <span class="title class_">ViewRootImpl</span> <span class="keyword">implements</span> <span class="title class_">ViewParent</span>,</span><br><span class="line">        View.AttachInfo.Callbacks, HardwareRenderer.HardwareDrawCallbacks</span><br></pre></td></tr></table></figure><p>When ViewRootImpl is initialized, it will also initialize AttachInfo—that’s why mAttachInfo was null when we were in onCreate earlier. ViewRootImpl has many methods that we’re also quite familiar with and very important, such as performTraversals&#x2F;performLayout&#x2F;performMeasure&#x2F;performDraw&#x2F;draw, etc.</p><p>Continuing with addView’s root.setView(view, wparams, panelParentView); the view passed in is decorView, and root is ViewRootImpl. This function sets ViewRootImpl’s mView variable to the passed-in view—that is, the decorView. So now the relationship between ViewRootImpl and DecorView is also clear.</p><p>Coming full circle, let’s return to the Post function in the main title. Earlier we said that this Post method calls View’s Post function because attachInfo was null when we were in onCreate, so it will go to the following branch: ViewRootImpl.getRunQueue().post(action);</p><p>Note that the getRunQueue obtained here is not the MessageQueue inside the Looper, but rather a RunQueue object maintained by ViewRootImpl, whose core is an ArrayList:</p><figure class="highlight java"><table><tr><td class="gutter"><pre><span class="line">1</span><br><span class="line">2</span><br><span class="line">3</span><br><span class="line">4</span><br><span class="line">5</span><br><span class="line">6</span><br><span class="line">7</span><br><span class="line">8</span><br><span class="line">9</span><br><span class="line">10</span><br><span class="line">11</span><br><span class="line">12</span><br><span class="line">13</span><br><span class="line">14</span><br><span class="line">15</span><br><span class="line">16</span><br><span class="line">17</span><br><span class="line">18</span><br><span class="line">19</span><br><span class="line">20</span><br><span class="line">21</span><br><span class="line">22</span><br><span class="line">23</span><br><span class="line">24</span><br><span class="line">25</span><br><span class="line">26</span><br><span class="line">27</span><br><span class="line">28</span><br><span class="line">29</span><br><span class="line">30</span><br></pre></td><td class="code"><pre><span class="line"><span class="keyword">private</span> <span class="keyword">final</span> ArrayList&lt;HandlerAction&gt; mActions = <span class="keyword">new</span> <span class="title class_">ArrayList</span>&lt;HandlerAction&gt;();</span><br><span class="line"></span><br><span class="line">        <span class="keyword">void</span> <span class="title function_">post</span><span class="params">(Runnable action)</span> &#123;</span><br><span class="line">            postDelayed(action, <span class="number">0</span>);</span><br><span class="line">        &#125;</span><br><span class="line"></span><br><span class="line">        <span class="keyword">void</span> <span class="title function_">postDelayed</span><span class="params">(Runnable action, <span class="type">long</span> delayMillis)</span> &#123;</span><br><span class="line">            <span class="type">HandlerAction</span> <span class="variable">handlerAction</span> <span class="operator">=</span> <span class="keyword">new</span> <span class="title class_">HandlerAction</span>();</span><br><span class="line">            handlerAction.action = action;</span><br><span class="line">            handlerAction.delay = delayMillis;</span><br><span class="line"></span><br><span class="line">            <span class="keyword">synchronized</span> (mActions) &#123;</span><br><span class="line">                mActions.add(handlerAction);</span><br><span class="line">            &#125;</span><br><span class="line">        &#125;</span><br><span class="line"></span><br><span class="line">        <span class="keyword">void</span> <span class="title function_">executeActions</span><span class="params">(Handler handler)</span> &#123;</span><br><span class="line">            <span class="keyword">synchronized</span> (mActions) &#123;</span><br><span class="line">                <span class="keyword">final</span> ArrayList&lt;HandlerAction&gt; actions = mActions;</span><br><span class="line">                <span class="keyword">final</span> <span class="type">int</span> <span class="variable">count</span> <span class="operator">=</span> actions.size();</span><br><span class="line"></span><br><span class="line">                <span class="keyword">for</span> (<span class="type">int</span> <span class="variable">i</span> <span class="operator">=</span> <span class="number">0</span>; i &lt; count; i++) &#123;</span><br><span class="line">                    <span class="keyword">final</span> <span class="type">HandlerAction</span> <span class="variable">handlerAction</span> <span class="operator">=</span> actions.get(i);</span><br><span class="line">                    handler.postDelayed(handlerAction.action, handlerAction.delay);</span><br><span class="line">                &#125;</span><br><span class="line"></span><br><span class="line">                actions.clear();</span><br><span class="line">            &#125;</span><br><span class="line">        &#125;</span><br><span class="line"></span><br></pre></td></tr></table></figure><p>When we execute Post, we’re essentially just wrapping the Runnable into a HandlerAction object and storing it in an ArrayList. When executeActions is executed, it takes the HandlerAction stored here and re-posts it through the executeActions method using the passed-in Handler object.</p><p>So when is the executeActions method executed? And which Handler is the passed-in Handler?</p><h2 id="4-PerformTraversals"><a href="#4-PerformTraversals" class="headerlink" title="4. PerformTraversals"></a>4. PerformTraversals</h2><p>We discussed earlier that ViewRootImpl’s performTraversals method is a very core method, executed once per frame drawing, calling various measure&#x2F;layout&#x2F;draw, etc., ultimately handing the data to be displayed to hwui for rendering.</p><p>The executeActions we discussed in the previous section is executed within performTraversals:</p><figure class="highlight java"><table><tr><td class="gutter"><pre><span class="line">1</span><br><span class="line">2</span><br></pre></td><td class="code"><pre><span class="line"><span class="comment">// Execute enqueued actions on every traversal in case a detached view enqueued an action</span></span><br><span class="line">getRunQueue().executeActions(mAttachInfo.mHandler);</span><br></pre></td></tr></table></figure><p>We can see that the Handler passed in here is mAttachInfo.mHandler. In the previous section, we mentioned that mAttachInfo is initialized together when ViewRootImpl is initialized:</p><figure class="highlight java"><table><tr><td class="gutter"><pre><span class="line">1</span><br></pre></td><td class="code"><pre><span class="line">mAttachInfo = <span class="keyword">new</span> <span class="title class_">View</span>.AttachInfo(mWindowSession, mWindow, display, <span class="built_in">this</span>, mHandler, <span class="built_in">this</span>);</span><br></pre></td></tr></table></figure><p>The mHandler here is a ViewRootHandler object:</p><figure class="highlight java"><table><tr><td class="gutter"><pre><span class="line">1</span><br><span class="line">2</span><br><span class="line">3</span><br><span class="line">4</span><br><span class="line">5</span><br></pre></td><td class="code"><pre><span class="line"><span class="keyword">final</span> <span class="keyword">class</span> <span class="title class_">ViewRootHandler</span> <span class="keyword">extends</span> <span class="title class_">Handler</span>&#123;</span><br><span class="line">    ......</span><br><span class="line">&#125;</span><br><span class="line">......</span><br><span class="line"><span class="keyword">final</span> <span class="type">ViewRootHandler</span> <span class="variable">mHandler</span> <span class="operator">=</span> <span class="keyword">new</span> <span class="title class_">ViewRootHandler</span>();</span><br></pre></td></tr></table></figure><p>We notice that ViewRootHandler doesn’t pass in a Looper object when created, which means that this ViewRootHandler’s Looper is the mainLooper.</p><p><em><strong>Now we’ve clarified this— the runnable object we posted in onCreate will ultimately still be added to the MainLooper’s MessageQueue when it’s executed during the first performTraversals.</strong></em></p><p>Going a full circle, we’ve finally explained the sentence at the very beginning of this article clearly. Of course, there are many irrelevant words in between, but I estimate very few people will have the patience to read through to here. So if you see this, you can increment an index in the comments below—here index &#x3D; 0; let’s see how many people actually seriously read this article.</p><h2 id="5-UpdateText"><a href="#5-UpdateText" class="headerlink" title="5. UpdateText"></a>5. UpdateText</h2><p>Continuing with performTraversals, we proceed to discuss. Speaking of which, in the <a href="https://www.androidperformance.com/2015/11/18/Android-app-lunch-optimize-delay-load/">first article</a>, we mentioned that when an app starts at launch, it will only do actual drawing on the second execution of performTraversals. The reason is that on the first execution of performTraversals, it will go to EGL initialization logic, then performTraversals will be executed again.</p><p>So someone asked in the comments section of the previous article: why do we need to post again in the run method? If we directly execute the updateText method in the run method, then updateText will be executed after the first performTraversals, not after the first frame drawing is completed, so we posted again. So the general processing steps are as follows:</p><blockquote><p>Step 1: Activity.onCreate –&gt; Activity.onStart –&gt; Activity.onResume</p></blockquote><blockquote><p>Step 2: ViewRootImpl.performTraversals –&gt; Runnable</p></blockquote><blockquote><p>Step 3: Runnable –&gt; ViewRootImpl.performTraversals</p></blockquote><blockquote><p>Step 4: ViewRootImpl.performTraversals –&gt; UpdateText</p></blockquote><blockquote><p>Step 5: UpdateText</p></blockquote><h2 id="6-Summary"><a href="#6-Summary" class="headerlink" title="6. Summary"></a>6. Summary</h2><p>Actually, following it all the way through, we discover that the principle is actually quite simple. DelayLoad is actually just a very small point. The key is to teach everyone how to track a knowledge point or optimization that you’re not familiar with. Here we mainly used two tools: Systrace and Method Trace, as well as source code compilation and debugging.</p><p>Regarding the use of Systrace and Method Trace, there will be detailed articles introducing them later. These two tools are very helpful for understanding source code and some technical implementations.</p><h3 id="Systrace"><a href="#Systrace" class="headerlink" title="Systrace"></a>Systrace</h3><p><img src="/en/images/applunch2/2.webp" alt="Systrace"></p><h3 id="Method-Trace"><a href="#Method-Trace" class="headerlink" title="Method Trace"></a>Method Trace</h3><p><img src="/en/images/applunch2/3.webp" alt="Method Trace"></p><h3 id="Source-Code-Compilation-and-Debugging"><a href="#Source-Code-Compilation-and-Debugging" class="headerlink" title="Source Code Compilation and Debugging"></a>Source Code Compilation and Debugging</h3><p><img src="/en/images/applunch2/4.webp" alt="Source Code Compilation and Debugging"></p><h3 id="Code"><a href="#Code" class="headerlink" title="Code"></a>Code</h3><p>The code involved in this article has been uploaded to GitHub:<br><a href="https://github.com/Gracker/DelayLoadSample">https://github.com/Gracker/DelayLoadSample</a></p><hr><h1 id="About-Me-amp-amp-Blog"><a href="#About-Me-amp-amp-Blog" class="headerlink" title="About Me &amp;&amp; Blog"></a>About Me &amp;&amp; Blog</h1><p>Below is a personal introduction and related links. I look forward to communicating with colleagues in the same field. When three walk together, there must be my teacher!</p><ol><li><a href="https://www.androidperformance.com/about/">Blogger Personal Introduction</a>: Inside are personal WeChat and WeChat group links.</li><li><a href="https://androidperformance.com/2019/12/01/BlogMap/">Blog Content Navigation</a>: A navigation of personal blog content.</li><li><a href="https://androidperformance.com/2018/05/07/Android-performance-optimization-skills-and-tools/">Personally Organized and Collected Excellent Blog Articles - Essential Skills and Tools for Android Performance Optimization</a>: Everyone is welcome to self-recommend and recommend (private WeChat chat is fine).</li><li><a href="https://www.androidperformance.com/2023/12/30/the-performance/">Android Performance Optimization Knowledge Planet</a>: Welcome to join, thank you for your support~</li></ol><hr><blockquote><p><strong>“If you want to go fast, go alone. If you want to go far, go together.”</strong></p></blockquote><p><img src="/en/images/WechatIMG581.webp" alt="Wechat QR"></p>]]></content>
    
    
    <summary type="html">&lt;p&gt;In the &lt;a href=&quot;https://www.androidperformance.com/2015/11/18/Android-app-lunch-optimize-delay-load/&quot;&gt;previous article&lt;/a&gt;, we used the third method to implement DelayLoad. However, the previous article was written relatively simply and only explained how to implement. This article will explain why we need to do this and the principles behind it.&lt;/p&gt;
&lt;p&gt;This will involve some relatively important classes in Android, as well as several relatively important functions in Activity lifecycle.&lt;/p&gt;
&lt;p&gt;Actually, the principles here are quite simple, but to clarify the implementation process, it’s still a quite interesting thing. It will involve using some tools, adding debug code ourselves, and proceeding step by step. Through this, our understanding of Activity launch will be one layer deeper. I hope that after reading this, everyone will also get some help from it.&lt;/p&gt;</summary>


    <category term="Android" scheme="https://androidperformance.com/en/categories/Android/"/>
    
    
    <category term="Android" scheme="https://androidperformance.com/en/tags/Android/"/>
    
    <category term="Startup" scheme="https://androidperformance.com/en/tags/Startup/"/>
    
    <category term="DelayLoad" scheme="https://androidperformance.com/en/tags/DelayLoad/"/>
    
    <category term="Java" scheme="https://androidperformance.com/en/tags/Java/"/>
    
  </entry>
  
  <entry>
    <title>Android App Startup Optimization - DelayLoad Implementation and Principles (Part 1)</title>
    <link href="https://androidperformance.com/en/2015/11/18/Android-app-lunch-optimize-delay-load/"/>
    <id>https://androidperformance.com/en/2015/11/18/Android-app-lunch-optimize-delay-load/</id>
    <published>2015-11-18T12:23:14.000Z</published>
    <updated>2026-05-10T23:29:51.060Z</updated>
    
    <content type="html"><![CDATA[<p>In Android development, startup speed is a critical metric, and optimization is a vital process. The core philosophy of startup optimization is “doing less” during launch. Typical practices include:</p><ol><li>Asynchronous Loading</li><li>Delayed Loading (DelayLoad)</li><li>Lazy Loading</li></ol><p>Most developers who have worked on startup optimization have likely used these. This article dives deep into a specific implementation of DelayLoad and the underlying principles. While the code itself is simple, the mechanics involve Looper, Handler, MessageQueue, VSYNC, and more. I’ll also share some edge cases and my own reflections.</p><span id="more"></span><p>The DelayLoad idea in this article is still valuable: do less during startup and move non-critical work until after the first frame. But today you should not rely on fixed delays or visual judgment alone. Compare before and after with Macrobenchmark <code>StartupTimingMetric</code> for cold, warm, and hot starts, use Perfetto&#x2F;System Trace to confirm delayed work no longer blocks the first frame and does not create new jank after the UI becomes interactive, and use Baseline Profiles&#x2F;Startup Profiles for code that truly belongs on the critical path. Delayed loading should also be coordinated with AndroidX App Startup, coroutines or thread pools, lifecycle boundaries, and business priority so startup work is not simply moved into post-first-screen jank.</p><h1 id="1-Implementation-of-Optimized-DelayLoad"><a href="#1-Implementation-of-Optimized-DelayLoad" class="headerlink" title="1. Implementation of Optimized DelayLoad"></a>1. Implementation of Optimized DelayLoad</h1><p>When people think of DelayLoad, they usually think of <code>Handler.postDelayed</code> in <code>onCreate</code>. While convenient, it has one fatal flaw: <strong>How long should the delay be?</strong></p><p>On high-end devices, apps launch incredibly fast, requiring only a short delay. On low-end devices, the launch takes much longer. Using a fixed delay leads to inconsistent user experiences across different hardware.</p><p>Here is the optimized solution:</p><ol><li>Create a <code>Handler</code> and a <code>Runnable</code> for UI updates.</li></ol><figure class="highlight java"><table><tr><td class="gutter"><pre><span class="line">1</span><br><span class="line">2</span><br><span class="line">3</span><br><span class="line">4</span><br><span class="line">5</span><br><span class="line">6</span><br><span class="line">7</span><br></pre></td><td class="code"><pre><span class="line"><span class="keyword">private</span> <span class="type">Handler</span> <span class="variable">myHandler</span> <span class="operator">=</span> <span class="keyword">new</span> <span class="title class_">Handler</span>();</span><br><span class="line"><span class="keyword">private</span> <span class="type">Runnable</span> <span class="variable">mLoadingRunnable</span> <span class="operator">=</span> <span class="keyword">new</span> <span class="title class_">Runnable</span>() &#123;</span><br><span class="line">    <span class="meta">@Override</span></span><br><span class="line">    <span class="keyword">public</span> <span class="keyword">void</span> <span class="title function_">run</span><span class="params">()</span> &#123;</span><br><span class="line">        updateText(); <span class="comment">// UI Update logic</span></span><br><span class="line">    &#125;</span><br><span class="line">&#125;;</span><br></pre></td></tr></table></figure><ol start="2"><li>Add the following code to your main Activity’s <code>onCreate</code>:</li></ol><figure class="highlight java"><table><tr><td class="gutter"><pre><span class="line">1</span><br><span class="line">2</span><br><span class="line">3</span><br><span class="line">4</span><br><span class="line">5</span><br><span class="line">6</span><br></pre></td><td class="code"><pre><span class="line">getWindow().getDecorView().post(<span class="keyword">new</span> <span class="title class_">Runnable</span>() &#123;</span><br><span class="line">    <span class="meta">@Override</span></span><br><span class="line">    <span class="keyword">public</span> <span class="keyword">void</span> <span class="title function_">run</span><span class="params">()</span> &#123;</span><br><span class="line">        myHandler.post(mLoadingRunnable);</span><br><span class="line">    &#125;</span><br><span class="line">&#125;);</span><br></pre></td></tr></table></figure><p>The implementation is surprisingly simple. Let’s compare it with other common approaches.</p><h1 id="2-Comparison-of-Three-Approaches"><a href="#2-Comparison-of-Three-Approaches" class="headerlink" title="2. Comparison of Three Approaches"></a>2. Comparison of Three Approaches</h1><p>To verify the effectiveness of this optimized DelayLoad, we created a test app with three images of different sizes. Below each image is a <code>TextView</code> to display its dimensions.</p><figure class="highlight java"><table><tr><td class="gutter"><pre><span class="line">1</span><br><span class="line">2</span><br><span class="line">3</span><br><span class="line">4</span><br><span class="line">5</span><br><span class="line">6</span><br><span class="line">7</span><br><span class="line">8</span><br><span class="line">9</span><br><span class="line">10</span><br><span class="line">11</span><br><span class="line">12</span><br><span class="line">13</span><br><span class="line">14</span><br><span class="line">15</span><br><span class="line">16</span><br><span class="line">17</span><br><span class="line">18</span><br><span class="line">19</span><br><span class="line">20</span><br><span class="line">21</span><br><span class="line">22</span><br><span class="line">23</span><br><span class="line">24</span><br><span class="line">25</span><br><span class="line">26</span><br><span class="line">27</span><br><span class="line">28</span><br><span class="line">29</span><br><span class="line">30</span><br><span class="line">31</span><br><span class="line">32</span><br><span class="line">33</span><br><span class="line">34</span><br></pre></td><td class="code"><pre><span class="line"><span class="keyword">public</span> <span class="keyword">class</span> <span class="title class_">MainActivity</span> <span class="keyword">extends</span> <span class="title class_">AppCompatActivity</span> &#123;</span><br><span class="line">    <span class="comment">// ... view definitions ...</span></span><br><span class="line">    <span class="keyword">private</span> <span class="type">Handler</span> <span class="variable">myHandler</span> <span class="operator">=</span> <span class="keyword">new</span> <span class="title class_">Handler</span>();</span><br><span class="line">    <span class="keyword">private</span> <span class="type">Runnable</span> <span class="variable">mLoadingRunnable</span> <span class="operator">=</span> <span class="keyword">new</span> <span class="title class_">Runnable</span>() &#123;</span><br><span class="line">        <span class="meta">@Override</span></span><br><span class="line">        <span class="keyword">public</span> <span class="keyword">void</span> <span class="title function_">run</span><span class="params">()</span> &#123; updateText(); &#125;</span><br><span class="line">    &#125;;</span><br><span class="line"></span><br><span class="line">    <span class="meta">@Override</span></span><br><span class="line">    <span class="keyword">protected</span> <span class="keyword">void</span> <span class="title function_">onCreate</span><span class="params">(Bundle savedInstanceState)</span> &#123;</span><br><span class="line">        <span class="built_in">super</span>.onCreate(savedInstanceState);</span><br><span class="line">        setContentView(R.layout.activity_main);</span><br><span class="line">        <span class="comment">// ... findViewByID ...</span></span><br><span class="line"></span><br><span class="line">        <span class="comment">// Approach 1: Immediate Post</span></span><br><span class="line">        myHandler.post(mLoadingRunnable);</span><br><span class="line"></span><br><span class="line">        <span class="comment">// Approach 2: PostDelayed (300ms)</span></span><br><span class="line">        <span class="comment">// myHandler.postDelayed(mLoadingRunnable, 300);</span></span><br><span class="line"></span><br><span class="line">        <span class="comment">// Approach 3: Optimized DelayLoad</span></span><br><span class="line">        <span class="comment">// getWindow().getDecorView().post(new Runnable() &#123;</span></span><br><span class="line">        <span class="comment">//     @Override</span></span><br><span class="line">        <span class="comment">//     public void run() &#123; myHandler.post(mLoadingRunnable); &#125;</span></span><br><span class="line">        <span class="comment">// &#125;);</span></span><br><span class="line">    &#125;</span><br><span class="line"></span><br><span class="line">    <span class="keyword">private</span> <span class="keyword">void</span> <span class="title function_">updateText</span><span class="params">()</span> &#123;</span><br><span class="line">        TraceCompat.beginSection(<span class="string">&quot;updateText&quot;</span>);</span><br><span class="line">        textView1.setText(<span class="string">&quot;image1 : w=&quot;</span> + imageView1.getWidth() + <span class="string">&quot; h =&quot;</span> + imageView1.getHeight());</span><br><span class="line">        <span class="comment">// ... (repeated for other views)</span></span><br><span class="line">        TraceCompat.endSection();</span><br><span class="line">    &#125;</span><br><span class="line">&#125;</span><br></pre></td></tr></table></figure><p>We focus on:</p><ol><li>When is <code>updateText</code> executed?</li><li>Are the dimensions correctly displayed?</li><li>Is there a “DelayLoad” effect (executing after initial frame rendering)?</li></ol><h2 id="2-1-Approach-1-Immediate-Post"><a href="#2-1-Approach-1-Immediate-Post" class="headerlink" title="2.1 Approach 1: Immediate Post"></a>2.1 Approach 1: Immediate Post</h2><p><strong>When is it executed?</strong><br><img src="/en/images/app-lunch/1.webp" alt="Trace of Approach 1"><br><code>updateText</code> runs immediately after the <code>onCreate/onStart/onResume</code> lifecycle callbacks.</p><p><strong>Are dimensions correct?</strong><br><img src="/en/images/app-lunch/2.webp" alt="Results of Approach 1"><br>No, the width and height are 0. This is because lifecycle callbacks don’t perform Measure or Layout; those happen later in <code>performTraversals</code>.</p><p><strong>Is there a DelayLoad effect?</strong><br>No. The app’s first frame is only shown after two <code>performTraversals</code> cycles. Since <code>updateText</code> runs before the first cycle, its execution time is “penalized” against the startup time.</p><h2 id="2-2-Approach-2-PostDelayed-300ms"><a href="#2-2-Approach-2-PostDelayed-300ms" class="headerlink" title="2.2 Approach 2: PostDelayed (300ms)"></a>2.2 Approach 2: PostDelayed (300ms)</h2><p><strong>When is it executed?</strong><br><img src="/en/images/app-lunch/3.webp" alt="Trace of Approach 2"><br><code>updateText</code> runs after the first frame is displayed. A subsequent <code>performTraversals</code> then updates the TextViews.</p><p><strong>Are dimensions correct?</strong><br><img src="/en/images/app-lunch/4.webp" alt="Results of Approach 2"><br>Yes. Since it runs after <code>performTraversals</code>, geometry data is available.</p><p><strong>Is there a DelayLoad effect?</strong><br>Yes, but it’s hit-or-miss. If the delay is 300ms, the text updates 170ms after the first frame. If the task were a heavy UI component, the user would see a jarring “blank-to-content” pop-in. If you reduce the delay to 50ms to prevent the pop-in, it might run <em>before</em> the first frame on slower devices, defeating the purpose.</p><h2 id="2-3-Approach-3-Optimized-DelayLoad"><a href="#2-3-Approach-3-Optimized-DelayLoad" class="headerlink" title="2.3 Approach 3: Optimized DelayLoad"></a>2.3 Approach 3: Optimized DelayLoad</h2><p>We want <code>updateText</code> to run precisely after the app’s first frame is visible to the user—no sooner, no later.</p><p><strong>When is it executed?</strong><br><img src="/en/images/app-lunch/6.webp" alt="Trace of Approach 3"><br><code>updateText</code> runs immediately after the second <code>performTraversals</code> finishes. The TextView updates with the very next VSYNC signal.</p><p><strong>Are dimensions correct?</strong><br>Yes, perfectly.</p><p><strong>Is there a DelayLoad effect?</strong><br>Yes. It ensures data is loaded as soon as possible <em>after</em> the UI is visible, without guessing a delay time.</p><h1 id="3-Reflections"><a href="#3-Reflections" class="headerlink" title="3. Reflections"></a>3. Reflections</h1><p>The code for this optimization is incredibly simple, but its effectiveness is profound. To understand <em>why</em> this works, we need to dig into lower-level components like Looper, Handler, VSYNC, and <code>ViewRootImpl</code>. I’ll explore these principles in the next part of this series.</p><h1 id="4-Code"><a href="#4-Code" class="headerlink" title="4. Code"></a>4. Code</h1><p>The sample code is available on GitHub: <a href="https://github.com/Gracker/DelayLoadSample">https://github.com/Gracker/DelayLoadSample</a></p><h1 id="About-Me-amp-amp-Blog"><a href="#About-Me-amp-amp-Blog" class="headerlink" title="About Me &amp;&amp; Blog"></a>About Me &amp;&amp; Blog</h1><p>(Links and introduction)</p>]]></content>
    
    
    <summary type="html">&lt;p&gt;In Android development, startup speed is a critical metric, and optimization is a vital process. The core philosophy of startup optimization is “doing less” during launch. Typical practices include:&lt;/p&gt;
&lt;ol&gt;
&lt;li&gt;Asynchronous Loading&lt;/li&gt;
&lt;li&gt;Delayed Loading (DelayLoad)&lt;/li&gt;
&lt;li&gt;Lazy Loading&lt;/li&gt;
&lt;/ol&gt;
&lt;p&gt;Most developers who have worked on startup optimization have likely used these. This article dives deep into a specific implementation of DelayLoad and the underlying principles. While the code itself is simple, the mechanics involve Looper, Handler, MessageQueue, VSYNC, and more. I’ll also share some edge cases and my own reflections.&lt;/p&gt;</summary>


    <category term="Android" scheme="https://androidperformance.com/en/categories/Android/"/>
    
    
    <category term="Android" scheme="https://androidperformance.com/en/tags/Android/"/>
    
    <category term="Startup" scheme="https://androidperformance.com/en/tags/Startup/"/>
    
    <category term="RenderThread" scheme="https://androidperformance.com/en/tags/RenderThread/"/>
    
    <category term="DelayLoad" scheme="https://androidperformance.com/en/tags/DelayLoad/"/>
    
    <category term="Java" scheme="https://androidperformance.com/en/tags/Java/"/>
    
  </entry>
  
  <entry>
    <title>RenderThread Workflow in Android hwui</title>
    <link href="https://androidperformance.com/en/2015/08/12/AndroidL-hwui-RenderThread-workflow/"/>
    <id>https://androidperformance.com/en/2015/08/12/AndroidL-hwui-RenderThread-workflow/</id>
    <published>2015-08-12T14:38:01.000Z</published>
    <updated>2026-05-10T23:29:51.060Z</updated>
    
    <content type="html"><![CDATA[<h2 id="Preface"><a href="#Preface" class="headerlink" title="Preface"></a>Preface</h2><p>This article serves as a set of learning notes documenting the basic workflow of <code>RenderThread</code> in hwui as introduced in Android 5.0. Since these are notes, some details might not be exhaustive. Instead, I aim to walk through the general flow and highlight the key stages of its operation for future reference when debugging.</p><p>The image below shows a Systrace capture of the first <code>Draw</code> operation by the <code>RenderThread</code> during an application startup. We can trace the <code>RenderThread</code> workflow by observing the sequence of events in this trace. If you are familiar with the application startup process, you know that the entire interface is only displayed on the phone after the first <code>drawFrame</code> is completed. Before this, the user sees the application’s <code>StartingWindow</code>.</p><span id="more"></span><p><img src="/en/images/hwui/renderthread/1.webp" alt="RenderThread Draw first frame"></p><h2 id="Starting-from-the-Java-Layer"><a href="#Starting-from-the-Java-Layer" class="headerlink" title="Starting from the Java Layer"></a>Starting from the Java Layer</h2><p>Every frame of an application begins its calculation and rendering upon receiving a VSYNC signal. This process originates from the <code>Choreographer</code> class. However, for the sake of brevity, let’s look directly at the call chain involved in rendering a single frame:</p><p><img src="/en/images/hwui/renderthread/2.webp" alt="Rendering Call Chain"></p><p>The <code>drawFrame</code> method in <code>Choreographer</code> calls the <code>performTraversals</code> method in <code>ViewRootImpl</code>, which eventually leads to <code>performDraw()</code>. This then calls <code>draw(boolean fullRedrawNeeded)</code>, a private method in <code>ViewRootImpl</code> (distinct from the standard <code>draw</code> method we usually override).</p><figure class="highlight java"><table><tr><td class="gutter"><pre><span class="line">1</span><br><span class="line">2</span><br><span class="line">3</span><br><span class="line">4</span><br><span class="line">5</span><br><span class="line">6</span><br><span class="line">7</span><br><span class="line">8</span><br><span class="line">9</span><br><span class="line">10</span><br><span class="line">11</span><br><span class="line">12</span><br><span class="line">13</span><br><span class="line">14</span><br><span class="line">15</span><br></pre></td><td class="code"><pre><span class="line"><span class="keyword">if</span> (mAttachInfo.mHardwareRenderer != <span class="literal">null</span> &amp;&amp; mAttachInfo.mHardwareRenderer.isEnabled()) &#123;</span><br><span class="line">    mIsAnimating = <span class="literal">false</span>;</span><br><span class="line">    <span class="type">boolean</span> <span class="variable">invalidateRoot</span> <span class="operator">=</span> <span class="literal">false</span>;</span><br><span class="line">    <span class="keyword">if</span> (mHardwareYOffset != yOffset || mHardwareXOffset != xOffset) &#123;</span><br><span class="line">        mHardwareYOffset = yOffset;</span><br><span class="line">        mHardwareXOffset = xOffset;</span><br><span class="line">        mAttachInfo.mHardwareRenderer.invalidateRoot();</span><br><span class="line">    &#125;</span><br><span class="line">    mResizeAlpha = resizeAlpha;</span><br><span class="line"></span><br><span class="line">    dirty.setEmpty();</span><br><span class="line"></span><br><span class="line">    mBlockResizeBuffer = <span class="literal">false</span>;</span><br><span class="line">    mAttachInfo.mHardwareRenderer.draw(mView, mAttachInfo, <span class="built_in">this</span>);</span><br><span class="line">&#125;</span><br></pre></td></tr></table></figure><p>If the hardware rendering path is taken, <code>mHardwareRenderer.draw</code> is called. Here, <code>mHardwareRenderer</code> refers to <code>ThreadedRenderer</code>, whose <code>draw</code> function is as follows:</p><figure class="highlight java"><table><tr><td class="gutter"><pre><span class="line">1</span><br><span class="line">2</span><br><span class="line">3</span><br><span class="line">4</span><br><span class="line">5</span><br><span class="line">6</span><br><span class="line">7</span><br><span class="line">8</span><br><span class="line">9</span><br><span class="line">10</span><br><span class="line">11</span><br><span class="line">12</span><br><span class="line">13</span><br><span class="line">14</span><br><span class="line">15</span><br><span class="line">16</span><br><span class="line">17</span><br><span class="line">18</span><br><span class="line">19</span><br><span class="line">20</span><br><span class="line">21</span><br><span class="line">22</span><br><span class="line">23</span><br><span class="line">24</span><br><span class="line">25</span><br><span class="line">26</span><br><span class="line">27</span><br><span class="line">28</span><br><span class="line">29</span><br><span class="line">30</span><br><span class="line">31</span><br><span class="line">32</span><br><span class="line">33</span><br><span class="line">34</span><br><span class="line">35</span><br><span class="line">36</span><br><span class="line">37</span><br><span class="line">38</span><br><span class="line">39</span><br></pre></td><td class="code"><pre><span class="line"><span class="meta">@Override</span></span><br><span class="line"><span class="keyword">void</span> <span class="title function_">draw</span><span class="params">(View view, AttachInfo attachInfo, HardwareDrawCallbacks callbacks)</span> &#123;</span><br><span class="line">    attachInfo.mIgnoreDirtyState = <span class="literal">true</span>;</span><br><span class="line">    <span class="type">long</span> <span class="variable">frameTimeNanos</span> <span class="operator">=</span> mChoreographer.getFrameTimeNanos();</span><br><span class="line">    attachInfo.mDrawingTime = frameTimeNanos / TimeUtils.NANOS_PER_MS;</span><br><span class="line"></span><br><span class="line">    <span class="type">long</span> <span class="variable">recordDuration</span> <span class="operator">=</span> <span class="number">0</span>;</span><br><span class="line">    <span class="keyword">if</span> (mProfilingEnabled) &#123;</span><br><span class="line">        recordDuration = System.nanoTime();</span><br><span class="line">    &#125;</span><br><span class="line"></span><br><span class="line">    updateRootDisplayList(view, callbacks);</span><br><span class="line"></span><br><span class="line">    <span class="keyword">if</span> (mProfilingEnabled) &#123;</span><br><span class="line">        recordDuration = System.nanoTime() - recordDuration;</span><br><span class="line">    &#125;</span><br><span class="line"></span><br><span class="line">    attachInfo.mIgnoreDirtyState = <span class="literal">false</span>;</span><br><span class="line"></span><br><span class="line">    <span class="comment">// register animating rendernodes which started animating prior to renderer</span></span><br><span class="line">    <span class="comment">// creation, which is typical for animators started prior to first draw</span></span><br><span class="line">    <span class="keyword">if</span> (attachInfo.mPendingAnimatingRenderNodes != <span class="literal">null</span>) &#123;</span><br><span class="line">        <span class="keyword">final</span> <span class="type">int</span> <span class="variable">count</span> <span class="operator">=</span> attachInfo.mPendingAnimatingRenderNodes.size();</span><br><span class="line">        <span class="keyword">for</span> (<span class="type">int</span> <span class="variable">i</span> <span class="operator">=</span> <span class="number">0</span>; i &lt; count; i++) &#123;</span><br><span class="line">            registerAnimatingRenderNode(</span><br><span class="line">                    attachInfo.mPendingAnimatingRenderNodes.get(i));</span><br><span class="line">        &#125;</span><br><span class="line">        attachInfo.mPendingAnimatingRenderNodes.clear();</span><br><span class="line">        <span class="comment">// We don&#x27;t need this anymore as subsequent calls to</span></span><br><span class="line">        <span class="comment">// ViewRootImpl#attachRenderNodeAnimator will go directly to us.</span></span><br><span class="line">        attachInfo.mPendingAnimatingRenderNodes = <span class="literal">null</span>;</span><br><span class="line">    &#125;</span><br><span class="line"></span><br><span class="line">    <span class="type">int</span> <span class="variable">syncResult</span> <span class="operator">=</span> nSyncAndDrawFrame(mNativeProxy, frameTimeNanos,</span><br><span class="line">            recordDuration, view.getResources().getDisplayMetrics().density);</span><br><span class="line">    <span class="keyword">if</span> ((syncResult &amp; SYNC_INVALIDATE_REQUIRED) != <span class="number">0</span>) &#123;</span><br><span class="line">        attachInfo.mViewRootImpl.invalidate();</span><br><span class="line">    &#125;</span><br><span class="line">&#125;</span><br></pre></td></tr></table></figure><p>In this function, <code>updateRootDisplayList(view, callbacks)</code> performs the <code>getDisplayList</code> operation. This is followed by a crucial step:</p><figure class="highlight java"><table><tr><td class="gutter"><pre><span class="line">1</span><br><span class="line">2</span><br></pre></td><td class="code"><pre><span class="line"><span class="type">int</span> <span class="variable">syncResult</span> <span class="operator">=</span> nSyncAndDrawFrame(mNativeProxy, frameTimeNanos,</span><br><span class="line">        recordDuration, view.getResources().getDisplayMetrics().density);</span><br></pre></td></tr></table></figure><p>As we can see, this is a blocking operation. The Java layer waits for the Native layer to complete and return a result before proceeding.</p><h2 id="The-Native-Layer"><a href="#The-Native-Layer" class="headerlink" title="The Native Layer"></a>The Native Layer</h2><p>The Native code is located in <code>android_view_ThreadedRenderer.cpp</code>. The implementation is as follows:</p><figure class="highlight cpp"><table><tr><td class="gutter"><pre><span class="line">1</span><br><span class="line">2</span><br><span class="line">3</span><br><span class="line">4</span><br><span class="line">5</span><br></pre></td><td class="code"><pre><span class="line"><span class="function"><span class="type">static</span> <span class="type">int</span> <span class="title">android_view_ThreadedRenderer_syncAndDrawFrame</span><span class="params">(JNIEnv* env, jobject clazz,</span></span></span><br><span class="line"><span class="params"><span class="function">        jlong proxyPtr, jlong frameTimeNanos, jlong recordDuration, jfloat density)</span> </span>&#123;</span><br><span class="line">    RenderProxy* proxy = <span class="built_in">reinterpret_cast</span>&lt;RenderProxy*&gt;(proxyPtr);</span><br><span class="line">    <span class="keyword">return</span> proxy-&gt;<span class="built_in">syncAndDrawFrame</span>(frameTimeNanos, recordDuration, density);</span><br><span class="line">&#125;</span><br></pre></td></tr></table></figure><p>The <code>RenderProxy</code> implementation can be found in <code>frameworks/base/libs/hwui/renderthread/RenderProxy.cpp</code>:</p><figure class="highlight cpp"><table><tr><td class="gutter"><pre><span class="line">1</span><br><span class="line">2</span><br><span class="line">3</span><br><span class="line">4</span><br><span class="line">5</span><br></pre></td><td class="code"><pre><span class="line"><span class="function"><span class="type">int</span> <span class="title">RenderProxy::syncAndDrawFrame</span><span class="params">(<span class="type">nsecs_t</span> frameTimeNanos, <span class="type">nsecs_t</span> recordDurationNanos,</span></span></span><br><span class="line"><span class="params"><span class="function">        <span class="type">float</span> density)</span> </span>&#123;</span><br><span class="line">    mDrawFrameTask.<span class="built_in">setDensity</span>(density);</span><br><span class="line">    <span class="keyword">return</span> mDrawFrameTask.<span class="built_in">drawFrame</span>(frameTimeNanos, recordDurationNanos);</span><br><span class="line">&#125;</span><br></pre></td></tr></table></figure><p>Here, <code>mDrawFrameTask</code> is a <code>DrawFrameTask</code> object, located in <code>frameworks/base/libs/hwui/renderthread/DrawFrameTask.cpp</code>. Its <code>drawFrame</code> code is:</p><figure class="highlight cpp"><table><tr><td class="gutter"><pre><span class="line">1</span><br><span class="line">2</span><br><span class="line">3</span><br><span class="line">4</span><br><span class="line">5</span><br><span class="line">6</span><br><span class="line">7</span><br><span class="line">8</span><br><span class="line">9</span><br><span class="line">10</span><br><span class="line">11</span><br><span class="line">12</span><br></pre></td><td class="code"><pre><span class="line"><span class="function"><span class="type">int</span> <span class="title">DrawFrameTask::drawFrame</span><span class="params">(<span class="type">nsecs_t</span> frameTimeNanos, <span class="type">nsecs_t</span> recordDurationNanos)</span> </span>&#123;</span><br><span class="line">    mSyncResult = kSync_OK;</span><br><span class="line">    mFrameTimeNanos = frameTimeNanos;</span><br><span class="line">    mRecordDurationNanos = recordDurationNanos;</span><br><span class="line">    <span class="built_in">postAndWait</span>();</span><br><span class="line"></span><br><span class="line">    <span class="comment">// Reset the single-frame data</span></span><br><span class="line">    mFrameTimeNanos = <span class="number">0</span>;</span><br><span class="line">    mRecordDurationNanos = <span class="number">0</span>;</span><br><span class="line"></span><br><span class="line">    <span class="keyword">return</span> mSyncResult;</span><br><span class="line">&#125;</span><br></pre></td></tr></table></figure><p>The implementation of <code>postAndWait()</code> is:</p><figure class="highlight cpp"><table><tr><td class="gutter"><pre><span class="line">1</span><br><span class="line">2</span><br><span class="line">3</span><br><span class="line">4</span><br><span class="line">5</span><br></pre></td><td class="code"><pre><span class="line"><span class="function"><span class="type">void</span> <span class="title">DrawFrameTask::postAndWait</span><span class="params">()</span> </span>&#123;</span><br><span class="line">    AutoMutex _lock(mLock);</span><br><span class="line">    mRenderThread-&gt;<span class="built_in">queue</span>(<span class="keyword">this</span>);</span><br><span class="line">    mSignal.<span class="built_in">wait</span>(mLock);</span><br><span class="line">&#125;</span><br></pre></td></tr></table></figure><p>This places the <code>DrawFrameTask</code> into the <code>mRenderThread</code>. The <code>queue</code> method in <code>RenderThread</code> is implemented as:</p><figure class="highlight cpp"><table><tr><td class="gutter"><pre><span class="line">1</span><br><span class="line">2</span><br><span class="line">3</span><br><span class="line">4</span><br><span class="line">5</span><br><span class="line">6</span><br><span class="line">7</span><br><span class="line">8</span><br></pre></td><td class="code"><pre><span class="line"><span class="function"><span class="type">void</span> <span class="title">RenderThread::queue</span><span class="params">(RenderTask* task)</span> </span>&#123;</span><br><span class="line">    AutoMutex _lock(mLock);</span><br><span class="line">    mQueue.<span class="built_in">queue</span>(task);</span><br><span class="line">    <span class="keyword">if</span> (mNextWakeup &amp;&amp; task-&gt;mRunAt &lt; mNextWakeup) &#123;</span><br><span class="line">        mNextWakeup = <span class="number">0</span>;</span><br><span class="line">        mLooper-&gt;<span class="built_in">wake</span>();</span><br><span class="line">    &#125;</span><br><span class="line">&#125;</span><br></pre></td></tr></table></figure><p><code>mQueue</code> is a <code>TaskQueue</code> object, and its <code>queue</code> method is:</p><figure class="highlight cpp"><table><tr><td class="gutter"><pre><span class="line">1</span><br><span class="line">2</span><br><span class="line">3</span><br><span class="line">4</span><br><span class="line">5</span><br><span class="line">6</span><br><span class="line">7</span><br><span class="line">8</span><br><span class="line">9</span><br><span class="line">10</span><br><span class="line">11</span><br><span class="line">12</span><br><span class="line">13</span><br><span class="line">14</span><br><span class="line">15</span><br><span class="line">16</span><br><span class="line">17</span><br><span class="line">18</span><br><span class="line">19</span><br><span class="line">20</span><br><span class="line">21</span><br><span class="line">22</span><br><span class="line">23</span><br><span class="line">24</span><br><span class="line">25</span><br><span class="line">26</span><br><span class="line">27</span><br><span class="line">28</span><br><span class="line">29</span><br><span class="line">30</span><br><span class="line">31</span><br><span class="line">32</span><br><span class="line">33</span><br></pre></td><td class="code"><pre><span class="line"><span class="function"><span class="type">void</span> <span class="title">TaskQueue::queue</span><span class="params">(RenderTask* task)</span> </span>&#123;</span><br><span class="line">    <span class="comment">// Since the RenderTask itself forms the linked list it is not allowed</span></span><br><span class="line">    <span class="comment">// to have the same task queued twice</span></span><br><span class="line">    <span class="built_in">LOG_ALWAYS_FATAL_IF</span>(task-&gt;mNext || mTail == task, <span class="string">&quot;Task is already in the queue!&quot;</span>);</span><br><span class="line">    <span class="keyword">if</span> (mTail) &#123;</span><br><span class="line">        <span class="comment">// Fast path if we can just append</span></span><br><span class="line">        <span class="keyword">if</span> (mTail-&gt;mRunAt &lt;= task-&gt;mRunAt) &#123;</span><br><span class="line">            mTail-&gt;mNext = task;</span><br><span class="line">            mTail = task;</span><br><span class="line">        &#125; <span class="keyword">else</span> &#123;</span><br><span class="line">            <span class="comment">// Need to find the proper insertion point</span></span><br><span class="line">            RenderTask* previous = <span class="number">0</span>;</span><br><span class="line">            RenderTask* next = mHead;</span><br><span class="line">            <span class="keyword">while</span> (next &amp;&amp; next-&gt;mRunAt &lt;= task-&gt;mRunAt) &#123;</span><br><span class="line">                previous = next;</span><br><span class="line">                next = next-&gt;mNext;</span><br><span class="line">            &#125;</span><br><span class="line">            <span class="keyword">if</span> (!previous) &#123;</span><br><span class="line">                task-&gt;mNext = mHead;</span><br><span class="line">                mHead = task;</span><br><span class="line">            &#125; <span class="keyword">else</span> &#123;</span><br><span class="line">                previous-&gt;mNext = task;</span><br><span class="line">                <span class="keyword">if</span> (next) &#123;</span><br><span class="line">                    task-&gt;mNext = next;</span><br><span class="line">                &#125; <span class="keyword">else</span> &#123;</span><br><span class="line">                    mTail = task;</span><br><span class="line">                &#125;</span><br><span class="line">            &#125;</span><br><span class="line">        &#125;</span><br><span class="line">    &#125; <span class="keyword">else</span> &#123;</span><br><span class="line">        mTail = mHead = task;</span><br><span class="line">    &#125;</span><br><span class="line">&#125;</span><br></pre></td></tr></table></figure><p>Going back to the <code>queue</code> method in <code>RenderThread</code>, the <code>wake()</code> function is called:</p><figure class="highlight cpp"><table><tr><td class="gutter"><pre><span class="line">1</span><br><span class="line">2</span><br><span class="line">3</span><br><span class="line">4</span><br><span class="line">5</span><br><span class="line">6</span><br><span class="line">7</span><br><span class="line">8</span><br><span class="line">9</span><br><span class="line">10</span><br><span class="line">11</span><br><span class="line">12</span><br></pre></td><td class="code"><pre><span class="line"><span class="function"><span class="type">void</span> <span class="title">Looper::wake</span><span class="params">()</span> </span>&#123;</span><br><span class="line">    <span class="type">ssize_t</span> nWrite;</span><br><span class="line">    <span class="keyword">do</span> &#123;</span><br><span class="line">        nWrite = <span class="built_in">write</span>(mWakeWritePipeFd, <span class="string">&quot;W&quot;</span>, <span class="number">1</span>);</span><br><span class="line">    &#125; <span class="keyword">while</span> (nWrite == <span class="number">-1</span> &amp;&amp; errno == EINTR);</span><br><span class="line"></span><br><span class="line">    <span class="keyword">if</span> (nWrite != <span class="number">1</span>) &#123;</span><br><span class="line">        <span class="keyword">if</span> (errno != EAGAIN) &#123;</span><br><span class="line">            <span class="built_in">ALOGW</span>(<span class="string">&quot;Could not write wake signal, errno=%d&quot;</span>, errno);</span><br><span class="line">        &#125;</span><br><span class="line">    &#125;</span><br><span class="line">&#125;</span><br></pre></td></tr></table></figure><p>The <code>wake</code> function is straightforward: it simply writes a single character “W” to the write end of a pipe. This wakes up the read end of the pipe, which was waiting for data.</p><h2 id="HWUI-RenderThread"><a href="#HWUI-RenderThread" class="headerlink" title="HWUI RenderThread"></a>HWUI RenderThread</h2><p>Where do we go next? First, let’s get familiar with <code>RenderThread</code>. It inherits from <code>Thread</code> (defined in <code>utils/Thread.h</code>). Here is the <code>RenderThread</code> constructor:</p><figure class="highlight cpp"><table><tr><td class="gutter"><pre><span class="line">1</span><br><span class="line">2</span><br><span class="line">3</span><br><span class="line">4</span><br><span class="line">5</span><br><span class="line">6</span><br><span class="line">7</span><br><span class="line">8</span><br><span class="line">9</span><br><span class="line">10</span><br><span class="line">11</span><br><span class="line">12</span><br></pre></td><td class="code"><pre><span class="line">RenderThread::<span class="built_in">RenderThread</span>() : <span class="built_in">Thread</span>(<span class="literal">true</span>), <span class="built_in">Singleton</span>&lt;RenderThread&gt;()</span><br><span class="line">        , <span class="built_in">mNextWakeup</span>(LLONG_MAX)</span><br><span class="line">        , <span class="built_in">mDisplayEventReceiver</span>(<span class="number">0</span>)</span><br><span class="line">        , <span class="built_in">mVsyncRequested</span>(<span class="literal">false</span>)</span><br><span class="line">        , <span class="built_in">mFrameCallbackTaskPending</span>(<span class="literal">false</span>)</span><br><span class="line">        , <span class="built_in">mFrameCallbackTask</span>(<span class="number">0</span>)</span><br><span class="line">        , <span class="built_in">mRenderState</span>(<span class="literal">NULL</span>)</span><br><span class="line">        , <span class="built_in">mEglManager</span>(<span class="literal">NULL</span>) &#123;</span><br><span class="line">    mFrameCallbackTask = <span class="keyword">new</span> <span class="built_in">DispatchFrameCallbacks</span>(<span class="keyword">this</span>);</span><br><span class="line">    mLooper = <span class="keyword">new</span> <span class="built_in">Looper</span>(<span class="literal">false</span>);</span><br><span class="line">    <span class="built_in">run</span>(<span class="string">&quot;RenderThread&quot;</span>);</span><br><span class="line">&#125;</span><br></pre></td></tr></table></figure><p>The <code>run</code> method is documented in <code>Thread</code>:</p><figure class="highlight cpp"><table><tr><td class="gutter"><pre><span class="line">1</span><br><span class="line">2</span><br><span class="line">3</span><br><span class="line">4</span><br></pre></td><td class="code"><pre><span class="line"><span class="comment">// Start the thread in threadLoop() which needs to be implemented.</span></span><br><span class="line"><span class="function"><span class="keyword">virtual</span> <span class="type">status_t</span>    <span class="title">run</span><span class="params">(    <span class="type">const</span> <span class="type">char</span>* name = <span class="number">0</span>,</span></span></span><br><span class="line"><span class="params"><span class="function">                            <span class="type">int32_t</span> priority = PRIORITY_DEFAULT,</span></span></span><br><span class="line"><span class="params"><span class="function">                            <span class="type">size_t</span> stack = <span class="number">0</span>)</span></span>;</span><br></pre></td></tr></table></figure><p>This triggers the <code>threadLoop</code> function, which is critical:</p><figure class="highlight cpp"><table><tr><td class="gutter"><pre><span class="line">1</span><br><span class="line">2</span><br><span class="line">3</span><br><span class="line">4</span><br><span class="line">5</span><br><span class="line">6</span><br><span class="line">7</span><br><span class="line">8</span><br><span class="line">9</span><br><span class="line">10</span><br><span class="line">11</span><br><span class="line">12</span><br><span class="line">13</span><br><span class="line">14</span><br><span class="line">15</span><br><span class="line">16</span><br><span class="line">17</span><br><span class="line">18</span><br><span class="line">19</span><br><span class="line">20</span><br><span class="line">21</span><br><span class="line">22</span><br><span class="line">23</span><br><span class="line">24</span><br><span class="line">25</span><br><span class="line">26</span><br><span class="line">27</span><br><span class="line">28</span><br><span class="line">29</span><br><span class="line">30</span><br><span class="line">31</span><br><span class="line">32</span><br><span class="line">33</span><br><span class="line">34</span><br><span class="line">35</span><br><span class="line">36</span><br><span class="line">37</span><br><span class="line">38</span><br><span class="line">39</span><br></pre></td><td class="code"><pre><span class="line"><span class="function"><span class="type">bool</span> <span class="title">RenderThread::threadLoop</span><span class="params">()</span> </span>&#123;</span><br><span class="line"><span class="meta">#<span class="keyword">if</span> defined(HAVE_PTHREADS)</span></span><br><span class="line">    <span class="built_in">setpriority</span>(PRIO_PROCESS, <span class="number">0</span>, PRIORITY_DISPLAY);</span><br><span class="line"><span class="meta">#<span class="keyword">endif</span></span></span><br><span class="line">    <span class="built_in">initThreadLocals</span>();</span><br><span class="line"></span><br><span class="line">    <span class="type">int</span> timeoutMillis = <span class="number">-1</span>;</span><br><span class="line">    <span class="keyword">for</span> (;;) &#123;</span><br><span class="line">        <span class="type">int</span> result = mLooper-&gt;<span class="built_in">pollOnce</span>(timeoutMillis);</span><br><span class="line">        <span class="built_in">LOG_ALWAYS_FATAL_IF</span>(result == Looper::POLL_ERROR,</span><br><span class="line">                <span class="string">&quot;RenderThread Looper POLL_ERROR!&quot;</span>);</span><br><span class="line"></span><br><span class="line">        <span class="type">nsecs_t</span> nextWakeup;</span><br><span class="line">        <span class="comment">// Process our queue, if we have anything</span></span><br><span class="line">        <span class="keyword">while</span> (RenderTask* task = <span class="built_in">nextTask</span>(&amp;nextWakeup)) &#123;</span><br><span class="line">            task-&gt;<span class="built_in">run</span>();</span><br><span class="line">            <span class="comment">// task may have deleted itself, do not reference it again</span></span><br><span class="line">        &#125;</span><br><span class="line">        <span class="keyword">if</span> (nextWakeup == LLONG_MAX) &#123;</span><br><span class="line">            timeoutMillis = <span class="number">-1</span>;</span><br><span class="line">        &#125; <span class="keyword">else</span> &#123;</span><br><span class="line">            <span class="type">nsecs_t</span> timeoutNanos = nextWakeup - <span class="built_in">systemTime</span>(SYSTEM_TIME_MONOTONIC);</span><br><span class="line">            timeoutMillis = <span class="built_in">nanoseconds_to_milliseconds</span>(timeoutNanos);</span><br><span class="line">            <span class="keyword">if</span> (timeoutMillis &lt; <span class="number">0</span>) &#123;</span><br><span class="line">                timeoutMillis = <span class="number">0</span>;</span><br><span class="line">            &#125;</span><br><span class="line">        &#125;</span><br><span class="line"></span><br><span class="line">        <span class="keyword">if</span> (mPendingRegistrationFrameCallbacks.<span class="built_in">size</span>() &amp;&amp; !mFrameCallbackTaskPending) &#123;</span><br><span class="line">            <span class="built_in">drainDisplayEventQueue</span>(<span class="literal">true</span>);</span><br><span class="line">            mFrameCallbacks.<span class="built_in">insert</span>(</span><br><span class="line">                    mPendingRegistrationFrameCallbacks.<span class="built_in">begin</span>(), mPendingRegistrationFrameCallbacks.<span class="built_in">end</span>());</span><br><span class="line">            mPendingRegistrationFrameCallbacks.<span class="built_in">clear</span>();</span><br><span class="line">            <span class="built_in">requestVsync</span>();</span><br><span class="line">        &#125;</span><br><span class="line">    &#125;</span><br><span class="line"></span><br><span class="line">    <span class="keyword">return</span> <span class="literal">false</span>;</span><br><span class="line">&#125;</span><br></pre></td></tr></table></figure><p>The <code>for</code> loop is an infinite loop. The <code>pollOnce</code> function blocks until <code>mLooper-&gt;wake()</code> is called. Once awakened, it proceeds to the <code>while</code> loop:</p><figure class="highlight cpp"><table><tr><td class="gutter"><pre><span class="line">1</span><br><span class="line">2</span><br><span class="line">3</span><br><span class="line">4</span><br></pre></td><td class="code"><pre><span class="line"><span class="keyword">while</span> (RenderTask* task = <span class="built_in">nextTask</span>(&amp;nextWakeup)) &#123;</span><br><span class="line">    task-&gt;<span class="built_in">run</span>();</span><br><span class="line">    <span class="comment">// task may have deleted itself, do not reference it again</span></span><br><span class="line">&#125;</span><br></pre></td></tr></table></figure><p>It retrieves the <code>RenderTask</code> from the queue and executes its <code>run</code> method. Based on our earlier tracing, we know this <code>RenderTask</code> is a <code>DrawFrameTask</code>. Its <code>run</code> method is as follows:</p><figure class="highlight cpp"><table><tr><td class="gutter"><pre><span class="line">1</span><br><span class="line">2</span><br><span class="line">3</span><br><span class="line">4</span><br><span class="line">5</span><br><span class="line">6</span><br><span class="line">7</span><br><span class="line">8</span><br><span class="line">9</span><br><span class="line">10</span><br><span class="line">11</span><br><span class="line">12</span><br><span class="line">13</span><br><span class="line">14</span><br><span class="line">15</span><br><span class="line">16</span><br><span class="line">17</span><br><span class="line">18</span><br><span class="line">19</span><br><span class="line">20</span><br><span class="line">21</span><br><span class="line">22</span><br><span class="line">23</span><br><span class="line">24</span><br><span class="line">25</span><br><span class="line">26</span><br><span class="line">27</span><br><span class="line">28</span><br><span class="line">29</span><br><span class="line">30</span><br></pre></td><td class="code"><pre><span class="line"><span class="function"><span class="type">void</span> <span class="title">DrawFrameTask::run</span><span class="params">()</span> </span>&#123;</span><br><span class="line">    <span class="built_in">ATRACE_NAME</span>(<span class="string">&quot;DrawFrame&quot;</span>);</span><br><span class="line"></span><br><span class="line">    mContext-&gt;<span class="built_in">profiler</span>().<span class="built_in">setDensity</span>(mDensity);</span><br><span class="line">    mContext-&gt;<span class="built_in">profiler</span>().<span class="built_in">startFrame</span>(mRecordDurationNanos);</span><br><span class="line"></span><br><span class="line">    <span class="type">bool</span> canUnblockUiThread;</span><br><span class="line">    <span class="type">bool</span> canDrawThisFrame;</span><br><span class="line">    &#123;</span><br><span class="line">        <span class="function">TreeInfo <span class="title">info</span><span class="params">(TreeInfo::MODE_FULL, mRenderThread-&gt;renderState())</span></span>;</span><br><span class="line">        canUnblockUiThread = <span class="built_in">syncFrameState</span>(info);</span><br><span class="line">        canDrawThisFrame = info.out.canDrawThisFrame;</span><br><span class="line">    &#125;</span><br><span class="line"></span><br><span class="line">    <span class="comment">// Grab a copy of everything we need</span></span><br><span class="line">    CanvasContext* context = mContext;</span><br><span class="line"></span><br><span class="line">    <span class="comment">// From this point on anything in &quot;this&quot; is *UNSAFE TO ACCESS*</span></span><br><span class="line">    <span class="keyword">if</span> (canUnblockUiThread) &#123;</span><br><span class="line">        <span class="built_in">unblockUiThread</span>();</span><br><span class="line">    &#125;</span><br><span class="line"></span><br><span class="line">    <span class="keyword">if</span> (<span class="built_in">CC_LIKELY</span>(canDrawThisFrame)) &#123;</span><br><span class="line">        context-&gt;<span class="built_in">draw</span>();</span><br><span class="line">    &#125;</span><br><span class="line"></span><br><span class="line">    <span class="keyword">if</span> (!canUnblockUiThread) &#123;</span><br><span class="line">        <span class="built_in">unblockUiThread</span>();</span><br><span class="line">    &#125;</span><br><span class="line">&#125;</span><br></pre></td></tr></table></figure><h2 id="RenderThread-DrawFrame"><a href="#RenderThread-DrawFrame" class="headerlink" title="RenderThread.DrawFrame"></a>RenderThread.DrawFrame</h2><p>The <code>run</code> method of <code>DrawFrameTask</code> coordinates the stages shown in the initial trace diagram. Let’s break down the <code>DrawFrame</code> process step by step, combining the code with the trace visualization.</p><h3 id="1-syncFrameState"><a href="#1-syncFrameState" class="headerlink" title="1. syncFrameState"></a>1. syncFrameState</h3><p>The first major function is <code>syncFrameState</code>. As its name implies, it synchronizes architectural frame information, moving data maintained by the Java layer into the <code>RenderThread</code>.</p><blockquote><p>Both the Main Thread and the Render Thread maintain their own set of application window view information. This separation allows them to operate without interfering with each other, maximizing parallelism. The Render Thread’s view information is synchronized from the Main Thread. Therefore, whenever the Main Thread’s view information changes, it must be synced to the Render Thread.</p></blockquote><p>In the code, you’ll find two <code>RenderNode</code> types: one in hwui and one in <code>View</code>. Synchronization essentially involves copying data from the Java-side <code>RenderNode</code> to the hwui <code>RenderNode</code>. Note that the return value of <code>syncFrameState</code> is assigned to <code>canUnblockUiThread</code>. This boolean determines whether to wake the Main Thread early. If <code>true</code>, the Main Thread can resume work on other tasks immediately, rather than waiting for the entire <code>draw</code> operation to finish in the <code>RenderThread</code>. This is one of the most significant differences between Android 5.0 and Android 4.x.</p><p><img src="/en/images/hwui/renderthread/3.webp" alt="syncFrameState"></p><figure class="highlight cpp"><table><tr><td class="gutter"><pre><span class="line">1</span><br><span class="line">2</span><br><span class="line">3</span><br><span class="line">4</span><br><span class="line">5</span><br><span class="line">6</span><br><span class="line">7</span><br><span class="line">8</span><br><span class="line">9</span><br><span class="line">10</span><br><span class="line">11</span><br><span class="line">12</span><br><span class="line">13</span><br><span class="line">14</span><br><span class="line">15</span><br><span class="line">16</span><br><span class="line">17</span><br><span class="line">18</span><br><span class="line">19</span><br></pre></td><td class="code"><pre><span class="line"><span class="function"><span class="type">bool</span> <span class="title">DrawFrameTask::syncFrameState</span><span class="params">(TreeInfo&amp; info)</span> </span>&#123;</span><br><span class="line">    mRenderThread-&gt;<span class="built_in">timeLord</span>().<span class="built_in">vsyncReceived</span>(mFrameTimeNanos);</span><br><span class="line">    mContext-&gt;<span class="built_in">makeCurrent</span>();</span><br><span class="line">    Caches::<span class="built_in">getInstance</span>().textureCache.<span class="built_in">resetMarkInUse</span>();</span><br><span class="line"></span><br><span class="line">    <span class="keyword">for</span> (<span class="type">size_t</span> i = <span class="number">0</span>; i &lt; mLayers.<span class="built_in">size</span>(); i++) &#123;</span><br><span class="line">        mContext-&gt;<span class="built_in">processLayerUpdate</span>(mLayers[i].<span class="built_in">get</span>());</span><br><span class="line">    &#125;</span><br><span class="line">    mLayers.<span class="built_in">clear</span>();</span><br><span class="line">    mContext-&gt;<span class="built_in">prepareTree</span>(info);</span><br><span class="line"></span><br><span class="line">    <span class="keyword">if</span> (info.out.hasAnimations) &#123;</span><br><span class="line">        <span class="keyword">if</span> (info.out.requiresUiRedraw) &#123;</span><br><span class="line">            mSyncResult |= kSync_UIRedrawRequired;</span><br><span class="line">        &#125;</span><br><span class="line">    &#125;</span><br><span class="line">    <span class="comment">// If prepareTextures is false, we ran out of texture cache space</span></span><br><span class="line">    <span class="keyword">return</span> info.prepareTextures;</span><br><span class="line">&#125;</span><br></pre></td></tr></table></figure><p>First is <code>makeCurrent</code>. Here, <code>mContext</code> is a <code>CanvasContext</code> object:</p><figure class="highlight cpp"><table><tr><td class="gutter"><pre><span class="line">1</span><br><span class="line">2</span><br><span class="line">3</span><br><span class="line">4</span><br></pre></td><td class="code"><pre><span class="line"><span class="function"><span class="type">void</span> <span class="title">CanvasContext::makeCurrent</span><span class="params">()</span> </span>&#123;</span><br><span class="line">    <span class="comment">// In the meantime this matches the behavior of GLRenderer, so it is not a regression</span></span><br><span class="line">    mHaveNewSurface |= mEglManager.<span class="built_in">makeCurrent</span>(mEglSurface);</span><br><span class="line">&#125;</span><br></pre></td></tr></table></figure><p><code>mEglManager</code> is an <code>EglManager</code> object:</p><figure class="highlight cpp"><table><tr><td class="gutter"><pre><span class="line">1</span><br><span class="line">2</span><br><span class="line">3</span><br><span class="line">4</span><br><span class="line">5</span><br><span class="line">6</span><br><span class="line">7</span><br><span class="line">8</span><br><span class="line">9</span><br><span class="line">10</span><br><span class="line">11</span><br><span class="line">12</span><br><span class="line">13</span><br><span class="line">14</span><br><span class="line">15</span><br><span class="line">16</span><br><span class="line">17</span><br><span class="line">18</span><br><span class="line">19</span><br></pre></td><td class="code"><pre><span class="line"><span class="function"><span class="type">bool</span> <span class="title">EglManager::makeCurrent</span><span class="params">(EGLSurface surface)</span> </span>&#123;</span><br><span class="line">    <span class="keyword">if</span> (<span class="built_in">isCurrent</span>(surface)) <span class="keyword">return</span> <span class="literal">false</span>;</span><br><span class="line"></span><br><span class="line">    <span class="keyword">if</span> (surface == EGL_NO_SURFACE) &#123;</span><br><span class="line">        <span class="comment">// If we are setting EGL_NO_SURFACE we don&#x27;t care about any of the potential</span></span><br><span class="line">        <span class="comment">// return errors, which would only happen if mEglDisplay had already been</span></span><br><span class="line">        <span class="comment">// destroyed in which case the current context is already NO_CONTEXT</span></span><br><span class="line">        <span class="built_in">TIME_LOG</span>(<span class="string">&quot;eglMakeCurrent&quot;</span>, <span class="built_in">eglMakeCurrent</span>(mEglDisplay, EGL_NO_SURFACE, EGL_NO_SURFACE, EGL_NO_CONTEXT));</span><br><span class="line">    &#125; <span class="keyword">else</span> &#123;</span><br><span class="line">        EGLBoolean success;</span><br><span class="line">        <span class="built_in">TIME_LOG</span>(<span class="string">&quot;eglMakeCurrent&quot;</span>, success = <span class="built_in">eglMakeCurrent</span>(mEglDisplay, surface, surface, mEglContext));</span><br><span class="line">        <span class="keyword">if</span> (!success) &#123;</span><br><span class="line">            <span class="built_in">LOG_ALWAYS_FATAL</span>(<span class="string">&quot;Failed to make current on surface %p, error=%s&quot;</span>,</span><br><span class="line">                (<span class="type">void</span>*)surface, <span class="built_in">egl_error_str</span>());</span><br><span class="line">        &#125;</span><br><span class="line">    &#125;</span><br><span class="line">    mCurrentSurface = surface;</span><br><span class="line">    <span class="keyword">return</span> <span class="literal">true</span>;</span><br><span class="line">&#125;</span><br></pre></td></tr></table></figure><p>This logic checks if <code>mCurrentSurface == surface</code>. If they match, no re-initialization is needed. If it’s a different surface, <code>eglMakeCurrent</code> is called to recreate the context.</p><p>After <code>makeCurrent</code>, <code>mContext-&gt;prepareTree(info)</code> is called:</p><figure class="highlight cpp"><table><tr><td class="gutter"><pre><span class="line">1</span><br><span class="line">2</span><br><span class="line">3</span><br><span class="line">4</span><br><span class="line">5</span><br><span class="line">6</span><br><span class="line">7</span><br><span class="line">8</span><br><span class="line">9</span><br><span class="line">10</span><br><span class="line">11</span><br><span class="line">12</span><br><span class="line">13</span><br><span class="line">14</span><br><span class="line">15</span><br><span class="line">16</span><br><span class="line">17</span><br><span class="line">18</span><br><span class="line">19</span><br><span class="line">20</span><br><span class="line">21</span><br><span class="line">22</span><br><span class="line">23</span><br><span class="line">24</span><br><span class="line">25</span><br><span class="line">26</span><br><span class="line">27</span><br><span class="line">28</span><br><span class="line">29</span><br><span class="line">30</span><br><span class="line">31</span><br><span class="line">32</span><br></pre></td><td class="code"><pre><span class="line"><span class="function"><span class="type">void</span> <span class="title">CanvasContext::prepareTree</span><span class="params">(TreeInfo&amp; info)</span> </span>&#123;</span><br><span class="line">    mRenderThread.<span class="built_in">removeFrameCallback</span>(<span class="keyword">this</span>);</span><br><span class="line"></span><br><span class="line">    info.damageAccumulator = &amp;mDamageAccumulator;</span><br><span class="line">    info.renderer = mCanvas;</span><br><span class="line">    <span class="keyword">if</span> (mPrefetechedLayers.<span class="built_in">size</span>() &amp;&amp; info.mode == TreeInfo::MODE_FULL) &#123;</span><br><span class="line">        info.canvasContext = <span class="keyword">this</span>;</span><br><span class="line">    &#125;</span><br><span class="line">    mAnimationContext-&gt;<span class="built_in">startFrame</span>(info.mode);</span><br><span class="line">    mRootRenderNode-&gt;<span class="built_in">prepareTree</span>(info);</span><br><span class="line">    mAnimationContext-&gt;<span class="built_in">runRemainingAnimations</span>(info);</span><br><span class="line"></span><br><span class="line">    <span class="keyword">if</span> (info.canvasContext) &#123;</span><br><span class="line">        <span class="built_in">freePrefetechedLayers</span>();</span><br><span class="line">    &#125;</span><br><span class="line"></span><br><span class="line">    <span class="type">int</span> runningBehind = <span class="number">0</span>;</span><br><span class="line">    <span class="comment">// <span class="doctag">TODO:</span> This query is moderately expensive, investigate adding some sort</span></span><br><span class="line">    <span class="comment">// of fast-path based off when we last called eglSwapBuffers() as well as</span></span><br><span class="line">    <span class="comment">// last vsync time. Or something.</span></span><br><span class="line">    <span class="built_in">TIME_LOG</span>(<span class="string">&quot;nativeWindowQuery&quot;</span>, mNativeWindow-&gt;<span class="built_in">query</span>(mNativeWindow.<span class="built_in">get</span>(),</span><br><span class="line">            NATIVE_WINDOW_CONSUMER_RUNNING_BEHIND, &amp;runningBehind));</span><br><span class="line">    info.out.canDrawThisFrame = !runningBehind;</span><br><span class="line"></span><br><span class="line">    <span class="keyword">if</span> (info.out.hasAnimations || !info.out.canDrawThisFrame) &#123;</span><br><span class="line">        <span class="keyword">if</span> (!info.out.requiresUiRedraw) &#123;</span><br><span class="line">            <span class="comment">// If animationsNeedsRedraw is set don&#x27;t bother posting for an RT anim</span></span><br><span class="line">            <span class="comment">// as we will just end up fighting the UI thread.</span></span><br><span class="line">            mRenderThread.<span class="built_in">postFrameCallback</span>(<span class="keyword">this</span>);</span><br><span class="line">        &#125;</span><br><span class="line">    &#125;</span><br><span class="line">&#125;</span><br></pre></td></tr></table></figure><p>Within this, <code>mRootRenderNode-&gt;prepareTree(info)</code> is the most important part. Back at the Java layer, the <code>ThreadedRenderer</code> initializes a pointer:</p><figure class="highlight java"><table><tr><td class="gutter"><pre><span class="line">1</span><br></pre></td><td class="code"><pre><span class="line"><span class="type">long</span> <span class="variable">rootNodePtr</span> <span class="operator">=</span> nCreateRootRenderNode();</span><br></pre></td></tr></table></figure><p>This <code>RootRenderNode</code> is the root node of the view tree:</p><figure class="highlight java"><table><tr><td class="gutter"><pre><span class="line">1</span><br></pre></td><td class="code"><pre><span class="line">mRootNode = RenderNode.adopt(rootNodePtr);</span><br></pre></td></tr></table></figure><p>Then a <code>mNativeProxy</code> pointer is created, initializing a <code>RenderProxy</code> object in the Native layer and passing <code>rootNodePtr</code> to it. <code>CanvasContext</code> is also initialized inside <code>RenderProxy</code>, receiving the same <code>rootNodePtr</code>.</p><p>We mentioned that the <code>draw</code> method in <code>ThreadedRenderer</code> first calls <code>updateRootDisplayList</code> (our familiar <code>getDisplayList</code>). This involves two steps: <code>updateViewTreeDisplayList</code> and then adding the root node to the <code>DrawOp</code>:</p><figure class="highlight java"><table><tr><td class="gutter"><pre><span class="line">1</span><br><span class="line">2</span><br><span class="line">3</span><br></pre></td><td class="code"><pre><span class="line">canvas.insertReorderBarrier();</span><br><span class="line">canvas.drawRenderNode(view.getDisplayList());</span><br><span class="line">canvas.insertInorderBarrier();</span><br></pre></td></tr></table></figure><p>The final implementation is:</p><figure class="highlight cpp"><table><tr><td class="gutter"><pre><span class="line">1</span><br><span class="line">2</span><br><span class="line">3</span><br><span class="line">4</span><br><span class="line">5</span><br><span class="line">6</span><br><span class="line">7</span><br><span class="line">8</span><br><span class="line">9</span><br><span class="line">10</span><br></pre></td><td class="code"><pre><span class="line"><span class="function"><span class="type">status_t</span> <span class="title">DisplayListRenderer::drawRenderNode</span><span class="params">(RenderNode* renderNode, Rect&amp; dirty, <span class="type">int32_t</span> flags)</span> </span>&#123;</span><br><span class="line">    <span class="built_in">LOG_ALWAYS_FATAL_IF</span>(!renderNode, <span class="string">&quot;missing rendernode&quot;</span>);</span><br><span class="line"></span><br><span class="line">    <span class="comment">// dirty is an out parameter and should not be recorded,</span></span><br><span class="line">    <span class="comment">// it matters only when replaying the display list</span></span><br><span class="line">    DrawRenderNodeOp* op = <span class="built_in">new</span> (<span class="built_in">alloc</span>()) <span class="built_in">DrawRenderNodeOp</span>(renderNode, flags, *<span class="built_in">currentTransform</span>());</span><br><span class="line">    <span class="built_in">addRenderNodeOp</span>(op);</span><br><span class="line"></span><br><span class="line">    <span class="keyword">return</span> DrawGlInfo::kStatusDone;</span><br><span class="line">&#125;</span><br></pre></td></tr></table></figure><p>Returning to <code>CanvasContext::prepareTree</code>, the <code>mRootRenderNode</code> is the one passed during initialization. Its implementation is in <code>RenderNode.cpp</code>:</p><figure class="highlight cpp"><table><tr><td class="gutter"><pre><span class="line">1</span><br><span class="line">2</span><br><span class="line">3</span><br><span class="line">4</span><br><span class="line">5</span><br><span class="line">6</span><br><span class="line">7</span><br><span class="line">8</span><br><span class="line">9</span><br><span class="line">10</span><br><span class="line">11</span><br><span class="line">12</span><br><span class="line">13</span><br><span class="line">14</span><br><span class="line">15</span><br><span class="line">16</span><br><span class="line">17</span><br><span class="line">18</span><br><span class="line">19</span><br><span class="line">20</span><br><span class="line">21</span><br><span class="line">22</span><br><span class="line">23</span><br><span class="line">24</span><br><span class="line">25</span><br><span class="line">26</span><br></pre></td><td class="code"><pre><span class="line"><span class="function"><span class="type">void</span> <span class="title">RenderNode::prepareTree</span><span class="params">(TreeInfo&amp; info)</span> </span>&#123;</span><br><span class="line">    <span class="built_in">prepareTreeImpl</span>(info);</span><br><span class="line">&#125;</span><br><span class="line"></span><br><span class="line"><span class="function"><span class="type">void</span> <span class="title">RenderNode::prepareTreeImpl</span><span class="params">(TreeInfo&amp; info)</span> </span>&#123;</span><br><span class="line">    <span class="built_in">TT_START_MARK</span>(<span class="built_in">getName</span>());</span><br><span class="line">    info.damageAccumulator-&gt;<span class="built_in">pushTransform</span>(<span class="keyword">this</span>);</span><br><span class="line"></span><br><span class="line">    <span class="keyword">if</span> (info.mode == TreeInfo::MODE_FULL) &#123;</span><br><span class="line">        <span class="built_in">pushStagingPropertiesChanges</span>(info); <span class="comment">// Sync properties of the current Render Node</span></span><br><span class="line">    &#125;</span><br><span class="line">    <span class="type">uint32_t</span> animatorDirtyMask = <span class="number">0</span>;</span><br><span class="line">    <span class="keyword">if</span> (<span class="built_in">CC_LIKELY</span>(info.runAnimations)) &#123;</span><br><span class="line">        animatorDirtyMask = mAnimatorManager.<span class="built_in">animate</span>(info); <span class="comment">// Perform animation-related operations</span></span><br><span class="line">    &#125;</span><br><span class="line">    <span class="built_in">prepareLayer</span>(info, animatorDirtyMask);</span><br><span class="line">    <span class="keyword">if</span> (info.mode == TreeInfo::MODE_FULL) &#123;</span><br><span class="line">        <span class="built_in">pushStagingDisplayListChanges</span>(info);  <span class="comment">// Sync Display List of the current Render Node</span></span><br><span class="line">    &#125;</span><br><span class="line">    <span class="comment">// Sync Bitmaps referenced by the Display List, and the Display Lists of child Render Nodes</span></span><br><span class="line">    <span class="built_in">prepareSubTree</span>(info, mDisplayListData);</span><br><span class="line">    <span class="built_in">pushLayerUpdate</span>(info); <span class="comment">// Check if the current Render Node has a Layer set. If so, process it.</span></span><br><span class="line"></span><br><span class="line">    info.damageAccumulator-&gt;<span class="built_in">popTransform</span>();</span><br><span class="line">    <span class="built_in">TT_END_MARK</span>();</span><br><span class="line">&#125;</span><br></pre></td></tr></table></figure><p>Further details on these operations can be explored in the source code.</p><h3 id="2-draw"><a href="#2-draw" class="headerlink" title="2. draw"></a>2. draw</h3><p><img src="/en/images/hwui/renderthread/4.webp" alt="Draw"></p><p>After <code>syncFrameState</code> comes the <code>draw</code> operation:</p><figure class="highlight cpp"><table><tr><td class="gutter"><pre><span class="line">1</span><br><span class="line">2</span><br><span class="line">3</span><br></pre></td><td class="code"><pre><span class="line"><span class="keyword">if</span> (<span class="built_in">CC_LIKELY</span>(canDrawThisFrame)) &#123;</span><br><span class="line">    context-&gt;<span class="built_in">draw</span>();</span><br><span class="line">&#125;</span><br></pre></td></tr></table></figure><p>The <code>draw</code> function in <code>CanvasContext</code> is a core method located in <code>frameworks/base/libs/hwui/renderthread/CanvasContext.cpp</code> (Wait, the original text says <code>OpenGLRenderer.cpp</code>, but in 5.0 it’s often in <code>CanvasContext.cpp</code> for ThreadedRenderer). Let’s follow the provided snippet:</p><figure class="highlight cpp"><table><tr><td class="gutter"><pre><span class="line">1</span><br><span class="line">2</span><br><span class="line">3</span><br><span class="line">4</span><br><span class="line">5</span><br><span class="line">6</span><br><span class="line">7</span><br><span class="line">8</span><br><span class="line">9</span><br><span class="line">10</span><br><span class="line">11</span><br><span class="line">12</span><br><span class="line">13</span><br><span class="line">14</span><br><span class="line">15</span><br><span class="line">16</span><br><span class="line">17</span><br><span class="line">18</span><br><span class="line">19</span><br><span class="line">20</span><br><span class="line">21</span><br><span class="line">22</span><br><span class="line">23</span><br><span class="line">24</span><br><span class="line">25</span><br><span class="line">26</span><br><span class="line">27</span><br><span class="line">28</span><br><span class="line">29</span><br><span class="line">30</span><br><span class="line">31</span><br><span class="line">32</span><br><span class="line">33</span><br><span class="line">34</span><br><span class="line">35</span><br><span class="line">36</span><br><span class="line">37</span><br><span class="line">38</span><br></pre></td><td class="code"><pre><span class="line"><span class="function"><span class="type">void</span> <span class="title">CanvasContext::draw</span><span class="params">()</span> </span>&#123;</span><br><span class="line">    <span class="built_in">profiler</span>().<span class="built_in">markPlaybackStart</span>();</span><br><span class="line"></span><br><span class="line">    SkRect dirty;</span><br><span class="line">    mDamageAccumulator.<span class="built_in">finish</span>(&amp;dirty);</span><br><span class="line"></span><br><span class="line">    <span class="comment">// ......</span></span><br><span class="line"></span><br><span class="line">    <span class="type">status_t</span> status;</span><br><span class="line">    <span class="keyword">if</span> (!dirty.<span class="built_in">isEmpty</span>()) &#123;</span><br><span class="line">        status = mCanvas-&gt;<span class="built_in">prepareDirty</span>(dirty.fLeft, dirty.fTop,</span><br><span class="line">                dirty.fRight, dirty.fBottom, mOpaque);</span><br><span class="line">    &#125; <span class="keyword">else</span> &#123;</span><br><span class="line">        status = mCanvas-&gt;<span class="built_in">prepare</span>(mOpaque);</span><br><span class="line">    &#125;</span><br><span class="line"></span><br><span class="line">    Rect outBounds;</span><br><span class="line">    status |= mCanvas-&gt;<span class="built_in">drawRenderNode</span>(mRootRenderNode.<span class="built_in">get</span>(), outBounds);</span><br><span class="line"></span><br><span class="line">    <span class="built_in">profiler</span>().<span class="built_in">draw</span>(mCanvas);</span><br><span class="line"></span><br><span class="line">    mCanvas-&gt;<span class="built_in">finish</span>();</span><br><span class="line"></span><br><span class="line">    <span class="built_in">profiler</span>().<span class="built_in">markPlaybackEnd</span>();</span><br><span class="line"></span><br><span class="line">    <span class="keyword">if</span> (status &amp; DrawGlInfo::kStatusDrew) &#123;</span><br><span class="line">        <span class="built_in">swapBuffers</span>();</span><br><span class="line">    &#125;</span><br><span class="line"></span><br><span class="line">    <span class="built_in">profiler</span>().<span class="built_in">finishFrame</span>();</span><br><span class="line"></span><br><span class="line">    <span class="comment">// M: enable to get overdraw count</span></span><br><span class="line">    <span class="keyword">if</span> (<span class="built_in">CC_UNLIKELY</span>(g_HWUI_debug_overdraw)) &#123;</span><br><span class="line">        <span class="comment">// ... debug logic ...</span></span><br><span class="line">    &#125;</span><br><span class="line"></span><br><span class="line">    <span class="comment">// ......</span></span><br><span class="line">&#125;</span><br></pre></td></tr></table></figure><h4 id="2-1-EglManager-beginFrame"><a href="#2-1-EglManager-beginFrame" class="headerlink" title="2.1 EglManager::beginFrame"></a>2.1 EglManager::beginFrame</h4><p>While not shown in the immediate snippet above, <code>beginFrame</code> is typically called during this phase:</p><figure class="highlight cpp"><table><tr><td class="gutter"><pre><span class="line">1</span><br><span class="line">2</span><br><span class="line">3</span><br><span class="line">4</span><br><span class="line">5</span><br><span class="line">6</span><br><span class="line">7</span><br><span class="line">8</span><br><span class="line">9</span><br><span class="line">10</span><br></pre></td><td class="code"><pre><span class="line"><span class="function"><span class="type">void</span> <span class="title">EglManager::beginFrame</span><span class="params">(EGLSurface surface, EGLint* width, EGLint* height)</span> </span>&#123;</span><br><span class="line">    <span class="built_in">makeCurrent</span>(surface);</span><br><span class="line">    <span class="keyword">if</span> (width) &#123;</span><br><span class="line">        <span class="built_in">eglQuerySurface</span>(mEglDisplay, surface, EGL_WIDTH, width);</span><br><span class="line">    &#125;</span><br><span class="line">    <span class="keyword">if</span> (height) &#123;</span><br><span class="line">        <span class="built_in">eglQuerySurface</span>(mEglDisplay, surface, EGL_HEIGHT, height);</span><br><span class="line">    &#125;</span><br><span class="line">    <span class="built_in">eglBeginFrame</span>(mEglDisplay, surface);</span><br><span class="line">&#125;</span><br></pre></td></tr></table></figure><p><code>makeCurrent</code> manages the context, and <code>eglBeginFrame</code> validates parameter integrity.</p><h4 id="2-2-prepareDirty"><a href="#2-2-prepareDirty" class="headerlink" title="2.2 prepareDirty"></a>2.2 prepareDirty</h4><figure class="highlight cpp"><table><tr><td class="gutter"><pre><span class="line">1</span><br><span class="line">2</span><br><span class="line">3</span><br><span class="line">4</span><br><span class="line">5</span><br><span class="line">6</span><br><span class="line">7</span><br></pre></td><td class="code"><pre><span class="line"><span class="type">status_t</span> status;</span><br><span class="line"><span class="keyword">if</span> (!dirty.<span class="built_in">isEmpty</span>()) &#123;</span><br><span class="line">    status = mCanvas-&gt;<span class="built_in">prepareDirty</span>(dirty.fLeft, dirty.fTop,</span><br><span class="line">            dirty.fRight, dirty.fBottom, mOpaque);</span><br><span class="line">&#125; <span class="keyword">else</span> &#123;</span><br><span class="line">    status = mCanvas-&gt;<span class="built_in">prepare</span>(mOpaque);</span><br><span class="line">&#125;</span><br></pre></td></tr></table></figure><p>Here, <code>mCanvas</code> is an <code>OpenGLRenderer</code> object. Its <code>prepareDirty</code> implementation is:</p><figure class="highlight cpp"><table><tr><td class="gutter"><pre><span class="line">1</span><br><span class="line">2</span><br><span class="line">3</span><br><span class="line">4</span><br><span class="line">5</span><br><span class="line">6</span><br><span class="line">7</span><br><span class="line">8</span><br><span class="line">9</span><br><span class="line">10</span><br><span class="line">11</span><br><span class="line">12</span><br><span class="line">13</span><br><span class="line">14</span><br><span class="line">15</span><br><span class="line">16</span><br><span class="line">17</span><br></pre></td><td class="code"><pre><span class="line"><span class="function"><span class="type">status_t</span> <span class="title">OpenGLRenderer::prepareDirty</span><span class="params">(<span class="type">float</span> left, <span class="type">float</span> top,</span></span></span><br><span class="line"><span class="params"><span class="function">        <span class="type">float</span> right, <span class="type">float</span> bottom, <span class="type">bool</span> opaque)</span> </span>&#123;</span><br><span class="line">    <span class="built_in">setupFrameState</span>(left, top, right, bottom, opaque);</span><br><span class="line"></span><br><span class="line">    <span class="comment">// Layer renderers will start the frame immediately</span></span><br><span class="line">    <span class="comment">// The framebuffer renderer will first defer the display list</span></span><br><span class="line">    <span class="comment">// for each layer and wait until the first drawing command</span></span><br><span class="line">    <span class="comment">// to start the frame</span></span><br><span class="line">    <span class="keyword">if</span> (<span class="built_in">currentSnapshot</span>()-&gt;fbo == <span class="number">0</span>) &#123;</span><br><span class="line">        <span class="built_in">syncState</span>();</span><br><span class="line">        <span class="built_in">updateLayers</span>();</span><br><span class="line">    &#125; <span class="keyword">else</span> &#123;</span><br><span class="line">        <span class="keyword">return</span> <span class="built_in">startFrame</span>();</span><br><span class="line">    &#125;</span><br><span class="line"></span><br><span class="line">    <span class="keyword">return</span> DrawGlInfo::kStatusDone;</span><br><span class="line">&#125;</span><br></pre></td></tr></table></figure><h4 id="2-3-drawRenderNode"><a href="#2-3-drawRenderNode" class="headerlink" title="2.3 drawRenderNode"></a>2.3 drawRenderNode</h4><figure class="highlight cpp"><table><tr><td class="gutter"><pre><span class="line">1</span><br><span class="line">2</span><br></pre></td><td class="code"><pre><span class="line">Rect outBounds;</span><br><span class="line">status |= mCanvas-&gt;<span class="built_in">drawRenderNode</span>(mRootRenderNode.<span class="built_in">get</span>(), outBounds);</span><br></pre></td></tr></table></figure><p>Next, <code>OpenGLRenderer::drawRenderNode</code> is called to perform the actual rendering:</p><figure class="highlight cpp"><table><tr><td class="gutter"><pre><span class="line">1</span><br><span class="line">2</span><br><span class="line">3</span><br><span class="line">4</span><br><span class="line">5</span><br><span class="line">6</span><br><span class="line">7</span><br><span class="line">8</span><br><span class="line">9</span><br><span class="line">10</span><br><span class="line">11</span><br><span class="line">12</span><br><span class="line">13</span><br><span class="line">14</span><br><span class="line">15</span><br><span class="line">16</span><br><span class="line">17</span><br><span class="line">18</span><br><span class="line">19</span><br><span class="line">20</span><br><span class="line">21</span><br><span class="line">22</span><br><span class="line">23</span><br><span class="line">24</span><br><span class="line">25</span><br><span class="line">26</span><br><span class="line">27</span><br><span class="line">28</span><br><span class="line">29</span><br><span class="line">30</span><br></pre></td><td class="code"><pre><span class="line"><span class="function"><span class="type">status_t</span> <span class="title">OpenGLRenderer::drawRenderNode</span><span class="params">(RenderNode* renderNode, Rect&amp; dirty, <span class="type">int32_t</span> replayFlags)</span> </span>&#123;</span><br><span class="line">    <span class="type">status_t</span> status;</span><br><span class="line">    <span class="comment">// All the usual checks and setup operations (quickReject, setupDraw, etc.)</span></span><br><span class="line">    <span class="comment">// will be performed by the display list itself</span></span><br><span class="line">    <span class="keyword">if</span> (renderNode &amp;&amp; renderNode-&gt;<span class="built_in">isRenderable</span>()) &#123;</span><br><span class="line">        <span class="comment">// compute 3d ordering</span></span><br><span class="line">        renderNode-&gt;<span class="built_in">computeOrdering</span>();</span><br><span class="line">        <span class="keyword">if</span> (<span class="built_in">CC_UNLIKELY</span>(mCaches.drawDeferDisabled)) &#123; <span class="comment">// Check if reordering is disabled</span></span><br><span class="line">            status = <span class="built_in">startFrame</span>();</span><br><span class="line">            <span class="function">ReplayStateStruct <span class="title">replayStruct</span><span class="params">(*<span class="keyword">this</span>, dirty, replayFlags)</span></span>;</span><br><span class="line">            renderNode-&gt;<span class="built_in">replay</span>(replayStruct, <span class="number">0</span>);</span><br><span class="line">            <span class="keyword">return</span> status | replayStruct.mDrawGlStatus;</span><br><span class="line">        &#125;</span><br><span class="line"></span><br><span class="line">        <span class="comment">// Reordering required</span></span><br><span class="line">        <span class="type">bool</span> avoidOverdraw = !mCaches.debugOverdraw &amp;&amp; !mCountOverdraw;</span><br><span class="line">        <span class="function">DeferredDisplayList <span class="title">deferredList</span><span class="params">(*currentClipRect(), avoidOverdraw)</span></span>;</span><br><span class="line">        <span class="function">DeferStateStruct <span class="title">deferStruct</span><span class="params">(deferredList, *<span class="keyword">this</span>, replayFlags)</span></span>;</span><br><span class="line">        renderNode-&gt;<span class="built_in">defer</span>(deferStruct, <span class="number">0</span>); <span class="comment">// Recursive reordering</span></span><br><span class="line"></span><br><span class="line">        <span class="built_in">flushLayers</span>(); <span class="comment">// Draw child Render Nodes with Layers set (to FBOs)</span></span><br><span class="line">        status = <span class="built_in">startFrame</span>(); <span class="comment">// Basic operations like clearing color buffers</span></span><br><span class="line">        status = deferredList.<span class="built_in">flush</span>(*<span class="keyword">this</span>, dirty) | status;</span><br><span class="line">        <span class="keyword">return</span> status;</span><br><span class="line">    &#125;</span><br><span class="line"></span><br><span class="line">    <span class="comment">// Even if there is no drawing command (e.g., invisible),</span></span><br><span class="line">    <span class="comment">// it still needs startFrame to clear buffer and start tiling.</span></span><br><span class="line">    <span class="keyword">return</span> <span class="built_in">startFrame</span>();</span><br><span class="line">&#125;</span><br></pre></td></tr></table></figure><p>Here, <code>renderNode</code> is the <code>RootRenderNode</code>. Although this is just the beginning of the draw process, the key steps are already highlighted:</p><figure class="highlight cpp"><table><tr><td class="gutter"><pre><span class="line">1</span><br><span class="line">2</span><br><span class="line">3</span><br><span class="line">4</span><br><span class="line">5</span><br></pre></td><td class="code"><pre><span class="line">renderNode-&gt;<span class="built_in">defer</span>(deferStruct, <span class="number">0</span>); <span class="comment">// Reordering</span></span><br><span class="line"></span><br><span class="line"><span class="built_in">flushLayers</span>(); <span class="comment">// Draw Layers for child nodes to get corresponding FBOs</span></span><br><span class="line"></span><br><span class="line">status = deferredList.<span class="built_in">flush</span>(*<span class="keyword">this</span>, dirty) | status; <span class="comment">// Execute actual rendering from the deferred list</span></span><br></pre></td></tr></table></figure><p>These are the true core of the rendering engine. The implementation details are complex. For a deeper dive, I highly recommend Luo Shengyang’s article: <a href="http://blog.csdn.net/luoshengyang/article/details/46281499">Analysis of the Display List Rendering Process in Android UI Hardware Acceleration</a>.</p><h4 id="2-4-swapBuffers"><a href="#2-4-swapBuffers" class="headerlink" title="2.4 swapBuffers"></a>2.4 swapBuffers</h4><figure class="highlight cpp"><table><tr><td class="gutter"><pre><span class="line">1</span><br><span class="line">2</span><br><span class="line">3</span><br></pre></td><td class="code"><pre><span class="line"><span class="keyword">if</span> (status &amp; DrawGlInfo::kStatusDrew) &#123;</span><br><span class="line">    <span class="built_in">swapBuffers</span>();</span><br><span class="line">&#125;</span><br></pre></td></tr></table></figure><p>This ultimately calls the EGL function <code>eglSwapBuffers(mEglDisplay, surface)</code>.</p><h4 id="2-5-FinishFrame"><a href="#2-5-FinishFrame" class="headerlink" title="2.5 FinishFrame"></a>2.5 FinishFrame</h4><figure class="highlight cpp"><table><tr><td class="gutter"><pre><span class="line">1</span><br></pre></td><td class="code"><pre><span class="line"><span class="built_in">profiler</span>().<span class="built_in">finishFrame</span>();</span><br></pre></td></tr></table></figure><p>Mainly used for recording timing information.</p><h2 id="Summary"><a href="#Summary" class="headerlink" title="Summary"></a>Summary</h2><p>Since I’m a bit lazy and my summarizing skills don’t quite match Luo’s, I’ll quote his summary here. The overall <code>RenderThread</code> flow is as follows:</p><ol><li>Synchronize the Display List maintained by the Main Thread to the one maintained by the Render Thread. This synchronization is performed by the Render Thread while the Main Thread is blocked.</li><li>If the synchronization completes successfully, the Main Thread is awakened. From this point, the Main Thread and Render Thread operate independently on their respective Display Lists. Otherwise, the Main Thread remains blocked until the Render Thread finishes rendering the current frame.</li><li>Before rendering the Root Render Node’s Display List, the Render Thread first renders child nodes with Layers onto their own FBOs. Finally, it renders these FBOs alongside nodes without Layers onto the Frame Buffer (the graphics buffer requested from SurfaceFlinger). This buffer is then submitted to SurfaceFlinger for composition and display.</li></ol><p>Step 2 is crucial because it allows the Main Thread and Render Thread to run in parallel. This means that while the Render Thread is rendering the current frame, the Main Thread can start preparing the Display List for the <em>next</em> frame, leading to a much smoother UI.</p><p>Before Android 5.0, without a <code>RenderThread</code>, everything happened on the Main Thread. This meant that the next frame could only be prepared <em>after</em> the current draw was complete, as shown below:</p><p><img src="/en/images/hwui/renderthread/5.webp" alt="Blocking Draw Flow"></p><p>With Android 5.0, there are two scenarios:</p><p><img src="/en/images/hwui/renderthread/6.webp" alt="Main Thread and Render Thread Parallelism"></p><p><img src="/en/images/hwui/renderthread/7.webp" alt="Render Thread Early Wakeup"></p><p>In the second scenario, the <code>RenderThread</code> hasn’t finished drawing, but since it awakened the Main Thread early, the Main Thread can respond to the next Vsync signal on time and begin preparing the next frame. Even if the first frame took longer than usual (causing a dropped frame), the second frame remains unaffected.</p><hr><h1 id="About-Me-amp-amp-Blog"><a href="#About-Me-amp-amp-Blog" class="headerlink" title="About Me &amp;&amp; Blog"></a>About Me &amp;&amp; Blog</h1><p>Below are my personal details and links. I look forward to connecting and sharing knowledge with fellow developers!</p><ol><li><a href="https://www.androidperformance.com/en/about/">About Me</a>: Includes my WeChat and WeChat group links.</li><li><a href="https://www.androidperformance.com/en/2019/12/01/BlogMap/">Blog Navigation</a>: A guide to the content on this blog.</li><li><a href="https://www.androidperformance.com/en/2018/05/07/Android-performance-optimization-skills-and-tools/">Curated Android Performance Articles</a>: A collection of must-read performance optimization articles. Self-nominations&#x2F;recommendations are welcome!</li><li><a href="https://www.androidperformance.com/en/2023/12/30/the-performance/">Android Performance Knowledge Planet</a>: Join our community for more insights.</li></ol><blockquote><p><strong>“If you want to go fast, go alone. If you want to go far, go together.”</strong></p></blockquote><p><img src="/en/images/WechatIMG581.webp" alt="WeChat QR Code"></p>]]></content>
    
    
    <summary type="html">&lt;h2 id=&quot;Preface&quot;&gt;&lt;a href=&quot;#Preface&quot; class=&quot;headerlink&quot; title=&quot;Preface&quot;&gt;&lt;/a&gt;Preface&lt;/h2&gt;&lt;p&gt;This article serves as a set of learning notes documenting the basic workflow of &lt;code&gt;RenderThread&lt;/code&gt; in hwui as introduced in Android 5.0. Since these are notes, some details might not be exhaustive. Instead, I aim to walk through the general flow and highlight the key stages of its operation for future reference when debugging.&lt;/p&gt;
&lt;p&gt;The image below shows a Systrace capture of the first &lt;code&gt;Draw&lt;/code&gt; operation by the &lt;code&gt;RenderThread&lt;/code&gt; during an application startup. We can trace the &lt;code&gt;RenderThread&lt;/code&gt; workflow by observing the sequence of events in this trace. If you are familiar with the application startup process, you know that the entire interface is only displayed on the phone after the first &lt;code&gt;drawFrame&lt;/code&gt; is completed. Before this, the user sees the application’s &lt;code&gt;StartingWindow&lt;/code&gt;.&lt;/p&gt;</summary>


    <category term="Android" scheme="https://androidperformance.com/en/categories/Android/"/>
    
    
    <category term="Android" scheme="https://androidperformance.com/en/tags/Android/"/>
    
    <category term="Systrace" scheme="https://androidperformance.com/en/tags/Systrace/"/>
    
    <category term="Startup" scheme="https://androidperformance.com/en/tags/Startup/"/>
    
    <category term="RenderThread" scheme="https://androidperformance.com/en/tags/RenderThread/"/>
    
    <category term="Java" scheme="https://androidperformance.com/en/tags/Java/"/>
    
  </entry>
  
  <entry>
    <title>Java 7 HashMap Source Code Analysis</title>
    <link href="https://androidperformance.com/en/2015/08/05/HashMap/"/>
    <id>https://androidperformance.com/en/2015/08/05/HashMap/</id>
    <published>2015-08-05T12:27:13.000Z</published>
    <updated>2026-05-10T23:29:51.061Z</updated>
    
    <content type="html"><![CDATA[<p>Linked lists and arrays allow elements to be arranged in an order of our choice. However, if you want to find a specific element but have forgotten its position, you must visit every element until you find it. This can consume significant time if the collection is large. A data structure that allows for rapidly finding objects is the <strong>hash table</strong>.</p><p><code>HashMap</code> is an implementation of the <code>Map</code> interface based on a hash table. This implementation provides all optional mapping operations and permits <code>null</code> values and <code>null</code> keys. (The <code>HashMap</code> class is roughly equivalent to <code>Hashtable</code>, except that it is unsynchronized and permits nulls.) This class makes no guarantees as to the order of the map; in particular, it does not guarantee that the order will remain constant over time.</p><span id="more"></span><h3 id="1-HashMap-Data-Structure"><a href="#1-HashMap-Data-Structure" class="headerlink" title="1. HashMap Data Structure"></a>1. HashMap Data Structure</h3><p><code>HashMap</code> is composed of both an array and linked lists. The underlying structure is an array, where each element serves as the head of a linked list.</p><p><img src="/en/images/hashMapSourceAnalysis/hs.20150729.01.jpg" alt="HashMap Structure"></p><figure class="highlight java"><table><tr><td class="gutter"><pre><span class="line">1</span><br><span class="line">2</span><br><span class="line">3</span><br><span class="line">4</span><br><span class="line">5</span><br><span class="line">6</span><br><span class="line">7</span><br></pre></td><td class="code"><pre><span class="line"><span class="keyword">static</span> <span class="keyword">class</span> <span class="title class_">Entry</span>&lt;K,V&gt; <span class="keyword">implements</span> <span class="title class_">Map</span>.Entry&lt;K,V&gt; &#123;</span><br><span class="line">    <span class="keyword">final</span> K key;</span><br><span class="line">    V value;</span><br><span class="line">    Entry&lt;K,V&gt; next;</span><br><span class="line">    <span class="type">int</span> hash;</span><br><span class="line">    <span class="comment">// ...</span></span><br><span class="line">&#125;</span><br></pre></td></tr></table></figure><p><code>Entry</code> is a static internal class within <code>HashMap</code>, package-private, and implements the <code>Map.Entry&lt;K,V&gt;</code> interface. It includes a pointer to the next element in the list.</p><h3 id="2-Constructors"><a href="#2-Constructors" class="headerlink" title="2. Constructors"></a>2. Constructors</h3><p><code>HashMap</code> has four constructors:</p><ol><li><code>HashMap()</code>: Constructs an empty <code>HashMap</code> with the default initial capacity (16) and default load factor (0.75).</li><li><code>HashMap(int initialCapacity)</code>: Constructs an empty <code>HashMap</code> with a specified initial capacity and the default load factor (0.75).</li><li><code>HashMap(int initialCapacity, float loadFactor)</code>: Constructs an empty <code>HashMap</code> with a specified initial capacity and load factor.</li><li><code>HashMap(Map&lt;? extends K,? extends V&gt; m)</code>: Constructs a new <code>HashMap</code> with the same mappings as the specified <code>Map</code>.</li></ol><p>In essence, these boil down to two types: one where you specify initial capacity and load factor, and another that generates a new <code>HashMap</code> from an existing map. Let’s look at the first type:</p><figure class="highlight java"><table><tr><td class="gutter"><pre><span class="line">1</span><br><span class="line">2</span><br><span class="line">3</span><br><span class="line">4</span><br><span class="line">5</span><br><span class="line">6</span><br><span class="line">7</span><br><span class="line">8</span><br><span class="line">9</span><br><span class="line">10</span><br><span class="line">11</span><br><span class="line">12</span><br><span class="line">13</span><br><span class="line">14</span><br><span class="line">15</span><br><span class="line">16</span><br><span class="line">17</span><br><span class="line">18</span><br><span class="line">19</span><br><span class="line">20</span><br><span class="line">21</span><br><span class="line">22</span><br><span class="line">23</span><br><span class="line">24</span><br><span class="line">25</span><br><span class="line">26</span><br><span class="line">27</span><br><span class="line">28</span><br><span class="line">29</span><br><span class="line">30</span><br><span class="line">31</span><br></pre></td><td class="code"><pre><span class="line"><span class="comment">/**</span></span><br><span class="line"><span class="comment"> * Constructs an empty &lt;tt&gt;HashMap&lt;/tt&gt; with the specified initial</span></span><br><span class="line"><span class="comment"> * capacity and load factor.</span></span><br><span class="line"><span class="comment"> *</span></span><br><span class="line"><span class="comment"> * <span class="doctag">@param</span>  initialCapacity the initial capacity</span></span><br><span class="line"><span class="comment"> * <span class="doctag">@param</span>  loadFactor      the load factor</span></span><br><span class="line"><span class="comment"> * <span class="doctag">@throws</span> IllegalArgumentException if the initial capacity is negative</span></span><br><span class="line"><span class="comment"> *         or the load factor is nonpositive</span></span><br><span class="line"><span class="comment"> */</span></span><br><span class="line"><span class="keyword">public</span> <span class="title function_">HashMap</span><span class="params">(<span class="type">int</span> initialCapacity, <span class="type">float</span> loadFactor)</span> &#123;</span><br><span class="line">    <span class="keyword">if</span> (initialCapacity &lt; <span class="number">0</span>)</span><br><span class="line">        <span class="keyword">throw</span> <span class="keyword">new</span> <span class="title class_">IllegalArgumentException</span>(<span class="string">&quot;Illegal initial capacity: &quot;</span> +</span><br><span class="line">                                           initialCapacity);</span><br><span class="line">    <span class="keyword">if</span> (initialCapacity &gt; MAXIMUM_CAPACITY)</span><br><span class="line">        initialCapacity = MAXIMUM_CAPACITY;</span><br><span class="line">    <span class="keyword">if</span> (loadFactor &lt;= <span class="number">0</span> || Float.isNaN(loadFactor))</span><br><span class="line">        <span class="keyword">throw</span> <span class="keyword">new</span> <span class="title class_">IllegalArgumentException</span>(<span class="string">&quot;Illegal load factor: &quot;</span> +</span><br><span class="line">                                           loadFactor);</span><br><span class="line"></span><br><span class="line">    <span class="comment">// Find a power of 2 &gt;= initialCapacity</span></span><br><span class="line">    <span class="type">int</span> <span class="variable">capacity</span> <span class="operator">=</span> <span class="number">1</span>;</span><br><span class="line">    <span class="keyword">while</span> (capacity &lt; initialCapacity)</span><br><span class="line">        capacity &lt;&lt;= <span class="number">1</span>;</span><br><span class="line"></span><br><span class="line">    <span class="built_in">this</span>.loadFactor = loadFactor;</span><br><span class="line">    threshold = (<span class="type">int</span>)Math.min(capacity * loadFactor, MAXIMUM_CAPACITY + <span class="number">1</span>);</span><br><span class="line">    table = <span class="keyword">new</span> <span class="title class_">Entry</span>[capacity];</span><br><span class="line">    useAltHashing = sun.misc.VM.isBooted() &amp;&amp;</span><br><span class="line">            (capacity &gt;= Holder.ALTERNATIVE_HASHING_THRESHOLD);</span><br><span class="line">    init();</span><br><span class="line">&#125;</span><br></pre></td></tr></table></figure><p>The parameters are simple: <code>initialCapacity</code> and <code>loadFactor</code>. <code>initialCapacity</code> defines the initial size of the array, while the product of <code>loadFactor</code> and <code>capacity</code> determines a threshold. The maximum threshold is <code>(1 &lt;&lt; 30) + 1</code>. The capacity is always a power of 2, specifically the smallest power of 2 that is greater than or equal to the requested value. The default capacity is 16, and the default load factor is 0.75. When the number of elements in the map reaches or exceeds the threshold, the array capacity doubles, and elements are re-inserted into the new array. This is why <code>HashMap</code> does not guarantee constant ordering.</p><p>An <code>IllegalArgumentException</code> is thrown if the load factor is less than or equal to zero or is not a number.</p><h3 id="3-put-Operation"><a href="#3-put-Operation" class="headerlink" title="3. put Operation"></a>3. put Operation</h3><figure class="highlight java"><table><tr><td class="gutter"><pre><span class="line">1</span><br><span class="line">2</span><br><span class="line">3</span><br><span class="line">4</span><br><span class="line">5</span><br><span class="line">6</span><br><span class="line">7</span><br><span class="line">8</span><br><span class="line">9</span><br><span class="line">10</span><br><span class="line">11</span><br><span class="line">12</span><br><span class="line">13</span><br><span class="line">14</span><br><span class="line">15</span><br><span class="line">16</span><br><span class="line">17</span><br><span class="line">18</span><br><span class="line">19</span><br><span class="line">20</span><br><span class="line">21</span><br><span class="line">22</span><br><span class="line">23</span><br><span class="line">24</span><br><span class="line">25</span><br><span class="line">26</span><br><span class="line">27</span><br><span class="line">28</span><br><span class="line">29</span><br><span class="line">30</span><br><span class="line">31</span><br></pre></td><td class="code"><pre><span class="line"><span class="comment">/**</span></span><br><span class="line"><span class="comment"> * Associates the specified value with the specified key in this map.</span></span><br><span class="line"><span class="comment"> * If the map previously contained a mapping for the key, the old</span></span><br><span class="line"><span class="comment"> * value is replaced.</span></span><br><span class="line"><span class="comment"> *</span></span><br><span class="line"><span class="comment"> * <span class="doctag">@param</span> key key with which the specified value is to be associated</span></span><br><span class="line"><span class="comment"> * <span class="doctag">@param</span> value value to be associated with the specified key</span></span><br><span class="line"><span class="comment"> * <span class="doctag">@return</span> the previous value associated with &lt;tt&gt;key&lt;/tt&gt;, or</span></span><br><span class="line"><span class="comment"> *         &lt;tt&gt;null&lt;/tt&gt; if there was no mapping for &lt;tt&gt;key&lt;/tt&gt;.</span></span><br><span class="line"><span class="comment"> *         (A &lt;tt&gt;null&lt;/tt&gt; return can also indicate that the map</span></span><br><span class="line"><span class="comment"> *         previously associated &lt;tt&gt;null&lt;/tt&gt; with &lt;tt&gt;key&lt;/tt&gt;.)</span></span><br><span class="line"><span class="comment"> */</span></span><br><span class="line"><span class="keyword">public</span> V <span class="title function_">put</span><span class="params">(K key, V value)</span> &#123;</span><br><span class="line">    <span class="keyword">if</span> (key == <span class="literal">null</span>)</span><br><span class="line">        <span class="keyword">return</span> putForNullKey(value);</span><br><span class="line">    <span class="type">int</span> <span class="variable">hash</span> <span class="operator">=</span> hash(key);</span><br><span class="line">    <span class="type">int</span> <span class="variable">i</span> <span class="operator">=</span> indexFor(hash, table.length);</span><br><span class="line">    <span class="keyword">for</span> (Entry&lt;K,V&gt; e = table[i]; e != <span class="literal">null</span>; e = e.next) &#123;</span><br><span class="line">        Object k;</span><br><span class="line">        <span class="keyword">if</span> (e.hash == hash &amp;&amp; ((k = e.key) == key || key.equals(k))) &#123;</span><br><span class="line">            <span class="type">V</span> <span class="variable">oldValue</span> <span class="operator">=</span> e.value;</span><br><span class="line">            e.value = value;</span><br><span class="line">            e.recordAccess(<span class="built_in">this</span>);</span><br><span class="line">            <span class="keyword">return</span> oldValue;</span><br><span class="line">        &#125;</span><br><span class="line">    &#125;</span><br><span class="line"></span><br><span class="line">    modCount++;</span><br><span class="line">    addEntry(hash, key, value, i);</span><br><span class="line">    <span class="keyword">return</span> <span class="literal">null</span>;</span><br><span class="line">&#125;</span><br></pre></td></tr></table></figure><p>Since <code>HashMap</code> allows <code>null</code> keys, it first checks if the key is <code>null</code> and performs special handling.</p><figure class="highlight java"><table><tr><td class="gutter"><pre><span class="line">1</span><br><span class="line">2</span><br><span class="line">3</span><br><span class="line">4</span><br><span class="line">5</span><br><span class="line">6</span><br><span class="line">7</span><br><span class="line">8</span><br><span class="line">9</span><br><span class="line">10</span><br><span class="line">11</span><br><span class="line">12</span><br><span class="line">13</span><br><span class="line">14</span><br><span class="line">15</span><br><span class="line">16</span><br></pre></td><td class="code"><pre><span class="line"><span class="comment">/**</span></span><br><span class="line"><span class="comment"> * Offloaded version of put for null keys</span></span><br><span class="line"><span class="comment"> */</span></span><br><span class="line"><span class="keyword">private</span> V <span class="title function_">putForNullKey</span><span class="params">(V value)</span> &#123;</span><br><span class="line">    <span class="keyword">for</span> (Entry&lt;K,V&gt; e = table[<span class="number">0</span>]; e != <span class="literal">null</span>; e = e.next) &#123;</span><br><span class="line">        <span class="keyword">if</span> (e.key == <span class="literal">null</span>) &#123;</span><br><span class="line">            <span class="type">V</span> <span class="variable">oldValue</span> <span class="operator">=</span> e.value;</span><br><span class="line">            e.value = value;</span><br><span class="line">            e.recordAccess(<span class="built_in">this</span>);</span><br><span class="line">            <span class="keyword">return</span> oldValue;</span><br><span class="line">        &#125;</span><br><span class="line">    &#125;</span><br><span class="line">    modCount++;</span><br><span class="line">    addEntry(<span class="number">0</span>, <span class="literal">null</span>, value, <span class="number">0</span>);</span><br><span class="line">    <span class="keyword">return</span> <span class="literal">null</span>;</span><br><span class="line">&#125;</span><br></pre></td></tr></table></figure><p>A <code>null</code> key is always inserted at index 0 of the array. If an entry already exists at that position with a <code>null</code> key, its value is replaced; otherwise, a new entry is added. We’ll examine the <code>addEntry</code> function shortly.</p><p><strong>Question: If a null key is always inserted into <code>table[0]</code>, why do we still need to traverse the linked list?</strong></p><p>Returning to the <code>put</code> function: if the key is not <code>null</code>, its hash value is calculated, and the <code>indexFor</code> function determines its position in the table.</p><figure class="highlight java"><table><tr><td class="gutter"><pre><span class="line">1</span><br><span class="line">2</span><br><span class="line">3</span><br><span class="line">4</span><br><span class="line">5</span><br><span class="line">6</span><br></pre></td><td class="code"><pre><span class="line"><span class="comment">/**</span></span><br><span class="line"><span class="comment"> * Returns index for hash code h.</span></span><br><span class="line"><span class="comment"> */</span></span><br><span class="line"><span class="keyword">static</span> <span class="type">int</span> <span class="title function_">indexFor</span><span class="params">(<span class="type">int</span> h, <span class="type">int</span> length)</span> &#123;</span><br><span class="line">    <span class="keyword">return</span> h &amp; (length - <span class="number">1</span>);</span><br><span class="line">&#125;</span><br></pre></td></tr></table></figure><p>The <code>indexFor</code> function is brief but clever. Typically, mapping a number to a fixed length uses the modulo operator (<code>%</code>), i.e., <code>h % length</code>. However, this implementation exploits the fact that <code>table.length</code> is always a power of 2. In binary, a power of 2 is a <code>1</code> followed by <code>N</code> zeros, and <code>(length - 1)</code> is a sequence of <code>N</code> ones. A bitwise AND (<code>&amp;</code>) operation is much faster and more efficient than modulo. However, this efficiency depends on <code>length</code> being a power of 2; otherwise, collisions would increase significantly.</p><p>This also answers the previous question. Since <code>indexFor</code> returns values ranging from <code>0</code> to <code>(length - 1)</code>, it’s possible for non-null keys to also map to <code>table[0]</code>. Thus, we must traverse the linked list to find the exact key.</p><p>Once the index is determined, we iterate through the linked list. If the key exists, we replace the value and return the old one. <code>modCount++</code> increments the modification count, which is used for the fail-fast mechanism (discussed later). If the key is not found, we call <code>addEntry</code> to insert a new <code>Entry</code>.</p><figure class="highlight java"><table><tr><td class="gutter"><pre><span class="line">1</span><br><span class="line">2</span><br><span class="line">3</span><br><span class="line">4</span><br><span class="line">5</span><br><span class="line">6</span><br><span class="line">7</span><br><span class="line">8</span><br><span class="line">9</span><br><span class="line">10</span><br><span class="line">11</span><br><span class="line">12</span><br><span class="line">13</span><br><span class="line">14</span><br><span class="line">15</span><br><span class="line">16</span><br></pre></td><td class="code"><pre><span class="line"><span class="comment">/**</span></span><br><span class="line"><span class="comment"> * Adds a new entry with the specified key, value and hash code to</span></span><br><span class="line"><span class="comment"> * the specified bucket.  It is the responsibility of this</span></span><br><span class="line"><span class="comment"> * method to resize the table if appropriate.</span></span><br><span class="line"><span class="comment"> *</span></span><br><span class="line"><span class="comment"> * Subclass overrides this to alter the behavior of put method.</span></span><br><span class="line"><span class="comment"> */</span></span><br><span class="line"><span class="keyword">void</span> <span class="title function_">addEntry</span><span class="params">(<span class="type">int</span> hash, K key, V value, <span class="type">int</span> bucketIndex)</span> &#123;</span><br><span class="line">    <span class="keyword">if</span> ((size &gt;= threshold) &amp;&amp; (<span class="literal">null</span> != table[bucketIndex])) &#123;</span><br><span class="line">        resize(<span class="number">2</span> * table.length);</span><br><span class="line">        hash = (<span class="literal">null</span> != key) ? hash(key) : <span class="number">0</span>;</span><br><span class="line">        bucketIndex = indexFor(hash, table.length);</span><br><span class="line">    &#125;</span><br><span class="line"></span><br><span class="line">    createEntry(hash, key, value, bucketIndex);</span><br><span class="line">&#125;</span><br></pre></td></tr></table></figure><p>This function takes the hash, key, value, and the bucket index. It first checks if the current size has reached the threshold AND if the bucket at the target index is not empty. If both conditions are met, <code>resize(2 * table.length)</code> is called. Resizing reduces collisions and maintains access efficiency. The check for an empty bucket before resizing is an optimization to delay resizing as long as possible; if the bucket is empty, adding one element won’t cause immediate performance degradation.</p><figure class="highlight java"><table><tr><td class="gutter"><pre><span class="line">1</span><br><span class="line">2</span><br><span class="line">3</span><br><span class="line">4</span><br><span class="line">5</span><br><span class="line">6</span><br><span class="line">7</span><br><span class="line">8</span><br><span class="line">9</span><br><span class="line">10</span><br><span class="line">11</span><br><span class="line">12</span><br><span class="line">13</span><br><span class="line">14</span><br><span class="line">15</span><br><span class="line">16</span><br><span class="line">17</span><br><span class="line">18</span><br><span class="line">19</span><br><span class="line">20</span><br><span class="line">21</span><br><span class="line">22</span><br></pre></td><td class="code"><pre><span class="line"><span class="comment">/**</span></span><br><span class="line"><span class="comment"> * Rehashes the contents of this map into a new array with a</span></span><br><span class="line"><span class="comment"> * larger capacity.  This method is called automatically when the</span></span><br><span class="line"><span class="comment"> * number of keys in this map reaches its threshold.</span></span><br><span class="line"><span class="comment"> */</span></span><br><span class="line"><span class="keyword">void</span> <span class="title function_">resize</span><span class="params">(<span class="type">int</span> newCapacity)</span> &#123;</span><br><span class="line">    Entry[] oldTable = table;</span><br><span class="line">    <span class="type">int</span> <span class="variable">oldCapacity</span> <span class="operator">=</span> oldTable.length;</span><br><span class="line">    <span class="keyword">if</span> (oldCapacity == MAXIMUM_CAPACITY) &#123;</span><br><span class="line">        threshold = Integer.MAX_VALUE;</span><br><span class="line">        <span class="keyword">return</span>;</span><br><span class="line">    &#125;</span><br><span class="line"></span><br><span class="line">    Entry[] newTable = <span class="keyword">new</span> <span class="title class_">Entry</span>[newCapacity];</span><br><span class="line">    <span class="type">boolean</span> <span class="variable">oldAltHashing</span> <span class="operator">=</span> useAltHashing;</span><br><span class="line">    useAltHashing |= sun.misc.VM.isBooted() &amp;&amp;</span><br><span class="line">            (newCapacity &gt;= Holder.ALTERNATIVE_HASHING_THRESHOLD);</span><br><span class="line">    <span class="type">boolean</span> <span class="variable">rehash</span> <span class="operator">=</span> oldAltHashing ^ useAltHashing;</span><br><span class="line">    transfer(newTable, rehash);</span><br><span class="line">    table = newTable;</span><br><span class="line">    threshold = (<span class="type">int</span>)Math.min(newCapacity * loadFactor, MAXIMUM_CAPACITY + <span class="number">1</span>);</span><br><span class="line">&#125;</span><br></pre></td></tr></table></figure><p><code>resize</code> first checks if the table has already reached its maximum capacity (<code>1 &lt;&lt; 30</code>). If so, the threshold is set to <code>Integer.MAX_VALUE</code> to prevent further resizing. Otherwise, a new empty array is created with double the previous length. (Note: since capacities are powers of 2, <code>newCapacity</code> will correctly stay within bounds until <code>MAXIMUM_CAPACITY</code> is hit). The <code>transfer</code> function then migrates the elements.</p><figure class="highlight java"><table><tr><td class="gutter"><pre><span class="line">1</span><br><span class="line">2</span><br><span class="line">3</span><br><span class="line">4</span><br><span class="line">5</span><br><span class="line">6</span><br><span class="line">7</span><br><span class="line">8</span><br><span class="line">9</span><br><span class="line">10</span><br><span class="line">11</span><br><span class="line">12</span><br><span class="line">13</span><br><span class="line">14</span><br><span class="line">15</span><br><span class="line">16</span><br><span class="line">17</span><br><span class="line">18</span><br></pre></td><td class="code"><pre><span class="line"><span class="comment">/**</span></span><br><span class="line"><span class="comment"> * Transfers all entries from current table to newTable.</span></span><br><span class="line"><span class="comment"> */</span></span><br><span class="line"><span class="keyword">void</span> <span class="title function_">transfer</span><span class="params">(Entry[] newTable, <span class="type">boolean</span> rehash)</span> &#123;</span><br><span class="line">    <span class="type">int</span> <span class="variable">newCapacity</span> <span class="operator">=</span> newTable.length;</span><br><span class="line">    <span class="keyword">for</span> (Entry&lt;K,V&gt; e : table) &#123;</span><br><span class="line">        <span class="keyword">while</span>(<span class="literal">null</span> != e) &#123;</span><br><span class="line">            Entry&lt;K,V&gt; next = e.next;</span><br><span class="line">            <span class="keyword">if</span> (rehash) &#123;</span><br><span class="line">                e.hash = <span class="literal">null</span> == e.key ? <span class="number">0</span> : hash(e.key);</span><br><span class="line">            &#125;</span><br><span class="line">            <span class="type">int</span> <span class="variable">i</span> <span class="operator">=</span> indexFor(e.hash, newCapacity);</span><br><span class="line">            e.next = newTable[i];</span><br><span class="line">            newTable[i] = e;</span><br><span class="line">            e = next;</span><br><span class="line">        &#125;</span><br><span class="line">    &#125;</span><br><span class="line">&#125;</span><br></pre></td></tr></table></figure><p>This function moves every entry from the old table to the new one. Since the array length has changed, the elements’ indices also change, which is why <code>HashMap</code> does not maintain ordering. Resizing is a resource-intensive operation, so it should be minimized.</p><p>Back in <code>addEntry</code>, after potentially resizing, a new entry is created:</p><figure class="highlight java"><table><tr><td class="gutter"><pre><span class="line">1</span><br><span class="line">2</span><br><span class="line">3</span><br><span class="line">4</span><br><span class="line">5</span><br><span class="line">6</span><br><span class="line">7</span><br><span class="line">8</span><br><span class="line">9</span><br><span class="line">10</span><br></pre></td><td class="code"><pre><span class="line"><span class="comment">/**</span></span><br><span class="line"><span class="comment"> * Like addEntry except that this version is used when creating entries</span></span><br><span class="line"><span class="comment"> * as part of Map construction or &quot;pseudo-construction&quot; (cloning,</span></span><br><span class="line"><span class="comment"> * deserialization).  This version needn&#x27;t worry about resizing the table.</span></span><br><span class="line"><span class="comment"> */</span></span><br><span class="line"><span class="keyword">void</span> <span class="title function_">createEntry</span><span class="params">(<span class="type">int</span> hash, K key, V value, <span class="type">int</span> bucketIndex)</span> &#123;</span><br><span class="line">    Entry&lt;K,V&gt; e = table[bucketIndex];</span><br><span class="line">    table[bucketIndex] = <span class="keyword">new</span> <span class="title class_">Entry</span>&lt;&gt;(hash, key, value, e);</span><br><span class="line">    size++;</span><br><span class="line">&#125;</span><br></pre></td></tr></table></figure><p><code>createEntry</code> uses the same parameters as <code>addEntry</code>. Its logic is closely tied to the <code>Entry</code> constructor:</p><figure class="highlight java"><table><tr><td class="gutter"><pre><span class="line">1</span><br><span class="line">2</span><br><span class="line">3</span><br><span class="line">4</span><br><span class="line">5</span><br><span class="line">6</span><br><span class="line">7</span><br><span class="line">8</span><br><span class="line">9</span><br></pre></td><td class="code"><pre><span class="line"><span class="comment">/**</span></span><br><span class="line"><span class="comment"> * Creates new entry.</span></span><br><span class="line"><span class="comment"> */</span></span><br><span class="line">Entry(<span class="type">int</span> h, K k, V v, Entry&lt;K,V&gt; n) &#123;</span><br><span class="line">    value = v;</span><br><span class="line">    next = n;</span><br><span class="line">    key = k;</span><br><span class="line">    hash = h;</span><br><span class="line">&#125;</span><br></pre></td></tr></table></figure><p>The constructor takes an <code>Entry</code> object (<code>n</code>) and sets it as the <code>next</code> value for the new entry. Effectively, <code>createEntry</code> takes the existing list at <code>table[bucketIndex]</code>, attaches it to the end of the new entry, and then places the new entry at the head of <code>table[bucketIndex]</code>.</p><p><img src="/en/images/hashMapSourceAnalysis/hs.20150729.02.jpg" alt="Entry Insertion"></p><p>This concludes the <code>put</code> function. If a new key-value pair is inserted, it returns <code>null</code>.</p><h3 id="4-get-Operation"><a href="#4-get-Operation" class="headerlink" title="4. get Operation"></a>4. get Operation</h3><figure class="highlight java"><table><tr><td class="gutter"><pre><span class="line">1</span><br><span class="line">2</span><br><span class="line">3</span><br><span class="line">4</span><br><span class="line">5</span><br><span class="line">6</span><br><span class="line">7</span><br><span class="line">8</span><br><span class="line">9</span><br><span class="line">10</span><br><span class="line">11</span><br></pre></td><td class="code"><pre><span class="line"><span class="comment">/**</span></span><br><span class="line"><span class="comment"> * Returns the value to which the specified key is mapped,</span></span><br><span class="line"><span class="comment"> * or &#123;<span class="doctag">@code</span> null&#125; if this map contains no mapping for the key.</span></span><br><span class="line"><span class="comment"> */</span></span><br><span class="line"><span class="keyword">public</span> V <span class="title function_">get</span><span class="params">(Object key)</span> &#123;</span><br><span class="line">    <span class="keyword">if</span> (key == <span class="literal">null</span>)</span><br><span class="line">        <span class="keyword">return</span> getForNullKey();</span><br><span class="line">    Entry&lt;K,V&gt; entry = getEntry(key);</span><br><span class="line"></span><br><span class="line">    <span class="keyword">return</span> <span class="literal">null</span> == entry ? <span class="literal">null</span> : entry.getValue();</span><br><span class="line">&#125;</span><br></pre></td></tr></table></figure><p>Like <code>put</code>, it first handles <code>null</code> keys:</p><figure class="highlight java"><table><tr><td class="gutter"><pre><span class="line">1</span><br><span class="line">2</span><br><span class="line">3</span><br><span class="line">4</span><br><span class="line">5</span><br><span class="line">6</span><br><span class="line">7</span><br><span class="line">8</span><br><span class="line">9</span><br><span class="line">10</span><br><span class="line">11</span><br></pre></td><td class="code"><pre><span class="line"><span class="comment">/**</span></span><br><span class="line"><span class="comment"> * Offloaded version of get() to look up null keys. Null keys map</span></span><br><span class="line"><span class="comment"> * to index 0.</span></span><br><span class="line"><span class="comment"> */</span></span><br><span class="line"><span class="keyword">private</span> V <span class="title function_">getForNullKey</span><span class="params">()</span> &#123;</span><br><span class="line">    <span class="keyword">for</span> (Entry&lt;K,V&gt; e = table[<span class="number">0</span>]; e != <span class="literal">null</span>; e = e.next) &#123;</span><br><span class="line">        <span class="keyword">if</span> (e.key == <span class="literal">null</span>)</span><br><span class="line">            <span class="keyword">return</span> e.value;</span><br><span class="line">    &#125;</span><br><span class="line">    <span class="keyword">return</span> <span class="literal">null</span>;</span><br><span class="line">&#125;</span><br></pre></td></tr></table></figure><p>For non-null keys, it calls <code>getEntry</code>:</p><figure class="highlight java"><table><tr><td class="gutter"><pre><span class="line">1</span><br><span class="line">2</span><br><span class="line">3</span><br><span class="line">4</span><br><span class="line">5</span><br><span class="line">6</span><br><span class="line">7</span><br><span class="line">8</span><br><span class="line">9</span><br><span class="line">10</span><br><span class="line">11</span><br><span class="line">12</span><br><span class="line">13</span><br><span class="line">14</span><br><span class="line">15</span><br><span class="line">16</span><br><span class="line">17</span><br></pre></td><td class="code"><pre><span class="line"><span class="comment">/**</span></span><br><span class="line"><span class="comment"> * Returns the entry associated with the specified key in the</span></span><br><span class="line"><span class="comment"> * HashMap. Returns null if the HashMap contains no mapping</span></span><br><span class="line"><span class="comment"> * for the key.</span></span><br><span class="line"><span class="comment"> */</span></span><br><span class="line"><span class="keyword">final</span> Entry&lt;K,V&gt; <span class="title function_">getEntry</span><span class="params">(Object key)</span> &#123;</span><br><span class="line">    <span class="type">int</span> <span class="variable">hash</span> <span class="operator">=</span> (key == <span class="literal">null</span>) ? <span class="number">0</span> : hash(key);</span><br><span class="line">    <span class="keyword">for</span> (Entry&lt;K,V&gt; e = table[indexFor(hash, table.length)];</span><br><span class="line">         e != <span class="literal">null</span>;</span><br><span class="line">         e = e.next) &#123;</span><br><span class="line">        Object k;</span><br><span class="line">        <span class="keyword">if</span> (e.hash == hash &amp;&amp;</span><br><span class="line">            ((k = e.key) == key || (key != <span class="literal">null</span> &amp;&amp; key.equals(k))))</span><br><span class="line">            <span class="keyword">return</span> e;</span><br><span class="line">    &#125;</span><br><span class="line">    <span class="keyword">return</span> <span class="literal">null</span>;</span><br><span class="line">&#125;</span><br></pre></td></tr></table></figure><p>It calculates the hash, finds the bucket index, and traverses the list. It returns the <code>Entry</code> if found, or <code>null</code> otherwise.</p><h3 id="5-Fail-Fast-Mechanism"><a href="#5-Fail-Fast-Mechanism" class="headerlink" title="5. Fail-Fast Mechanism"></a>5. Fail-Fast Mechanism</h3><figure class="highlight java"><table><tr><td class="gutter"><pre><span class="line">1</span><br><span class="line">2</span><br><span class="line">3</span><br><span class="line">4</span><br><span class="line">5</span><br><span class="line">6</span><br><span class="line">7</span><br><span class="line">8</span><br></pre></td><td class="code"><pre><span class="line"><span class="comment">/**</span></span><br><span class="line"><span class="comment"> * The number of times this HashMap has been structurally modified.</span></span><br><span class="line"><span class="comment"> * Structural modifications are those that change the number of mappings in</span></span><br><span class="line"><span class="comment"> * the HashMap or otherwise modify its internal structure (e.g.,</span></span><br><span class="line"><span class="comment"> * rehash). This field is used to make iterators on Collection-views of</span></span><br><span class="line"><span class="comment"> * the HashMap fail-fast.</span></span><br><span class="line"><span class="comment"> */</span></span><br><span class="line"><span class="keyword">transient</span> <span class="type">int</span> modCount;</span><br></pre></td></tr></table></figure><p><code>java.util.HashMap</code> is not thread-safe. If another thread modifies the map while an iterator is in use, a <code>ConcurrentModificationException</code> will be thrown. This is the <strong>fail-fast strategy</strong>.</p><p>This strategy is implemented using the <code>modCount</code> field, which ensures visibility of modifications across threads. <code>modCount</code> tracks the number of modifications made to the <code>HashMap</code>. During iterator initialization, this value is assigned to the iterator’s <code>expectedModCount</code>.</p><p><strong>Note</strong>: Fail-fast behavior cannot be absolutely guaranteed. In an unsynchronized concurrent modification environment, it’s impossible to provide firm guarantees. Fail-fast iterators attempt to throw <code>ConcurrentModificationException</code> on a best-effort basis. Therefore, code should not rely on this exception for program correctness. Instead, fail-fast behavior should be used only to detect programming errors.</p><h3 id="References"><a href="#References" class="headerlink" title="References"></a>References</h3><ul><li><em>Core Java</em></li><li><em>Java API</em></li></ul><hr><h1 id="About-Me-amp-amp-Blog"><a href="#About-Me-amp-amp-Blog" class="headerlink" title="About Me &amp;&amp; Blog"></a>About Me &amp;&amp; Blog</h1><p>Below are my personal details and links. I look forward to connecting and sharing knowledge with fellow developers!</p><ol><li><a href="https://www.androidperformance.com/en/about/">About Me</a>: Includes my WeChat and WeChat group links.</li><li><a href="https://www.androidperformance.com/en/2019/12/01/BlogMap/">Blog Navigation</a>: A guide to the content on this blog.</li><li><a href="https://www.androidperformance.com/en/2018/05/07/Android-performance-optimization-skills-and-tools/">Curated Android Performance Articles</a>: A collection of must-read performance optimization articles. Self-nominations&#x2F;recommendations are welcome!</li><li><a href="https://www.androidperformance.com/en/2023/12/30/the-performance/">Android Performance Knowledge Planet</a>: Join our community for more insights.</li></ol><blockquote><p><strong>“If you want to go fast, go alone. If you want to go far, go together.”</strong></p></blockquote><p><img src="/en/images/WechatIMG581.webp" alt="WeChat QR Code"></p>]]></content>
    
    
    <summary type="html">&lt;p&gt;Linked lists and arrays allow elements to be arranged in an order of our choice. However, if you want to find a specific element but have forgotten its position, you must visit every element until you find it. This can consume significant time if the collection is large. A data structure that allows for rapidly finding objects is the &lt;strong&gt;hash table&lt;/strong&gt;.&lt;/p&gt;
&lt;p&gt;&lt;code&gt;HashMap&lt;/code&gt; is an implementation of the &lt;code&gt;Map&lt;/code&gt; interface based on a hash table. This implementation provides all optional mapping operations and permits &lt;code&gt;null&lt;/code&gt; values and &lt;code&gt;null&lt;/code&gt; keys. (The &lt;code&gt;HashMap&lt;/code&gt; class is roughly equivalent to &lt;code&gt;Hashtable&lt;/code&gt;, except that it is unsynchronized and permits nulls.) This class makes no guarantees as to the order of the map; in particular, it does not guarantee that the order will remain constant over time.&lt;/p&gt;</summary>


    <category term="Java" scheme="https://androidperformance.com/en/categories/Java/"/>
    
    
    <category term="Android" scheme="https://androidperformance.com/en/tags/Android/"/>
    
    <category term="Java" scheme="https://androidperformance.com/en/tags/Java/"/>
    
    <category term="HashMap" scheme="https://androidperformance.com/en/tags/HashMap/"/>
    
  </entry>
  
  <entry>
    <title>Android Code Memory Optimization Suggestions - OnTrimMemory</title>
    <link href="https://androidperformance.com/en/2015/07/20/Android-Performance-Memory-onTrimMemory/"/>
    <id>https://androidperformance.com/en/2015/07/20/Android-Performance-Memory-onTrimMemory/</id>
    <published>2015-07-20T04:42:10.000Z</published>
    <updated>2026-05-10T23:29:51.059Z</updated>
    
    <content type="html"><![CDATA[<p>Android Memory Optimization Series:</p><ol><li><a href="https://www.androidperformance.com/en/2015/07/20/Android-Performance-Memory-Google/">Android Code Memory Optimization Suggestions - Android (Official)</a></li><li><a href="https://www.androidperformance.com/en/2015/07/20/Android-Performance-Memory-Java/">Android Code Memory Optimization Suggestions - Java (Official)</a></li><li><a href="https://www.androidperformance.com/en/2015/07/20/Android-Performance-Memory-AndroidResource/">Android Code Memory Optimization Suggestions - Android Resources</a></li><li><a href="https://www.androidperformance.com/en/2015/07/20/Android-Performance-Memory-onTrimMemory/">Android Code Memory Optimization Suggestions - OnTrimMemory</a></li></ol><hr><p>The <code>onTrimMemory</code> callback is an API introduced in Android 4.0. It provides hints to developers when system memory is low, allowing them to release resources proactively to avoid being killed by the OS. This ensures the app stays in the background longer and starts faster when the user returns.</p><p>This article uses a Q&amp;A format to explain the usage and effectiveness of the <code>onTrimMemory</code> callback across various scenarios. If you want to build high-performance Android apps with great user experiences, don’t miss this.</p><span id="more"></span><h2 id="0-What-is-the-role-of-the-onTrimMemory-callback"><a href="#0-What-is-the-role-of-the-onTrimMemory-callback" class="headerlink" title="0. What is the role of the onTrimMemory callback?"></a>0. What is the role of the <code>onTrimMemory</code> callback?</h2><p>Introduced in Android 4.0, any class implementing the <code>ComponentCallbacks2</code> interface can override this method. Its primary purpose is to <strong>guide applications in releasing memory under different conditions to avoid being killed, thereby improving user experience.</strong></p><p>The system invokes this function with specific severity levels:</p><ul><li><strong>TRIM_MEMORY_UI_HIDDEN</strong>: Triggered when <strong>all UI components</strong> of the app are hidden (e.g., user pressed Home or Back). You should release UI-heavy resources here.</li></ul><h3 id="While-the-App-is-Running"><a href="#While-the-App-is-Running" class="headerlink" title="While the App is Running:"></a>While the App is Running:</h3><ul><li><strong>TRIM_MEMORY_RUNNING_MODERATE</strong>: Memory is getting low. The app is safe, but the system is starting to clear the LRU cache.</li><li><strong>TRIM_MEMORY_RUNNING_LOW</strong>: Memory is quite low. Release unnecessary resources to maintain both system and app performance.</li><li><strong>TRIM_MEMORY_RUNNING_CRITICAL</strong>: Memory is extreme. Most cached processes are dead. Release every non-essential resource to prevent the system from killing active services or the app itself.</li></ul><h3 id="While-the-App-is-Cached"><a href="#While-the-App-is-Cached" class="headerlink" title="While the App is Cached:"></a>While the App is Cached:</h3><ul><li><strong>TRIM_MEMORY_BACKGROUND</strong>: Your app is at the “newest” end of the LRU list and unlikely to be killed. Release easy-to-rebuild resources to help the system.</li><li><strong>TRIM_MEMORY_MODERATE</strong>: Your app is in the middle of the LRU list and is at risk if pressure continues.</li><li><strong>TRIM_MEMORY_COMPLETE</strong>: Your app is at the “oldest” end of the LRU list and will be among the first to be killed. Release everything possible.</li></ul><h2 id="1-Which-components-can-implement-onTrimMemory"><a href="#1-Which-components-can-implement-onTrimMemory" class="headerlink" title="1. Which components can implement onTrimMemory?"></a>1. Which components can implement <code>onTrimMemory</code>?</h2><ul><li><code>Application.onTrimMemory()</code></li><li><code>Activity.onTrimMemory()</code></li><li><code>Fragment.onTrimMemory()</code></li><li><code>Service.onTrimMemory()</code></li><li><code>ContentProvider.onTrimMemory()</code></li></ul><h2 id="2-What-resources-should-I-release"><a href="#2-What-resources-should-I-release" class="headerlink" title="2. What resources should I release?"></a>2. What resources should I release?</h2><p>Decide during architecture which data must stay in RAM and which is UI-dependent. Common targets:</p><ul><li><strong>Caches</strong>: Image caches, file caches, etc. These are useful while the UI is visible but can be cleared when hidden.</li><li><strong>Dynamically Added Views</strong>: Views that are rarely used or easy to recreate. For example, the Android Launcher releases resources for the widget picker in <code>TRIM_MEMORY_MODERATE</code>.</li></ul><h3 id="2-1-Example-Releasing-Views-Launcher"><a href="#2-1-Example-Releasing-Views-Launcher" class="headerlink" title="2.1 Example: Releasing Views (Launcher)"></a>2.1 Example: Releasing Views (Launcher)</h3><figure class="highlight java"><table><tr><td class="gutter"><pre><span class="line">1</span><br><span class="line">2</span><br><span class="line">3</span><br><span class="line">4</span><br><span class="line">5</span><br><span class="line">6</span><br><span class="line">7</span><br><span class="line">8</span><br><span class="line">9</span><br><span class="line">10</span><br><span class="line">11</span><br><span class="line">12</span><br><span class="line">13</span><br><span class="line">14</span><br></pre></td><td class="code"><pre><span class="line"><span class="comment">// Launcher.java</span></span><br><span class="line"><span class="meta">@Override</span></span><br><span class="line"><span class="keyword">public</span> <span class="keyword">void</span> <span class="title function_">onTrimMemory</span><span class="params">(<span class="type">int</span> level)</span> &#123;</span><br><span class="line">    <span class="built_in">super</span>.onTrimMemory(level);</span><br><span class="line">    <span class="keyword">if</span> (level &gt;= ComponentCallbacks2.TRIM_MEMORY_MODERATE) &#123;</span><br><span class="line">        mAppsCustomizeTabHost.onTrimMemory();</span><br><span class="line">    &#125;</span><br><span class="line">&#125;</span><br><span class="line"></span><br><span class="line"><span class="comment">// AppsCustomizeTabHost.java</span></span><br><span class="line"><span class="keyword">public</span> <span class="keyword">void</span> <span class="title function_">onTrimMemory</span><span class="params">()</span> &#123;</span><br><span class="line">    mContent.setVisibility(GONE);</span><br><span class="line">    mPagedView.clearAllWidgetPages(); <span class="comment">// Clears subviews, triggering bitmap deletion</span></span><br><span class="line">&#125;</span><br></pre></td></tr></table></figure><h3 id="2-2-Example-Clearing-Caches-Contacts"><a href="#2-2-Example-Clearing-Caches-Contacts" class="headerlink" title="2.2 Example: Clearing Caches (Contacts)"></a>2.2 Example: Clearing Caches (Contacts)</h3><figure class="highlight java"><table><tr><td class="gutter"><pre><span class="line">1</span><br><span class="line">2</span><br><span class="line">3</span><br><span class="line">4</span><br><span class="line">5</span><br><span class="line">6</span><br></pre></td><td class="code"><pre><span class="line"><span class="meta">@Override</span></span><br><span class="line"><span class="keyword">public</span> <span class="keyword">void</span> <span class="title function_">onTrimMemory</span><span class="params">(<span class="type">int</span> level)</span> &#123;</span><br><span class="line">    <span class="keyword">if</span> (level &gt;= ComponentCallbacks2.TRIM_MEMORY_MODERATE) &#123;</span><br><span class="line">        clear(); <span class="comment">// Clears bitmap caches and pending requests</span></span><br><span class="line">    &#125;</span><br><span class="line">&#125;</span><br></pre></td></tr></table></figure><h2 id="3-onTrimMemory-vs-onStop"><a href="#3-onTrimMemory-vs-onStop" class="headerlink" title="3. onTrimMemory vs. onStop"></a>3. <code>onTrimMemory</code> vs. <code>onStop</code></h2><p><code>TRIM_MEMORY_UI_HIDDEN</code> triggers only when <strong>all</strong> UI components are hidden. <code>onStop()</code> triggers whenever a single <code>Activity</code> is no longer visible (e.g., navigating to another Activity in the same app).</p><p><strong>Best Practice</strong>: Use <code>onStop()</code> to release Activity-specific resources (network, receivers), but wait for <code>TRIM_MEMORY_UI_HIDDEN</code> to release shared UI assets. This prevents heavy reloading when navigating internal screens. Note that <code>TRIM_MEMORY_UI_HIDDEN</code> is called <strong>before</strong> <code>onStop()</code>.</p><h2 id="4-onTrimMemory-vs-onLowMemory"><a href="#4-onTrimMemory-vs-onLowMemory" class="headerlink" title="4. onTrimMemory vs. onLowMemory"></a>4. <code>onTrimMemory</code> vs. <code>onLowMemory</code></h2><p><code>onLowMemory</code> is the older API. It’s roughly equivalent to <code>TRIM_MEMORY_COMPLETE</code>. Use it for API &lt; 14 compatibility; otherwise, use <code>onTrimMemory</code>.</p><h2 id="5-Why-bother"><a href="#5-Why-bother" class="headerlink" title="5. Why bother?"></a>5. Why bother?</h2><p>Even though the system kills processes based on the LRU list, it also targets high-memory consumers first to reclaim space quickly. Keeping your memory usage low increases the chance of a “Hot Start” (2-3x faster than a cold start), drastically improving the user’s perception of speed.</p><h2 id="6-Typical-Use-Cases"><a href="#6-Typical-Use-Cases" class="headerlink" title="6. Typical Use Cases"></a>6. Typical Use Cases</h2><ul><li><strong>Always-on Apps</strong>: Launcher, Security Center, Phone. These should release widget previews, image caches, and fragments upon exit.</li><li><strong>Apps with Background Services</strong>: Music players, Downloaders. When the UI is hidden but the service continues, release all UI resources and caches immediately.</li></ul><h1 id="About-Me-amp-amp-Blog"><a href="#About-Me-amp-amp-Blog" class="headerlink" title="About Me &amp;&amp; Blog"></a>About Me &amp;&amp; Blog</h1><p>(Links and introduction)</p>]]></content>
    
    
    <summary type="html">&lt;p&gt;Android Memory Optimization Series:&lt;/p&gt;
&lt;ol&gt;
&lt;li&gt;&lt;a href=&quot;https://www.androidperformance.com/en/2015/07/20/Android-Performance-Memory-Google/&quot;&gt;Android Code Memory Optimization Suggestions - Android (Official)&lt;/a&gt;&lt;/li&gt;
&lt;li&gt;&lt;a href=&quot;https://www.androidperformance.com/en/2015/07/20/Android-Performance-Memory-Java/&quot;&gt;Android Code Memory Optimization Suggestions - Java (Official)&lt;/a&gt;&lt;/li&gt;
&lt;li&gt;&lt;a href=&quot;https://www.androidperformance.com/en/2015/07/20/Android-Performance-Memory-AndroidResource/&quot;&gt;Android Code Memory Optimization Suggestions - Android Resources&lt;/a&gt;&lt;/li&gt;
&lt;li&gt;&lt;a href=&quot;https://www.androidperformance.com/en/2015/07/20/Android-Performance-Memory-onTrimMemory/&quot;&gt;Android Code Memory Optimization Suggestions - OnTrimMemory&lt;/a&gt;&lt;/li&gt;
&lt;/ol&gt;
&lt;hr&gt;
&lt;p&gt;The &lt;code&gt;onTrimMemory&lt;/code&gt; callback is an API introduced in Android 4.0. It provides hints to developers when system memory is low, allowing them to release resources proactively to avoid being killed by the OS. This ensures the app stays in the background longer and starts faster when the user returns.&lt;/p&gt;
&lt;p&gt;This article uses a Q&amp;amp;A format to explain the usage and effectiveness of the &lt;code&gt;onTrimMemory&lt;/code&gt; callback across various scenarios. If you want to build high-performance Android apps with great user experiences, don’t miss this.&lt;/p&gt;</summary>


    <category term="Android" scheme="https://androidperformance.com/en/categories/Android/"/>
    
    
    <category term="Android" scheme="https://androidperformance.com/en/tags/Android/"/>
    
    <category term="Startup" scheme="https://androidperformance.com/en/tags/Startup/"/>
    
    <category term="Memory" scheme="https://androidperformance.com/en/tags/Memory/"/>
    
    <category term="Performance" scheme="https://androidperformance.com/en/tags/Performance/"/>
    
    <category term="Java" scheme="https://androidperformance.com/en/tags/Java/"/>
    
  </entry>
  
  <entry>
    <title>Android Code Memory Optimization Suggestions - Android Resources</title>
    <link href="https://androidperformance.com/en/2015/07/20/Android-Performance-Memory-AndroidResource/"/>
    <id>https://androidperformance.com/en/2015/07/20/Android-Performance-Memory-AndroidResource/</id>
    <published>2015-07-20T03:48:30.000Z</published>
    <updated>2026-05-10T23:29:51.058Z</updated>
    
    <content type="html"><![CDATA[<p>Android Memory Optimization Series:</p><ol><li><a href="https://www.androidperformance.com/en/2015/07/20/Android-Performance-Memory-Google/">Android Code Memory Optimization Suggestions - Android (Official)</a></li><li><a href="https://www.androidperformance.com/en/2015/07/20/Android-Performance-Memory-Java/">Android Code Memory Optimization Suggestions - Java (Official)</a></li><li><a href="https://www.androidperformance.com/en/2015/07/20/Android-Performance-Memory-AndroidResource/">Android Code Memory Optimization Suggestions - Android Resources</a></li><li><a href="https://www.androidperformance.com/en/2015/07/20/Android-Performance-Memory-onTrimMemory/">Android Code Memory Optimization Suggestions - OnTrimMemory</a></li></ol><hr><p>This article focuses on common memory leak scenarios in Android application development. Having a baseline understanding of memory management before writing code leads to much more robust applications. This post starts with resource usage in Android and covers optimizations for Bitmaps, database queries, Nine-Patch assets, overdraw, and more.</p><span id="more"></span><h1 id="Android-Resource-Optimization"><a href="#Android-Resource-Optimization" class="headerlink" title="Android Resource Optimization"></a>Android Resource Optimization</h1><h2 id="1-Bitmap-Optimization"><a href="#1-Bitmap-Optimization" class="headerlink" title="1. Bitmap Optimization"></a>1. Bitmap Optimization</h2><p>Most memory issues in Android trace back to Bitmaps. If you inspect a heap dump with MAT (Memory Analyzer Tool), the largest memory consumers are almost always <code>byte[]</code> arrays representing Bitmaps. Google has a dedicated series on this: <a href="http://developer.android.com/training/displaying-bitmaps/index.html">Displaying Bitmaps Efficiently</a>. Before optimizing, ensure you are following these best practices.</p><p>A Bitmap usually stays in memory for two reasons:</p><ul><li>The developer didn’t explicitly release it after use.</li><li>The Bitmap is still being referenced, preventing garbage collection.</li></ul><h3 id="1-1-Manually-Releasing-Bitmap-Resources"><a href="#1-1-Manually-Releasing-Bitmap-Resources" class="headerlink" title="1.1 Manually Releasing Bitmap Resources"></a>1.1 Manually Releasing Bitmap Resources</h3><p>Once you are certain a Bitmap is no longer needed, call <code>recycle()</code> to release its native memory. While keeping it might speed up future resumes, its large footprint might cause your app to be killed in the background, which is counterproductive.</p><figure class="highlight java"><table><tr><td class="gutter"><pre><span class="line">1</span><br><span class="line">2</span><br><span class="line">3</span><br><span class="line">4</span><br></pre></td><td class="code"><pre><span class="line"><span class="keyword">if</span>(bitmap != <span class="literal">null</span> &amp;&amp; !bitmap.isRecycled())&#123;</span><br><span class="line">    bitmap.recycle();</span><br><span class="line">    bitmap = <span class="literal">null</span>;</span><br><span class="line">&#125;</span><br></pre></td></tr></table></figure><p>From <code>Bitmap.java</code>: <code>recycle()</code> marks the bitmap as “dead,” clearing references to pixel data. While GC will eventually reclaim this, manual recycling is safer because GC is non-deterministic and can cause lag if it has to reclaim many large objects at once.</p><h3 id="1-2-Releasing-ImageView-Images"><a href="#1-2-Releasing-ImageView-Images" class="headerlink" title="1.2 Releasing ImageView Images"></a>1.2 Releasing ImageView Images</h3><p>If you set images via XML (<code>src</code>) or methods like <code>setImageResource</code>, you can use the following to manually clear the resource:</p><figure class="highlight java"><table><tr><td class="gutter"><pre><span class="line">1</span><br><span class="line">2</span><br><span class="line">3</span><br><span class="line">4</span><br><span class="line">5</span><br><span class="line">6</span><br><span class="line">7</span><br><span class="line">8</span><br><span class="line">9</span><br><span class="line">10</span><br><span class="line">11</span><br><span class="line">12</span><br><span class="line">13</span><br><span class="line">14</span><br><span class="line">15</span><br><span class="line">16</span><br><span class="line">17</span><br><span class="line">18</span><br><span class="line">19</span><br><span class="line">20</span><br><span class="line">21</span><br></pre></td><td class="code"><pre><span class="line"><span class="keyword">private</span> <span class="keyword">static</span> <span class="keyword">void</span> <span class="title function_">recycleImageViewBitMap</span><span class="params">(ImageView imageView)</span> &#123;</span><br><span class="line">    <span class="keyword">if</span> (imageView != <span class="literal">null</span>) &#123;</span><br><span class="line">        <span class="type">BitmapDrawable</span> <span class="variable">bd</span> <span class="operator">=</span> (BitmapDrawable) imageView.getDrawable();</span><br><span class="line">        rceycleBitmapDrawable(bd);</span><br><span class="line">    &#125;</span><br><span class="line">&#125;</span><br><span class="line"></span><br><span class="line"><span class="keyword">private</span> <span class="keyword">static</span> <span class="keyword">void</span> <span class="title function_">rceycleBitmapDrawable</span><span class="params">(BitmapDrawable bitmapDrawable)</span> &#123;</span><br><span class="line">    <span class="keyword">if</span> (bitmapDrawable != <span class="literal">null</span>) &#123;</span><br><span class="line">        <span class="type">Bitmap</span> <span class="variable">bitmap</span> <span class="operator">=</span> bitmapDrawable.getBitmap();</span><br><span class="line">        rceycleBitmap(bitmap);</span><br><span class="line">    &#125;</span><br><span class="line">    bitmapDrawable = <span class="literal">null</span>;</span><br><span class="line">&#125;</span><br><span class="line"></span><br><span class="line"><span class="keyword">private</span> <span class="keyword">static</span> <span class="keyword">void</span> <span class="title function_">rceycleBitmap</span><span class="params">(Bitmap bitmap)</span> &#123;</span><br><span class="line">    <span class="keyword">if</span> (bitmap != <span class="literal">null</span> &amp;&amp; !bitmap.isRecycled()) &#123;</span><br><span class="line">        bitmap.recycle();</span><br><span class="line">        bitmap = <span class="literal">null</span>;</span><br><span class="line">    &#125;</span><br><span class="line">&#125;</span><br></pre></td></tr></table></figure><h3 id="1-3-Releasing-ImageView-Backgrounds"><a href="#1-3-Releasing-ImageView-Backgrounds" class="headerlink" title="1.3 Releasing ImageView Backgrounds"></a>1.3 Releasing ImageView Backgrounds</h3><p>If your ImageView has a background:</p><figure class="highlight java"><table><tr><td class="gutter"><pre><span class="line">1</span><br><span class="line">2</span><br><span class="line">3</span><br><span class="line">4</span><br><span class="line">5</span><br><span class="line">6</span><br></pre></td><td class="code"><pre><span class="line"><span class="keyword">public</span> <span class="keyword">static</span> <span class="keyword">void</span> <span class="title function_">recycleBackgroundBitMap</span><span class="params">(ImageView view)</span> &#123;</span><br><span class="line">    <span class="keyword">if</span> (view != <span class="literal">null</span>) &#123;</span><br><span class="line">        <span class="type">BitmapDrawable</span> <span class="variable">bd</span> <span class="operator">=</span> (BitmapDrawable) view.getBackground();</span><br><span class="line">        rceycleBitmapDrawable(bd);</span><br><span class="line">    &#125;</span><br><span class="line">&#125;</span><br></pre></td></tr></table></figure><h3 id="1-4-Prefer-Nine-Patch-Over-Standard-PNGs"><a href="#1-4-Prefer-Nine-Patch-Over-Standard-PNGs" class="headerlink" title="1.4 Prefer Nine-Patch Over Standard PNGs"></a>1.4 Prefer Nine-Patch Over Standard PNGs</h3><p>As screen resolutions increase, so does the memory cost of loading images. Avoid using large, static PNGs for backgrounds; use Nine-Patch (<code>.9.webp</code>) assets instead. These are small PNGs with defined stretchable areas, allowing them to scale without distortion and adapt to multiple screen sizes. Android Studio includes a built-in tool to convert PNGs to Nine-Patch assets.</p><p><img src="/en/images/Memory_AndroidSoruce/1.webp" alt="Original vs Stretched Nine-Patch"></p><h3 id="1-5-Compress-Large-Images-Before-Loading"><a href="#1-5-Compress-Large-Images-Before-Loading" class="headerlink" title="1.5 Compress Large Images Before Loading"></a>1.5 Compress Large Images Before Loading</h3><p>Often, the source image (e.g., from a camera) has a much higher resolution than the screen. Loading a full-res image into a small <code>ImageView</code> wastes memory and causes jank during scrolling.</p><p>Google recommends two key techniques:</p><ul><li>Decode the dimensions (<code>inJustDecodeBounds</code>) before loading.</li><li>Load a scaled-down version (<code>inSampleSize</code>) that matches your UI size.</li></ul><p>Reference: <a href="http://developer.android.com/training/displaying-bitmaps/load-bitmap.html#read-bitmap">Loading Large Bitmaps Efficiently</a>.</p><h2 id="2-Unclosed-Database-Cursors"><a href="#2-Unclosed-Database-Cursors" class="headerlink" title="2. Unclosed Database Cursors"></a>2. Unclosed Database Cursors</h2><p>Failing to close a <code>Cursor</code> after a query is a common error. While small result sets might not cause immediate issues, cumulative unclosed cursors will lead to leaks and instability over time.</p><p><strong>Incorrect:</strong></p><figure class="highlight java"><table><tr><td class="gutter"><pre><span class="line">1</span><br><span class="line">2</span><br></pre></td><td class="code"><pre><span class="line"><span class="type">Cursor</span> <span class="variable">cursor</span> <span class="operator">=</span> getContentResolver().query(uri ...);</span><br><span class="line"><span class="keyword">if</span> (cursor.moveToNext()) &#123; ... &#125;</span><br></pre></td></tr></table></figure><p><strong>Correct:</strong></p><figure class="highlight java"><table><tr><td class="gutter"><pre><span class="line">1</span><br><span class="line">2</span><br><span class="line">3</span><br><span class="line">4</span><br><span class="line">5</span><br><span class="line">6</span><br><span class="line">7</span><br><span class="line">8</span><br><span class="line">9</span><br></pre></td><td class="code"><pre><span class="line"><span class="type">Cursor</span> <span class="variable">cursor</span> <span class="operator">=</span> <span class="literal">null</span>;</span><br><span class="line"><span class="keyword">try</span> &#123;</span><br><span class="line">    cursor = getContentResolver().query(uri ...);</span><br><span class="line">    <span class="keyword">if</span> (cursor != <span class="literal">null</span> &amp;&amp; cursor.moveToNext()) &#123; ... &#125;</span><br><span class="line">&#125; <span class="keyword">finally</span> &#123;</span><br><span class="line">    <span class="keyword">if</span> (cursor != <span class="literal">null</span>) &#123;</span><br><span class="line">        <span class="keyword">try</span> &#123; cursor.close(); &#125; <span class="keyword">catch</span> (Exception e) &#123; <span class="comment">/* ignore */</span> &#125;</span><br><span class="line">    &#125;</span><br><span class="line">&#125;</span><br></pre></td></tr></table></figure><h2 id="3-Not-Recycling-convertView-in-Adapters"><a href="#3-Not-Recycling-convertView-in-Adapters" class="headerlink" title="3. Not Recycling convertView in Adapters"></a>3. Not Recycling <code>convertView</code> in Adapters</h2><p>In <code>BaseAdapter.getView(int position, View convertView, ViewGroup parent)</code>, the <code>convertView</code> parameter allows you to reuse view objects that have scrolled off-screen. If you instantiate a new View every time instead of checking if <code>convertView</code> is null, you waste resources and cause meaningful memory inflation.</p><p><img src="/en/images/Memory_AndroidSoruce/2.webp" alt="ListView Reuse Mechanism"></p><p><strong>Incorrect:</strong></p><figure class="highlight java"><table><tr><td class="gutter"><pre><span class="line">1</span><br><span class="line">2</span><br><span class="line">3</span><br></pre></td><td class="code"><pre><span class="line"><span class="keyword">public</span> View <span class="title function_">getView</span><span class="params">(<span class="type">int</span> position, View convertView, ViewGroup parent)</span> &#123;</span><br><span class="line">    <span class="keyword">return</span> <span class="keyword">new</span> <span class="title class_">Xxx</span>(...);</span><br><span class="line">&#125;</span><br></pre></td></tr></table></figure><p><strong>Correct:</strong></p><figure class="highlight java"><table><tr><td class="gutter"><pre><span class="line">1</span><br><span class="line">2</span><br><span class="line">3</span><br><span class="line">4</span><br><span class="line">5</span><br></pre></td><td class="code"><pre><span class="line"><span class="keyword">public</span> View <span class="title function_">getView</span><span class="params">(<span class="type">int</span> position, View convertView, ViewGroup parent)</span> &#123;</span><br><span class="line">    <span class="type">View</span> <span class="variable">view</span> <span class="operator">=</span> (convertView != <span class="literal">null</span>) ? convertView : <span class="keyword">new</span> <span class="title class_">Xxx</span>(...);</span><br><span class="line">    populate(view, getItem(position));</span><br><span class="line">    <span class="keyword">return</span> view;</span><br><span class="line">&#125;</span><br></pre></td></tr></table></figure><h2 id="4-Releasing-Object-References"><a href="#4-Releasing-Object-References" class="headerlink" title="4. Releasing Object References"></a>4. Releasing Object References</h2><p>Objects are not collected as long as they are reachable from a GC Root.</p><p><strong>Scenario A: Handlers and Runnables</strong><br>If a <code>MainActivity</code> has a member variable <code>obj</code> used inside a <code>Runnable</code> posted to a <code>Handler</code>, <code>obj</code> will stay in memory as long as <code>MainActivity</code> exists, even if the thread is done. Explicitly nulling the reference helps:</p><figure class="highlight java"><table><tr><td class="gutter"><pre><span class="line">1</span><br><span class="line">2</span><br><span class="line">3</span><br><span class="line">4</span><br><span class="line">5</span><br></pre></td><td class="code"><pre><span class="line"><span class="keyword">final</span> <span class="type">Object</span> <span class="variable">o</span> <span class="operator">=</span> obj;</span><br><span class="line">obj = <span class="literal">null</span>;</span><br><span class="line">mHandler.post(<span class="keyword">new</span> <span class="title class_">Runnable</span>() &#123;</span><br><span class="line">    <span class="keyword">public</span> <span class="keyword">void</span> <span class="title function_">run</span><span class="params">()</span> &#123; useObj(o); &#125;</span><br><span class="line">&#125;);</span><br></pre></td></tr></table></figure><p><strong>Scenario B: Listeners and Subscriptions</strong><br>If a short-lived Activity (like a LockScreen) registers a listener (like <code>PhoneStateListener</code>) with a long-lived System Service (<code>TelephonyManager</code>), forgetting to unregister the listener in <code>onDestroy</code> will leak the entire Activity.</p><h2 id="5-Releasing-Resources-in-Lifecycle-Callbacks"><a href="#5-Releasing-Resources-in-Lifecycle-Callbacks" class="headerlink" title="5. Releasing Resources in Lifecycle Callbacks"></a>5. Releasing Resources in Lifecycle Callbacks</h2><p>Most resource cleanup should happen in <code>onPause()</code>, <code>onStop()</code>, or <code>onDestroy()</code>. Check the official Activity lifecycle documentation to determine exactly when to release which resources (e.g., stopping animations, closing camera connections, or unregistering receivers).</p><h2 id="6-Eliminating-Overdraw"><a href="#6-Eliminating-Overdraw" class="headerlink" title="6. Eliminating Overdraw"></a>6. Eliminating Overdraw</h2><p>Overdraw happens when you paint a pixel multiple times in a single frame. For example, a <code>TextView</code> with a background paints the background pixel first, then the text pixel over it. Excessive overdraw strains the GPU’s memory bandwidth and impacts performance. Minimize overdraw by removing redundant backgrounds from parent layouts.</p><h2 id="7-Using-System-Resources"><a href="#7-Using-System-Resources" class="headerlink" title="7. Using System Resources"></a>7. Using System Resources</h2><p>Android provides many built-in strings, drawables, and layouts. Using <code>@android:id/list</code> or <code>@android:color/white</code> instead of duplicating them in your project reduces APK size and RAM usage.</p><h2 id="8-Using-Memory-Profiling-Tools"><a href="#8-Using-Memory-Profiling-Tools" class="headerlink" title="8. Using Memory Profiling Tools"></a>8. Using Memory Profiling Tools</h2><p>You can’t guarantee a perfect application on the first attempt. Make memory checks (using tools like Lint, MAT, or Memory Profiler) part of every development phase.</p><h1 id="About-Me-amp-amp-Blog"><a href="#About-Me-amp-amp-Blog" class="headerlink" title="About Me &amp;&amp; Blog"></a>About Me &amp;&amp; Blog</h1><p>(Links and introduction)</p>]]></content>
    
    
    <summary type="html">&lt;p&gt;Android Memory Optimization Series:&lt;/p&gt;
&lt;ol&gt;
&lt;li&gt;&lt;a href=&quot;https://www.androidperformance.com/en/2015/07/20/Android-Performance-Memory-Google/&quot;&gt;Android Code Memory Optimization Suggestions - Android (Official)&lt;/a&gt;&lt;/li&gt;
&lt;li&gt;&lt;a href=&quot;https://www.androidperformance.com/en/2015/07/20/Android-Performance-Memory-Java/&quot;&gt;Android Code Memory Optimization Suggestions - Java (Official)&lt;/a&gt;&lt;/li&gt;
&lt;li&gt;&lt;a href=&quot;https://www.androidperformance.com/en/2015/07/20/Android-Performance-Memory-AndroidResource/&quot;&gt;Android Code Memory Optimization Suggestions - Android Resources&lt;/a&gt;&lt;/li&gt;
&lt;li&gt;&lt;a href=&quot;https://www.androidperformance.com/en/2015/07/20/Android-Performance-Memory-onTrimMemory/&quot;&gt;Android Code Memory Optimization Suggestions - OnTrimMemory&lt;/a&gt;&lt;/li&gt;
&lt;/ol&gt;
&lt;hr&gt;
&lt;p&gt;This article focuses on common memory leak scenarios in Android application development. Having a baseline understanding of memory management before writing code leads to much more robust applications. This post starts with resource usage in Android and covers optimizations for Bitmaps, database queries, Nine-Patch assets, overdraw, and more.&lt;/p&gt;</summary>


    <category term="Android" scheme="https://androidperformance.com/en/categories/Android/"/>
    
    
    <category term="Android" scheme="https://androidperformance.com/en/tags/Android/"/>
    
    <category term="Startup" scheme="https://androidperformance.com/en/tags/Startup/"/>
    
    <category term="Jank" scheme="https://androidperformance.com/en/tags/Jank/"/>
    
    <category term="Memory" scheme="https://androidperformance.com/en/tags/Memory/"/>
    
    <category term="Performance" scheme="https://androidperformance.com/en/tags/Performance/"/>
    
  </entry>
  
  <entry>
    <title>Android Code Memory Optimization Suggestions - Android (Official)</title>
    <link href="https://androidperformance.com/en/2015/07/20/Android-Performance-Memory-Google/"/>
    <id>https://androidperformance.com/en/2015/07/20/Android-Performance-Memory-Google/</id>
    <published>2015-07-20T03:29:32.000Z</published>
    <updated>2026-05-10T23:29:51.058Z</updated>
    
    <content type="html"><![CDATA[<p>Android Memory Optimization Series:</p><ol><li><a href="https://www.androidperformance.com/en/2015/07/20/Android-Performance-Memory-Google/">Android Code Memory Optimization Suggestions - Android (Official)</a></li><li><a href="https://www.androidperformance.com/en/2015/07/20/Android-Performance-Memory-Java/">Android Code Memory Optimization Suggestions - Java (Official)</a></li><li><a href="https://www.androidperformance.com/en/2015/07/20/Android-Performance-Memory-AndroidResource/">Android Code Memory Optimization Suggestions - Android Resources</a></li><li><a href="https://www.androidperformance.com/en/2015/07/20/Android-Performance-Memory-onTrimMemory/">Android Code Memory Optimization Suggestions - OnTrimMemory</a></li></ol><hr><p>To ensure the Garbage Collector (GC) can properly release memory, it’s crucial to avoid memory leaks (often caused by global or static member variables holding object references) and to release references when they are no longer needed. For most apps, the GC handles the rest: if an object is no longer reachable, its memory is reclaimed.</p><p>High-performance software requires proactive memory management throughout the development lifecycle. Android provides several specific guidelines and techniques to help developers achieve excellent memory performance.</p><span id="more"></span><h2 id="Introduction"><a href="#Introduction" class="headerlink" title="Introduction"></a>Introduction</h2><p>This content is derived from the <a href="http://developer.android.com/training/articles/memory.html">Managing Your App’s Memory</a> section of the official Android developer documentation, specifically <a href="http://developer.android.com/training/articles/memory.html#YourApp">How Your App Should Manage Memory</a>. As an Android developer, you must consider memory at every stage of coding.</p><h3 id="1-Use-Services-Sparingly"><a href="#1-Use-Services-Sparingly" class="headerlink" title="1. Use Services Sparingly"></a>1. Use Services Sparingly</h3><p>If your app needs a Service for background tasks, ensure it only runs while the task is active. Be cautious about Service stop failures, as they lead to memory leaks.</p><p>When a Service starts, the system tends to keep its parent process in memory, making that process very “expensive.” This reduces the number of other processes the system can cache in the LRU (Least Recently Used) list, degrading overall system performance and potentially causing crashes under high memory pressure.</p><p>To manage Service lifecycles effectively, Android recommends using <a href="http://developer.android.com/reference/android/app/IntentService.html"><strong>IntentService</strong></a>. It automatically stops once its background task is finished, significantly reducing the risk of memory leaks.</p><p>Keeping a Service running when it’s idle is a major performance “anti-pattern.” Not only does it slow down the device, but it also increases the likelihood of users uninstalling your app once they notice its resource consumption.</p><h3 id="2-Release-Memory-When-UI-is-Hidden"><a href="#2-Release-Memory-When-UI-is-Hidden" class="headerlink" title="2. Release Memory When UI is Hidden"></a>2. Release Memory When UI is Hidden</h3><p>When a user switches to another app and your UI is no longer visible, you should release all UI-bound resources. This increases the system’s capacity to cache background processes, improving the overall user experience.</p><p>To detect when your UI is hidden, override the <code>onTrimMemory()</code> method in your <code>Activity</code> and listen for the <code>TRIM_MEMORY_UI_HIDDEN</code> level:</p><figure class="highlight java"><table><tr><td class="gutter"><pre><span class="line">1</span><br><span class="line">2</span><br><span class="line">3</span><br><span class="line">4</span><br><span class="line">5</span><br><span class="line">6</span><br><span class="line">7</span><br><span class="line">8</span><br><span class="line">9</span><br></pre></td><td class="code"><pre><span class="line"><span class="meta">@Override</span></span><br><span class="line"><span class="keyword">public</span> <span class="keyword">void</span> <span class="title function_">onTrimMemory</span><span class="params">(<span class="type">int</span> level)</span> &#123;</span><br><span class="line">    <span class="built_in">super</span>.onTrimMemory(level);</span><br><span class="line">    <span class="keyword">switch</span> (level) &#123;</span><br><span class="line">        <span class="keyword">case</span> TRIM_MEMORY_UI_HIDDEN:</span><br><span class="line">            <span class="comment">// Release UI resources here</span></span><br><span class="line">            <span class="keyword">break</span>;</span><br><span class="line">    &#125;</span><br><span class="line">&#125;</span><br></pre></td></tr></table></figure><p>Note that <code>TRIM_MEMORY_UI_HIDDEN</code> is triggered only when <strong>all</strong> UI components of your app are hidden. This differs from <code>onStop()</code>, which is called when a single <code>Activity</code> is no longer visible (e.g., when the user navigates to another Activity within your app). Use <code>onStop()</code> to release Activity-specific resources (like network connections or receivers), but wait for <code>TRIM_MEMORY_UI_HIDDEN</code> to release global UI resources to avoid unnecessary reloading when navigating within the app.</p><h3 id="3-Release-Memory-During-Pressure"><a href="#3-Release-Memory-During-Pressure" class="headerlink" title="3. Release Memory During Pressure"></a>3. Release Memory During Pressure</h3><p>The <code>onTrimMemory()</code> method provides several callbacks during various stages of memory pressure. You should adjust your resource release strategy based on these levels:</p><h4 id="3-1-While-the-App-is-Running"><a href="#3-1-While-the-App-is-Running" class="headerlink" title="3.1 While the App is Running"></a>3.1 While the App is Running</h4><ul><li><strong>TRIM_MEMORY_RUNNING_MODERATE</strong>: The device is beginning to run low on memory. Your app is running and won’t be killed, but the system is starting to clear LRU cache processes.</li><li><strong>TRIM_MEMORY_RUNNING_LOW</strong>: Memory is quite low. Release unnecessary resources to improve both system and app performance.</li><li><strong>TRIM_MEMORY_RUNNING_CRITICAL</strong>: Memory is extremely low. The system has already killed most cached processes. You must release all non-essential resources to prevent the system from killing active services or your app.</li></ul><h4 id="3-2-While-the-App-is-Cached"><a href="#3-2-While-the-App-is-Cached" class="headerlink" title="3.2 While the App is Cached"></a>3.2 While the App is Cached</h4><ul><li><strong>TRIM_MEMORY_BACKGROUND</strong>: Memory is low, and your app is in the LRU cache. It’s safe but should release easy-to-rebuild resources to help the system and stay in the cache longer.</li><li><strong>TRIM_MEMORY_MODERATE</strong>: Memory is very low, and your app is in the middle of the LRU list. It’s at risk of being killed.</li><li><strong>TRIM_MEMORY_COMPLETE</strong>: Memory is critical, and your app is at the end of the LRU list. It will be among the first to be killed. Release everything possible.</li></ul><p>For API levels below 14, use <a href="http://developer.android.com/reference/android/content/ComponentCallbacks.html#onLowMemory()">onLowMemory()</a>, which is roughly equivalent to <code>TRIM_MEMORY_COMPLETE</code>.</p><blockquote><p><strong>Note</strong>: While the system usually kills processes from the bottom of the LRU list up, it may target large-memory processes first to reclaim space quickly. Keeping your memory footprint small helps you stay in the cache longer.</p></blockquote><h3 id="4-Check-Your-Memory-Limits"><a href="#4-Check-Your-Memory-Limits" class="headerlink" title="4. Check Your Memory Limits"></a>4. Check Your Memory Limits</h3><p>Different Android devices have different RAM capacities and heap limits. Use <a href="http://developer.android.com/reference/android/app/ActivityManager.html#getMemoryClass()">getMemoryClass()</a> to find your app’s available heap size. Exceeding this triggers an <code>OutOfMemoryError</code>.</p><p>In special cases, you can request a larger heap by setting <code>largeHeap=true</code> in your manifest’s <code>&lt;application&gt;</code> tag. Check the resulting size with <a href="http://developer.android.com/reference/android/app/ActivityManager.html#getLargeMemoryClass()">getLargeMemoryClass()</a>.</p><p><strong>Do not use <code>largeHeap</code> just because you’ve run out of memory.</strong> It is intended for apps that inherently require a huge footprint (e.g., high-res photo editors). A larger heap increases GC duration and negatively impacts system performance during task switching. Also, on some devices, the “large” heap is no different from the standard heap.</p><h3 id="5-Avoid-Bitmap-Waste"><a href="#5-Avoid-Bitmap-Waste" class="headerlink" title="5. Avoid Bitmap Waste"></a>5. Avoid Bitmap Waste</h3><p>Never load a Bitmap at a resolution higher than needed for its display container. A high-res image in a small <code>ImageView</code> provides no visual benefit but wastes significant RAM. Remember: the memory footprint of a Bitmap is calculated by pixels, not the file size on disk. An <code>ARGB_8888</code> image of 1500x1000 pixels uses 1500 * 1000 * 4 bytes &#x3D; <strong>5.7MB</strong>, regardless of whether the JPG file is only 100KB.</p><h3 id="6-Use-Optimized-Data-Collections"><a href="#6-Use-Optimized-Data-Collections" class="headerlink" title="6. Use Optimized Data Collections"></a>6. Use Optimized Data Collections</h3><p>Use Android-specific containers like <a href="http://developer.android.com/reference/android/util/SparseArray.html">SparseArray</a>, <a href="http://developer.android.com/reference/android/util/SparseBooleanArray.html">SparseBooleanArray</a>, and <a href="http://developer.android.com/reference/android/support/v4/util/LongSparseArray.html">LongSparseArray</a>. <code>HashMap</code> is more memory-intensive as it requires an extra entry object for every mapping. <code>SparseArray</code> avoids auto-boxing of keys and values, saving further resources.</p><h3 id="7-Be-Aware-of-Memory-Overheads"><a href="#7-Be-Aware-of-Memory-Overheads" class="headerlink" title="7. Be Aware of Memory Overheads"></a>7. Be Aware of Memory Overheads</h3><p>Different coding styles have different memory costs:</p><ul><li><strong>Enums</strong>: Can consume more than 2x the memory of static constants. Avoid them in memory-sensitive Android code.</li><li><strong>Classes</strong>: Every Java class (including inner&#x2F;anonymous) takes roughly 500 bytes.</li><li><strong>Instances</strong>: Every instance costs 12-16 bytes of overhead.</li><li><strong>HashMaps</strong>: Using a primitive key like an <code>int</code> still incurs the overhead of an object wrap (roughly 32 bytes vs. 4 bytes). Use specialized collections instead.</li></ul><h3 id="8-Be-Careful-with-Abstractions"><a href="#8-Be-Careful-with-Abstractions" class="headerlink" title="8. Be Careful with Abstractions"></a>8. Be Careful with Abstractions</h3><p>While abstraction is good for OOP design and maintainability, it carries a memory cost on Android due to extra code mapping and reduced execution efficiency. Use abstraction judiciously—only when the architectural benefits outweigh the overhead.</p><h3 id="9-Use-Nano-ProtoBufs-for-Serialized-Data"><a href="#9-Use-Nano-ProtoBufs-for-Serialized-Data" class="headerlink" title="9. Use Nano ProtoBufs for Serialized Data"></a>9. Use Nano ProtoBufs for Serialized Data</h3><p><a href="https://developers.google.com/protocol-buffers/docs/overview">Protocol Buffers</a> are lightweight and language-agnostic. For Android clients, always use the <strong>nano</strong> version to minimize generated code, RAM usage, and APK size, and to avoid hitting DEX method limits.</p><h3 id="10-Avoid-Dependency-Injection-Frameworks"><a href="#10-Avoid-Dependency-Injection-Frameworks" class="headerlink" title="10. Avoid Dependency Injection Frameworks"></a>10. Avoid Dependency Injection Frameworks</h3><p>Frameworks like Guice or RoboGuice can simplify code with annotations like <code>@InjectView</code>, but they often involve long initialization phases and scan for annotations using reflection. This loads many unnecessary objects into memory. Manually calling <code>findViewById()</code> is often more efficient.</p><h3 id="11-Be-Cautious-with-External-Libraries"><a href="#11-Be-Cautious-with-External-Libraries" class="headerlink" title="11. Be Cautious with External Libraries"></a>11. Be Cautious with External Libraries</h3><p>Many external libraries aren’t optimized for mobile environments. Carefully evaluate any library before integration. For example, avoid importing a large library for only one or two features. Multiple libraries might also bring redundant implementations of the same functionality (e.g., two different ProtoBuf versions), bloating your APK and RAM usage.</p><h3 id="12-Optimize-Overall-Performance"><a href="#12-Optimize-Overall-Performance" class="headerlink" title="12. Optimize Overall Performance"></a>12. Optimize Overall Performance</h3><p>Refer to Google’s <a href="http://developer.android.com/training/best-performance.html">Best Practices for Performance</a>. Also, optimize your UI with the <a href="http://developer.android.com/tools/debugging/debugging-ui.html">layout optimization guidelines</a> and pay attention to Lint warnings.</p><h3 id="13-Use-ProGuard"><a href="#13-Use-ProGuard" class="headerlink" title="13. Use ProGuard"></a>13. Use ProGuard</h3><p><a href="http://developer.android.com/tools/help/proguard.html">ProGuard</a> shrinks, optimizes, and obfuscates your code by removing unused paths and renaming classes. This results in smaller APKs and less RAM needed for mapped code.</p><h3 id="14-Use-zipalign"><a href="#14-Use-zipalign" class="headerlink" title="14. Use zipalign"></a>14. Use zipalign</h3><p>Always run <a href="http://developer.android.com/tools/help/zipalign.html">zipalign</a> on your final APK. Failure to do so prevents resources (like images) from being memory-mapped efficiently, significantly increasing RAM usage. Google Play requires <code>zipalign</code>.</p><h3 id="15-Analyze-RAM-Usage"><a href="#15-Analyze-RAM-Usage" class="headerlink" title="15. Analyze RAM Usage"></a>15. Analyze RAM Usage</h3><p>Once your app is stable, analyze its memory lifecycle. See <a href="http://developer.android.com/tools/debugging/debugging-memory.html">Investigating Your RAM Usage</a>.</p><h3 id="16-Use-Multiple-Processes"><a href="#16-Use-Multiple-Processes" class="headerlink" title="16. Use Multiple Processes"></a>16. Use Multiple Processes</h3><p>For apps that must perform heavy background work (like a music player), consider splitting the app into components running in different processes. This allows the UI process to be killed and reclaimed while the background Service process continues to run. Use the <code>android:process</code> attribute in your manifest:</p><figure class="highlight xml"><table><tr><td class="gutter"><pre><span class="line">1</span><br><span class="line">2</span><br></pre></td><td class="code"><pre><span class="line"><span class="tag">&lt;<span class="name">service</span> <span class="attr">android:name</span>=<span class="string">&quot;.PlaybackService&quot;</span></span></span><br><span class="line"><span class="tag">         <span class="attr">android:process</span>=<span class="string">&quot;:background&quot;</span> /&gt;</span></span><br></pre></td></tr></table></figure><p>Use this technique cautiously, as it can increase total memory usage if implemented incorrectly.</p><h1 id="About-Me-amp-amp-Blog"><a href="#About-Me-amp-amp-Blog" class="headerlink" title="About Me &amp;&amp; Blog"></a>About Me &amp;&amp; Blog</h1><p>(Links and introduction)</p>]]></content>
    
    
    <summary type="html">&lt;p&gt;Android Memory Optimization Series:&lt;/p&gt;
&lt;ol&gt;
&lt;li&gt;&lt;a href=&quot;https://www.androidperformance.com/en/2015/07/20/Android-Performance-Memory-Google/&quot;&gt;Android Code Memory Optimization Suggestions - Android (Official)&lt;/a&gt;&lt;/li&gt;
&lt;li&gt;&lt;a href=&quot;https://www.androidperformance.com/en/2015/07/20/Android-Performance-Memory-Java/&quot;&gt;Android Code Memory Optimization Suggestions - Java (Official)&lt;/a&gt;&lt;/li&gt;
&lt;li&gt;&lt;a href=&quot;https://www.androidperformance.com/en/2015/07/20/Android-Performance-Memory-AndroidResource/&quot;&gt;Android Code Memory Optimization Suggestions - Android Resources&lt;/a&gt;&lt;/li&gt;
&lt;li&gt;&lt;a href=&quot;https://www.androidperformance.com/en/2015/07/20/Android-Performance-Memory-onTrimMemory/&quot;&gt;Android Code Memory Optimization Suggestions - OnTrimMemory&lt;/a&gt;&lt;/li&gt;
&lt;/ol&gt;
&lt;hr&gt;
&lt;p&gt;To ensure the Garbage Collector (GC) can properly release memory, it’s crucial to avoid memory leaks (often caused by global or static member variables holding object references) and to release references when they are no longer needed. For most apps, the GC handles the rest: if an object is no longer reachable, its memory is reclaimed.&lt;/p&gt;
&lt;p&gt;High-performance software requires proactive memory management throughout the development lifecycle. Android provides several specific guidelines and techniques to help developers achieve excellent memory performance.&lt;/p&gt;</summary>


    <category term="Android" scheme="https://androidperformance.com/en/categories/Android/"/>
    
    
    <category term="Android" scheme="https://androidperformance.com/en/tags/Android/"/>
    
    <category term="Startup" scheme="https://androidperformance.com/en/tags/Startup/"/>
    
    <category term="Memory" scheme="https://androidperformance.com/en/tags/Memory/"/>
    
    <category term="Performance" scheme="https://androidperformance.com/en/tags/Performance/"/>
    
    <category term="Java" scheme="https://androidperformance.com/en/tags/Java/"/>
    
  </entry>
  
  <entry>
    <title>Android Code Memory Optimization Suggestions - Java (Official)</title>
    <link href="https://androidperformance.com/en/2015/07/20/Android-Performance-Memory-Java/"/>
    <id>https://androidperformance.com/en/2015/07/20/Android-Performance-Memory-Java/</id>
    <published>2015-07-20T03:26:09.000Z</published>
    <updated>2026-05-10T23:29:51.059Z</updated>
    
    <content type="html"><![CDATA[<p>Android Memory Optimization Series:</p><ol><li><a href="https://www.androidperformance.com/en/2015/07/20/Android-Performance-Memory-Google/">Android Code Memory Optimization Suggestions - Android (Official)</a></li><li><a href="https://www.androidperformance.com/en/2015/07/20/Android-Performance-Memory-Java/">Android Code Memory Optimization Suggestions - Java (Official)</a></li><li><a href="https://www.androidperformance.com/en/2015/07/20/Android-Performance-Memory-AndroidResource/">Android Code Memory Optimization Suggestions - Android Resources</a></li><li><a href="https://www.androidperformance.com/en/2015/07/20/Android-Performance-Memory-onTrimMemory/">Android Code Memory Optimization Suggestions - OnTrimMemory</a></li></ol><hr><p>This article introduces micro-optimization techniques that, when combined, contribute to the overall performance of an app, although they don’t provide massive gains compared to choosing the right algorithms and data structures. You should incorporate these tips into your coding habits to improve efficiency.</p><p>This content is based on the Google Official Training for Performance Optimization, specifically focusing on high-performance Android code. I recommend all Android developers read these guidelines and apply these principles in their work.</p><span id="more"></span><blockquote><p>Original: <a href="http://developer.android.com/training/articles/perf-tips.html">http://developer.android.com/training/articles/perf-tips.html</a></p></blockquote><h2 id="Introduction"><a href="#Introduction" class="headerlink" title="Introduction"></a>Introduction</h2><p>Generally, efficient code follows two rules:</p><ul><li>Don’t do work that you don’t need to do.</li><li>Don’t allocate memory if you can avoid it.</li></ul><p>One of the trickiest problems you face when micro-optimizing an Android app is that your app is guaranteed to run on multiple types of hardware. Different VM versions running on different processors run at different speeds. It’s not even as simple as saying “Device X is faster&#x2F;slower than Device Y because of factor F.” Performance doesn’t scale linearly across devices. For example, the emulator often has no comparable performance to physical hardware. There are also huge differences between devices with and without a JIT (Just-In-Time) compiler.</p><p>Performance is affected by the CPU, RAM, OS version, and many other factors. To ensure your code runs well across the ecosystem, you must maximize its efficiency.</p><h2 id="1-Avoid-Creating-Unnecessary-Objects"><a href="#1-Avoid-Creating-Unnecessary-Objects" class="headerlink" title="1) Avoid Creating Unnecessary Objects"></a>1) Avoid Creating Unnecessary Objects</h2><p>While the Garbage Collector (GC) reclaims unused objects, allocating and reclaiming memory both cost resources. Avoid creating transient objects when possible:</p><ul><li>If you need to return a <code>String</code> and you know it will eventually be appended to a <code>StringBuffer</code>, modify your implementation to avoid direct concatenation; instead, use a temporary object or pass the buffer.</li><li>When extracting <code>Strings</code> from an input dataset, try to return a <code>substring</code> of the original data rather than creating a copy.</li></ul><p>A more aggressive approach is to decompose multi-dimensional data into 1D arrays:</p><ul><li>A set of <code>int</code> values is better than a set of <code>Integer</code> objects. Two 1D arrays are more efficient than one 2D array. This applies to all primitive types.</li><li>If you need an array to store <code>(Foo, Bar)</code> objects, using two arrays <code>Foo[]</code> and <code>Bar[]</code> is more efficient than an array of <code>(Foo, Bar)</code> objects. (Balance this with API design—compromises are sometimes necessary for readability).</li></ul><p>Fewer objects mean fewer GCs, which directly improves user experience.</p><h2 id="2-Prefer-Static-Over-Virtual"><a href="#2-Prefer-Static-Over-Virtual" class="headerlink" title="2) Prefer Static Over Virtual"></a>2) Prefer Static Over Virtual</h2><p>If you don’t need to access an object’s fields, make the method <code>static</code>. Method calls will be 15%-20% faster. It’s also a good habit because the <code>static</code> modifier tells the caller that the method won’t change the object’s state.</p><h2 id="3-Use-Static-Final-for-Constants"><a href="#3-Use-Static-Final-for-Constants" class="headerlink" title="3) Use Static Final for Constants"></a>3) Use Static Final for Constants</h2><p>Consider this declaration:</p><figure class="highlight java"><table><tr><td class="gutter"><pre><span class="line">1</span><br><span class="line">2</span><br></pre></td><td class="code"><pre><span class="line"><span class="keyword">static</span> <span class="type">int</span> <span class="variable">intVal</span> <span class="operator">=</span> <span class="number">42</span>;</span><br><span class="line"><span class="keyword">static</span> <span class="type">String</span> <span class="variable">strVal</span> <span class="operator">=</span> <span class="string">&quot;Hello, world!&quot;</span>;</span><br></pre></td></tr></table></figure><p>The compiler generates a <code>&lt;clinit&gt;</code> method to initialize these values when the class is first used. Accessing them later requires a lookup. Use <code>static final</code> to improve performance:</p><figure class="highlight java"><table><tr><td class="gutter"><pre><span class="line">1</span><br><span class="line">2</span><br></pre></td><td class="code"><pre><span class="line"><span class="keyword">static</span> <span class="keyword">final</span> <span class="type">int</span> <span class="variable">intVal</span> <span class="operator">=</span> <span class="number">42</span>;</span><br><span class="line"><span class="keyword">static</span> <span class="keyword">final</span> <span class="type">String</span> <span class="variable">strVal</span> <span class="operator">=</span> <span class="string">&quot;Hello, world!&quot;</span>;</span><br></pre></td></tr></table></figure><p>This avoids the extra lookup. <strong>Always use <code>static final</code> for constants.</strong></p><h2 id="4-Avoid-Internal-Getters-x2F-Setters"><a href="#4-Avoid-Internal-Getters-x2F-Setters" class="headerlink" title="4) Avoid Internal Getters&#x2F;Setters"></a>4) Avoid Internal Getters&#x2F;Setters</h2><p>In native languages like C++, it’s common to use getters (<code>i = getCount()</code>) instead of direct field access (<code>i = mCount</code>). This is an excellent habit in C++, C#, and Java because compilers often inline these accesses.</p><p><strong>However, on Android, this is a bad practice.</strong> Virtual method calls are more expensive than direct field access. <strong>Recommendation: Use getters&#x2F;setters for public APIs, but use direct field access within the class itself.</strong></p><p>Without a JIT, direct access is 3x faster than a getter. With a JIT, it’s 7x faster. Note that if you use <a href="http://developer.android.com/tools/help/proguard.html">ProGuard</a>, it can inline these for you, giving you the same effect.</p><h2 id="5-Use-Enhanced-For-Loop-Syntax"><a href="#5-Use-Enhanced-For-Loop-Syntax" class="headerlink" title="5) Use Enhanced For Loop Syntax"></a>5) Use Enhanced For Loop Syntax</h2><p>Compare these three loops:</p><figure class="highlight java"><table><tr><td class="gutter"><pre><span class="line">1</span><br><span class="line">2</span><br><span class="line">3</span><br><span class="line">4</span><br><span class="line">5</span><br><span class="line">6</span><br><span class="line">7</span><br><span class="line">8</span><br><span class="line">9</span><br><span class="line">10</span><br><span class="line">11</span><br><span class="line">12</span><br><span class="line">13</span><br><span class="line">14</span><br><span class="line">15</span><br><span class="line">16</span><br><span class="line">17</span><br><span class="line">18</span><br><span class="line">19</span><br><span class="line">20</span><br><span class="line">21</span><br><span class="line">22</span><br><span class="line">23</span><br><span class="line">24</span><br><span class="line">25</span><br><span class="line">26</span><br><span class="line">27</span><br><span class="line">28</span><br><span class="line">29</span><br></pre></td><td class="code"><pre><span class="line"><span class="keyword">static</span> <span class="keyword">class</span> <span class="title class_">Foo</span> &#123;</span><br><span class="line">    <span class="type">int</span> mSplat;</span><br><span class="line">&#125;</span><br><span class="line"></span><br><span class="line">Foo[] mArray = ...</span><br><span class="line"></span><br><span class="line"><span class="keyword">public</span> <span class="keyword">void</span> <span class="title function_">zero</span><span class="params">()</span> &#123;</span><br><span class="line">    <span class="type">int</span> <span class="variable">sum</span> <span class="operator">=</span> <span class="number">0</span>;</span><br><span class="line">    <span class="keyword">for</span> (<span class="type">int</span> <span class="variable">i</span> <span class="operator">=</span> <span class="number">0</span>; i &lt; mArray.length; ++i) &#123;</span><br><span class="line">        sum += mArray[i].mSplat;</span><br><span class="line">    &#125;</span><br><span class="line">&#125;</span><br><span class="line"></span><br><span class="line"><span class="keyword">public</span> <span class="keyword">void</span> <span class="title function_">one</span><span class="params">()</span> &#123;</span><br><span class="line">    <span class="type">int</span> <span class="variable">sum</span> <span class="operator">=</span> <span class="number">0</span>;</span><br><span class="line">    Foo[] localArray = mArray;</span><br><span class="line">    <span class="type">int</span> <span class="variable">len</span> <span class="operator">=</span> localArray.length;</span><br><span class="line"></span><br><span class="line">    <span class="keyword">for</span> (<span class="type">int</span> <span class="variable">i</span> <span class="operator">=</span> <span class="number">0</span>; i &lt; len; ++i) &#123;</span><br><span class="line">        sum += localArray[i].mSplat;</span><br><span class="line">    &#125;</span><br><span class="line">&#125;</span><br><span class="line"></span><br><span class="line"><span class="keyword">public</span> <span class="keyword">void</span> <span class="title function_">two</span><span class="params">()</span> &#123;</span><br><span class="line">    <span class="type">int</span> <span class="variable">sum</span> <span class="operator">=</span> <span class="number">0</span>;</span><br><span class="line">    <span class="keyword">for</span> (Foo a : mArray) &#123;</span><br><span class="line">        sum += a.mSplat;</span><br><span class="line">    &#125;</span><br><span class="line">&#125;</span><br></pre></td></tr></table></figure><ul><li><code>zero()</code> is the slowest because the JIT cannot optimize it well.</li><li><code>one()</code> is slightly faster.</li><li><code>two()</code> is the fastest on non-JIT devices and roughly equal to <code>one()</code> with a JIT. It uses the “for-each” loop.</li></ul><p>Use for-each for arrays, but for <code>ArrayList</code>, the manual <code>one()</code> style loop is preferred.</p><h2 id="6-Use-Package-Access-Instead-of-Private-Access-for-Inner-Classes"><a href="#6-Use-Package-Access-Instead-of-Private-Access-for-Inner-Classes" class="headerlink" title="6) Use Package Access Instead of Private Access for Inner Classes"></a>6) Use Package Access Instead of Private Access for Inner Classes</h2><p>Consider this code:</p><figure class="highlight java"><table><tr><td class="gutter"><pre><span class="line">1</span><br><span class="line">2</span><br><span class="line">3</span><br><span class="line">4</span><br><span class="line">5</span><br><span class="line">6</span><br><span class="line">7</span><br><span class="line">8</span><br><span class="line">9</span><br><span class="line">10</span><br><span class="line">11</span><br><span class="line">12</span><br><span class="line">13</span><br><span class="line">14</span><br><span class="line">15</span><br><span class="line">16</span><br><span class="line">17</span><br><span class="line">18</span><br><span class="line">19</span><br></pre></td><td class="code"><pre><span class="line"><span class="keyword">public</span> <span class="keyword">class</span> <span class="title class_">Foo</span> &#123;</span><br><span class="line">    <span class="keyword">private</span> <span class="keyword">class</span> <span class="title class_">Inner</span> &#123;</span><br><span class="line">        <span class="keyword">void</span> <span class="title function_">stuff</span><span class="params">()</span> &#123;</span><br><span class="line">            Foo.<span class="built_in">this</span>.doStuff(Foo.<span class="built_in">this</span>.mValue);</span><br><span class="line">        &#125;</span><br><span class="line">    &#125;</span><br><span class="line"></span><br><span class="line">    <span class="keyword">private</span> <span class="type">int</span> mValue;</span><br><span class="line"></span><br><span class="line">    <span class="keyword">public</span> <span class="keyword">void</span> <span class="title function_">run</span><span class="params">()</span> &#123;</span><br><span class="line">        <span class="type">Inner</span> <span class="variable">in</span> <span class="operator">=</span> <span class="keyword">new</span> <span class="title class_">Inner</span>();</span><br><span class="line">        mValue = <span class="number">27</span>;</span><br><span class="line">        in.stuff();</span><br><span class="line">    &#125;</span><br><span class="line"></span><br><span class="line">    <span class="keyword">private</span> <span class="keyword">void</span> <span class="title function_">doStuff</span><span class="params">(<span class="type">int</span> value)</span> &#123;</span><br><span class="line">        System.out.println(<span class="string">&quot;Value is &quot;</span> + value);</span><br><span class="line">    &#125;</span><br><span class="line">&#125;</span><br></pre></td></tr></table></figure><p>The issue here is that the VM treats <code>Foo</code> and <code>Foo$Inner</code> as separate classes, even though Java allows inner classes to access private members of the outer class. To bridge this, the compiler generates “synthetic” methods:</p><figure class="highlight java"><table><tr><td class="gutter"><pre><span class="line">1</span><br><span class="line">2</span><br><span class="line">3</span><br><span class="line">4</span><br><span class="line">5</span><br><span class="line">6</span><br></pre></td><td class="code"><pre><span class="line"><span class="comment">/*package*/</span> <span class="keyword">static</span> <span class="type">int</span> Foo.access$<span class="number">100</span>(Foo foo) &#123;</span><br><span class="line">    <span class="keyword">return</span> foo.mValue;</span><br><span class="line">&#125;</span><br><span class="line"><span class="comment">/*package*/</span> <span class="keyword">static</span> <span class="keyword">void</span> Foo.access$<span class="number">200</span>(Foo foo, <span class="type">int</span> value) &#123;</span><br><span class="line">    foo.doStuff(value);</span><br><span class="line">&#125;</span><br></pre></td></tr></table></figure><p>Every time the inner class accesses <code>mValue</code> or <code>doStuff()</code>, it calls these static methods. As mentioned earlier, accessor methods are slower than direct access. If you are in a performance-critical “hotspot,” make these fields and methods package-private (default visibility) instead of <code>private</code>. Note that this exposes them to other classes in the same package, so it shouldn’t be done in public APIs.</p><h2 id="7-Avoid-Float"><a href="#7-Avoid-Float" class="headerlink" title="7) Avoid Float"></a>7) Avoid Float</h2><p>On Android, <code>float</code> data access is roughly half the speed of <code>int</code>. Prefer <code>int</code> when possible.</p><h2 id="8-Use-Library-Functions"><a href="#8-Use-Library-Functions" class="headerlink" title="8) Use Library Functions"></a>8) Use Library Functions</h2><p>Always prefer built-in functions like <code>System.arraycopy()</code>. They are implemented in native code and are up to 9x faster than manual loops.</p><p><strong>Tip: Also see Josh Bloch’s Effective Java, Item 47.</strong></p><h2 id="9-Use-Native-Methods-Sparingly"><a href="#9-Use-Native-Methods-Sparingly" class="headerlink" title="9) Use Native Methods Sparingly"></a>9) Use Native Methods Sparingly</h2><p>Native code (via JNI) is not inherently faster for simple tasks. Only use JNI if you are migrating existing native code or have a compute-heavy task. Read <a href="http://developer.android.com/guide/practices/jni.html">JNI Tips</a> for more.</p><h2 id="10-Performance-Myth-Concrete-vs-Interface"><a href="#10-Performance-Myth-Concrete-vs-Interface" class="headerlink" title="10) Performance Myth: Concrete vs. Interface"></a>10) Performance Myth: Concrete vs. Interface</h2><p>Before JIT, using concrete types was faster than interfaces (e.g., <code>HashMap</code> vs <code>Map</code>). The speed difference was rumored to be 2x, but is actually about 6%. With a JIT, there is virtually no difference.</p><h2 id="11-Measurement"><a href="#11-Measurement" class="headerlink" title="11) Measurement"></a>11) Measurement</h2><p>The data in this doc reflects real-world Android performance. You can use <a href="http://developer.android.com/tools/debugging/debugging-tracing.html">Traceview</a> for profiling, but keep in mind that Traceview measurements aren’t JIT-optimized, so actual production performance is usually slightly better.</p><p>For more on profiling and debugging:</p><ul><li><a href="http://developer.android.com/tools/debugging/debugging-tracing.html">Profiling with Traceview and dmtracedump</a></li><li><a href="http://developer.android.com/tools/debugging/systrace.html">Analysing Display and Performance with Systrace</a></li></ul><h1 id="About-Me-amp-amp-Blog"><a href="#About-Me-amp-amp-Blog" class="headerlink" title="About Me &amp;&amp; Blog"></a>About Me &amp;&amp; Blog</h1><p>(Links and introduction)</p>]]></content>
    
    
    <summary type="html">&lt;p&gt;Android Memory Optimization Series:&lt;/p&gt;
&lt;ol&gt;
&lt;li&gt;&lt;a href=&quot;https://www.androidperformance.com/en/2015/07/20/Android-Performance-Memory-Google/&quot;&gt;Android Code Memory Optimization Suggestions - Android (Official)&lt;/a&gt;&lt;/li&gt;
&lt;li&gt;&lt;a href=&quot;https://www.androidperformance.com/en/2015/07/20/Android-Performance-Memory-Java/&quot;&gt;Android Code Memory Optimization Suggestions - Java (Official)&lt;/a&gt;&lt;/li&gt;
&lt;li&gt;&lt;a href=&quot;https://www.androidperformance.com/en/2015/07/20/Android-Performance-Memory-AndroidResource/&quot;&gt;Android Code Memory Optimization Suggestions - Android Resources&lt;/a&gt;&lt;/li&gt;
&lt;li&gt;&lt;a href=&quot;https://www.androidperformance.com/en/2015/07/20/Android-Performance-Memory-onTrimMemory/&quot;&gt;Android Code Memory Optimization Suggestions - OnTrimMemory&lt;/a&gt;&lt;/li&gt;
&lt;/ol&gt;
&lt;hr&gt;
&lt;p&gt;This article introduces micro-optimization techniques that, when combined, contribute to the overall performance of an app, although they don’t provide massive gains compared to choosing the right algorithms and data structures. You should incorporate these tips into your coding habits to improve efficiency.&lt;/p&gt;
&lt;p&gt;This content is based on the Google Official Training for Performance Optimization, specifically focusing on high-performance Android code. I recommend all Android developers read these guidelines and apply these principles in their work.&lt;/p&gt;</summary>


    <category term="Android" scheme="https://androidperformance.com/en/categories/Android/"/>
    
    
    <category term="Android" scheme="https://androidperformance.com/en/tags/Android/"/>
    
    <category term="Memory" scheme="https://androidperformance.com/en/tags/Memory/"/>
    
    <category term="Performance" scheme="https://androidperformance.com/en/tags/Performance/"/>
    
    <category term="Java" scheme="https://androidperformance.com/en/tags/Java/"/>
    
    <category term="MAT" scheme="https://androidperformance.com/en/tags/MAT/"/>
    
  </entry>
  
  <entry>
    <title>Enabling Multi-Window Mode on Nexus 6 with Android M</title>
    <link href="https://androidperformance.com/en/2015/05/29/Nexus6-with-Android-M/"/>
    <id>https://androidperformance.com/en/2015/05/29/Nexus6-with-Android-M/</id>
    <published>2015-05-29T12:01:06.000Z</published>
    <updated>2026-05-10T23:29:51.062Z</updated>
    
    <content type="html"><![CDATA[<p>Following yesterday’s Google I&#x2F;O, Google released the Android M Preview for Nexus 6. You can download the firmware from the official Google website. Once flashed, you can experience the latest features of Android M. Below are the main settings screen and the Easter egg screen:</p><span id="more"></span><p>This article records the Android M Preview-era trick of changing <code>ro.build.type</code> to enable a hidden multi-window switch. Treat it as history now. Android multi-window later became a formal platform capability, and modern devices extend it through split screen, freeform windows, desktop modes, foldables, and large-screen multitasking. Today’s developer work is adapting lifecycle, resizable windows, configuration changes, <code>resizeableActivity</code>, large-screen layouts, and state restoration instead of modifying system properties to unlock a preview feature.</p><p><img src="/en/images/nexus6/0.webp" alt="Main Settings Screen"></p><p><img src="/en/images/nexus6/1.webp" alt="Easter Egg"></p><h3 id="Changes"><a href="#Changes" class="headerlink" title="Changes"></a>Changes</h3><ol><li>The most noticeable change in Android M is the app drawer:</li></ol><p><img src="/en/images/nexus6/2.webp" alt="New App Drawer"></p><p>As shown, the apps in the drawer are indexed alphabetically. The top row shows frequently used apps, which currently cannot be customized.</p><ol start="2"><li><p>Another significant change is in the animations—both folder animations and app launch animations have been updated. It’s hard to describe in words, so you’ll have to experience it yourself.</p></li><li><p>You can now set themes in the settings, although currently only “Light” and “Dark” are available.</p></li></ol><p><img src="/en/images/nexus6/3.webp" alt="Theme Selection"></p><h2 id="Multi-Window-Mode"><a href="#Multi-Window-Mode" class="headerlink" title="Multi-Window Mode"></a>Multi-Window Mode</h2><p>Multi-window mode is not enabled by default in the official Android M Preview firmware. This is because the official build is a “user” build, while multi-window mode is only toggleable in “userdebug” builds. Therefore, it must be enabled manually.</p><h3 id="Flashing-a-Third-Party-Recovery"><a href="#Flashing-a-Third-Party-Recovery" class="headerlink" title="Flashing a Third-Party Recovery"></a>Flashing a Third-Party Recovery</h3><h4 id="1-Enter-Bootloader-Mode"><a href="#1-Enter-Bootloader-Mode" class="headerlink" title="1. Enter Bootloader Mode"></a>1. Enter Bootloader Mode</h4><figure class="highlight bash"><table><tr><td class="gutter"><pre><span class="line">1</span><br></pre></td><td class="code"><pre><span class="line">adb reboot bootloader</span><br></pre></td></tr></table></figure><h4 id="2-Flash-twrp-img"><a href="#2-Flash-twrp-img" class="headerlink" title="2. Flash twrp.img"></a>2. Flash twrp.img</h4><p>I downloaded this TWRP image from the official site. Since the official download can be slow, I’ve also uploaded it to a cloud drive (Baidu Netdisk) for convenience: <a href="http://pan.baidu.com/s/1eQ5ysE2">twrp</a></p><figure class="highlight bash"><table><tr><td class="gutter"><pre><span class="line">1</span><br></pre></td><td class="code"><pre><span class="line">fastboot flash recovery ~/Downloads/twrp-2.8.6.0-shamu.img</span><br></pre></td></tr></table></figure><h4 id="3-Mount-System"><a href="#3-Mount-System" class="headerlink" title="3. Mount System"></a>3. Mount System</h4><p>After flashing the recovery, do not reboot the phone. Enter Recovery mode directly, go to “Mount,” and check the “System” option. This step allows you to modify the <code>/system</code> directory.</p><h4 id="4-Modify-x2F-system-x2F-build-prop"><a href="#4-Modify-x2F-system-x2F-build-prop" class="headerlink" title="4. Modify &#x2F;system&#x2F;build.prop"></a>4. Modify &#x2F;system&#x2F;build.prop</h4><p>Check if the device is recognized using <code>adb devices</code>. If it is, enter the shell:</p><figure class="highlight bash"><table><tr><td class="gutter"><pre><span class="line">1</span><br></pre></td><td class="code"><pre><span class="line">adb shell</span><br></pre></td></tr></table></figure><p>Then, use <code>vi</code> to open <code>system/build.prop</code>:</p><figure class="highlight bash"><table><tr><td class="gutter"><pre><span class="line">1</span><br></pre></td><td class="code"><pre><span class="line">vi system/build.prop</span><br></pre></td></tr></table></figure><p>Find the line:</p><figure class="highlight properties"><table><tr><td class="gutter"><pre><span class="line">1</span><br></pre></td><td class="code"><pre><span class="line"><span class="attr">ro.build.type</span>=<span class="string">user</span></span><br></pre></td></tr></table></figure><p>And change it to:</p><figure class="highlight properties"><table><tr><td class="gutter"><pre><span class="line">1</span><br></pre></td><td class="code"><pre><span class="line"><span class="attr">ro.build.type</span>=<span class="string">userdebug</span></span><br></pre></td></tr></table></figure><p>Save and exit the shell. Then execute <code>adb reboot</code>. After the reboot, you will find a new option in Developer Options:</p><p><img src="/en/images/nexus6/4.webp" alt="Enable Multi-Window Option"></p><p>To use multi-window mode, tap the “Recents” (multitasking) button and select one of the three boxes on top of a task window:</p><ul><li>The first one places the window in the top half.</li><li>The second one places it in the bottom half.</li><li>The third one sets it to full screen.</li></ul><p><img src="/en/images/nexus6/5.webp" alt="Multi-Window Position Selection"></p><p>Then you can see the result:</p><p><img src="/en/images/nexus6/6.webp" alt="Multi-Window Effect"></p><h2 id="Afterword"><a href="#Afterword" class="headerlink" title="Afterword"></a>Afterword</h2><p>While it’s called “multi-window,” Currently it only supports two windows. The space utilization for two windows isn’t very high yet, and anything more would be even less practical for now. We’ll see how Google develops this further.</p><p>Actually, Samsung implemented multi-window long ago, and theirs even supports dynamic resizing. However, at this stage, it feels more like a experimental feature than something for daily use. It might take a few more iterations to mature.</p><p>The original Chinese version of this article can be found on Jianshu: <a href="http://www.jianshu.com/p/8bb7b44930e3">Nexus6-with-Android-M开启多窗口模式</a>.</p><h1 id="About-Me-amp-amp-Blog"><a href="#About-Me-amp-amp-Blog" class="headerlink" title="About Me &amp;&amp; Blog"></a>About Me &amp;&amp; Blog</h1><p>Below is my personal intro and related links. I look forward to exchanging ideas with fellow professionals. “When three walk together, one can always be my teacher!”</p><ol><li><a href="https://www.androidperformance.com/en/about/">Blogger Intro</a></li><li><a href="https://www.androidperformance.com/en/2019/12/01/BlogMap/">Blog Content Navigation</a>: A guide for my blog content.</li><li><a href="https://www.androidperformance.com/en/2018/05/07/Android-performance-optimization-skills-and-tools/">Curated Excellent Blog Articles - Android Performance Optimization Must-Knows</a></li><li><a href="https://www.androidperformance.com/en/2023/12/30/the-performance/">Android Performance Optimization Knowledge Planet</a></li></ol><blockquote><p><strong>One walks faster alone, but a group walks further together.</strong></p></blockquote><p><img src="/en/images/WechatIMG581.webp" alt="Scan WeChat QR Code"></p>]]></content>
    
    
    <summary type="html">&lt;p&gt;Following yesterday’s Google I&amp;#x2F;O, Google released the Android M Preview for Nexus 6. You can download the firmware from the official Google website. Once flashed, you can experience the latest features of Android M. Below are the main settings screen and the Easter egg screen:&lt;/p&gt;</summary>


    <category term="Android" scheme="https://androidperformance.com/en/categories/Android/"/>
    
    
    <category term="Android" scheme="https://androidperformance.com/en/tags/Android/"/>
    
    <category term="Startup" scheme="https://androidperformance.com/en/tags/Startup/"/>
    
    <category term="Java" scheme="https://androidperformance.com/en/tags/Java/"/>
    
    <category term="Nexus" scheme="https://androidperformance.com/en/tags/Nexus/"/>
    
  </entry>
  
  <entry>
    <title>A Detailed Guide to Java Singleton Pattern</title>
    <link href="https://androidperformance.com/en/2015/05/06/Java-Singleton/"/>
    <id>https://androidperformance.com/en/2015/05/06/Java-Singleton/</id>
    <published>2015-05-06T10:09:43.000Z</published>
    <updated>2026-05-10T23:29:51.062Z</updated>
    
    <content type="html"><![CDATA[<p>The Singleton pattern, also known as the single-instance pattern, is a widely used software design pattern. When apply this pattern, the class must ensure that only one instance of the singleton object exists. In this article, we will explore the two primary ways to construct a singleton pattern and finally introduce a sophisticated yet concise approach.</p><span id="more"></span><h2 id="What-is-the-Singleton-Pattern"><a href="#What-is-the-Singleton-Pattern" class="headerlink" title="What is the Singleton Pattern?"></a>What is the Singleton Pattern?</h2><blockquote><p>The <a href="http://en.wikipedia.org/wiki/Singleton_pattern">Singleton pattern</a> is a software design pattern that restricts the instantiation of a class to one “single” instance.</p></blockquote><p>The core principle is: the singleton class must guarantee that only one instance of the object exists.</p><h2 id="Constructing-the-Singleton-Pattern"><a href="#Constructing-the-Singleton-Pattern" class="headerlink" title="Constructing the Singleton Pattern"></a>Constructing the Singleton Pattern</h2><p>In Java, there are two main construction approaches:</p><ol><li><strong>Lazy Initialization</strong>: The singleton instance is created only when it is first used.</li><li><strong>Eager Initialization</strong>: The singleton instance is created when the class is loaded.</li></ol><p>In simpler terms, one delays initialization, while the other does not.</p><p>A straightforward implementation is:</p><figure class="highlight java"><table><tr><td class="gutter"><pre><span class="line">1</span><br><span class="line">2</span><br><span class="line">3</span><br><span class="line">4</span><br><span class="line">5</span><br><span class="line">6</span><br><span class="line">7</span><br><span class="line">8</span><br><span class="line">9</span><br><span class="line">10</span><br><span class="line">11</span><br><span class="line">12</span><br></pre></td><td class="code"><pre><span class="line"><span class="keyword">public</span> <span class="keyword">class</span> <span class="title class_">Singleton</span> &#123;</span><br><span class="line">    <span class="keyword">private</span> <span class="keyword">final</span> <span class="keyword">static</span> <span class="type">Singleton</span> <span class="variable">INSTANCE</span> <span class="operator">=</span> <span class="keyword">new</span> <span class="title class_">Singleton</span>();</span><br><span class="line"></span><br><span class="line">    <span class="comment">// Private constructor suppresses instantiation</span></span><br><span class="line">    <span class="keyword">private</span> <span class="title function_">Singleton</span><span class="params">()</span> &#123;</span><br><span class="line">    &#125;</span><br><span class="line"></span><br><span class="line">    <span class="comment">// Public static method to get the instance</span></span><br><span class="line">    <span class="keyword">public</span> <span class="keyword">static</span> Singleton <span class="title function_">getInstance</span><span class="params">()</span> &#123;</span><br><span class="line">        <span class="keyword">return</span> INSTANCE;</span><br><span class="line">    &#125;</span><br><span class="line">&#125;</span><br></pre></td></tr></table></figure><p>This approach is simple to implement, and the instance is created when the class is loaded. But what if we want to implement lazy initialization, where the instance is created only upon its first use?</p><p>One common technique is <strong>Double-Checked Locking (DCL)</strong>:</p><figure class="highlight java"><table><tr><td class="gutter"><pre><span class="line">1</span><br><span class="line">2</span><br><span class="line">3</span><br><span class="line">4</span><br><span class="line">5</span><br><span class="line">6</span><br><span class="line">7</span><br><span class="line">8</span><br><span class="line">9</span><br><span class="line">10</span><br><span class="line">11</span><br><span class="line">12</span><br><span class="line">13</span><br><span class="line">14</span><br><span class="line">15</span><br><span class="line">16</span><br><span class="line">17</span><br><span class="line">18</span><br><span class="line">19</span><br><span class="line">20</span><br><span class="line">21</span><br></pre></td><td class="code"><pre><span class="line"><span class="keyword">public</span> <span class="keyword">class</span> <span class="title class_">Singleton</span> &#123;</span><br><span class="line">    <span class="keyword">private</span> <span class="keyword">static</span> <span class="keyword">volatile</span> <span class="type">Singleton</span> <span class="variable">INSTANCE</span> <span class="operator">=</span> <span class="literal">null</span>;</span><br><span class="line"></span><br><span class="line">    <span class="comment">// Private constructor suppresses instantiation</span></span><br><span class="line">    <span class="keyword">private</span> <span class="title function_">Singleton</span><span class="params">()</span> &#123;</span><br><span class="line">    &#125;</span><br><span class="line"></span><br><span class="line">    <span class="comment">// Thread-safe and performance-oriented</span></span><br><span class="line">    <span class="keyword">public</span> <span class="keyword">static</span> Singleton <span class="title function_">getInstance</span><span class="params">()</span> &#123;</span><br><span class="line">        <span class="keyword">if</span> (INSTANCE == <span class="literal">null</span>) &#123;</span><br><span class="line">            <span class="keyword">synchronized</span> (Singleton.class) &#123;</span><br><span class="line">                <span class="comment">// When multiple threads pass the first null check simultaneously,</span></span><br><span class="line">                <span class="comment">// we check again to avoid multiple instantiations.</span></span><br><span class="line">                <span class="keyword">if</span> (INSTANCE == <span class="literal">null</span>) &#123;</span><br><span class="line">                    INSTANCE = <span class="keyword">new</span> <span class="title class_">Singleton</span>();</span><br><span class="line">                &#125;</span><br><span class="line">            &#125;</span><br><span class="line">        &#125;</span><br><span class="line">        <span class="keyword">return</span> INSTANCE;</span><br><span class="line">    &#125;</span><br><span class="line">&#125;</span><br></pre></td></tr></table></figure><p>Note that this method is only reliable on JDK 5 and later because it requires the <code>volatile</code> keyword to prevent instruction reordering. In versions prior to JDK 5, double-checked locking could lead to unexpected behavior.</p><h2 id="Another-Singleton-Pattern"><a href="#Another-Singleton-Pattern" class="headerlink" title="Another Singleton Pattern"></a>Another Singleton Pattern</h2><p>A highly recommended alternative is the <strong>Lazy Initialization Holder Class Idiom</strong>:</p><figure class="highlight java"><table><tr><td class="gutter"><pre><span class="line">1</span><br><span class="line">2</span><br><span class="line">3</span><br><span class="line">4</span><br><span class="line">5</span><br><span class="line">6</span><br><span class="line">7</span><br><span class="line">8</span><br><span class="line">9</span><br><span class="line">10</span><br><span class="line">11</span><br><span class="line">12</span><br><span class="line">13</span><br><span class="line">14</span><br></pre></td><td class="code"><pre><span class="line"><span class="keyword">public</span> <span class="keyword">class</span> <span class="title class_">Singleton</span> &#123;</span><br><span class="line"></span><br><span class="line">    <span class="comment">// Private constructor suppresses instantiation</span></span><br><span class="line">    <span class="keyword">private</span> <span class="title function_">Singleton</span><span class="params">()</span> &#123;</span><br><span class="line">    &#125;</span><br><span class="line"></span><br><span class="line">    <span class="keyword">private</span> <span class="keyword">static</span> <span class="keyword">class</span> <span class="title class_">LazyHolder</span> &#123;</span><br><span class="line">        <span class="keyword">static</span> <span class="keyword">final</span> <span class="type">Singleton</span> <span class="variable">INSTANCE</span> <span class="operator">=</span> <span class="keyword">new</span> <span class="title class_">Singleton</span>();</span><br><span class="line">    &#125;</span><br><span class="line"></span><br><span class="line">    <span class="keyword">public</span> <span class="keyword">static</span> Singleton <span class="title function_">getInstance</span><span class="params">()</span> &#123;</span><br><span class="line">        <span class="keyword">return</span> LazyHolder.INSTANCE;</span><br><span class="line">    &#125;</span><br><span class="line">&#125;</span><br></pre></td></tr></table></figure><p>The JVM performs class initialization after loading the class but before any thread uses it. During this stage, the JVM acquires a lock to synchronize multiple threads’ initialization of the same class. Compared to other solutions like double-checked locking, this approach is more concise and works across all compiler versions.</p><p>For a discussion on why the access level of the <code>static final Singleton INSTANCE</code> field is package-private, you can read: <a href="http://ifeve.com/initialization-on-demand-holder-idiom/">Discussion on the implementation of the Initialization-On-Demand Holder idiom</a>.</p><h2 id="Using-Enum"><a href="#Using-Enum" class="headerlink" title="Using Enum"></a>Using Enum</h2><p>Finally, the most concise way to implement a singleton is by using an <strong>Enum</strong>.</p><p>The code is extremely simple, and its usage is straightforward:</p><figure class="highlight java"><table><tr><td class="gutter"><pre><span class="line">1</span><br><span class="line">2</span><br><span class="line">3</span><br></pre></td><td class="code"><pre><span class="line"><span class="keyword">public</span> <span class="keyword">enum</span> <span class="title class_">Singleton</span> &#123;</span><br><span class="line">    INSTANCE;</span><br><span class="line">&#125;</span><br></pre></td></tr></table></figure><p>Reflecting on the previous implementations, they all only considered standard object retrieval. However, objects can also be retrieved through <strong>serialization</strong> and <strong>reflection</strong>. For the other methods, if they implement the <code>Serializable</code> interface, they must override the <code>readResolve()</code> method:</p><figure class="highlight java"><table><tr><td class="gutter"><pre><span class="line">1</span><br><span class="line">2</span><br><span class="line">3</span><br></pre></td><td class="code"><pre><span class="line"><span class="keyword">private</span> Object <span class="title function_">readResolve</span><span class="params">()</span> &#123;</span><br><span class="line">    <span class="keyword">return</span> INSTANCE;</span><br><span class="line">&#125;</span><br></pre></td></tr></table></figure><p>Even with <code>readResolve()</code>, some fields might still require the <code>transient</code> keyword. Serialization is generally a hassle.</p><p>Regarding reflection, typical <code>private</code> constructors only restrict access during compilation, not at runtime. However, an enum-based singleton provides built-in protection against both serialization and reflection. To understand why, look at the decompiled code of an enum class (for reference):</p><figure class="highlight java"><table><tr><td class="gutter"><pre><span class="line">1</span><br><span class="line">2</span><br><span class="line">3</span><br><span class="line">4</span><br><span class="line">5</span><br><span class="line">6</span><br><span class="line">7</span><br><span class="line">8</span><br><span class="line">9</span><br><span class="line">10</span><br><span class="line">11</span><br><span class="line">12</span><br><span class="line">13</span><br><span class="line">14</span><br><span class="line">15</span><br><span class="line">16</span><br><span class="line">17</span><br><span class="line">18</span><br><span class="line">19</span><br><span class="line">20</span><br><span class="line">21</span><br><span class="line">22</span><br><span class="line">23</span><br><span class="line">24</span><br><span class="line">25</span><br><span class="line">26</span><br><span class="line">27</span><br><span class="line">28</span><br><span class="line">29</span><br><span class="line">30</span><br><span class="line">31</span><br><span class="line">32</span><br></pre></td><td class="code"><pre><span class="line"><span class="keyword">public</span> <span class="keyword">abstract</span> <span class="keyword">class</span> <span class="title class_">Singleton</span> <span class="keyword">extends</span> <span class="title class_">Enum</span></span><br><span class="line">&#123;</span><br><span class="line">    <span class="keyword">private</span> <span class="title function_">Singleton</span><span class="params">(String s, <span class="type">int</span> i)</span></span><br><span class="line">    &#123;</span><br><span class="line">        <span class="built_in">super</span>(s, i);</span><br><span class="line">    &#125;</span><br><span class="line"></span><br><span class="line">    <span class="keyword">public</span> <span class="keyword">static</span> Singleton[] values()</span><br><span class="line">    &#123;</span><br><span class="line">        Singleton[] asingleton = ENUM$VALUES;</span><br><span class="line">        <span class="type">int</span> <span class="variable">i</span> <span class="operator">=</span> asingleton.length;</span><br><span class="line">        Singleton[] asingleton1 = <span class="keyword">new</span> <span class="title class_">Singleton</span>[i];</span><br><span class="line">        System.arraycopy(asingleton, <span class="number">0</span>, asingleton1, <span class="number">0</span>, i);</span><br><span class="line">        <span class="keyword">return</span> asingleton1;</span><br><span class="line">    &#125;</span><br><span class="line"></span><br><span class="line">    <span class="keyword">public</span> <span class="keyword">static</span> Singleton <span class="title function_">valueOf</span><span class="params">(String s)</span></span><br><span class="line">    &#123;</span><br><span class="line">        <span class="keyword">return</span> (Singleton)Enum.valueOf(Singleton.class, s);</span><br><span class="line">    &#125;</span><br><span class="line"></span><br><span class="line">    <span class="keyword">public</span> <span class="keyword">static</span> <span class="keyword">final</span> Singleton INSTANCE;</span><br><span class="line">    <span class="keyword">private</span> <span class="keyword">static</span> <span class="keyword">final</span> Singleton ENUM$VALUES[];</span><br><span class="line"></span><br><span class="line">    <span class="keyword">static</span></span><br><span class="line">    &#123;</span><br><span class="line">        INSTANCE = <span class="keyword">new</span> <span class="title class_">Singleton</span>(<span class="string">&quot;INSTANCE&quot;</span>, <span class="number">0</span>);</span><br><span class="line">        ENUM$VALUES = (<span class="keyword">new</span> <span class="title class_">Singleton</span>[] &#123;</span><br><span class="line">            INSTANCE</span><br><span class="line">        &#125;);</span><br><span class="line">    &#125;</span><br><span class="line">&#125;</span><br></pre></td></tr></table></figure><p>Enums inherit from <code>java.lang.Enum</code>. You can see that the singleton instance is implemented using a <code>static</code> initialization block.</p><p>Why can enums prevent reflection? Simply because it is an <code>abstract</code> class (<code>public abstract class Singleton extends Enum</code>), which cannot be instantiated even via reflection.</p><p>Why can they prevent serialization issues? This depends on how Java handles object serialization.</p><figure class="highlight java"><table><tr><td class="gutter"><pre><span class="line">1</span><br><span class="line">2</span><br><span class="line">3</span><br><span class="line">4</span><br><span class="line">5</span><br><span class="line">6</span><br><span class="line">7</span><br><span class="line">8</span><br><span class="line">9</span><br><span class="line">10</span><br><span class="line">11</span><br><span class="line">12</span><br><span class="line">13</span><br><span class="line">14</span><br><span class="line">15</span><br><span class="line">16</span><br><span class="line">17</span><br><span class="line">18</span><br><span class="line">19</span><br><span class="line">20</span><br><span class="line">21</span><br><span class="line">22</span><br><span class="line">23</span><br><span class="line">24</span><br><span class="line">25</span><br><span class="line">26</span><br></pre></td><td class="code"><pre><span class="line"><span class="comment">// java.io.ObjectOutputStream</span></span><br><span class="line"></span><br><span class="line"><span class="keyword">private</span> <span class="keyword">void</span> <span class="title function_">writeObject0</span><span class="params">(Object obj, <span class="type">boolean</span> unshared)</span> &#123;</span><br><span class="line">    <span class="comment">// ...</span></span><br><span class="line">    <span class="keyword">if</span> (obj <span class="keyword">instanceof</span> String) &#123;</span><br><span class="line">        writeString((String) obj, unshared);</span><br><span class="line">    &#125; <span class="keyword">else</span> <span class="keyword">if</span> (cl.isArray()) &#123;</span><br><span class="line">        writeArray(obj, desc, unshared);</span><br><span class="line">    &#125; <span class="keyword">else</span> <span class="keyword">if</span> (obj <span class="keyword">instanceof</span> Enum) &#123;</span><br><span class="line">        writeEnum((Enum) obj, desc, unshared);</span><br><span class="line">    &#125; <span class="keyword">else</span> <span class="keyword">if</span> (obj <span class="keyword">instanceof</span> Serializable) &#123;</span><br><span class="line">        writeOrdinaryObject(obj, desc, unshared);</span><br><span class="line">    &#125;</span><br><span class="line">    <span class="comment">// ...</span></span><br><span class="line">&#125;</span><br><span class="line"></span><br><span class="line"><span class="comment">/**</span></span><br><span class="line"><span class="comment"> * Writes given enum constant to stream.</span></span><br><span class="line"><span class="comment"> */</span></span><br><span class="line"><span class="keyword">private</span> <span class="keyword">void</span> <span class="title function_">writeEnum</span><span class="params">(Enum en, ObjectStreamClass desc, <span class="type">boolean</span> unshared)</span> <span class="keyword">throws</span> IOException &#123;</span><br><span class="line">    bout.writeByte(TC_ENUM);</span><br><span class="line">    <span class="type">ObjectStreamClass</span> <span class="variable">sdesc</span> <span class="operator">=</span> desc.getSuperDesc();</span><br><span class="line">    writeClassDesc((sdesc.forClass() == Enum.class) ? desc : sdesc, <span class="literal">false</span>);</span><br><span class="line">    handles.assign(unshared ? <span class="literal">null</span> : en);</span><br><span class="line">    writeString(en.name(), <span class="literal">false</span>);</span><br><span class="line">&#125;</span><br></pre></td></tr></table></figure><p>When an enum is serialized, only its name is written to the stream. The deserialization process then uses that name to retrieve the existing instance:</p><figure class="highlight java"><table><tr><td class="gutter"><pre><span class="line">1</span><br><span class="line">2</span><br><span class="line">3</span><br><span class="line">4</span><br><span class="line">5</span><br><span class="line">6</span><br><span class="line">7</span><br><span class="line">8</span><br><span class="line">9</span><br><span class="line">10</span><br><span class="line">11</span><br><span class="line">12</span><br><span class="line">13</span><br><span class="line">14</span><br><span class="line">15</span><br><span class="line">16</span><br><span class="line">17</span><br><span class="line">18</span><br><span class="line">19</span><br><span class="line">20</span><br><span class="line">21</span><br></pre></td><td class="code"><pre><span class="line"><span class="comment">// java.io.ObjectInputStream</span></span><br><span class="line"><span class="keyword">private</span> Object <span class="title function_">readObject0</span><span class="params">(<span class="type">boolean</span> unshared)</span> <span class="keyword">throws</span> IOException &#123;</span><br><span class="line">    <span class="comment">// ...</span></span><br><span class="line">    <span class="keyword">switch</span> (tc) &#123;</span><br><span class="line">        <span class="comment">// ...</span></span><br><span class="line">        <span class="keyword">case</span> TC_ENUM:</span><br><span class="line">        <span class="keyword">return</span> checkResolve(readEnum(unshared));</span><br><span class="line">        <span class="comment">// ...</span></span><br><span class="line">    &#125;</span><br><span class="line">&#125;</span><br><span class="line"></span><br><span class="line"><span class="keyword">private</span> Enum&lt;?&gt; readEnum(<span class="type">boolean</span> unshared) <span class="keyword">throws</span> IOException &#123;</span><br><span class="line">    <span class="comment">// ...</span></span><br><span class="line">    <span class="keyword">try</span> &#123;</span><br><span class="line">        en = Enum.valueOf(cl, name);</span><br><span class="line">    &#125; <span class="keyword">catch</span> (IllegalArgumentException ex) &#123;</span><br><span class="line">        <span class="comment">// ...</span></span><br><span class="line">    &#125;</span><br><span class="line">    <span class="comment">// ...</span></span><br><span class="line">    <span class="keyword">return</span> en;</span><br><span class="line">&#125;</span><br></pre></td></tr></table></figure><p>Since deserialization merely calls <code>Enum.valueOf(Class&lt;T&gt; enumType, String name)</code>, it retrieves the existing instance rather than creating a new one.</p><p><strong>Tip</strong>: Be careful when serializing enums; the name of the enum constant must not change, otherwise deserialization will fail with an exception!</p><h2 id="Recommended-Reading"><a href="#Recommended-Reading" class="headerlink" title="Recommended Reading:"></a>Recommended Reading:</h2><ol><li><em>Effective Java</em>, Item 71: Use lazy initialization judiciously.</li><li><em>Core Java</em> Volume I, Section 14.5.8: Volatile Fields.</li><li><a href="http://docs.oracle.com/javase/specs/jls/se8/html/jls-17.html#jls-17.4">JLS 17.4: Memory Model</a></li><li><a href="http://www.ibm.com/developerworks/cn/java/j-jtp06197.html">Java Theory and Practice: Using Volatile Variables Correctly</a></li><li><a href="http://ifeve.com/double-checked-locking-with-delay-initialization/">Double-Checked Locking and Lazy Initialization</a></li></ol><hr><h1 id="About-Me-amp-amp-Blog"><a href="#About-Me-amp-amp-Blog" class="headerlink" title="About Me &amp;&amp; Blog"></a>About Me &amp;&amp; Blog</h1><p>Below are my personal details and links. I look forward to connecting and sharing knowledge with fellow developers!</p><ol><li><a href="https://www.androidperformance.com/en/about/">About Me</a>: Includes my WeChat and WeChat group links.</li><li><a href="https://www.androidperformance.com/en/2019/12/01/BlogMap/">Blog Navigation</a>: A guide to the content on this blog.</li><li><a href="https://www.androidperformance.com/en/2018/05/07/Android-performance-optimization-skills-and-tools/">Curated Android Performance Articles</a>: A collection of must-read performance optimization articles. Self-nominations&#x2F;recommendations are welcome!</li><li><a href="https://www.androidperformance.com/en/2023/12/30/the-performance/">Android Performance Knowledge Planet</a>: Join our community for more insights.</li></ol><blockquote><p><strong>“If you want to go fast, go alone. If you want to go far, go together.”</strong></p></blockquote><p><img src="/en/images/WechatIMG581.webp" alt="WeChat QR Code"></p>]]></content>
    
    
    <summary type="html">&lt;p&gt;The Singleton pattern, also known as the single-instance pattern, is a widely used software design pattern. When apply this pattern, the class must ensure that only one instance of the singleton object exists. In this article, we will explore the two primary ways to construct a singleton pattern and finally introduce a sophisticated yet concise approach.&lt;/p&gt;</summary>


    <category term="Java" scheme="https://androidperformance.com/en/categories/Java/"/>
    
    
    <category term="Android" scheme="https://androidperformance.com/en/tags/Android/"/>
    
    <category term="Java" scheme="https://androidperformance.com/en/tags/Java/"/>
    
    <category term="Singleton" scheme="https://androidperformance.com/en/tags/Singleton/"/>
    
  </entry>
  
  <entry>
    <title>Android Performance Patterns: Profile GPU Rendering</title>
    <link href="https://androidperformance.com/en/2015/04/19/Android-Performance-Patterns-4/"/>
    <id>https://androidperformance.com/en/2015/04/19/Android-Performance-Patterns-4/</id>
    <published>2015-04-19T07:53:31.000Z</published>
    <updated>2026-05-10T23:29:51.059Z</updated>
    
    <content type="html"><![CDATA[<p>Series Catalog:</p><ol><li><a href="https://www.androidperformance.com/en/2015/04/19/Android-Performance-Patterns/">Overview of Android Performance Patterns</a></li><li><a href="https://www.androidperformance.com/en/2015/04/19/Android-Performance-Patterns-1/">Android Performance Patterns: Render Performance</a></li><li><a href="https://www.androidperformance.com/en/2015/04/19/Android-Performance-Patterns-2/">Android Performance Patterns: Understanding Overdraw</a></li><li><a href="https://www.androidperformance.com/en/2015/04/19/Android-Performance-Patterns-3/">Android Performance Patterns: Understanding VSYNC</a></li><li><a href="https://www.androidperformance.com/en/2015/04/19/Android-Performance-Patterns-4/">Android Performance Patterns: Profile GPU Rendering</a></li></ol><hr><blockquote><p>“If you can measure it, you can optimize it” is a common term in the computing world, and for Android’s rendering system, the same thing holds true. In order to optimize your pipeline to be more efficient for rendering, you need a tool to give you feedback on where the current perf problems lie.</p><p>In this video, <a href="https://plus.google.com/+ColtMcAnlis">Colt McAnlis</a> walks you through an on-device tool built for this exact reason. “Profile GPU Rendering” will help you understand the stages of the rendering pipeline, see which portions might be taking too long, and decide what to do about it in your application.</p></blockquote><h2 id="Profile-GPU-Rendering-Tool"><a href="#Profile-GPU-Rendering-Tool" class="headerlink" title="Profile GPU Rendering Tool"></a>Profile GPU Rendering Tool</h2><p>Rendering performance issues are often the culprits stealing your precious frames. These problems are easy to create but also easy to track with the right tools. Using the <strong>Profile GPU Rendering</strong> tool, you can see right on your device exactly what is causing your application to stutter or slow down.</p><span id="more"></span><p>Profile GPU Rendering is still useful for quick on-device triage: tall bars mean a UI path has obvious frame cost. But it only shows aggregated on-screen stage signals. It cannot reconstruct causality across app frames, SurfaceFlinger composition, CPU scheduling, Binder&#x2F;I&#x2F;O, and GPU waits. Today, use it to find the unstable operation, then capture Perfetto&#x2F;System Trace to inspect Frame Timeline and thread states. To prevent regressions, encode that operation with Macrobenchmark <code>FrameTimingMetric</code> instead of relying on visual bar inspection.</p><p>This tool is located in <code>Settings -&gt; Developer Options -&gt; Profile GPU rendering</code>. Once enabled, select <strong>“On screen as bars”</strong>:</p><p><img src="/en/images/performance-4/1.webp" alt="Profile GPU rendering enabled"></p><p>A series of small bar graphs made of three colors will appear on the screen, along with a green line:</p><p><img src="/en/images/performance-4/2.webp" alt="GPU Profile Bars"></p><p>The tool displays analyzed graphical data on the screen. The bottom shows navigation info, the top shows notification info, and the middle shows information for the current application.</p><h2 id="Using-the-GPU-Profile-Tool"><a href="#Using-the-GPU-Profile-Tool" class="headerlink" title="Using the GPU Profile Tool"></a>Using the GPU Profile Tool</h2><p>As your application runs, you’ll see a row of bar graphs moving dynamically from left to right. <strong>Each vertical bar represents the rendering of one frame; a longer bar means that frame took longer to render.</strong> As frames accumulate, they stack up, allowing you to observe frame rate changes over time.</p><h3 id="The-Green-Line"><a href="#The-Green-Line" class="headerlink" title="The Green Line"></a>The Green Line</h3><p>The green line represents the <strong>16ms</strong> threshold. To achieve a smooth 60fps, every bar must stay below this green line. Any time a vertical bar crosses the green line, you’ll likely notice a stutter in your animation.</p><p><img src="/en/images/performance-4/3.webp" alt="Green Line Threshold"></p><h3 id="The-Bar-Colors"><a href="#The-Bar-Colors" class="headerlink" title="The Bar Colors"></a>The Bar Colors</h3><p>Each bar consists of three colors: <strong>Blue, Red, and Orange (Yellow)</strong>. These colors correspond directly to stages in the Android rendering pipeline:</p><p><img src="/en/images/performance-4/4.webp" alt="Bar Color Breakdown"></p><ul><li><p><strong>Blue</strong> represents <strong>Measure&#x2F;Draw</strong> time—the time spent creating and updating your DisplayLists. Before a view can be rendered, it must be converted into a format the GPU understands (drawing commands). This includes handling custom views and paths. Once done, the result is cached as a DisplayList object. Blue time tracks how long it takes to update these lists (i.e., executing <code>onDraw</code> for each view).</p><p><img src="/en/images/performance-4/5.webp" alt="Draw Phase Illustration"></p><p>If you see tall blue bars, <strong>it might be because many views were invalidated at once (requiring redrawing) or because specific <code>onDraw</code> functions are too complex.</strong></p><p><img src="/en/images/performance-4/6.webp" alt="Custom View Complexity"></p></li><li><p><strong>Red</strong> represents <strong>Execute</strong> time—the time Android takes to process 2D DisplayLists. To draw on the screen, Android uses OpenGL ES APIs to send DisplayList data to the GPU.</p><p><img src="/en/images/performance-4/7.webp" alt="Execute Phase Illustration"></p><p>Note that complex custom views (like the one below) require more complex OpenGL commands.</p><p><img src="/en/images/performance-4/8.webp" alt="Complex View commands"></p><p>Tall red bars are often caused by these complex custom views:</p><p><img src="/en/images/performance-4/9.webp" alt="Red Bar Issues"></p><p>Another possibility for tall red bars is re-submitting views. Even if views aren’t technically invalid, certain events (like rotation) require clearing and redrawing areas, which impacts the views below them.</p></li><li><p><strong>Orange&#x2F;Yellow</strong> represents <strong>Process</strong> time—the time the CPU spends telling the GPU to render a frame. This is a blocking call because the CPU waits for the GPU to acknowledge the command. If this is high, it means you’re giving the GPU too much work (too many complex OpenGL commands to handle).</p></li></ul><p>The key to smooth animations is keeping these bars below the green line.</p><h3 id="Summary"><a href="#Summary" class="headerlink" title="Summary"></a>Summary</h3><p>The GPU Profile tool is great for finding rendering issues, but fixing them requires deeper code analysis to find and optimize specific bottlenecks. Sometimes, you can use these metrics to convince designers to adjust their requirements for a better user experience.</p><h2 id="Perf-Matters"><a href="#Perf-Matters" class="headerlink" title="Perf Matters"></a>Perf Matters</h2><blockquote><p>Keep calm, profile your code, and always remember, Perf Matters.</p></blockquote><h1 id="About-Me-amp-amp-Blog"><a href="#About-Me-amp-amp-Blog" class="headerlink" title="About Me &amp;&amp; Blog"></a>About Me &amp;&amp; Blog</h1><p>Below is my personal intro and related links. I look forward to exchanging ideas with fellow professionals. “When three walk together, one can always be my teacher!”</p><ol><li><a href="https://www.androidperformance.com/en/about/">Blogger Intro</a></li><li><a href="https://www.androidperformance.com/en/2019/12/01/BlogMap/">Blog Content Navigation</a>: A guide for my blog content.</li><li><a href="https://www.androidperformance.com/en/2018/05/07/Android-performance-optimization-skills-and-tools/">Curated Excellent Blog Articles - Android Performance Optimization Must-Knows</a></li><li><a href="https://www.androidperformance.com/en/2023/12/30/the-performance/">Android Performance Optimization Knowledge Planet</a></li></ol><blockquote><p><strong>One walks faster alone, but a group walks further together.</strong></p></blockquote><p><img src="/en/images/WechatIMG581.webp" alt="Scan WeChat QR Code"></p>]]></content>
    
    
    <summary type="html">&lt;p&gt;Series Catalog:&lt;/p&gt;
&lt;ol&gt;
&lt;li&gt;&lt;a href=&quot;https://www.androidperformance.com/en/2015/04/19/Android-Performance-Patterns/&quot;&gt;Overview of Android Performance Patterns&lt;/a&gt;&lt;/li&gt;
&lt;li&gt;&lt;a href=&quot;https://www.androidperformance.com/en/2015/04/19/Android-Performance-Patterns-1/&quot;&gt;Android Performance Patterns: Render Performance&lt;/a&gt;&lt;/li&gt;
&lt;li&gt;&lt;a href=&quot;https://www.androidperformance.com/en/2015/04/19/Android-Performance-Patterns-2/&quot;&gt;Android Performance Patterns: Understanding Overdraw&lt;/a&gt;&lt;/li&gt;
&lt;li&gt;&lt;a href=&quot;https://www.androidperformance.com/en/2015/04/19/Android-Performance-Patterns-3/&quot;&gt;Android Performance Patterns: Understanding VSYNC&lt;/a&gt;&lt;/li&gt;
&lt;li&gt;&lt;a href=&quot;https://www.androidperformance.com/en/2015/04/19/Android-Performance-Patterns-4/&quot;&gt;Android Performance Patterns: Profile GPU Rendering&lt;/a&gt;&lt;/li&gt;
&lt;/ol&gt;
&lt;hr&gt;
&lt;blockquote&gt;
&lt;p&gt;“If you can measure it, you can optimize it” is a common term in the computing world, and for Android’s rendering system, the same thing holds true. In order to optimize your pipeline to be more efficient for rendering, you need a tool to give you feedback on where the current perf problems lie.&lt;/p&gt;
&lt;p&gt;In this video, &lt;a href=&quot;https://plus.google.com/+ColtMcAnlis&quot;&gt;Colt McAnlis&lt;/a&gt; walks you through an on-device tool built for this exact reason. “Profile GPU Rendering” will help you understand the stages of the rendering pipeline, see which portions might be taking too long, and decide what to do about it in your application.&lt;/p&gt;
&lt;/blockquote&gt;
&lt;h2 id=&quot;Profile-GPU-Rendering-Tool&quot;&gt;&lt;a href=&quot;#Profile-GPU-Rendering-Tool&quot; class=&quot;headerlink&quot; title=&quot;Profile GPU Rendering Tool&quot;&gt;&lt;/a&gt;Profile GPU Rendering Tool&lt;/h2&gt;&lt;p&gt;Rendering performance issues are often the culprits stealing your precious frames. These problems are easy to create but also easy to track with the right tools. Using the &lt;strong&gt;Profile GPU Rendering&lt;/strong&gt; tool, you can see right on your device exactly what is causing your application to stutter or slow down.&lt;/p&gt;</summary>


    <category term="Android" scheme="https://androidperformance.com/en/categories/Android/"/>
    
    
    <category term="Android" scheme="https://androidperformance.com/en/tags/Android/"/>
    
    <category term="Jank" scheme="https://androidperformance.com/en/tags/Jank/"/>
    
    <category term="Memory" scheme="https://androidperformance.com/en/tags/Memory/"/>
    
    <category term="Performance" scheme="https://androidperformance.com/en/tags/Performance/"/>
    
    <category term="RenderThread" scheme="https://androidperformance.com/en/tags/RenderThread/"/>
    
  </entry>
  
  <entry>
    <title>Android Performance Patterns: Understanding VSYNC</title>
    <link href="https://androidperformance.com/en/2015/04/19/Android-Performance-Patterns-3/"/>
    <id>https://androidperformance.com/en/2015/04/19/Android-Performance-Patterns-3/</id>
    <published>2015-04-19T07:47:25.000Z</published>
    <updated>2026-05-10T23:29:51.059Z</updated>
    
    <content type="html"><![CDATA[<p>Series Catalog:</p><ol><li><a href="https://www.androidperformance.com/en/2015/04/19/Android-Performance-Patterns/">Overview of Android Performance Patterns</a></li><li><a href="https://www.androidperformance.com/en/2015/04/19/Android-Performance-Patterns-1/">Android Performance Patterns: Render Performance</a></li><li><a href="https://www.androidperformance.com/en/2015/04/19/Android-Performance-Patterns-2/">Android Performance Patterns: Understanding Overdraw</a></li><li><a href="https://www.androidperformance.com/en/2015/04/19/Android-Performance-Patterns-3/">Android Performance Patterns: Understanding VSYNC</a></li><li><a href="https://www.androidperformance.com/en/2015/04/19/Android-Performance-Patterns-4/">Android Performance Patterns: Profile GPU Rendering</a></li></ol><hr><blockquote><p>Unbeknownst to most developers, there’s a simple hardware design that defines everything about how fast your application can draw things to the screen.</p><p>You may have heard the term VSYNC - VSYNC stands for vertical synchronization and it’s an event that happens every time your screen starts to refresh the content it wants to show you.</p><p>Effectively, VSYNC is the product of two components: Refresh Rate (how fast the hardware can refresh the screen), and Frames Per Second (how fast the GPU can draw images). In this video, <a href="https://plus.google.com/+ColtMcAnlis">Colt McAnlis</a> walks through each of these topics and discusses where VSYNC (and the 16ms rendering barrier) comes from, and why it’s critical to understand if you want a silky smooth application.</p></blockquote><h2 id="Basic-Concepts"><a href="#Basic-Concepts" class="headerlink" title="Basic Concepts"></a>Basic Concepts</h2><p>To develop a high-performance application, you first need to understand how the hardware works. The perceived speed of an app is often misunderstood as a raw hardware processing problem, but the real root is often rendering performance. To improve rendering, you must understand <strong>VSYNC</strong>.</p><span id="more"></span><p>The VSYNC mechanism in this article is still the foundation for understanding Android rendering cadence, but modern devices no longer default to 60Hz. A 60Hz display gives each frame about 16.66ms, 90Hz gives about 11.11ms, and 120Hz gives about 8.33ms. On high-refresh screens, the same MainThread&#x2F;RenderThread&#x2F;GPU work is more likely to miss the present deadline. When analyzing VSYNC and jank today, do not only ask whether work exceeded 16ms. In Perfetto Frame Timeline, inspect expected timeline, actual timeline, present fences, SurfaceFlinger composition, and whether app frames missed their deadlines.</p><p>Before diving into <strong>VSYNC</strong>, we need to understand two concepts:</p><h3 id="Refresh-Rate"><a href="#Refresh-Rate" class="headerlink" title="Refresh Rate"></a>Refresh Rate</h3><p>The refresh rate represents the number of times a screen refreshes per second, measured in Hertz (Hz). This is a fixed hardware parameter. Most screens are 60Hz, meaning they refresh every 16.66ms.</p><p><img src="/en/images/performance-3/1.webp" alt="Refresh Rate"></p><h3 id="Frame-Rate-FPS"><a href="#Frame-Rate-FPS" class="headerlink" title="Frame Rate (FPS)"></a>Frame Rate (FPS)</h3><p>The frame rate representing the number of frames the GPU can draw per second (e.g., 30fps&#x2F;60fps). In this case, a higher frame rate is generally better.</p><p><img src="/en/images/performance-3/2.webp" alt="Frame Rate"></p><h2 id="How-It-Works"><a href="#How-It-Works" class="headerlink" title="How It Works"></a>How It Works</h2><p>The refresh rate and frame rate must work together to display content. The GPU generates image data, and the hardware presents that content on the screen. This happens repeatedly throughout your app’s lifecycle. Each vertical segment in the image below represents the drawing and presentation of one frame.</p><p><img src="/en/images/performance-3/3.webp" alt="Working Together"></p><p>Unfortunately, the refresh rate and frame rate don’t always stay in sync:</p><ul><li><p>If the <strong>frame rate is faster than the refresh rate</strong>, visual artifacts can occur. When the GPU renders at 100fps but the screen only refreshes at 75Hz, some rendered images are never shown.</p><p><img src="/en/images/performance-3/4.webp" alt="Frame Rate Faster than Refresh Rate"></p><p>For example, if you take a photo, rotate it 5 degrees, take another, and then cut and join them:</p><p><img src="/en/images/performance-3/5.webp" alt="Two Photos"></p><p><img src="/en/images/performance-3/6.webp" alt="Joined Image"><br>The images have similarities, but the top and bottom parts have a clear mismatch. This is called <strong>Tearing</strong>, and it’s the result of a mismatch between refresh rate and frame rate.</p><p>This happens because while the display is refreshing (starting from the top), the GPU might be writing a new frame to the memory buffer. If a new frame overwrites the previous one mid-refresh, the display will output half of the old frame and half of the new one.</p><p><img src="/en/images/performance-3/7.webp" alt="Image Tearing"></p><p>Android uses <strong>Double Buffering</strong> (or Triple&#x2F;Quad Buffering) to effectively solve this. The GPU writes a frame to a “Back Buffer,” while the display reads from a “Frame Buffer.” When the next frame is ready, the GPU starts filling the back buffer while the frame buffer remains constant. During the refresh, <strong>VSYNC</strong> (Vertical Synchronization) triggers the “swap” or copy from the back buffer to the frame buffer:</p><p><img src="/en/images/performance-3/8.webp" alt="Vsync Mechanism"></p><p>It’s normal for the GPU frequency to be higher than the refresh rate. In this case, once the screen refresh completes, the GPU waits for the VSYNC signal before starting the next frame. This caps your frame rate at the device’s refresh rate. Ideally, to hit 60fps, the GPU must prepare a frame within 16.66ms.</p></li><li><p>If the <strong>refresh rate is faster than the frame rate</strong>, the screen will show the same image for multiple refreshes. This is perceived as stuttering or lag. If the frame rate drops (e.g., the GPU has too much to draw), the user will clearly notice a freeze or “jank” before it becomes smooth again. This is typically described as flickering, frame skipping, or lag.</p><p><img src="/en/images/performance-3/9.webp" alt="Refresh Rate Faster than Frame Rate"></p><p>Your application should avoid these sudden frame rate drops by ensuring the GPU can process data quickly and write content before the next screen refresh.</p></li></ul><h2 id="Perf-Matters"><a href="#Perf-Matters" class="headerlink" title="Perf Matters"></a>Perf Matters</h2><blockquote><p>Keep calm, profile your code, and always remember, Perf Matters.</p></blockquote><h1 id="About-Me-amp-amp-Blog"><a href="#About-Me-amp-amp-Blog" class="headerlink" title="About Me &amp;&amp; Blog"></a>About Me &amp;&amp; Blog</h1><p>Below is my personal intro and related links. I look forward to exchanging ideas with fellow professionals. “When three walk together, one can always be my teacher!”</p><ol><li><a href="https://www.androidperformance.com/en/about/">Blogger Intro</a></li><li><a href="https://www.androidperformance.com/en/2019/12/01/BlogMap/">Blog Content Navigation</a>: A guide for my blog content.</li><li><a href="https://www.androidperformance.com/en/2018/05/07/Android-performance-optimization-skills-and-tools/">Curated Excellent Blog Articles - Android Performance Optimization Must-Knows</a></li><li><a href="https://www.androidperformance.com/en/2023/12/30/the-performance/">Android Performance Optimization Knowledge Planet</a></li></ol><blockquote><p><strong>One walks faster alone, but a group walks further together.</strong></p></blockquote><p><img src="/en/images/WechatIMG581.webp" alt="Scan WeChat QR Code"></p>]]></content>
    
    
    <summary type="html">&lt;p&gt;Series Catalog:&lt;/p&gt;
&lt;ol&gt;
&lt;li&gt;&lt;a href=&quot;https://www.androidperformance.com/en/2015/04/19/Android-Performance-Patterns/&quot;&gt;Overview of Android Performance Patterns&lt;/a&gt;&lt;/li&gt;
&lt;li&gt;&lt;a href=&quot;https://www.androidperformance.com/en/2015/04/19/Android-Performance-Patterns-1/&quot;&gt;Android Performance Patterns: Render Performance&lt;/a&gt;&lt;/li&gt;
&lt;li&gt;&lt;a href=&quot;https://www.androidperformance.com/en/2015/04/19/Android-Performance-Patterns-2/&quot;&gt;Android Performance Patterns: Understanding Overdraw&lt;/a&gt;&lt;/li&gt;
&lt;li&gt;&lt;a href=&quot;https://www.androidperformance.com/en/2015/04/19/Android-Performance-Patterns-3/&quot;&gt;Android Performance Patterns: Understanding VSYNC&lt;/a&gt;&lt;/li&gt;
&lt;li&gt;&lt;a href=&quot;https://www.androidperformance.com/en/2015/04/19/Android-Performance-Patterns-4/&quot;&gt;Android Performance Patterns: Profile GPU Rendering&lt;/a&gt;&lt;/li&gt;
&lt;/ol&gt;
&lt;hr&gt;
&lt;blockquote&gt;
&lt;p&gt;Unbeknownst to most developers, there’s a simple hardware design that defines everything about how fast your application can draw things to the screen.&lt;/p&gt;
&lt;p&gt;You may have heard the term VSYNC - VSYNC stands for vertical synchronization and it’s an event that happens every time your screen starts to refresh the content it wants to show you.&lt;/p&gt;
&lt;p&gt;Effectively, VSYNC is the product of two components: Refresh Rate (how fast the hardware can refresh the screen), and Frames Per Second (how fast the GPU can draw images). In this video, &lt;a href=&quot;https://plus.google.com/+ColtMcAnlis&quot;&gt;Colt McAnlis&lt;/a&gt; walks through each of these topics and discusses where VSYNC (and the 16ms rendering barrier) comes from, and why it’s critical to understand if you want a silky smooth application.&lt;/p&gt;
&lt;/blockquote&gt;
&lt;h2 id=&quot;Basic-Concepts&quot;&gt;&lt;a href=&quot;#Basic-Concepts&quot; class=&quot;headerlink&quot; title=&quot;Basic Concepts&quot;&gt;&lt;/a&gt;Basic Concepts&lt;/h2&gt;&lt;p&gt;To develop a high-performance application, you first need to understand how the hardware works. The perceived speed of an app is often misunderstood as a raw hardware processing problem, but the real root is often rendering performance. To improve rendering, you must understand &lt;strong&gt;VSYNC&lt;/strong&gt;.&lt;/p&gt;</summary>


    <category term="Android" scheme="https://androidperformance.com/en/categories/Android/"/>
    
    
    <category term="Android" scheme="https://androidperformance.com/en/tags/Android/"/>
    
    <category term="Jank" scheme="https://androidperformance.com/en/tags/Jank/"/>
    
    <category term="Memory" scheme="https://androidperformance.com/en/tags/Memory/"/>
    
    <category term="Performance" scheme="https://androidperformance.com/en/tags/Performance/"/>
    
    <category term="RenderThread" scheme="https://androidperformance.com/en/tags/RenderThread/"/>
    
  </entry>
  
  <entry>
    <title>Android Performance Patterns: Understanding Overdraw</title>
    <link href="https://androidperformance.com/en/2015/04/19/Android-Performance-Patterns-2/"/>
    <id>https://androidperformance.com/en/2015/04/19/Android-Performance-Patterns-2/</id>
    <published>2015-04-19T07:38:48.000Z</published>
    <updated>2026-05-10T23:29:51.059Z</updated>
    
    <content type="html"><![CDATA[<p>Series Catalog:</p><ol><li><a href="https://www.androidperformance.com/en/2015/04/19/Android-Performance-Patterns/">Overview of Android Performance Patterns</a></li><li><a href="https://www.androidperformance.com/en/2015/04/19/Android-Performance-Patterns-1/">Android Performance Patterns: Render Performance</a></li><li><a href="https://www.androidperformance.com/en/2015/04/19/Android-Performance-Patterns-2/">Android Performance Patterns: Understanding Overdraw</a></li><li><a href="https://www.androidperformance.com/en/2015/04/19/Android-Performance-Patterns-3/">Android Performance Patterns: Understanding VSYNC</a></li><li><a href="https://www.androidperformance.com/en/2015/04/19/Android-Performance-Patterns-4/">Android Performance Patterns: Profile GPU Rendering</a></li></ol><hr><blockquote><p>One of the most problematic performance problems on Android is the easiest to create; thankfully, it’s also easy to fix.</p><p><strong>OVERDRAW</strong> is a term used to describe how many times a pixel has been re-drawn in a single frame of rendering. It’s a troublesome issue, because in most cases, pixels that are overdrawn do not end up contributing to the final rendered image. As such, it amounts to wasted work for your GPU and CPU.</p><p>Fixing overdraw has everything to do with using the available on-device tools, like Show GPU Overdraw, and then adjusting your view hierarchy in order to reduce areas where it may be occurring.</p></blockquote><h2 id="What-is-Overdraw"><a href="#What-is-Overdraw" class="headerlink" title="What is Overdraw?"></a>What is Overdraw?</h2><p>At the beginning of the video, the author uses a house painter as an analogy: painting a wall is hard work, and if you have to repaint it because you don’t like the color, the first layer was a waste of effort. Similarly, in your application, any work that doesn’t end up on the final screen is wasted. When you try to balance high performance with perfect design, you often run into a common performance issue: <strong>Overdraw</strong>!</p><p><strong>Overdraw</strong> represents a situation where a single pixel on the screen is painted more than once within a single frame. As shown in the image below, imagine a stack of overlapping cards. The active card is on top, while the inactive ones are buried beneath. This means the effort spent rendering those buried cards is wasted because they are invisible to the user. We are wasting GPU time rendering things that don’t contribute to the final image.</p><span id="more"></span><p>Debug GPU Overdraw is still available in Developer Options, but it only tells you where extra drawing may exist. It does not explain why a frame missed its deadline. A current workflow is to use Debug GPU Overdraw or Profile GPU Rendering to identify suspicious screens, use Layout Inspector to find redundant backgrounds, useless parents, View&#x2F;Compose hierarchy issues, and recomposition problems, then use Perfetto Frame Timeline&#x2F;System Trace to verify whether missed frames, CPU&#x2F;GPU&#x2F;SF waits, or main-thread draw cost actually improved.</p><p><img src="/en/images/performance-2/1.webp" alt="Overdraw Concept"></p><p>Modern layouts are a double-edged sword: they provide beautiful UIs but can lead to significant overdraw. To maximize performance, you must reduce <strong>Overdraw!</strong></p><p><img src="/en/images/performance-2/2.webp" alt="Performance vs Interface"></p><h2 id="Tracking-Overdraw"><a href="#Tracking-Overdraw" class="headerlink" title="Tracking Overdraw"></a>Tracking Overdraw</h2><p>Android provides on-device tools to visualize overdraw. In <code>Settings -&gt; Developer Options</code>, enable <strong>“Show GPU Overdraw”</strong>:</p><p><img src="/en/images/performance-2/3.webp" alt="Show GPU Overdraw Tool"></p><p>Android uses various colors to represent the degree of overdraw. If no overdraw occurs, you see the original color. Other colors represent different levels of excessive drawing:</p><ul><li><strong>Blue</strong>: 1x overdraw (pixel drawn 2 times)</li><li><strong>Green</strong>: 2x overdraw (pixel drawn 3 times)</li><li><strong>Light Red</strong>: 3x overdraw (pixel drawn 4 times)</li><li><strong>Dark Red</strong>: 4x or more overdraw (pixel drawn 5 or more times)</li></ul><p><img src="/en/images/performance-2/4.webp" alt="Overdraw Color Codes"></p><p>Your goal should be to minimize overdraw, aiming for more blue&#x2F;original colors rather than red:</p><p><img src="/en/images/performance-2/5.webp" alt="Good vs Bad Overdraw"></p><h2 id="Root-Causes-of-Overdraw"><a href="#Root-Causes-of-Overdraw" class="headerlink" title="Root Causes of Overdraw"></a>Root Causes of Overdraw</h2><p>While overdraw often comes from overlapping views, developers should pay special attention to <strong>unnecessary backgrounds</strong>.</p><p><img src="/en/images/performance-2/6.webp" alt="Inefficient Overdraw Example"></p><p>For instance, if every View in your hierarchy has its own background, you’ll end up like the first image. After removing unnecessary backgrounds (default window backgrounds, layout backgrounds, or invisible images&#x2F;text backgrounds), the result looks like the second image, with almost zero overdraw.</p><p><img src="/en/images/performance-2/7.webp" alt="Removing Unnecessary Backgrounds"></p><p>One simple trick is removing the default theme background of the window:</p><figure class="highlight java"><table><tr><td class="gutter"><pre><span class="line">1</span><br></pre></td><td class="code"><pre><span class="line"><span class="built_in">this</span>.getWindow().setBackgroundDrawableResource(android.R.color.transparent);</span><br></pre></td></tr></table></figure><h2 id="Perf-Matters"><a href="#Perf-Matters" class="headerlink" title="Perf Matters"></a>Perf Matters</h2><blockquote><p>Keep calm, profile your code, and always remember, Perf Matters.</p></blockquote><h2 id="Appendix"><a href="#Appendix" class="headerlink" title="Appendix"></a>Appendix</h2><p>For more in-depth reading on overdraw and its optimization, check out these two articles on my blog:</p><ul><li><a href="https://www.androidperformance.com/en/2014/10/20/android-performance-optimization-overdraw-1/">Android Overdraw Optimization: Basics</a></li><li><a href="https://www.androidperformance.com/en/2015/01/13/android-performance-optimization-overdraw-2/">Android Overdraw Optimization: Practice</a></li></ul><h1 id="About-Me-amp-amp-Blog"><a href="#About-Me-amp-amp-Blog" class="headerlink" title="About Me &amp;&amp; Blog"></a>About Me &amp;&amp; Blog</h1><p>Below is my personal intro and related links. I look forward to exchanging ideas with fellow professionals. “When three walk together, one can always be my teacher!”</p><ol><li><a href="https://www.androidperformance.com/en/about/">Blogger Intro</a></li><li><a href="https://www.androidperformance.com/en/2019/12/01/BlogMap/">Blog Content Navigation</a>: A guide for my blog content.</li><li><a href="https://www.androidperformance.com/en/2018/05/07/Android-performance-optimization-skills-and-tools/">Curated Excellent Blog Articles - Android Performance Optimization Must-Knows</a></li><li><a href="https://www.androidperformance.com/en/2023/12/30/the-performance/">Android Performance Optimization Knowledge Planet</a></li></ol><blockquote><p><strong>One walks faster alone, but a group walks further together.</strong></p></blockquote><p><img src="/en/images/WechatIMG581.webp" alt="Scan WeChat QR Code"></p>]]></content>
    
    
    <summary type="html">&lt;p&gt;Series Catalog:&lt;/p&gt;
&lt;ol&gt;
&lt;li&gt;&lt;a href=&quot;https://www.androidperformance.com/en/2015/04/19/Android-Performance-Patterns/&quot;&gt;Overview of Android Performance Patterns&lt;/a&gt;&lt;/li&gt;
&lt;li&gt;&lt;a href=&quot;https://www.androidperformance.com/en/2015/04/19/Android-Performance-Patterns-1/&quot;&gt;Android Performance Patterns: Render Performance&lt;/a&gt;&lt;/li&gt;
&lt;li&gt;&lt;a href=&quot;https://www.androidperformance.com/en/2015/04/19/Android-Performance-Patterns-2/&quot;&gt;Android Performance Patterns: Understanding Overdraw&lt;/a&gt;&lt;/li&gt;
&lt;li&gt;&lt;a href=&quot;https://www.androidperformance.com/en/2015/04/19/Android-Performance-Patterns-3/&quot;&gt;Android Performance Patterns: Understanding VSYNC&lt;/a&gt;&lt;/li&gt;
&lt;li&gt;&lt;a href=&quot;https://www.androidperformance.com/en/2015/04/19/Android-Performance-Patterns-4/&quot;&gt;Android Performance Patterns: Profile GPU Rendering&lt;/a&gt;&lt;/li&gt;
&lt;/ol&gt;
&lt;hr&gt;
&lt;blockquote&gt;
&lt;p&gt;One of the most problematic performance problems on Android is the easiest to create; thankfully, it’s also easy to fix.&lt;/p&gt;
&lt;p&gt;&lt;strong&gt;OVERDRAW&lt;/strong&gt; is a term used to describe how many times a pixel has been re-drawn in a single frame of rendering. It’s a troublesome issue, because in most cases, pixels that are overdrawn do not end up contributing to the final rendered image. As such, it amounts to wasted work for your GPU and CPU.&lt;/p&gt;
&lt;p&gt;Fixing overdraw has everything to do with using the available on-device tools, like Show GPU Overdraw, and then adjusting your view hierarchy in order to reduce areas where it may be occurring.&lt;/p&gt;
&lt;/blockquote&gt;
&lt;h2 id=&quot;What-is-Overdraw&quot;&gt;&lt;a href=&quot;#What-is-Overdraw&quot; class=&quot;headerlink&quot; title=&quot;What is Overdraw?&quot;&gt;&lt;/a&gt;What is Overdraw?&lt;/h2&gt;&lt;p&gt;At the beginning of the video, the author uses a house painter as an analogy: painting a wall is hard work, and if you have to repaint it because you don’t like the color, the first layer was a waste of effort. Similarly, in your application, any work that doesn’t end up on the final screen is wasted. When you try to balance high performance with perfect design, you often run into a common performance issue: &lt;strong&gt;Overdraw&lt;/strong&gt;!&lt;/p&gt;
&lt;p&gt;&lt;strong&gt;Overdraw&lt;/strong&gt; represents a situation where a single pixel on the screen is painted more than once within a single frame. As shown in the image below, imagine a stack of overlapping cards. The active card is on top, while the inactive ones are buried beneath. This means the effort spent rendering those buried cards is wasted because they are invisible to the user. We are wasting GPU time rendering things that don’t contribute to the final image.&lt;/p&gt;</summary>


    <category term="Android" scheme="https://androidperformance.com/en/categories/Android/"/>
    
    
    <category term="Android" scheme="https://androidperformance.com/en/tags/Android/"/>
    
    <category term="Memory" scheme="https://androidperformance.com/en/tags/Memory/"/>
    
    <category term="Performance" scheme="https://androidperformance.com/en/tags/Performance/"/>
    
    <category term="RenderThread" scheme="https://androidperformance.com/en/tags/RenderThread/"/>
    
    <category term="MAT" scheme="https://androidperformance.com/en/tags/MAT/"/>
    
  </entry>
  
  <entry>
    <title>Android Performance Patterns: Render Performance</title>
    <link href="https://androidperformance.com/en/2015/04/19/Android-Performance-Patterns-1/"/>
    <id>https://androidperformance.com/en/2015/04/19/Android-Performance-Patterns-1/</id>
    <published>2015-04-19T07:26:47.000Z</published>
    <updated>2026-05-10T23:29:51.059Z</updated>
    
    <content type="html"><![CDATA[<p>Series Catalog:</p><ol><li><a href="https://www.androidperformance.com/en/2015/04/19/Android-Performance-Patterns/">Overview of Android Performance Patterns</a></li><li><a href="https://www.androidperformance.com/en/2015/04/19/Android-Performance-Patterns-1/">Android Performance Patterns: Render Performance</a></li><li><a href="https://www.androidperformance.com/en/2015/04/19/Android-Performance-Patterns-2/">Android Performance Patterns: Understanding Overdraw</a></li><li><a href="https://www.androidperformance.com/en/2015/04/19/Android-Performance-Patterns-3/">Android Performance Patterns: Understanding VSYNC</a></li><li><a href="https://www.androidperformance.com/en/2015/04/19/Android-Performance-Patterns-4/">Android Performance Patterns: Profile GPU Rendering</a></li></ol><hr><blockquote><p>Rendering performance is all about how fast you can draw your activity, and get it updated on the screen. Success here means your users feeling like your application is smooth and responsive, which means that you’ve got to get all your logic completed, <em>and</em> all your rendering done in 16ms or less, each and every frame. But that might be a bit more difficult than you think.</p><p>In this video, <a href="https://plus.google.com/+ColtMcAnlis">Colt McAnlis</a> takes a look at what “rendering performance” means to developers, alongside some of the most common pitfalls that are ran into; and let’s not forget the important stuff: the tools that help you track down, and fix these issues before they become large problems.</p></blockquote><h2 id="Android-Rendering-Knowledge"><a href="#Android-Rendering-Knowledge" class="headerlink" title="Android Rendering Knowledge"></a>Android Rendering Knowledge</h2><p>When you think you’ve developed a world-changing app, your users might not agree. They might think your app is slow and laggy, failing to achieve the smoothness they expect, let alone changing the world. Recycle bin, here it comes! Wait! My app is perfectly smooth on my Nexus 5? How can you say it’s slow? If you know anything about Android fragmentation, you’d know that many low-end phones don’t have the powerful processor and GPU of a Nexus 5, nor do they have an unpolluted stock system.</p><p>If a large number of users complain that your app is laggy, don’t just blame their hardware. Sometimes the problem lies within the app itself, meaning your Android app has serious rendering performance issues. Only by understanding the root cause can you solve the problem effectively. Thus, knowing how Android rendering works is essential for any Android developer.</p><span id="more"></span><p>The “finish a frame within 16ms” rule is the typical 60Hz budget, not a fixed rule for every device. On 90Hz, 120Hz, and 144Hz displays, the frame budgets are about 11.11ms, 8.33ms, and 6.94ms. On high-refresh devices, treating only frames over 16ms as problematic is too loose. Today, Profile GPU Rendering is still useful for spotting trends on-device, but root-cause analysis should move to Perfetto Frame Timeline&#x2F;System Trace so you can see missed deadlines and whether MainThread, RenderThread, GPU, or SurfaceFlinger is late. To validate improvements, encode scrolling, transitions, or animation paths as Macrobenchmark <code>FrameTimingMetric</code> tests.</p><h2 id="Design-vs-Performance"><a href="#Design-vs-Performance" class="headerlink" title="Design vs Performance"></a>Design vs Performance</h2><p>Rendering issues are the most common problems you’ll encounter when building an app. On one hand, designers want to provide a supernatural experience; on the other hand, these flashy animations and views may not run smoothly on all Android phones. That’s where the problem lies.</p><p><img src="/en/images/performance-1/1.webp" alt="Design vs Performance"></p><h2 id="Drawing-Principles"><a href="#Drawing-Principles" class="headerlink" title="Drawing Principles"></a>Drawing Principles</h2><p>The Android system redraws your Activity every 16ms. This means your logic and screen updates must complete within 16ms to achieve 60 frames per second (we’ll have a dedicated topic on why it’s 60fps later). As shown below, when every frame completes within 16ms, the world is smooth.</p><p><img src="/en/images/performance-1/2.webp" alt="Draw Good"></p><p>However, if your app fails to complete a frame within 16ms—say it takes 24ms—you’ll experience what we call a <strong>Dropped Frame</strong> (Jank). The world becomes laggy.</p><p><img src="/en/images/performance-1/3.webp" alt="Draw Bad"></p><p>The system is ready to draw a new frame to the screen, but because the frame isn’t ready, no drawing operation occurs, and the screen doesn’t refresh. To the user, it feels like they’re staring at the same image for 32ms instead of 16ms. That’s a frame drop.</p><h2 id="Frame-Drops"><a href="#Frame-Drops" class="headerlink" title="Frame Drops"></a>Frame Drops</h2><p>Frame drops are a core user experience issue. Users easily perceive the stuttering caused by dropped frames, especially during interactions like list scrolling or typing. Users will immediately complain, and the next step is often uninstalling your app. Understanding the causes of frame drops is critical.</p><p>Unfortunately, many things can cause frame drops, such as:</p><ul><li><strong>Spending too much time redrawing most things in your view, wasting CPU cycles.</strong><br><img src="/en/images/performance-1/4.webp" alt="Too Much View"></li><li><strong>Having too many objects stacked together, spending too much time drawing objects the user can’t see.</strong><br><img src="/en/images/performance-1/5.webp" alt="Draw Hidden View"></li><li><strong>Having a bunch of animations repeating over and over, leading to massive CPU and GPU waste.</strong><br><img src="/en/images/performance-1/6.webp" alt="Too Much Animations"></li></ul><h2 id="Detection-and-Solution"><a href="#Detection-and-Solution" class="headerlink" title="Detection and Solution"></a>Detection and Solution</h2><p>Detecting and solving these issues depends heavily on your application architecture. Fortunately, we have many developer tools to help. Some tools can even trace down to specific lines of code or UI controls. These tools include but are not limited to:</p><ul><li><h4 id="Hierarchy-Viewer"><a href="#Hierarchy-Viewer" class="headerlink" title="Hierarchy Viewer"></a>Hierarchy Viewer</h4></li></ul><p><img src="/en/images/performance-1/7.webp" alt="Hierarchy View"><br>You can use Hierarchy Viewer to check if your view is too complex. If it is, you’re likely wasting time on overdraw and complex layouts.<br>Hierarchy Viewer is located in the Android Device Monitor. You can open it via <code>Window -&gt; Open Perspective -&gt; Hierarchy View</code>. While simple, it’s very effective. Spending time learning this tool pays off when troubleshooting issues. We’ll have a separate, more detailed tutorial on its usage.</p><p>The current counterpart is Android Studio Layout Inspector. It connects directly to the foreground debuggable process and shows the Component Tree, Attributes, recomposition information, and layout snapshots for View, Compose, or hybrid layouts. Use Layout Inspector first when investigating deep hierarchy, useless parents, invisible backgrounds, or excessive Compose recomposition instead of relying on Android Device Monitor.</p><ul><li><h4 id="On-Device-Tools-Profile-GPU-Rendering-Show-GPU-Overdraw-GPU-View-Updates"><a href="#On-Device-Tools-Profile-GPU-Rendering-Show-GPU-Overdraw-GPU-View-Updates" class="headerlink" title="On-Device Tools: Profile GPU Rendering, Show GPU Overdraw, GPU View Updates"></a>On-Device Tools: Profile GPU Rendering, Show GPU Overdraw, GPU View Updates</h4></li></ul><p><img src="/en/images/performance-1/8.webp" alt="On-Device Tools"><br>These options are in <code>Settings -&gt; Developer Options</code>. <strong>Profile GPU Rendering</strong> and <strong>GPU Overdraw</strong> are quite important and will be covered in separate topics. Here’s a brief mention of <strong>GPU View Updates</strong>: it flashes views inside windows when drawn with the GPU. As Android versions progress, more drawing operations are handled by the GPU (see <a href="http://developer.android.com/guide/topics/graphics/hardware-accel.html">hardware acceleration documentation</a>). When enabled, GPU-drawn areas are marked in red; areas not marked red are drawn by the CPU. This is also useful for checking the size of redrawn areas.</p><ul><li><h4 id="TraceView"><a href="#TraceView" class="headerlink" title="TraceView"></a>TraceView</h4></li></ul><p><img src="/en/images/performance-1/9.webp" alt="TraceView"><br>TraceView is an excellent tool for checking frame drops. While not mentioned in the video, it’s very important as it can precisely locate where time is spent in your code, down to individual function calls (both app and system functions). In modern Android Studio, TraceView has been improved and integrated into the Profiler, showing frame durations and function call stacks intuitively. Given its practicality, we’ll have a dedicated tutorial for it.</p><h2 id="Perf-Matters"><a href="#Perf-Matters" class="headerlink" title="Perf Matters"></a>Perf Matters</h2><blockquote><p>Keep calm, profile your code, and always remember, Perf Matters.</p></blockquote><h2 id="Summary"><a href="#Summary" class="headerlink" title="Summary"></a>Summary</h2><p>This is the first video of the series. It looks at Render Performance from a high level, covering basic concepts, causes, and troubleshooting tools. It focuses on the “Discovery” and “Localization” phases of the performance optimization workflow. Specific solutions aren’t discussed yet, as there is no universal fix—every app has its own unique issues. This aligns with the series’ goal: empowering you with the tools and principles to find your own solutions.</p><h1 id="About-Me-amp-amp-Blog"><a href="#About-Me-amp-amp-Blog" class="headerlink" title="About Me &amp;&amp; Blog"></a>About Me &amp;&amp; Blog</h1><p>Below is my personal intro and related links. I look forward to exchanging ideas with fellow professionals. “When three walk together, one can always be my teacher!”</p><ol><li><a href="https://www.androidperformance.com/en/about/">Blogger Intro</a></li><li><a href="https://www.androidperformance.com/en/2019/12/01/BlogMap/">Blog Content Navigation</a>: A guide for my blog content.</li><li><a href="https://www.androidperformance.com/en/2018/05/07/Android-performance-optimization-skills-and-tools/">Curated Excellent Blog Articles - Android Performance Optimization Must-Knows</a></li><li><a href="https://www.androidperformance.com/en/2023/12/30/the-performance/">Android Performance Optimization Knowledge Planet</a></li></ol><blockquote><p><strong>One walks faster alone, but a group walks further together.</strong></p></blockquote><p><img src="/en/images/WechatIMG581.webp" alt="Scan WeChat QR Code"></p>]]></content>
    
    
    <summary type="html">&lt;p&gt;Series Catalog:&lt;/p&gt;
&lt;ol&gt;
&lt;li&gt;&lt;a href=&quot;https://www.androidperformance.com/en/2015/04/19/Android-Performance-Patterns/&quot;&gt;Overview of Android Performance Patterns&lt;/a&gt;&lt;/li&gt;
&lt;li&gt;&lt;a href=&quot;https://www.androidperformance.com/en/2015/04/19/Android-Performance-Patterns-1/&quot;&gt;Android Performance Patterns: Render Performance&lt;/a&gt;&lt;/li&gt;
&lt;li&gt;&lt;a href=&quot;https://www.androidperformance.com/en/2015/04/19/Android-Performance-Patterns-2/&quot;&gt;Android Performance Patterns: Understanding Overdraw&lt;/a&gt;&lt;/li&gt;
&lt;li&gt;&lt;a href=&quot;https://www.androidperformance.com/en/2015/04/19/Android-Performance-Patterns-3/&quot;&gt;Android Performance Patterns: Understanding VSYNC&lt;/a&gt;&lt;/li&gt;
&lt;li&gt;&lt;a href=&quot;https://www.androidperformance.com/en/2015/04/19/Android-Performance-Patterns-4/&quot;&gt;Android Performance Patterns: Profile GPU Rendering&lt;/a&gt;&lt;/li&gt;
&lt;/ol&gt;
&lt;hr&gt;
&lt;blockquote&gt;
&lt;p&gt;Rendering performance is all about how fast you can draw your activity, and get it updated on the screen. Success here means your users feeling like your application is smooth and responsive, which means that you’ve got to get all your logic completed, &lt;em&gt;and&lt;/em&gt; all your rendering done in 16ms or less, each and every frame. But that might be a bit more difficult than you think.&lt;/p&gt;
&lt;p&gt;In this video, &lt;a href=&quot;https://plus.google.com/+ColtMcAnlis&quot;&gt;Colt McAnlis&lt;/a&gt; takes a look at what “rendering performance” means to developers, alongside some of the most common pitfalls that are ran into; and let’s not forget the important stuff: the tools that help you track down, and fix these issues before they become large problems.&lt;/p&gt;
&lt;/blockquote&gt;
&lt;h2 id=&quot;Android-Rendering-Knowledge&quot;&gt;&lt;a href=&quot;#Android-Rendering-Knowledge&quot; class=&quot;headerlink&quot; title=&quot;Android Rendering Knowledge&quot;&gt;&lt;/a&gt;Android Rendering Knowledge&lt;/h2&gt;&lt;p&gt;When you think you’ve developed a world-changing app, your users might not agree. They might think your app is slow and laggy, failing to achieve the smoothness they expect, let alone changing the world. Recycle bin, here it comes! Wait! My app is perfectly smooth on my Nexus 5? How can you say it’s slow? If you know anything about Android fragmentation, you’d know that many low-end phones don’t have the powerful processor and GPU of a Nexus 5, nor do they have an unpolluted stock system.&lt;/p&gt;
&lt;p&gt;If a large number of users complain that your app is laggy, don’t just blame their hardware. Sometimes the problem lies within the app itself, meaning your Android app has serious rendering performance issues. Only by understanding the root cause can you solve the problem effectively. Thus, knowing how Android rendering works is essential for any Android developer.&lt;/p&gt;</summary>


    <category term="Android" scheme="https://androidperformance.com/en/categories/Android/"/>
    
    
    <category term="Android" scheme="https://androidperformance.com/en/tags/Android/"/>
    
    <category term="Jank" scheme="https://androidperformance.com/en/tags/Jank/"/>
    
    <category term="Memory" scheme="https://androidperformance.com/en/tags/Memory/"/>
    
    <category term="Performance" scheme="https://androidperformance.com/en/tags/Performance/"/>
    
    <category term="RenderThread" scheme="https://androidperformance.com/en/tags/RenderThread/"/>
    
  </entry>
  
  <entry>
    <title>Overview of Android Performance Patterns</title>
    <link href="https://androidperformance.com/en/2015/04/19/Android-Performance-Patterns/"/>
    <id>https://androidperformance.com/en/2015/04/19/Android-Performance-Patterns/</id>
    <published>2015-04-19T07:20:35.000Z</published>
    <updated>2026-05-10T23:29:51.059Z</updated>
    
    <content type="html"><![CDATA[<p>Series Catalog:</p><ol><li><a href="https://www.androidperformance.com/en/2015/04/19/Android-Performance-Patterns/">Overview of Android Performance Patterns</a></li><li><a href="https://www.androidperformance.com/en/2015/04/19/Android-Performance-Patterns-1/">Android Performance Patterns: Render Performance</a></li><li><a href="https://www.androidperformance.com/en/2015/04/19/Android-Performance-Patterns-2/">Android Performance Patterns: Understanding Overdraw</a></li><li><a href="https://www.androidperformance.com/en/2015/04/19/Android-Performance-Patterns-3/">Android Performance Patterns: Understanding VSYNC</a></li><li><a href="https://www.androidperformance.com/en/2015/04/19/Android-Performance-Patterns-4/">Android Performance Patterns: Profile GPU Rendering</a></li></ol><hr><p>On January 6, 2015, Google officially released a series of short videos about Android performance optimization titled <strong>Android Performance Patterns</strong>. This series is available on <a href="https://www.youtube.com/playlist?list=PLWz5rJ2EKKc9CBxr3BVjPTPoDPLdPIFCE">YouTube</a>.</p><p><img src="/en/images/performance-0/1.jpg" alt="Android Performance Patterns Overview"></p><p>When rereading this series, separate the rendering concepts from the tooling entry points. Frame budgets, overdraw, VSYNC, and MainThread&#x2F;RenderThread cooperation are still foundational. The matching tools from that era, such as Hierarchy Viewer, TraceView, Android Device Monitor, and Google+ communities, are no longer the main workflow. Use Layout Inspector&#x2F;Compose Layout Inspector for View or Compose hierarchy inspection, Profile GPU Rendering and Debug GPU Overdraw for quick visual signals, Perfetto Frame Timeline&#x2F;System Trace for frame lifecycle, SurfaceFlinger, CPU scheduling, and Binder relationships, and Macrobenchmark <code>FrameTimingMetric</code> to turn scrolling or transition paths into regression tests.</p><p><strong>Official Introduction:</strong></p><blockquote><p>Android Performance Patterns is a collection of videos focused entirely on helping developers write faster, more performant Android Applications. On one side, it’s about peeling back the layers of the Android System, and exposing how things are working under the hood. On the other side, it’s about teaching you how the tools work, and what to look for in order to extract the right perf out of your app.</p><p>But at the end of the day, Android Performance Patterns is all about giving you the right resources at the right time to help make the fastest, smoothest, most awesome experience for your users. And that’s the whole point, right?</p></blockquote><p>In short, it’s a series of videos explaining Android performance. These videos are very short, typically between 3 to 5 minutes. The speakers talk very fast, which was quite a challenge for non-native listeners before subtitles were available. The good news is that these videos now have full subtitles.</p><p>While the videos are short, they are packed with information. A single sentence mentioned by the speaker might require hours of research to understand the underlying principle or how to use a specific debugging tool. This means the series doesn’t directly teach you “how to optimize your app” step-by-step; rather, it tells you <strong>what you need to know about Android performance so that you know which tools to use, what steps to take, and what goals to aim for.</strong></p><span id="more"></span><p>Since I have been researching Android performance optimization topics recently, I watched these videos several times as soon as they came out. I immediately had the idea of translating&#x2F;adapting this series into a blog series. After re-watching them, I realized that a mere translation wouldn’t be very meaningful. Every knowledge point mentioned can be expanded into a full blog post (or even several). Thus, this series of articles was born.</p><p>In each article, I will first list the knowledge points covered in the video and then explain them one by one. Some debugging tools might be detailed in separate posts due to their complexity.</p><p>Another person who inspired me to write this series is Hu Kai. His blog <a href="http://hukai.me/android-performance-patterns">http://hukai.me/android-performance-patterns</a> was among the first to translate this content into Chinese. His beautiful layout and high-quality translation helped the content spread widely. He is also the initiator of the <a href="https://github.com/kesenhoo/android-training-course-in-chinese">android-training-course-in-chinese</a> project on GitHub. I highly respect his passion for sharing. If you are not an Android developer or are not interested in technical details, you can simply read his overview for a quick understanding.</p><p>Below are some resources related to the Android Performance Patterns series:</p><ul><li>YouTube Playlist: <a href="https://www.youtube.com/playlist?list=PLWz5rJ2EKKc9CBxr3BVjPTPoDPLdPIFCE">Android Performance Patterns</a></li><li>Google+ Community (Legacy): Android Performance Patterns</li></ul><p>OK, let us start!!!</p><h1 id="About-Me-amp-amp-Blog"><a href="#About-Me-amp-amp-Blog" class="headerlink" title="About Me &amp;&amp; Blog"></a>About Me &amp;&amp; Blog</h1><p>Below is my personal intro and related links. I look forward to exchanging ideas with fellow professionals. “When three walk together, one can always be my teacher!”</p><ol><li><a href="https://www.androidperformance.com/en/about/">Blogger Intro</a></li><li><a href="https://www.androidperformance.com/en/2019/12/01/BlogMap/">Blog Content Navigation</a>: A guide for my blog content.</li><li><a href="https://www.androidperformance.com/en/2018/05/07/Android-performance-optimization-skills-and-tools/">Curated Excellent Blog Articles - Android Performance Optimization Must-Knows</a></li><li><a href="https://www.androidperformance.com/en/2023/12/30/the-performance/">Android Performance Optimization Knowledge Planet</a></li></ol><blockquote><p><strong>One walks faster alone, but a group walks further together.</strong></p></blockquote><p><img src="/en/images/WechatIMG581.webp" alt="Scan WeChat QR Code"></p>]]></content>
    
    
    <summary type="html">&lt;p&gt;Series Catalog:&lt;/p&gt;
&lt;ol&gt;
&lt;li&gt;&lt;a href=&quot;https://www.androidperformance.com/en/2015/04/19/Android-Performance-Patterns/&quot;&gt;Overview of Android Performance Patterns&lt;/a&gt;&lt;/li&gt;
&lt;li&gt;&lt;a href=&quot;https://www.androidperformance.com/en/2015/04/19/Android-Performance-Patterns-1/&quot;&gt;Android Performance Patterns: Render Performance&lt;/a&gt;&lt;/li&gt;
&lt;li&gt;&lt;a href=&quot;https://www.androidperformance.com/en/2015/04/19/Android-Performance-Patterns-2/&quot;&gt;Android Performance Patterns: Understanding Overdraw&lt;/a&gt;&lt;/li&gt;
&lt;li&gt;&lt;a href=&quot;https://www.androidperformance.com/en/2015/04/19/Android-Performance-Patterns-3/&quot;&gt;Android Performance Patterns: Understanding VSYNC&lt;/a&gt;&lt;/li&gt;
&lt;li&gt;&lt;a href=&quot;https://www.androidperformance.com/en/2015/04/19/Android-Performance-Patterns-4/&quot;&gt;Android Performance Patterns: Profile GPU Rendering&lt;/a&gt;&lt;/li&gt;
&lt;/ol&gt;
&lt;hr&gt;
&lt;p&gt;On January 6, 2015, Google officially released a series of short videos about Android performance optimization titled &lt;strong&gt;Android Performance Patterns&lt;/strong&gt;. This series is available on &lt;a href=&quot;https://www.youtube.com/playlist?list=PLWz5rJ2EKKc9CBxr3BVjPTPoDPLdPIFCE&quot;&gt;YouTube&lt;/a&gt;.&lt;/p&gt;
&lt;p&gt;&lt;img src=&quot;/en/images/performance-0/1.jpg&quot; alt=&quot;Android Performance Patterns Overview&quot;&gt;&lt;/p&gt;
&lt;p&gt;When rereading this series, separate the rendering concepts from the tooling entry points. Frame budgets, overdraw, VSYNC, and MainThread&amp;#x2F;RenderThread cooperation are still foundational. The matching tools from that era, such as Hierarchy Viewer, TraceView, Android Device Monitor, and Google+ communities, are no longer the main workflow. Use Layout Inspector&amp;#x2F;Compose Layout Inspector for View or Compose hierarchy inspection, Profile GPU Rendering and Debug GPU Overdraw for quick visual signals, Perfetto Frame Timeline&amp;#x2F;System Trace for frame lifecycle, SurfaceFlinger, CPU scheduling, and Binder relationships, and Macrobenchmark &lt;code&gt;FrameTimingMetric&lt;/code&gt; to turn scrolling or transition paths into regression tests.&lt;/p&gt;
&lt;p&gt;&lt;strong&gt;Official Introduction:&lt;/strong&gt;&lt;/p&gt;
&lt;blockquote&gt;
&lt;p&gt;Android Performance Patterns is a collection of videos focused entirely on helping developers write faster, more performant Android Applications. On one side, it’s about peeling back the layers of the Android System, and exposing how things are working under the hood. On the other side, it’s about teaching you how the tools work, and what to look for in order to extract the right perf out of your app.&lt;/p&gt;
&lt;p&gt;But at the end of the day, Android Performance Patterns is all about giving you the right resources at the right time to help make the fastest, smoothest, most awesome experience for your users. And that’s the whole point, right?&lt;/p&gt;
&lt;/blockquote&gt;
&lt;p&gt;In short, it’s a series of videos explaining Android performance. These videos are very short, typically between 3 to 5 minutes. The speakers talk very fast, which was quite a challenge for non-native listeners before subtitles were available. The good news is that these videos now have full subtitles.&lt;/p&gt;
&lt;p&gt;While the videos are short, they are packed with information. A single sentence mentioned by the speaker might require hours of research to understand the underlying principle or how to use a specific debugging tool. This means the series doesn’t directly teach you “how to optimize your app” step-by-step; rather, it tells you &lt;strong&gt;what you need to know about Android performance so that you know which tools to use, what steps to take, and what goals to aim for.&lt;/strong&gt;&lt;/p&gt;</summary>


    <category term="Android" scheme="https://androidperformance.com/en/categories/Android/"/>
    
    
    <category term="Android" scheme="https://androidperformance.com/en/tags/Android/"/>
    
    <category term="Memory" scheme="https://androidperformance.com/en/tags/Memory/"/>
    
    <category term="Performance" scheme="https://androidperformance.com/en/tags/Performance/"/>
    
    <category term="RenderThread" scheme="https://androidperformance.com/en/tags/RenderThread/"/>
    
    <category term="MAT" scheme="https://androidperformance.com/en/tags/MAT/"/>
    
  </entry>
  
  <entry>
    <title>Android Memory Optimization (3) - Viewing Original Bitmaps in MAT</title>
    <link href="https://androidperformance.com/en/2015/04/11/AndroidMemory-Open-Bitmap-Object-In-MAT/"/>
    <id>https://androidperformance.com/en/2015/04/11/AndroidMemory-Open-Bitmap-Object-In-MAT/</id>
    <published>2015-04-11T10:41:32.000Z</published>
    <updated>2026-05-10T23:29:51.061Z</updated>
    
    <content type="html"><![CDATA[<p>This is the final article in our MAT series, detailing how to reconstruct original images from memory snapshots to debug leaks.</p><ol><li><a href="https://www.androidperformance.com/en/2015/04/11/AndroidMemory-Usage-Of-MAT/">Android Memory Optimization (1) - Introduction to MAT</a></li><li><a href="https://www.androidperformance.com/en/2015/04/11/AndroidMemory-Usage-Of-MAT-Pro/">Android Memory Optimization (2) - Advanced MAT Usage</a></li><li><a href="https://www.androidperformance.com/en/2015/04/11/AndroidMemory-Open-Bitmap-Object-In-MAT/">Android Memory Optimization (3) - Viewing Original Bitmaps in MAT</a></li></ol><p>This article documents an older MAT technique for manually restoring Bitmap pixels from an offline heap, which is still useful when you need to identify the exact image being retained. The current investigation flow usually starts in Android Studio Memory Profiler: capture a heap dump, inspect retained size and references for Bitmap, BitmapDrawable, or image-cache objects, then export to MAT only when the offline evidence needs this manual reconstruction. If the issue involves native Bitmaps, textures, image-library caches, or system memory pressure, combine this with <code>dumpsys meminfo</code>, Perfetto&#x2F;native heap profiling, and cache statistics from the image library itself.</p><p>When using MAT to analyze Android memory, you’ll frequently encounter <code>Bitmap</code> and <code>BitmapDrawable$BitmapState</code> objects. In many cases, these Bitmaps consume the majority of the heap. Memory leaks caused by Bitmaps are especially critical and must be handled promptly. When a potential image-related leak is found, seeing the actual image contents can be invaluable for diagnosis.</p><p>This article explains how to restore a <code>Bitmap</code> array object in MAT back into a viewable image.</p><span id="more"></span><p><img src="/en/images/MAT_OpenBitmap/Image_1.webp" alt="Bitmap Object in MAT"></p><h2 id="1-Exporting-Raw-Bitmap-Data"><a href="#1-Exporting-Raw-Bitmap-Data" class="headerlink" title="1. Exporting Raw Bitmap Data"></a>1. Exporting Raw Bitmap Data</h2><p>In MAT’s <strong>Dominator Tree</strong> view, select a <code>Bitmap</code> object and check the <strong>Inspector</strong> pane:</p><p><img src="/en/images/MAT_OpenBitmap/Image_2.webp" alt="Bitmap Inspector"></p><p>The Inspector shows essential information: <code>mBuffer</code>, <code>mHeight</code>, <code>mWidth</code>, and <code>mNativeBitmap</code>. <strong>Take note of the width and height</strong>, as we’ll need them later.</p><p>The <code>mBuffer</code> is defined in <code>Bitmap.java</code>:</p><figure class="highlight java"><table><tr><td class="gutter"><pre><span class="line">1</span><br><span class="line">2</span><br><span class="line">3</span><br><span class="line">4</span><br><span class="line">5</span><br><span class="line">6</span><br><span class="line">7</span><br><span class="line">8</span><br><span class="line">9</span><br></pre></td><td class="code"><pre><span class="line"><span class="comment">/**</span></span><br><span class="line"><span class="comment"> * Backing buffer for the Bitmap.</span></span><br><span class="line"><span class="comment"> * Made public for quick access from drawing methods -- do NOT modify</span></span><br><span class="line"><span class="comment"> * from outside this class</span></span><br><span class="line"><span class="comment"> *</span></span><br><span class="line"><span class="comment"> * <span class="doctag">@hide</span></span></span><br><span class="line"><span class="comment"> */</span></span><br><span class="line"><span class="meta">@SuppressWarnings(&quot;UnusedDeclaration&quot;)</span> <span class="comment">// native code only</span></span><br><span class="line"><span class="keyword">public</span> <span class="type">byte</span>[] mBuffer;</span><br></pre></td></tr></table></figure><p>The pixel data is stored in this <code>byte[]</code> array. To export it, right-click either the <code>mBuffer</code> entry in the Inspector or the <code>byte[]</code> child of the Bitmap object in the Dominator Tree. Select <strong>Copy -&gt; Save Value To File</strong>:</p><p><img src="/en/images/MAT_OpenBitmap/Image_3.webp" alt="Save Value To File"></p><p>When saving, <strong>ensure the filename ends with the <code>.data</code> extension</strong> (or <code>.raw</code> for some tools).</p><h2 id="2-Opening-the-Raw-Data"><a href="#2-Opening-the-Raw-Data" class="headerlink" title="2. Opening the Raw Data"></a>2. Opening the Raw Data</h2><h3 id="Linux"><a href="#Linux" class="headerlink" title="Linux"></a>Linux</h3><p>Use the powerful image editor <strong>GIMP</strong>. Open GIMP and select <strong>File -&gt; Open</strong>. Choose your exported <code>.data</code> file. An attribute dialog will appear:</p><p><img src="/en/images/MAT_OpenBitmap/Image_4.webp" alt="GIMP Raw Data Import"></p><p>Set the <strong>Image Type</strong> to <strong>RGB Alpha</strong>. Enter the <strong>Width</strong> and <strong>Height</strong> precisely as you saw them in the MAT Inspector. Leave other settings at their defaults and click <strong>Open</strong>. GIMP will render the pixel data as an image.</p><h3 id="Mac-amp-Windows"><a href="#Mac-amp-Windows" class="headerlink" title="Mac &amp; Windows"></a>Mac &amp; Windows</h3><p>If you use <strong>PhotoShop</strong>, ensure you saved the file with a <code>.raw</code> extension. When opening, set the depth to <strong>32-bit</strong>, and provide the same width and height.</p><p>Alternatively, GIMP is also available for Mac and Windows. Using GIMP across all platforms provides a consistent, free, and feature-rich experience for this task.</p><h1 id="About-Me-amp-amp-Blog"><a href="#About-Me-amp-amp-Blog" class="headerlink" title="About Me &amp;&amp; Blog"></a>About Me &amp;&amp; Blog</h1><p>(Links and introduction)</p>]]></content>
    
    
    <summary type="html">&lt;p&gt;This is the final article in our MAT series, detailing how to reconstruct original images from memory snapshots to debug leaks.&lt;/p&gt;
&lt;ol&gt;
&lt;li&gt;&lt;a href=&quot;https://www.androidperformance.com/en/2015/04/11/AndroidMemory-Usage-Of-MAT/&quot;&gt;Android Memory Optimization (1) - Introduction to MAT&lt;/a&gt;&lt;/li&gt;
&lt;li&gt;&lt;a href=&quot;https://www.androidperformance.com/en/2015/04/11/AndroidMemory-Usage-Of-MAT-Pro/&quot;&gt;Android Memory Optimization (2) - Advanced MAT Usage&lt;/a&gt;&lt;/li&gt;
&lt;li&gt;&lt;a href=&quot;https://www.androidperformance.com/en/2015/04/11/AndroidMemory-Open-Bitmap-Object-In-MAT/&quot;&gt;Android Memory Optimization (3) - Viewing Original Bitmaps in MAT&lt;/a&gt;&lt;/li&gt;
&lt;/ol&gt;
&lt;p&gt;This article documents an older MAT technique for manually restoring Bitmap pixels from an offline heap, which is still useful when you need to identify the exact image being retained. The current investigation flow usually starts in Android Studio Memory Profiler: capture a heap dump, inspect retained size and references for Bitmap, BitmapDrawable, or image-cache objects, then export to MAT only when the offline evidence needs this manual reconstruction. If the issue involves native Bitmaps, textures, image-library caches, or system memory pressure, combine this with &lt;code&gt;dumpsys meminfo&lt;/code&gt;, Perfetto&amp;#x2F;native heap profiling, and cache statistics from the image library itself.&lt;/p&gt;
&lt;p&gt;When using MAT to analyze Android memory, you’ll frequently encounter &lt;code&gt;Bitmap&lt;/code&gt; and &lt;code&gt;BitmapDrawable$BitmapState&lt;/code&gt; objects. In many cases, these Bitmaps consume the majority of the heap. Memory leaks caused by Bitmaps are especially critical and must be handled promptly. When a potential image-related leak is found, seeing the actual image contents can be invaluable for diagnosis.&lt;/p&gt;
&lt;p&gt;This article explains how to restore a &lt;code&gt;Bitmap&lt;/code&gt; array object in MAT back into a viewable image.&lt;/p&gt;</summary>


    <category term="Android" scheme="https://androidperformance.com/en/categories/Android/"/>
    
    
    <category term="Android" scheme="https://androidperformance.com/en/tags/Android/"/>
    
    <category term="Memory" scheme="https://androidperformance.com/en/tags/Memory/"/>
    
    <category term="Performance" scheme="https://androidperformance.com/en/tags/Performance/"/>
    
    <category term="Linux" scheme="https://androidperformance.com/en/tags/Linux/"/>
    
    <category term="Java" scheme="https://androidperformance.com/en/tags/Java/"/>
    
  </entry>
  
  <entry>
    <title>Android Memory Optimization (2) - Advanced MAT Usage</title>
    <link href="https://androidperformance.com/en/2015/04/11/AndroidMemory-Usage-Of-MAT-Pro/"/>
    <id>https://androidperformance.com/en/2015/04/11/AndroidMemory-Usage-Of-MAT-Pro/</id>
    <published>2015-04-11T10:26:36.000Z</published>
    <updated>2026-05-10T23:29:51.061Z</updated>
    
    <content type="html"><![CDATA[<p>This is the second article in our MAT series, focusing on advanced techniques for analyzing memory issues in Java and Android applications.</p><ol><li><a href="https://www.androidperformance.com/en/2015/04/11/AndroidMemory-Usage-Of-MAT/">Android Memory Optimization (1) - Introduction to MAT</a></li><li><a href="https://www.androidperformance.com/en/2015/04/11/AndroidMemory-Usage-Of-MAT-Pro/">Android Memory Optimization (2) - Advanced MAT Usage</a></li><li><a href="https://www.androidperformance.com/en/2015/04/11/AndroidMemory-Open-Bitmap-Object-In-MAT/">Android Memory Optimization (3) - Viewing Original Bitmaps in MAT</a></li></ol><p>Histogram, Dominator Tree, and thread views in this article are still central heap-analysis concepts, but the capture and first-pass analysis entry point should be modernized. Start with Android Studio Memory Profiler heap dumps, call <code>Debug.dumpHprofData()</code> when you need a dump at a precise point, and use retained size, references, and Activity&#x2F;Fragment leak filters for the first pass. Export <code>.hprof</code> files to MAT only when offline large-file analysis is useful. For production or automated detection, use LeakCanary for leaks, and use <code>dumpsys meminfo</code>, Perfetto, or native allocation recording to fill in memory evidence outside the Java heap.</p><h1 id="Characteristics-of-Java-Memory-Leaks"><a href="#Characteristics-of-Java-Memory-Leaks" class="headerlink" title="Characteristics of Java Memory Leaks"></a>Characteristics of Java Memory Leaks</h1><ul><li>Main features: <strong>Reachable but Useless</strong>.</li><li>Useless: Objects created but not released after they are no longer needed.</li><li>Inefficient: Re-creating new objects for tasks where existing ones could be reused.</li></ul><h1 id="Advanced-MAT-Techniques"><a href="#Advanced-MAT-Techniques" class="headerlink" title="Advanced MAT Techniques"></a>Advanced MAT Techniques</h1><h2 id="Dumping-Memory-with-Android-Studio"><a href="#Dumping-Memory-with-Android-Studio" class="headerlink" title="Dumping Memory with Android Studio"></a>Dumping Memory with Android Studio</h2><p>Modern versions of Android Studio make capturing heap dumps easy:<br><img src="/en/images/MAT_Pro/MAT_1.webp" alt="Android Studio Memory Profiler"></p><span id="more"></span><p>Capture the hprof file, right-click to convert it to standard format, and open it in MAT.</p><blockquote><p><strong>Tip</strong>: Before capturing a heap dump, always manually click the <strong>Initiate GC</strong> button. This ensures your snapshot doesn’t include unreachable objects that are just waiting for a collection cycle.<br><img src="/en/images/MAT_Pro/MAT_2.webp" alt="Manually Trigger GC"></p></blockquote><h2 id="Unreachable-Objects"><a href="#Unreachable-Objects" class="headerlink" title="Unreachable Objects"></a>Unreachable Objects</h2><p>Unreachable objects are those that can be reclaimed by the GC but haven’t been because no collection has occurred yet. MAT can show these if the dump was taken without a preceding GC.<br><img src="/en/images/MAT_Pro/MAT_4.webp" alt="Unreachable Objects Histogram"></p><p>When you click <strong>Calculate Retained Size</strong>, you’ll notice that unreachable objects have a Retained Heap value of 0, which is expected.<br><img src="/en/images/MAT_Pro/MAT_6.webp" alt="Unreachable Objects with 0 Retained Heap"></p><h2 id="Histogram-Analysis"><a href="#Histogram-Analysis" class="headerlink" title="Histogram Analysis"></a>Histogram Analysis</h2><p>The Histogram is specialized for checking instance counts, particularly for your own classes.</p><ul><li>Sort by <strong>Percentage</strong> to quickly find the biggest memory consumers.</li><li>Group by different dimensions: <strong>Group by class</strong>, <strong>Group by class loader</strong>, or <strong>Group by package</strong>. Dominator Tree also supports these group types.</li><li>Comparing two Histograms over time is the best way to find leaking objects.</li><li><strong>Histogram vs. Dominator Tree</strong>: Histogram looks at memory from the perspective of <strong>classes</strong>, while Dominator Tree looks from the perspective of <strong>object instances</strong>. Dominator Tree is superior for understanding complex reference chains.</li></ul><p><img src="/en/images/MAT_Pro/MAT_7.webp" alt="Histogram Group by Package"></p><p>By grouping by package, you can isolate your own code and identify classes that are either reachable-but-useless or being recreated unnecessarily.</p><h2 id="Thread-Information"><a href="#Thread-Information" class="headerlink" title="Thread Information"></a>Thread Information</h2><p>MAT can display active threads:<br><img src="/en/images/MAT_Pro/MAT_9.webp" alt="Thread Overview"></p><p>This provides insights into:</p><ol><li>Threads that might be causing memory issues due to their stack size or held references.</li><li>An unusually high number of threads, which itself can be a memory&#x2F;performance issue.</li></ol><h2 id="Context-Menus-and-Help"><a href="#Context-Menus-and-Help" class="headerlink" title="Context Menus and Help"></a>Context Menus and Help</h2><p>Right-clicking any item in MAT reveals a wealth of analysis options:<br><img src="/en/images/MAT_Pro/MAT_12.webp" alt="Context Menu Options"></p><p>Use the <strong>Search Queries</strong> option (usually at the bottom) to look up the exact meaning of these commands. Often, these commands are just pre-configured SQL-like queries.</p><p>Key queries include:</p><ul><li><strong>List objects -&gt; with incoming references</strong>: Find what this object refers to.</li><li><strong>List objects -&gt; with outgoing references</strong>: Find what objects refer to this one.</li><li><strong>Path To GC Roots -&gt; exclude all phantom&#x2F;weak&#x2F;soft etc. references</strong>: Show the path from a GC Root via <strong>Strong References</strong> only. Since soft&#x2F;weak&#x2F;phantom references can be cleared by the JVM, a leak is almost always caused by a persistent strong reference.</li><li><strong>Merge Shortest path to GC root</strong>: Find the common path from a GC Root to a group of objects.</li></ul><h2 id="Debugging-Bitmaps"><a href="#Debugging-Bitmaps" class="headerlink" title="Debugging Bitmaps"></a>Debugging Bitmaps</h2><p>In many Android apps, Bitmaps occupy the majority of the heap, especially on 2K&#x2F;4K screens where a single Bitmap can exceed 20MB.</p><p>MAT allows you to export the raw <code>byte[]</code> data of a Bitmap to a file, which can then be viewed with third-party tools. This is a game-changer for identifying which images are leaking. See <a href="https://www.androidperformance.com/en/2015/04/11/AndroidMemory-Open-Bitmap-Object-In-MAT/">Viewing Original Bitmaps in MAT</a> for the full workflow.</p><h2 id="Debugging-ArrayLists"><a href="#Debugging-ArrayLists" class="headerlink" title="Debugging ArrayLists"></a>Debugging ArrayLists</h2><p>Checking content in an <code>ArrayList</code> via standard outgoing references can be tedious as it exposes the internal array structure.<br><img src="/en/images/MAT_Pro/MAT_14.webp" alt="ArrayList Internal Structure"></p><p>Instead, use MAT’s <strong>Extract List Values</strong> feature for a much more intuitive view:<br><img src="/en/images/MAT_Pro/MAT_16.webp" alt="Extract List Values Result"></p><h2 id="Big-Drops-In-Dominator-Tree"><a href="#Big-Drops-In-Dominator-Tree" class="headerlink" title="Big Drops In Dominator Tree"></a>Big Drops In Dominator Tree</h2><p>The “Big Drops In Dominator Tree” tool identifies accumulation points. It highlights objects where there is a large difference between the retained size of a parent and its children. These are typically places where many small objects are being aggregated under one parent object, indicating a potential hotspot.</p><p><img src="/en/images/MAT_Pro/MAT_17.webp" alt="Big Drops In Dominator Tree"></p><h1 id="About-Me-amp-amp-Blog"><a href="#About-Me-amp-amp-Blog" class="headerlink" title="About Me &amp;&amp; Blog"></a>About Me &amp;&amp; Blog</h1><p>(Links and introduction)</p>]]></content>
    
    
    <summary type="html">&lt;p&gt;This is the second article in our MAT series, focusing on advanced techniques for analyzing memory issues in Java and Android applications.&lt;/p&gt;
&lt;ol&gt;
&lt;li&gt;&lt;a href=&quot;https://www.androidperformance.com/en/2015/04/11/AndroidMemory-Usage-Of-MAT/&quot;&gt;Android Memory Optimization (1) - Introduction to MAT&lt;/a&gt;&lt;/li&gt;
&lt;li&gt;&lt;a href=&quot;https://www.androidperformance.com/en/2015/04/11/AndroidMemory-Usage-Of-MAT-Pro/&quot;&gt;Android Memory Optimization (2) - Advanced MAT Usage&lt;/a&gt;&lt;/li&gt;
&lt;li&gt;&lt;a href=&quot;https://www.androidperformance.com/en/2015/04/11/AndroidMemory-Open-Bitmap-Object-In-MAT/&quot;&gt;Android Memory Optimization (3) - Viewing Original Bitmaps in MAT&lt;/a&gt;&lt;/li&gt;
&lt;/ol&gt;
&lt;p&gt;Histogram, Dominator Tree, and thread views in this article are still central heap-analysis concepts, but the capture and first-pass analysis entry point should be modernized. Start with Android Studio Memory Profiler heap dumps, call &lt;code&gt;Debug.dumpHprofData()&lt;/code&gt; when you need a dump at a precise point, and use retained size, references, and Activity&amp;#x2F;Fragment leak filters for the first pass. Export &lt;code&gt;.hprof&lt;/code&gt; files to MAT only when offline large-file analysis is useful. For production or automated detection, use LeakCanary for leaks, and use &lt;code&gt;dumpsys meminfo&lt;/code&gt;, Perfetto, or native allocation recording to fill in memory evidence outside the Java heap.&lt;/p&gt;
&lt;h1 id=&quot;Characteristics-of-Java-Memory-Leaks&quot;&gt;&lt;a href=&quot;#Characteristics-of-Java-Memory-Leaks&quot; class=&quot;headerlink&quot; title=&quot;Characteristics of Java Memory Leaks&quot;&gt;&lt;/a&gt;Characteristics of Java Memory Leaks&lt;/h1&gt;&lt;ul&gt;
&lt;li&gt;Main features: &lt;strong&gt;Reachable but Useless&lt;/strong&gt;.&lt;/li&gt;
&lt;li&gt;Useless: Objects created but not released after they are no longer needed.&lt;/li&gt;
&lt;li&gt;Inefficient: Re-creating new objects for tasks where existing ones could be reused.&lt;/li&gt;
&lt;/ul&gt;
&lt;h1 id=&quot;Advanced-MAT-Techniques&quot;&gt;&lt;a href=&quot;#Advanced-MAT-Techniques&quot; class=&quot;headerlink&quot; title=&quot;Advanced MAT Techniques&quot;&gt;&lt;/a&gt;Advanced MAT Techniques&lt;/h1&gt;&lt;h2 id=&quot;Dumping-Memory-with-Android-Studio&quot;&gt;&lt;a href=&quot;#Dumping-Memory-with-Android-Studio&quot; class=&quot;headerlink&quot; title=&quot;Dumping Memory with Android Studio&quot;&gt;&lt;/a&gt;Dumping Memory with Android Studio&lt;/h2&gt;&lt;p&gt;Modern versions of Android Studio make capturing heap dumps easy:&lt;br&gt;&lt;img src=&quot;/en/images/MAT_Pro/MAT_1.webp&quot; alt=&quot;Android Studio Memory Profiler&quot;&gt;&lt;/p&gt;</summary>


    <category term="Android" scheme="https://androidperformance.com/en/categories/Android/"/>
    
    
    <category term="Android" scheme="https://androidperformance.com/en/tags/Android/"/>
    
    <category term="Memory" scheme="https://androidperformance.com/en/tags/Memory/"/>
    
    <category term="Performance" scheme="https://androidperformance.com/en/tags/Performance/"/>
    
    <category term="Java" scheme="https://androidperformance.com/en/tags/Java/"/>
    
    <category term="MAT" scheme="https://androidperformance.com/en/tags/MAT/"/>
    
  </entry>
  
  <entry>
    <title>Android Memory Optimization (1) - Getting Started with MAT</title>
    <link href="https://androidperformance.com/en/2015/04/11/AndroidMemory-Usage-Of-MAT/"/>
    <id>https://androidperformance.com/en/2015/04/11/AndroidMemory-Usage-Of-MAT/</id>
    <published>2015-04-11T10:10:29.000Z</published>
    <updated>2026-05-10T23:29:51.061Z</updated>
    
    <content type="html"><![CDATA[<p>This is the first article in the series on using the MAT tool. This series consists of three articles, detailing how to use MAT to analyze memory issues, whether they are Java application memory issues or Android application memory issues:</p><ol><li><a href="/en/2015/04/11/AndroidMemory-Usage-Of-MAT/">Android Memory Optimization (1) - Getting Started with MAT</a></li><li><a href="/en/2015/04/11/AndroidMemory-Usage-Of-MAT-Pro/">Android Memory Optimization (2) - Advanced MAT Usage</a></li><li><a href="/en/2015/04/11/AndroidMemory-Open-Bitmap-Object-In-MAT/">Android Memory Optimization (3) - Opening Original Bitmap Images in MAT</a></li></ol><p>The MAT techniques in this series are still useful for learning Java heap analysis, Dominator Tree, Retained Size, and reference chains, but the default capture flow has changed. The older path was Eclipse&#x2F;DDMS exporting an Android HPROF and <code>hprof-conv</code> converting it for MAT. The current first stop should be Android Studio Memory Profiler: capture a heap dump, inspect class&#x2F;package grouping, retained size, and references there, then export to MAT only when you need offline analysis of a large HPROF or a more specialized Dominator Tree workflow. Use LeakCanary for leak detection, and combine <code>dumpsys meminfo</code>, Android Studio native allocation recording, or Perfetto native heap profiling for system and native memory issues instead of relying on MAT alone.</p><h1 id="Introduction-to-MAT"><a href="#Introduction-to-MAT" class="headerlink" title="Introduction to MAT"></a>Introduction to MAT</h1><h2 id="What-is-MAT"><a href="#What-is-MAT" class="headerlink" title="What is MAT?"></a>What is MAT?</h2><p>MAT (Memory Analyzer Tool), a memory analysis tool based on Eclipse, is a fast and feature-rich JAVA heap analysis tool. It helps us find memory leaks and reduce memory consumption. Using the memory analysis tool to analyze numerous objects, quickly calculate the size occupied by objects in memory, see who is preventing the garbage collector from reclaiming, and visually view the objects that may cause this result through reports.</p><p><img src="/en/images/MAT/MAT_Intro.webp" alt="image"></p><p>Of course, MAT also has an independent version that doesn’t rely on Eclipse, but this version requires converting the file generated by DDMS before it can be opened in the standalone version of MAT when debugging Android memory. However, the Android SDK already provides this Tool, so it is also very convenient to use.</p><span id="more"></span><h2 id="Download-and-Installation-of-MAT-Tool"><a href="#Download-and-Installation-of-MAT-Tool" class="headerlink" title="Download and Installation of MAT Tool"></a>Download and Installation of MAT Tool</h2><p>Here is the download address for MAT: <a href="https://eclipse.org/mat/downloads.php">https://eclipse.org/mat/downloads.php</a>. There are three choices available when downloading:</p><p><img src="/en/images/MAT/MAT_Download.webp" alt="image"></p><ul><li>Update Site: This method will be followed by a URL: such as <a href="http://download.eclipse.org/mat/1.4/update-site/">http://download.eclipse.org/mat/1.4/update-site/</a> . Students who have installed Eclipse plugins should know that just copy this URL to the Install New Software of the corresponding Eclipse to download online.</li></ul><p><img src="/en/images/MAT/MAT_Eclipse_Install.webp" alt="image"></p><ul><li>Archived Update Site: The installation location of this method is similar to the previous one, except that the first one is an online download, and this one uses an offline package for updating. The disadvantage of this method is that when the plugin is updated, the offline package needs to be re-downloaded, while the first method can be updated online.</li><li>Stand-alone Eclipse RCP Applications: This method uses MAT as an independent tool and no longer relies on Eclipse. It is suitable for students who do not use Eclipse but use Android Studio. The troublesome part of this method is that the file exported by DDMS needs to be converted before it can be opened in MAT.</li></ul><p>After downloading and installing, you can use MAT for actual operations.</p><h1 id="Common-Bad-Code-Causing-Memory-Leaks-in-Android-Java"><a href="#Common-Bad-Code-Causing-Memory-Leaks-in-Android-Java" class="headerlink" title="Common Bad Code Causing Memory Leaks in Android (Java)"></a>Common Bad Code Causing Memory Leaks in Android (Java)</h1><h2 id="Android-Memory"><a href="#Android-Memory" class="headerlink" title="Android Memory"></a>Android Memory</h2><p>Before using the MAT tool, one must have a basic understanding of Android’s memory allocation method, be sensitive to code that easily causes memory leaks, and troubleshooting memory leaks at the code level contributes to memory usage.</p><p>Android is mainly used in embedded devices, and due to some well-known limitations, embedded devices usually do not have high configurations, especially memory is relatively limited. If the code we write has too many improper uses of memory, it will inevitably make our device run slowly or even crash. In order for Android applications to run safely and quickly, each Android application uses a dedicated Dalvik virtual machine instance to run. It is hatched by the Zygote service process, meaning each application runs in its own process. On the one hand, if a memory leak problem occurs during the running of the program, it will only cause its own process to be killed without affecting other processes (if system processes like system_process have problems, it will cause the system to restart). On the other hand, Android allocates different memory usage limits for different types of processes. If the memory used by the application process exceeds this limit, it will be regarded as a memory leak by the system and killed.</p><h2 id="Common-Cases-of-Improper-Memory-Usage"><a href="#Common-Cases-of-Improper-Memory-Usage" class="headerlink" title="Common Cases of Improper Memory Usage"></a>Common Cases of Improper Memory Usage</h2><h3 id="Cursor-Not-Closed-After-Querying-Database"><a href="#Cursor-Not-Closed-After-Querying-Database" class="headerlink" title="Cursor Not Closed After Querying Database"></a>Cursor Not Closed After Querying Database</h3><p>Description:<br>The program often performs database query operations, but there are often cases where the Cursor is not closed after use. If our query result set is relatively small, the memory consumption is not easily detected. Memory problems will only reappear under long-term large-scale operations. This will bring difficulties and risks to future testing and troubleshooting.<br>Sample Code:</p><figure class="highlight java"><table><tr><td class="gutter"><pre><span class="line">1</span><br><span class="line">2</span><br><span class="line">3</span><br><span class="line">4</span><br></pre></td><td class="code"><pre><span class="line"><span class="type">Cursor</span> <span class="variable">cursor</span> <span class="operator">=</span> getContentResolver().query(uri ...);</span><br><span class="line"><span class="keyword">if</span> (cursor.moveToNext()) &#123;</span><br><span class="line">    <span class="comment">// ...</span></span><br><span class="line">&#125;</span><br></pre></td></tr></table></figure><p>Corrected Sample Code:</p><figure class="highlight java"><table><tr><td class="gutter"><pre><span class="line">1</span><br><span class="line">2</span><br><span class="line">3</span><br><span class="line">4</span><br><span class="line">5</span><br><span class="line">6</span><br><span class="line">7</span><br><span class="line">8</span><br><span class="line">9</span><br><span class="line">10</span><br><span class="line">11</span><br><span class="line">12</span><br><span class="line">13</span><br><span class="line">14</span><br><span class="line">15</span><br></pre></td><td class="code"><pre><span class="line"><span class="type">Cursor</span> <span class="variable">cursor</span> <span class="operator">=</span> <span class="literal">null</span>;</span><br><span class="line"><span class="keyword">try</span> &#123;</span><br><span class="line">  cursor = getContentResolver().query(uri ...);</span><br><span class="line"><span class="keyword">if</span> (cursor != <span class="literal">null</span> &amp;&amp; cursor.moveToNext()) &#123;</span><br><span class="line">... ...</span><br><span class="line">&#125;</span><br><span class="line">&#125; <span class="keyword">finally</span> &#123;</span><br><span class="line"><span class="keyword">if</span> (cursor != <span class="literal">null</span>) &#123;</span><br><span class="line"><span class="keyword">try</span> &#123;</span><br><span class="line">cursor.close();</span><br><span class="line">&#125; <span class="keyword">catch</span> (Exception e) &#123;</span><br><span class="line"><span class="comment">//ignore this</span></span><br><span class="line">&#125;</span><br><span class="line">&#125;</span><br><span class="line">&#125;</span><br></pre></td></tr></table></figure><p>&#96;</p><h3 id="Not-Using-Cached-convertView-When-Constructing-Adapter"><a href="#Not-Using-Cached-convertView-When-Constructing-Adapter" class="headerlink" title="Not Using Cached convertView When Constructing Adapter"></a>Not Using Cached convertView When Constructing Adapter</h3><p>Description: Taking constructing BaseAdapter of ListView as an example, the BaseAdapter provides the method:</p><figure class="highlight java"><table><tr><td class="gutter"><pre><span class="line">1</span><br></pre></td><td class="code"><pre><span class="line"><span class="keyword">public</span> View <span class="title function_">getView</span><span class="params">(<span class="type">int</span> position, View convertView, ViewGroup parent)</span></span><br></pre></td></tr></table></figure><p>To provide the view object needed for each item to ListView. Initially, ListView will instantiate a certain number of view objects from BaseAdapter based on the current screen layout, and at the same time, ListView will cache these view objects. When scrolling up the ListView, the view object of the list item originally located at the top will be recycled and then used to construct the newly appearing list item at the bottom. This construction process is completed by the getView() method. The second parameter View convertView of getView() is the cached view object of the list item (if there is no view object in the cache during initialization, convertView is null).<br>From this, we can see that if we do not use convertView but re-instantiate a View object in getView() every time, it wastes resources and time, and will also make memory usage larger and larger. The process of ListView recycling the view object of list item can be viewed in: android.widget.AbsListView.java –&gt; void addScrapView(View scrap) method.</p><p>Sample Code:</p><figure class="highlight java"><table><tr><td class="gutter"><pre><span class="line">1</span><br><span class="line">2</span><br><span class="line">3</span><br><span class="line">4</span><br><span class="line">5</span><br></pre></td><td class="code"><pre><span class="line"><span class="keyword">public</span> View <span class="title function_">getView</span><span class="params">(<span class="type">int</span> position, View convertView, ViewGroup parent)</span> &#123;</span><br><span class="line"> <span class="type">View</span> <span class="variable">view</span> <span class="operator">=</span> <span class="keyword">new</span> <span class="title class_">Xxx</span>(...);</span><br><span class="line"> ... ...</span><br><span class="line"> <span class="keyword">return</span> view;</span><br><span class="line">&#125;</span><br></pre></td></tr></table></figure><p>&#96;<br>Corrected Sample Code:</p><figure class="highlight java"><table><tr><td class="gutter"><pre><span class="line">1</span><br><span class="line">2</span><br><span class="line">3</span><br><span class="line">4</span><br><span class="line">5</span><br><span class="line">6</span><br><span class="line">7</span><br><span class="line">8</span><br><span class="line">9</span><br><span class="line">10</span><br><span class="line">11</span><br><span class="line">12</span><br></pre></td><td class="code"><pre><span class="line"><span class="keyword">public</span> View <span class="title function_">getView</span><span class="params">(<span class="type">int</span> position, View convertView, ViewGroup parent)</span> &#123;</span><br><span class="line"> <span class="type">View</span> <span class="variable">view</span> <span class="operator">=</span> <span class="literal">null</span>;</span><br><span class="line"> <span class="keyword">if</span> (convertView != <span class="literal">null</span>) &#123;</span><br><span class="line"> view = convertView;</span><br><span class="line"> populate(view, getItem(position));</span><br><span class="line"> ...</span><br><span class="line"> &#125; <span class="keyword">else</span> &#123;</span><br><span class="line"> view = <span class="keyword">new</span> <span class="title class_">Xxx</span>(...);</span><br><span class="line"> ...</span><br><span class="line"> &#125;</span><br><span class="line"> <span class="keyword">return</span> view;</span><br><span class="line">&#125;</span><br></pre></td></tr></table></figure><p>Regarding the use and optimization of ListView, you can refer to these two articles:</p><ul><li><a href="http://www.vogella.com/tutorials/AndroidListView/article.html">Using lists in Android (ListView) - Tutorial</a></li><li><a href="http://developer.android.com/training/improving-layouts/smooth-scrolling.html#ViewHolder">Making ListView Scrolling Smooth</a></li></ul><h3 id="Bitmap-Object-Not-Calling-recycle-to-Release-Memory-When-Not-in-Use"><a href="#Bitmap-Object-Not-Calling-recycle-to-Release-Memory-When-Not-in-Use" class="headerlink" title="Bitmap Object Not Calling recycle() to Release Memory When Not in Use"></a>Bitmap Object Not Calling recycle() to Release Memory When Not in Use</h3><p>Description: Sometimes we manually operate Bitmap objects. If a Bitmap object occupies a lot of memory, when it is no longer used, you can call the Bitmap.recycle() method to reclaim the memory occupied by the pixels of this object.<br>In addition, regarding Android development in the latest versions, using the following method can also release the memory occupied by this Bitmap.</p><figure class="highlight java"><table><tr><td class="gutter"><pre><span class="line">1</span><br><span class="line">2</span><br><span class="line">3</span><br><span class="line">4</span><br><span class="line">5</span><br></pre></td><td class="code"><pre><span class="line">Bitmap bitmap ;</span><br><span class="line"> ...</span><br><span class="line"> <span class="comment">// bitmap initialization and usage</span></span><br><span class="line"> ...</span><br><span class="line"> bitmap = <span class="literal">null</span>;</span><br></pre></td></tr></table></figure><h3 id="Releasing-References-to-Objects"><a href="#Releasing-References-to-Objects" class="headerlink" title="Releasing References to Objects"></a>Releasing References to Objects</h3><p>Description: This situation is troublesome to describe, let’s take two examples to illustrate.</p><p>Example A:<br>Suppose we have the following operation</p><figure class="highlight java"><table><tr><td class="gutter"><pre><span class="line">1</span><br><span class="line">2</span><br><span class="line">3</span><br><span class="line">4</span><br><span class="line">5</span><br><span class="line">6</span><br><span class="line">7</span><br><span class="line">8</span><br><span class="line">9</span><br><span class="line">10</span><br><span class="line">11</span><br><span class="line">12</span><br><span class="line">13</span><br><span class="line">14</span><br><span class="line">15</span><br></pre></td><td class="code"><pre><span class="line"><span class="keyword">public</span> <span class="keyword">class</span> <span class="title class_">DemoActivity</span> <span class="keyword">extends</span> <span class="title class_">Activity</span> &#123;</span><br><span class="line">... ...</span><br><span class="line"><span class="keyword">private</span> <span class="type">Handler</span> <span class="variable">mHandler</span> <span class="operator">=</span> ...</span><br><span class="line"><span class="keyword">private</span> Object obj;</span><br><span class="line"><span class="keyword">public</span> <span class="keyword">void</span> <span class="title function_">operation</span><span class="params">()</span> &#123;</span><br><span class="line"> obj = initObj();</span><br><span class="line"> ...</span><br><span class="line"> [Mark]</span><br><span class="line"> mHandler.post(<span class="keyword">new</span> <span class="title class_">Runnable</span>() &#123;</span><br><span class="line">        <span class="keyword">public</span> <span class="keyword">void</span> <span class="title function_">run</span><span class="params">()</span> &#123;</span><br><span class="line">         useObj(obj);</span><br><span class="line">        &#125;</span><br><span class="line"> &#125;);</span><br><span class="line">&#125;</span><br><span class="line">&#125;</span><br></pre></td></tr></table></figure><p>We have a member variable obj. In operation(), we hope to post the operation of processing the obj instance to the MessageQueue of a certain thread. In the code above, even if the thread where mHandler holds finishes using the object referenced by obj, this object will still not be garbage collected because DemoActivity.obj still holds a reference to this object. So if this object is no longer used in DemoActivity, the reference to the object can be released at the location of [Mark], and the code can be modified to:</p><figure class="highlight java"><table><tr><td class="gutter"><pre><span class="line">1</span><br><span class="line">2</span><br><span class="line">3</span><br><span class="line">4</span><br><span class="line">5</span><br><span class="line">6</span><br><span class="line">7</span><br><span class="line">8</span><br><span class="line">9</span><br><span class="line">10</span><br><span class="line">11</span><br></pre></td><td class="code"><pre><span class="line"><span class="keyword">public</span> <span class="keyword">void</span> <span class="title function_">operation</span><span class="params">()</span> &#123;</span><br><span class="line">obj = initObj();</span><br><span class="line">...</span><br><span class="line"><span class="keyword">final</span> <span class="type">Object</span> <span class="variable">o</span> <span class="operator">=</span> obj;</span><br><span class="line">obj = <span class="literal">null</span>;</span><br><span class="line">mHandler.post(<span class="keyword">new</span> <span class="title class_">Runnable</span>() &#123;</span><br><span class="line">    <span class="keyword">public</span> <span class="keyword">void</span> <span class="title function_">run</span><span class="params">()</span> &#123;</span><br><span class="line">        useObj(o);</span><br><span class="line">    &#125;</span><br><span class="line">&#125;</span><br><span class="line">&#125;</span><br></pre></td></tr></table></figure><p>Example B:<br>Suppose we want to listen to the telephone service in the system to obtain some information (such as signal strength, etc.) on the lock screen (LockScreen), we can define a PhoneStateListener object in the LockScreen and register it to the TelephonyManager service. For the LockScreen object, a LockScreen object is created when the lock screen interface needs to be displayed, and the LockScreen object is released when the lock screen interface disappears.</p><p>However, if we forget to cancel the PhoneStateListener object we registered previously when releasing the LockScreen object, it will cause the LockScreen to be unable to be garbage collected. If the lock screen interface is continuously displayed and disappears, it will eventually cause OutOfMemory due to a large number of LockScreen objects being unable to be recycled, causing the system_process process to hang.</p><p>In short, when a shorter lifecycle object A is held by a longer lifecycle object B, the reference to A should be cleared in B when A’s lifecycle ends.</p><h3 id="Others"><a href="#Others" class="headerlink" title="Others"></a>Others</h3><p>The most typical situation where resources need to be released in Android applications involves the Activity lifecycle, where resources need to be appropriately released in the onPause(), onStop(), and onDestroy() methods. Since this situation is basic, it will not be explained in detail here. You can check the official documentation on the Activity lifecycle to clarify when to release which resources.</p><p>Some other examples will be added in supplementary versions.</p><h1 id="Using-MAT-for-Memory-Debugging"><a href="#Using-MAT-for-Memory-Debugging" class="headerlink" title="Using MAT for Memory Debugging"></a>Using MAT for Memory Debugging</h1><h2 id="Obtaining-HPROF-File"><a href="#Obtaining-HPROF-File" class="headerlink" title="Obtaining HPROF File"></a>Obtaining HPROF File</h2><p>HPROF file is a file that MAT can recognize. HPROF file stores the memory snapshot of the java process at a specific point in time. There are different formats for storing this data, generally containing the situation of java objects and classes in the heap when the snapshot was triggered. Since the snapshot is just a momentary thing, the heap dump cannot contain information such as when and where (in which method) an object was allocated.<br>This file can be exported using DDMS:</p><ol><li>There is a row of buttons above Devices in DDMS. After selecting a process (that is, selecting the package name of the application you want to debug in the list listed under Devices), click the Dump HPROF file button:</li></ol><p>  <img src="/en/images/MAT/MAT_DDMS_ExportFile.webp" alt="image"></p><p>After confirming the storage path and saving, you can get the HPROF file of the corresponding process. The eclipse plugin can complete the above work in one click. Just click the Dump HPROF file icon, and the MAT plugin will automatically convert the format and open the analysis results in eclipse. Eclipse also has a dedicated Memory Analysis view.</p><ol><li>After getting the corresponding file, if the Eclipse plugin is installed, switch to the Memory Analyzer view. If installed independently, use the tool that comes with the Android SDK (hprof-conv located in sdk&#x2F;platform-tools&#x2F;hprof-conv) for conversion.</li></ol><figure class="highlight java"><table><tr><td class="gutter"><pre><span class="line">1</span><br></pre></td><td class="code"><pre><span class="line">hprof-conv xxx.xxx.xxx.hprof xxx.xxx.xxx.hprof</span><br></pre></td></tr></table></figure><p>The converted .hprof file can be opened using the MAT tool.</p><h2 id="Introduction-to-MAT-Main-Interface"><a href="#Introduction-to-MAT-Main-Interface" class="headerlink" title="Introduction to MAT Main Interface"></a>Introduction to MAT Main Interface</h2><p>Here we are not introducing the main interface of the MAT tool itself, but the OverView interface displayed after importing a file.</p><ul><li>Open the converted hprof file:<br>  <img src="/en/images/MAT/MAT_OpenFile.webp" alt="image"></li></ul><p>If the first one is selected, a report will be generated. This is fine.</p><p><img src="/en/images/MAT/MAT_Report.webp" alt="image"></p><ul><li><p>Select OverView interface:</p><p><img src="/en/images/MAT/MAT_Overview.webp" alt="Image"></p></li></ul><p>We need to pay attention to the Actions area below</p><ul><li><p>Histogram: Lists objects in memory, the number of objects, and size</p><p><img src="/en/images/MAT/MAT_Histogram.webp" alt="image"></p></li><li><p>Dominator Tree: Lists the largest objects and the Objects depending on them for survival (size is sorted by Retained Heap)</p><p><img src="/en/images/MAT/MAT_DominatorTree.webp" alt="image"></p></li><li><p>Top Consumers: Lists the largest objects graphically</p><p><img src="/en/images/MAT/MAT_TopConsumers.webp" alt="image"></p></li><li><p>Duplicate Class: Analyze the cause of leakage automatically via MAT</p></li></ul><p>Generally, Histogram and Dominator Tree are the most commonly used.</p><h2 id="Introduction-to-Some-Concepts-in-MAT"><a href="#Introduction-to-Some-Concepts-in-MAT" class="headerlink" title="Introduction to Some Concepts in MAT"></a>Introduction to Some Concepts in MAT</h2><p>To understand MAT’s list information, the concepts of Shallow heap, Retained Heap, and GC Root must be understood.</p><h3 id="3-3-1-Shallow-heap"><a href="#3-3-1-Shallow-heap" class="headerlink" title="3.3.1 Shallow heap"></a>3.3.1 Shallow heap</h3><p>Shallow size is the size of the memory occupied by the object itself, excluding the objects it references.</p><ul><li>The Shallow size of a regular object (non-array) is determined by the number and type of its member variables.</li><li>The shallow size of an array is determined by the type of array elements (object type, basic type) and the array length.</li></ul><p>Because unlike C++ objects which can store a large amount of memory themselves, java object members are all references. The real memory is on the heap, appearing as a pile of native byte[], char[], int[], so if we only look at the memory of the object itself, the quantity is very small. So we see that the Histogram chart is sorted by Shallow size, and the first and second places are byte, char.</p><h3 id="3-3-2-Retained-Heap"><a href="#3-3-2-Retained-Heap" class="headerlink" title="3.3.2 Retained Heap"></a>3.3.2 Retained Heap</h3><p>The concept of Retained Heap represents the heap size occupied by all objects (including those recursively released) that would be released due to the release of an object reducing references if that object were released. Thus, if a member of an object instantiates a large chunk of int array, that int array can also be calculated into this object. Relative to shallow heap, Retained heap can more accurately reflect the actual size occupied by an object (because if the object is released, the retained heap can be released).</p><p>What needs to be said here is that Retained Heap is not always so effective. For example, I instantiate a chunk of memory in A and assign it to a member variable of A. At this time, I also let B point to this memory. At this time, because both A and B refer to this memory, when A is released, this memory will not be released. So this memory will not be calculated in the Retained Heap of A or B. To correct this, the Leading Object (such as A or B) in MAT is not necessarily just one object, but can also be multiple objects. At this time, the Retained Set of the combination (A, B) includes that large memory. Corresponding to the MAT UI, in the Histogram, you can select Group By class, superclass or package to select this group.</p><p>To calculate Retained Memory, MAT introduced the Dominator Tree. Suppose object A references B and C, and B and C both reference D (a diamond shape). At this time, to calculate Retained Memory, A’s includes A itself and B, C, D. Because B and C jointly reference D, their Retained Memory is only themselves. D of course is also just itself. I think it is to speed up the calculation that MAT changed the object reference graph into an object reference tree. In this example, the tree root is A, and B, C, D are its three sons. B, C, D no longer have a mutual relationship. Changing the reference graph into a reference tree makes calculating Retained Heap very convenient, and display is also very convenient. Corresponding to the MAT UI, in the dominator tree view, the shallow heap and retained heap of each object are displayed. Then you can take that node as the tree root and refine step by step to see where the retained heap is actually used. What needs to be said is that this conversion from graph to tree indeed facilitates memory analysis, but sometimes it can be confusing. Originally object B is a member of object A, but because B is also referenced by C, B is not under A in the tree, but likely at the same level.</p><p>To correct this, right-click in MAT and choose between with outgoing references and with incoming references in List objects. This corresponds to the concept of a real reference graph.</p><ul><li>outgoing references: Indicates the out-nodes of the object (objects referenced by this object).</li><li>incoming references: Indicates the in-nodes of the object (objects referencing this object).</li></ul><p>To better understand Retained Heap, an example is cited below for illustration:</p><p>Treat objects in memory as nodes in the figure below, and objects reference each other. There is a special node GC Roots here, which is the starting point of the reference chain:<br><img src="/en/images/MAT/MAT_Retained_objects.webp" alt="image"> <img src="/en/images/MAT/MAT_Retained_objects_2.webp" alt="image"></p><p>Starting from obj1, the blue nodes in the above figure represent objects that can only be accessed directly or indirectly through obj1. Because obj3 can be accessed via GC Roots, obj3 in the left figure is not a blue node; while in the right figure it is blue because it is already included in the retained set.<br>So for the left figure, the retained size of obj1 is the sum of shallow sizes of obj1, obj2, obj4;<br>The retained size of the right figure is the sum of shallow sizes of obj1, obj2, obj3, obj4.<br>The retained size of obj2 can be calculated in the same way.</p><h3 id="GC-Root"><a href="#GC-Root" class="headerlink" title="GC Root"></a>GC Root</h3><p>When GC finds that an object cannot be accessed through any reference chain, the object is recycled. The term GC Roots is exactly the starting point for analyzing this process. For example, the JVM itself ensures the reachability of objects (so the JVM is GC Roots), so GC Roots ensures object reachability in memory in this way. Once unreachable, it is recycled. Usually, GC Roots is an object on the call stack of the current thread (such as method parameters and local variables), or the thread itself, or a class loaded by the system class loader, and active objects retained by native code. So GC Roots is a sharp weapon for analyzing why objects still survive in memory.</p><h2 id="Some-Useful-Views-in-MAT"><a href="#Some-Useful-Views-in-MAT" class="headerlink" title="Some Useful Views in MAT"></a>Some Useful Views in MAT</h2><h3 id="Thread-OvewView"><a href="#Thread-OvewView" class="headerlink" title="Thread OvewView"></a>Thread OvewView</h3><p>Thread OvewView allows viewing the Thread information of this application:<br><img src="/en/images/MAT/MAT_ThreadOverView.webp" alt="image"></p><h3 id="Group"><a href="#Group" class="headerlink" title="Group"></a>Group</h3><p>In the Histogram and Dominator Tree interfaces, you can choose to display the results in another Group way (default is Group by Object). Switching to Group by package allows better viewing of which package’s classes occupy large memory, and it is also easy to locate your own application.<br><img src="/en/images/MAT/MAT_Group.webp" alt="image"></p><h3 id="Path-to-GC-Root"><a href="#Path-to-GC-Root" class="headerlink" title="Path to GC Root"></a>Path to GC Root</h3><p>On a certain entry in the Histogram or Dominator Tree, right-click to view its GC Root Path:<br><img src="/en/images/MAT/MAT_PathToGCRoot.webp" alt="image"></p><p>The reference rules of Java should also be explained here:<br>From strongest to weakest, different reference (reachability) levels reflect the life cycle of objects.</p><ul><li>Strong Ref: The code we usually write is Strong Ref, corresponding to strong reachability. The object is only recycled when strong reachability is removed.</li><li>Soft Ref: Corresponds to soft reachability. As long as there is enough memory, the object is kept until memory is tight and there is no Strong Ref before recycling the object. Generally used to implement caching, implemented via the java.lang.ref.SoftReference class.</li><li>Weak Ref: Weaker than Soft Ref. When no Strong Ref is found, the object is recycled immediately without waiting for memory to be tight. Implemented via java.lang.ref.WeakReference and java.util.WeakHashMap classes.</li><li>Phantom Ref: No object is kept in memory at all. You can only use Phantom Ref itself. Generally used for special cleanup processes after entering the finalize() method, implemented via java.lang.ref.PhantomReference.</li></ul><p>Click Path To GC Roots –&gt; with all references<br><img src="/en/images/MAT/MAT_PathToGCRoot_Detail.webp" alt="image"></p><h1 id="Reference-Documents"><a href="#Reference-Documents" class="headerlink" title="Reference Documents"></a>Reference Documents</h1><ol><li><a href="http://www.yourkit.com/docs/java/help/sizes.jsp">Shallow and retained sizes</a></li><li>MAT wiki: <a href="http://wiki.eclipse.org/index.php/MemoryAnalyzer">http://wiki.eclipse.org/index.php/MemoryAnalyzer</a></li></ol><h1 id="About-Me-amp-amp-Blog"><a href="#About-Me-amp-amp-Blog" class="headerlink" title="About Me &amp;&amp; Blog"></a>About Me &amp;&amp; Blog</h1><p>Below are personal introduction and related links. I hope to communicate more with everyone in the industry. If three people walk together, there must be one who can be my teacher!</p><ol><li><a href="/en/about/">Blogger Personal Introduction</a>: There are personal WeChat and WeChat group links inside.</li><li><a href="/en/2019/12/01/BlogMap/">This Blog Content Navigation</a>: A navigation of personal blog content.</li><li><a href="/en/2018/05/07/Android-performance-optimization-skills-and-tools/">Excellent blog articles organized and collected by individuals - A must-know for Android efficiency optimization</a>: Everyone is welcome to recommend themselves and recommend others (WeChat private chat is fine)</li><li><a href="/en/2023/12/30/the-performance/">Android Performance Optimization Knowledge Planet</a>: Welcome to join, thanks for your support~</li></ol><blockquote><p><strong>One person can go faster, a group of people can go further</strong></p></blockquote><p><img src="/en/images/WechatIMG581.webp" alt="WeChat Scan"></p>]]></content>

    
    
    <summary type="html">&lt;p&gt;This is the first article in the series on using the MAT tool. This series consists of three articles, detailing how to use MAT to analyze memory issues, whether they are Java application memory issues or Android application memory issues:&lt;/p&gt;
&lt;ol&gt;
&lt;li&gt;&lt;a href=&quot;/en/2015/04/11/AndroidMemory-Usage-Of-MAT/&quot;&gt;Android Memory Optimization (1) - Getting Started with MAT&lt;/a&gt;&lt;/li&gt;
&lt;li&gt;&lt;a href=&quot;/en/2015/04/11/AndroidMemory-Usage-Of-MAT-Pro/&quot;&gt;Android Memory Optimization (2) - Advanced MAT Usage&lt;/a&gt;&lt;/li&gt;
&lt;li&gt;&lt;a href=&quot;/en/2015/04/11/AndroidMemory-Open-Bitmap-Object-In-MAT/&quot;&gt;Android Memory Optimization (3) - Opening Original Bitmap Images in MAT&lt;/a&gt;&lt;/li&gt;
&lt;/ol&gt;
&lt;p&gt;The MAT techniques in this series are still useful for learning Java heap analysis, Dominator Tree, Retained Size, and reference chains, but the default capture flow has changed. The older path was Eclipse&amp;#x2F;DDMS exporting an Android HPROF and &lt;code&gt;hprof-conv&lt;/code&gt; converting it for MAT. The current first stop should be Android Studio Memory Profiler: capture a heap dump, inspect class&amp;#x2F;package grouping, retained size, and references there, then export to MAT only when you need offline analysis of a large HPROF or a more specialized Dominator Tree workflow. Use LeakCanary for leak detection, and combine &lt;code&gt;dumpsys meminfo&lt;/code&gt;, Android Studio native allocation recording, or Perfetto native heap profiling for system and native memory issues instead of relying on MAT alone.&lt;/p&gt;
&lt;h1 id=&quot;Introduction-to-MAT&quot;&gt;&lt;a href=&quot;#Introduction-to-MAT&quot; class=&quot;headerlink&quot; title=&quot;Introduction to MAT&quot;&gt;&lt;/a&gt;Introduction to MAT&lt;/h1&gt;&lt;h2 id=&quot;What-is-MAT&quot;&gt;&lt;a href=&quot;#What-is-MAT&quot; class=&quot;headerlink&quot; title=&quot;What is MAT?&quot;&gt;&lt;/a&gt;What is MAT?&lt;/h2&gt;&lt;p&gt;MAT (Memory Analyzer Tool), a memory analysis tool based on Eclipse, is a fast and feature-rich JAVA heap analysis tool. It helps us find memory leaks and reduce memory consumption. Using the memory analysis tool to analyze numerous objects, quickly calculate the size occupied by objects in memory, see who is preventing the garbage collector from reclaiming, and visually view the objects that may cause this result through reports.&lt;/p&gt;
&lt;p&gt;&lt;img src=&quot;/en/images/MAT/MAT_Intro.webp&quot; alt=&quot;image&quot;&gt;&lt;/p&gt;
&lt;p&gt;Of course, MAT also has an independent version that doesn’t rely on Eclipse, but this version requires converting the file generated by DDMS before it can be opened in the standalone version of MAT when debugging Android memory. However, the Android SDK already provides this Tool, so it is also very convenient to use.&lt;/p&gt;</summary>


    <category term="Android" scheme="https://androidperformance.com/en/categories/Android/"/>
    
    
    <category term="Android" scheme="https://androidperformance.com/en/tags/Android/"/>
    
    <category term="Memory" scheme="https://androidperformance.com/en/tags/Memory/"/>
    
    <category term="Performance" scheme="https://androidperformance.com/en/tags/Performance/"/>
    
    <category term="Java" scheme="https://androidperformance.com/en/tags/Java/"/>
    
    <category term="MAT" scheme="https://androidperformance.com/en/tags/MAT/"/>
    
  </entry>
  
  <entry>
    <title>Android Performance Case Study Follow-up</title>
    <link href="https://androidperformance.com/en/2015/03/31/android-performance-case-study-follow-up/"/>
    <id>https://androidperformance.com/en/2015/03/31/android-performance-case-study-follow-up/</id>
    <published>2015-03-31T01:29:00.000Z</published>
    <updated>2026-05-10T23:29:51.064Z</updated>
    
    <content type="html"><![CDATA[<h1 id="Introduction"><a href="#Introduction" class="headerlink" title="Introduction"></a>Introduction</h1><p>This article is a translation of <a href="http://www.curious-creature.com/2015/03/25/android-performance-case-study-follow-up/?utm_source=Android+Weekly&utm_campaign=0692ef161b-Android_Weekly_146&utm_medium=email&utm_term=0_4eb677ad19-0692ef161b-337850757">Android Performance Case Study Follow-up</a> by the renowned <strong>Romain Guy</strong>. It explores several techniques, methodologies, and tools for Android performance optimization.</p><hr><h1 id="Translation"><a href="#Translation" class="headerlink" title="Translation"></a>Translation</h1><p>Two years ago, I published <a href="http://www.curious-creature.com/2012/12/01/android-performance-case-study/">Android Performance Case Study</a> to help Android developers understand the tools and techniques needed to identify, track, and optimize performance bottlenecks.</p><p>That article used the Twitter client <strong>Falcon Pro</strong> as a case study. Its developer, Joaquim Vergès, was kind enough to let me use his app as an example and quickly addressed the issues I found. Fast forward to recently: Joaquim was building <strong>Falcon Pro 3</strong> from scratch. Before its release, he contacted me about a scrolling performance issue. Once again, I had to analyze it without access to the source code.</p><span id="more"></span><p>Joaquim had already exhausted most tools. He confirmed that Overdraw wasn’t the culprit and suspected that his use of <a href="http://developer.android.com/reference/android/support/v4/view/ViewPager.html">ViewPager</a> was the cause. He sent over these screenshots:</p><p><img src="/en/images/android-performance-case-study-follow-up/falconpro3.webp" alt="Falcon Pro GPU Profiling"></p><p>Joaquim used the built-in GPU profiling tool to identify dropped frames. The left screenshot shows the timeline scrolling without a ViewPager; the right shows it with one (captured on a 2014 Moto X). The problem was stark.</p><p>My first thought was to check if the ViewPager was abusing hardware layers, as it looked like the system was performing a layer update every frame during scrolling. However, the <a href="http://www.curious-creature.com/2013/09/13/optimizing-hardware-layers/">hardware layers updates debugging tool</a> didn’t show much. I inspected the layout with <strong>Hierarchy Viewer</strong>, and to my surprise (or rather, disappointment for a quick fix), the ViewPager was behaving correctly.</p><p>Then I turned to a powerful but often overlooked tool: <strong>Tracer for OpenGL</strong>. My previous <a href="http://www.curious-creature.com/2012/12/01/android-performance-case-study">article</a> explains its usage in detail. It’s important to remember that this tool captures every single drawing command sent by the UI to the GPU.</p><blockquote><p><strong>Android 4.3 and up</strong>: <em>Tracer</em> became slightly harder to use starting with Android 4.3 due to the introduction of <a href="https://developers.google.com/events/io/sessions/325418001">reordering and merging of drawing commands</a>. While these are amazing optimizations, they prevent <em>Tracer</em> from grouping commands by View. You can restore the old behavior by disabling display list optimizations before starting your app.</p></blockquote><blockquote><p><strong>Reading OpenGL Traces</strong>: Commands in <strong>blue</strong> are GL operations that draw pixels. Others are for data transfer or state setting and can usually be ignored. Clicking a blue command updates the “Details” tab, showing the content of the render target immediately after that command executes. By clicking through the blue commands, you can literally reconstruct the frame piece by piece. This is my primary way of diagnosing issues with Tracer—seeing how a frame is built provides deep insight into an app’s behavior.</p></blockquote><p>After scrolling through Falcon Pro for a bit, I examined the GL trace. I was surprised to find many <strong>SaveLayer&#x2F;ComposeLayer</strong> blocks.</p><p><img src="/en/images/android-performance-case-study-follow-up/glTrace.webp" alt="GL Trace Analysis"></p><p>These commands indicate the app is creating temporary hardware layers. These are often created by [Canvas.saveLayer()](<a href="http://developer.android.com/reference/android/graphics/Canvas.html#saveLayer">http://developer.android.com/reference/android/graphics/Canvas.html#saveLayer</a>(float, float, float, float, android.graphics.Paint, int)). UI widgets trigger this behavior when drawing a View with an <strong>alpha &lt; 1</strong> (semi-transparent) under these conditions:</p><ul><li><code>getAlpha()</code> returns &lt; 1</li><li><code>onSetAlpha()</code> returns false</li><li><code>getLayerType()</code> returns <code>LAYER_TYPE_NONE</code></li><li><code>hasOverlappingRendering()</code> returns true</li></ul><p>Chet and I have emphasized in many talks why you should <a href="https://youtu.be/vQZFaec9NpA?t=29m51s">use alpha with care</a>. Each time a widget uses a temporary layer, drawing commands are rerouted to a different render target. Switching render targets is a “heavy” operation for GPUs, especially those with tiling&#x2F;deferred architectures (like ImaginationTech’s SGX or Qualcomm’s Adreno). On these mobile GPUs, it’s a significant bottleneck. Since we were testing on a 2014 Moto X (Snapdragon&#x2F;Qualcomm), multiple temporary hardware layers were almost certainly the root cause.</p><p>So, what was creating these layers? <em>Tracer</em> provided the answer. In the image above, the GL commands in the <code>SaveLayer</code> group were rendering a small circle. Let’s look at the app:</p><p><img src="/en/images/android-performance-case-study-follow-up/before.webp" alt="Falcon Pro 3 Indicators"></p><p>See the circles at the top? Those are ViewPager indicators. Joaquim was using a third-party library to draw them. Interestingly, the current page was indicated by a solid white circle, while others were a “grayish” white. The library was achieving this “gray” by drawing white circles and then calling <code>setAlpha()</code> on the View to make them semi-transparent.</p><h1 id="Solutions"><a href="#Solutions" class="headerlink" title="Solutions"></a>Solutions</h1><p>There are several ways to fix this:</p><ol><li><strong>Use an opaque color</strong>: Instead of setting opacity on the View, just use a customizable “inactive” color (e.g., a real gray hex value).</li><li><strong>Override <code>hasOverlappingRendering()</code></strong>: Return <code>false</code>. The framework will then apply the alpha directly to the <code>Paint</code> for you. This is a powerful optimization: for non-overlapping Views, the system doesn’t need an off-screen buffer; it can just draw each primitive with the reduced alpha.<figure class="highlight java"><table><tr><td class="gutter"><pre><span class="line">1</span><br><span class="line">2</span><br><span class="line">3</span><br><span class="line">4</span><br><span class="line">5</span><br><span class="line">6</span><br><span class="line">7</span><br><span class="line">8</span><br><span class="line">9</span><br></pre></td><td class="code"><pre><span class="line"><span class="comment">/**</span></span><br><span class="line"><span class="comment"> * Replaces the default implementation which returns true.</span></span><br><span class="line"><span class="comment"> * Use false if your View doesn&#x27;t have overlapping content</span></span><br><span class="line"><span class="comment"> * (e.g., a simple ImageView or TextView without a background).</span></span><br><span class="line"><span class="comment"> */</span></span><br><span class="line"><span class="meta">@Override</span></span><br><span class="line"><span class="keyword">public</span> <span class="type">boolean</span> <span class="title function_">hasOverlappingRendering</span><span class="params">()</span> &#123;</span><br><span class="line">    <span class="keyword">return</span> <span class="literal">false</span>;</span><br><span class="line">&#125;</span><br></pre></td></tr></table></figure></li><li><strong>Override <code>onSetAlpha()</code></strong>: Return <code>true</code> and manually apply the alpha to the <code>Paint</code> used to draw the circles.<figure class="highlight java"><table><tr><td class="gutter"><pre><span class="line">1</span><br><span class="line">2</span><br></pre></td><td class="code"><pre><span class="line">paint.setAlpha((<span class="type">int</span>) (alpha * <span class="number">255</span>));</span><br><span class="line">canvas.drawCircle(..., paint);</span><br></pre></td></tr></table></figure></li></ol><p>The simplest fix is the second one, though it requires API 16. For older versions, the other two work well. In the end, Joaquim replaced the third-party library with his own optimized indicator implementation.</p><p>I hope this post illustrates how seemingly “innocent” or “safe” operations can hide major performance pitfalls. <strong>Never assume—always verify, measure, and trace.</strong></p><hr><h1 id="Appendix"><a href="#Appendix" class="headerlink" title="Appendix"></a>Appendix</h1><p>For more on using Alpha, see: <a href="http://imid.me/blog/2014/01/17/best-practices-for-using-alpha/">Android Tips: Best Practices for Using Alpha</a></p><h1 id="About-Me-amp-amp-Blog"><a href="#About-Me-amp-amp-Blog" class="headerlink" title="About Me &amp;&amp; Blog"></a>About Me &amp;&amp; Blog</h1><p>(Links and introduction)</p>]]></content>
    
    
    <summary type="html">&lt;h1 id=&quot;Introduction&quot;&gt;&lt;a href=&quot;#Introduction&quot; class=&quot;headerlink&quot; title=&quot;Introduction&quot;&gt;&lt;/a&gt;Introduction&lt;/h1&gt;&lt;p&gt;This article is a translation of &lt;a href=&quot;http://www.curious-creature.com/2015/03/25/android-performance-case-study-follow-up/?utm_source=Android+Weekly&amp;utm_campaign=0692ef161b-Android_Weekly_146&amp;utm_medium=email&amp;utm_term=0_4eb677ad19-0692ef161b-337850757&quot;&gt;Android Performance Case Study Follow-up&lt;/a&gt; by the renowned &lt;strong&gt;Romain Guy&lt;/strong&gt;. It explores several techniques, methodologies, and tools for Android performance optimization.&lt;/p&gt;
&lt;hr&gt;
&lt;h1 id=&quot;Translation&quot;&gt;&lt;a href=&quot;#Translation&quot; class=&quot;headerlink&quot; title=&quot;Translation&quot;&gt;&lt;/a&gt;Translation&lt;/h1&gt;&lt;p&gt;Two years ago, I published &lt;a href=&quot;http://www.curious-creature.com/2012/12/01/android-performance-case-study/&quot;&gt;Android Performance Case Study&lt;/a&gt; to help Android developers understand the tools and techniques needed to identify, track, and optimize performance bottlenecks.&lt;/p&gt;
&lt;p&gt;That article used the Twitter client &lt;strong&gt;Falcon Pro&lt;/strong&gt; as a case study. Its developer, Joaquim Vergès, was kind enough to let me use his app as an example and quickly addressed the issues I found. Fast forward to recently: Joaquim was building &lt;strong&gt;Falcon Pro 3&lt;/strong&gt; from scratch. Before its release, he contacted me about a scrolling performance issue. Once again, I had to analyze it without access to the source code.&lt;/p&gt;</summary>


    <category term="Android" scheme="https://androidperformance.com/en/categories/Android/"/>
    
    
    <category term="Android" scheme="https://androidperformance.com/en/tags/Android/"/>
    
    <category term="Memory" scheme="https://androidperformance.com/en/tags/Memory/"/>
    
    <category term="Performance" scheme="https://androidperformance.com/en/tags/Performance/"/>
    
    <category term="MAT" scheme="https://androidperformance.com/en/tags/MAT/"/>
    
    <category term="Compose" scheme="https://androidperformance.com/en/tags/Compose/"/>
    
  </entry>
  
  <entry>
    <title>Android Tips Round-Up, Part 5</title>
    <link href="https://androidperformance.com/en/2015/03/15/android-tips-round-up-5/"/>
    <id>https://androidperformance.com/en/2015/03/15/android-tips-round-up-5/</id>
    <published>2015-03-14T16:32:11.000Z</published>
    <updated>2026-05-10T23:29:51.066Z</updated>
    
    <content type="html"><![CDATA[<p>Here’s the final round-up of Android tips I’ve been posting.</p><p>I’ve officially run out of things to post. If I ever come across something new I’ll post it but it won’t be daily anymore. It’s been fun everyone!</p><span id="more"></span><p><a href="https://developer.android.com/reference/android/support/v4/widget/ViewDragHelper.html?ref=blog.danlew.net">ViewDragHelper</a> - Dragging Views is a complex problem and this class helps a lot. If you want an example, <a href="https://developer.android.com/reference/android/support/v4/widget/DrawerLayout.html?ref=blog.danlew.net">DrawerLayout</a> uses it for swiping. Flavient Laurent also wrote <a href="http://flavienlaurent.com/blog/2013/08/28/each-navigation-drawer-hides-a-viewdraghelper/?ref=blog.danlew.net">an excellent article</a> about it.</p><p><a href="https://developer.android.com/reference/android/widget/PopupWindow.html?ref=blog.danlew.net">PopupWindow</a> - Used all around Android without you even realizing it (action bars, autocomplete, edittext errors), this class is the primary method for creating floating content.</p><p><a href="https://developer.android.com/reference/android/app/ActionBar.html?ref=blog.danlew.net#getThemedContext()">ActionBar.getThemedContext()</a> - ActionBar theming is surprisingly complex (and can be different from the theming of the rest of the Activity). This gets you a Context so if you create your own Views they will be properly themed.</p><p><a href="https://developer.android.com/reference/android/media/ThumbnailUtils.html?ref=blog.danlew.net">ThumbnailUtils</a> - Helps create thumbnails; in general I’d just use whatever image library was already in place (e.g. Picasso or Volley), but it can also create video thumbnails!</p><p><a href="https://developer.android.com/reference/android/content/Context.html?ref=blog.danlew.net#getExternalFilesDir(java.lang.String)">Context.getExternalFilesDir()</a> - While you do have permission to write anywhere on the SD card if you ask for it, it’s much more polite to write your data in the correct designated folder. That way it gets cleaned up and users get a common experience. Additionally, as of Kit Kat you can write to this folder without permission, and each user has their own external files dir.</p><p><a href="https://developer.android.com/reference/android/util/SparseArray.html?ref=blog.danlew.net">SparseArray</a> - A more efficient version of <code>Map&lt;Integer, Object&gt;</code>. Be sure to check out sister classes SparseBooleanArray, SparseIntArray and SparseLongArray as well.</p><p><a href="https://developer.android.com/reference/android/content/pm/PackageManager.html?ref=blog.danlew.net#setComponentEnabledSetting(android.content.ComponentName,%20int,%20int)">PackageManager.setComponentEnabledSetting()</a> - Lets you enable&#x2F;disable components in your app’s manifest. What’s nice here is being able to shut off unnecessary functionality - for example, a BroadcastReceiver that is unnecessary due to the current app configuration.</p><p><a href="https://developer.android.com/reference/android/database/sqlite/SQLiteDatabase.html?ref=blog.danlew.net#yieldIfContendedSafely()">SQLiteDatabase.yieldIfContendedSafely()</a> - Lets you temporarily stop a db transaction so you don’t tie up too much of the system.</p><p><a href="https://developer.android.com/reference/android/os/Environment.html?ref=blog.danlew.net#getExternalStoragePublicDirectory(java.lang.String)">Environment.getExternalStoragePublicDirectory()</a> - Again, users like a consistent experience with their SD card; using this method will grab the correct directory for placing typed files (music, pictures, etc.) on their drive.</p><p><a href="https://developer.android.com/reference/android/view/View.html?ref=blog.danlew.net#generateViewId()">View.generateViewId()</a> - Every once in a while I’ve wanted to dynamically generate view IDs. The problem is ensuring you aren’t clobbering existing IDs (or other generated ones).</p><p><a href="https://developer.android.com/reference/android/app/ActivityManager.html?ref=blog.danlew.net#clearApplicationUserData()">ActivityManager.clearApplicationUserData()</a> - A reset button for your app. Perhaps the easiest way to log out a user, ever.</p><p><a href="http://developer.android.com/reference/android/content/Context.html?ref=blog.danlew.net#createConfigurationContext(android.content.res.Configuration)">Context.createConfigurationContext()</a> - Customize your configuration context. Common problem I’ve run into: forcing part of an app to render in a particular locale (not that I normally condone this sort of behavior, but you never know). This would make it a lot easier to do so.</p><p><a href="http://developer.android.com/reference/android/app/ActivityOptions.html?ref=blog.danlew.net">ActivityOptions</a> - Nice custom animations when moving between Activities. <a href="http://developer.android.com/reference/android/support/v4/app/ActivityOptionsCompat.html?ref=blog.danlew.net">ActivityOptionsCompat</a> is good for backwards compatible functionality.</p><p><a href="http://developer.android.com/reference/android/widget/AdapterViewFlipper.html?ref=blog.danlew.net#fyiWillBeAdvancedByHostKThx%28%29">AdapterViewFlipper.fyiWillBeAdvancedByHostKThx()</a> - Because it’s funny and for no other reason. There are other amusing tidbits in AOSP (like <a href="http://developer.android.com/reference/android/hardware/SensorManager.html?ref=blog.danlew.net#GRAVITY_DEATH_STAR_I">GRAVITY_DEATH_STAR_I</a>) but unlike those this one is actually useful.</p><p><a href="http://developer.android.com/reference/android/view/ViewParent.html?ref=blog.danlew.net#requestDisallowInterceptTouchEvent%28boolean%29">ViewParent.requestDisallowInterceptTouchEvent()</a> - The Android touch event system defaults handle what you want most of the time, but sometimes you need this method to wrest event control from parents. (By the way, if you want to know about the touch system, <a href="https://www.youtube.com/watch?v=EZAoJU-nUyI&ref=blog.danlew.net">this talk</a> is amazing.)</p><h2 id="More"><a href="#More" class="headerlink" title="More"></a>More</h2><ol><li><a href="https://www.androidperformance.com/en/android-tips-round-up-1.html">Part 1</a></li><li><a href="https://www.androidperformance.com/en/android-tips-round-up-2.html">Part 2</a></li><li><a href="https://www.androidperformance.com/en/android-tips-round-up-3.html">Part 3</a></li><li><a href="https://www.androidperformance.com/en/android-tips-round-up-4.html">Part 4</a></li><li><a href="https://www.androidperformance.com/en/android-tips-round-up-5.html">Part 5</a></li></ol><p>Original Article: <a href="http://blog.danlew.net/2014/05/28/android-tips-round-up-part-5/">http://blog.danlew.net/2014/05/28/android-tips-round-up-part-5/</a></p><h1 id="About-Me-amp-amp-Blog"><a href="#About-Me-amp-amp-Blog" class="headerlink" title="About Me &amp;&amp; Blog"></a>About Me &amp;&amp; Blog</h1><p>Below is my personal intro and related links. I look forward to exchanging ideas with fellow professionals. “When three walk together, one can always be my teacher!”</p><ol><li><a href="https://www.androidperformance.com/en/about/">Blogger Intro</a></li><li><a href="https://www.androidperformance.com/en/2019/12/01/BlogMap/">Blog Content Navigation</a>: A guide for my blog content.</li><li><a href="https://www.androidperformance.com/en/2018/05/07/Android-performance-optimization-skills-and-tools/">Curated Excellent Blog Articles - Android Performance Optimization Must-Knows</a></li><li><a href="https://www.androidperformance.com/en/2023/12/30/the-performance/">Android Performance Optimization Knowledge Planet</a></li></ol><blockquote><p><strong>One walks faster alone, but a group walks further together.</strong></p></blockquote><p><img src="/en/images/WechatIMG581.webp" alt="Scan WeChat QR Code"></p>]]></content>
    
    
    <summary type="html">&lt;p&gt;Here’s the final round-up of Android tips I’ve been posting.&lt;/p&gt;
&lt;p&gt;I’ve officially run out of things to post. If I ever come across something new I’ll post it but it won’t be daily anymore. It’s been fun everyone!&lt;/p&gt;</summary>


    <category term="Android" scheme="https://androidperformance.com/en/categories/Android/"/>
    
    
    <category term="Startup" scheme="https://androidperformance.com/en/tags/Startup/"/>
    
  </entry>
  
  <entry>
    <title>Android Tips Round-Up, Part 4</title>
    <link href="https://androidperformance.com/en/2015/03/15/android-tips-round-up-4/"/>
    <id>https://androidperformance.com/en/2015/03/15/android-tips-round-up-4/</id>
    <published>2015-03-14T16:31:02.000Z</published>
    <updated>2026-05-10T23:29:51.066Z</updated>
    
    <content type="html"><![CDATA[<p>Here’s the fourth round-up of Android tips I’ve been posting.</p><span id="more"></span><p><a href="http://developer.android.com/reference/android/app/Activity.html?ref=blog.danlew.net#isChangingConfigurations%28%29">Activity.isChangingConfigurations()</a> - Often times you don’t need to do quite as much saving of state if all that’s happening is the configuration is changing.</p><p><a href="http://developer.android.com/reference/android/content/SearchRecentSuggestionsProvider.html?ref=blog.danlew.net">SearchRecentSuggestionsProvider</a> - A quick and easy way to create a recents suggestion provider.</p><p><a href="http://developer.android.com/reference/android/view/ViewTreeObserver.html?ref=blog.danlew.net">ViewTreeObserver</a> - This is an amazing utility; it can be grabbed from any View and used to monitor the state of the View hierarchy. My most often use for it is to determine when Views have been measured (usually for animation purposes).</p><p><a href="https://www.timroes.de/2013/09/12/speed-up-gradle/?ref=blog.danlew.net">org.gradle.daemon&#x3D;true</a> - Helps reduce the startup time of of Gradle builds. Only really applies to command-line builds as Android Studio already tries to use the daemon.</p><p><a href="http://developer.android.com/reference/android/database/DatabaseUtils.html?ref=blog.danlew.net">DatabaseUtils</a> - A variety of useful tools for database operations.</p><p><a href="http://developer.android.com/reference/android/widget/LinearLayout.html?ref=blog.danlew.net#attr_android:weightSum">android:weightSum (LinearLayout)</a> - Want to use layout weights, but don’t want them to fill the entire LinearLayout? That’s what weightSum can do by defining the total weight.</p><p><a href="http://developer.android.com/reference/android/view/View.html?ref=blog.danlew.net#attr_android:duplicateParentState">android:duplicateParentState (View)</a> - Makes the child duplicate the state of the parent - for example, if you’ve got a ViewGroup that is clickable, then you can use this to make its children change state when it is clicked.</p><p><a href="http://developer.android.com/reference/android/view/ViewGroup.html?ref=blog.danlew.net#attr_android:clipChildren">android:clipChildren (ViewGroup)</a> - If disabled, this lets the children of a ViewGroup draw outside their parent’s bounds. Great for animations.</p><p><a href="http://developer.android.com/reference/android/widget/ScrollView.html?ref=blog.danlew.net#attr_android:fillViewport">android:fillViewport (ScrollView)</a> - Best explained in <a href="http://www.curious-creature.org/2010/08/15/scrollviews-handy-trick/?ref=blog.danlew.net">this post</a>, this helps solve a problem with ScrollViews that may not always have enough content to actually fill the height of the screen.</p><p><a href="http://developer.android.com/guide/topics/resources/drawable-resource.html?ref=blog.danlew.net#Bitmap">android:tileMode (BitmapDrawable)</a> - Lets you create repeated patterns with images.</p><p><a href="http://developer.android.com/reference/android/R.attr.html?ref=blog.danlew.net#exitFadeDuration">android:enterFadeDuration&#x2F;android:exitFadeDuration (Drawables)</a> - For Drawables that have multiple states, this lets you define a fade before&#x2F;after the drawable shows.</p><p><a href="http://developer.android.com/reference/android/widget/ImageView.html?ref=blog.danlew.net#attr_android:scaleType">android:scaleType (ImageView)</a> - Defines how to scale&#x2F;crop a drawable within an ImageView. “centerCrop” and “centerInside” are regular settings for me.</p><p><a href="http://developer.android.com/training/improving-layouts/reusing-layouts.html?ref=blog.danlew.net#Merge">Merge</a> - Lets you include a layout in another without creating a duplicate ViewGroup (<a href="http://android-developers.blogspot.com/2009/03/android-layout-tricks-3-optimize-by.html?ref=blog.danlew.net">more info</a>). Also good for custom ViewGroups; you can inflate a layout with <code>&lt;merge&gt;</code> inside the constructor to define its children automatically.</p><p><a href="http://developer.android.com/reference/android/util/AtomicFile.html?ref=blog.danlew.net">AtomicFile</a> - Manipulates a file atomically by using a backup file. I’ve written this myself before, it’s good to have an official (and better-written) version of it.</p><h2 id="More"><a href="#More" class="headerlink" title="More"></a>More</h2><ol><li><a href="https://www.androidperformance.com/en/android-tips-round-up-1.html">Part 1</a></li><li><a href="https://www.androidperformance.com/en/android-tips-round-up-2.html">Part 2</a></li><li><a href="https://www.androidperformance.com/en/android-tips-round-up-3.html">Part 3</a></li><li><a href="https://www.androidperformance.com/en/android-tips-round-up-4.html">Part 4</a></li><li><a href="https://www.androidperformance.com/en/android-tips-round-up-5.html">Part 5</a></li></ol><p>Original Article: <a href="http://blog.danlew.net/2014/05/12/android-tips-round-up-part-4/">http://blog.danlew.net/2014/05/12/android-tips-round-up-part-4/</a></p><h1 id="About-Me-amp-amp-Blog"><a href="#About-Me-amp-amp-Blog" class="headerlink" title="About Me &amp;&amp; Blog"></a>About Me &amp;&amp; Blog</h1><p>Below is my personal intro and related links. I look forward to exchanging ideas with fellow professionals. “When three walk together, one can always be my teacher!”</p><ol><li><a href="https://www.androidperformance.com/en/about/">Blogger Intro</a></li><li><a href="https://www.androidperformance.com/en/2019/12/01/BlogMap/">Blog Content Navigation</a>: A guide for my blog content.</li><li><a href="https://www.androidperformance.com/en/2018/05/07/Android-performance-optimization-skills-and-tools/">Curated Excellent Blog Articles - Android Performance Optimization Must-Knows</a></li><li><a href="https://www.androidperformance.com/en/2023/12/30/the-performance/">Android Performance Optimization Knowledge Planet</a></li></ol><blockquote><p><strong>One walks faster alone, but a group walks further together.</strong></p></blockquote><p><img src="/en/images/WechatIMG581.webp" alt="Scan WeChat QR Code"></p>]]></content>
    
    
    <summary type="html">&lt;p&gt;Here’s the fourth round-up of Android tips I’ve been posting.&lt;/p&gt;</summary>


    <category term="Android" scheme="https://androidperformance.com/en/categories/Android/"/>
    
    
    <category term="Android" scheme="https://androidperformance.com/en/tags/Android/"/>
    
    <category term="Memory" scheme="https://androidperformance.com/en/tags/Memory/"/>
    
  </entry>
  
  <entry>
    <title>Android Tips Round-Up, Part 3</title>
    <link href="https://androidperformance.com/en/2015/03/15/android-tips-round-up-3/"/>
    <id>https://androidperformance.com/en/2015/03/15/android-tips-round-up-3/</id>
    <published>2015-03-14T16:29:57.000Z</published>
    <updated>2026-05-10T23:29:51.066Z</updated>
    
    <content type="html"><![CDATA[<p>Here’s the third round-up of Android tips I’ve been posting.</p><span id="more"></span><p><a href="http://developer.android.com/reference/android/net/UrlQuerySanitizer.html?ref=blog.danlew.net">UrlQuerySanitizer</a> - Sanitize URLs with this handy utility.</p><p><a href="http://developer.android.com/reference/android/app/Fragment.html?ref=blog.danlew.net#setArguments%28android.os.Bundle%29">Fragment.setArguments</a> - Since you can’t use a Fragment constructor w&#x2F; parameters this is the second best thing. Arguments set before creation last throughout the entire Fragment’s lifecycle (even if it’s destroyed&#x2F;recreated due to a configuration change).</p><p><a href="http://developer.android.com/reference/android/app/DialogFragment.html?ref=blog.danlew.net#setShowsDialog%28boolean%29">DialogFragment.setShowsDialog()</a> - Neat trick - DialogFragments can act like normal Fragments! That way you can have the same Fragment do double-duty. I usually create a third View generation method that both onCreateView() and onCreateDialog() call into when creating a dual-purpose Fragment.</p><p><a href="http://developer.android.com/reference/android/app/FragmentManager.html?ref=blog.danlew.net#enableDebugLogging%28boolean%29">FragmentManager.enableDebugLogging()</a> - Help when you need it when figuring out Fragments.</p><p><a href="http://developer.android.com/reference/android/support/v4/content/LocalBroadcastManager.html?ref=blog.danlew.net">LocalBroadcastManager</a> - Safer than global broadcasts. Simple and quick. Event buses like <a href="http://square.github.io/otto/?ref=blog.danlew.net">otto</a> may make more sense for your use case though.</p><p><a href="http://developer.android.com/reference/android/telephony/PhoneNumberUtils.html?ref=blog.danlew.net#formatNumber%28java.lang.String%29">PhoneNumberUtils.formatNumber()</a> - Let someone else figure out this problem for you.</p><p><a href="http://developer.android.com/reference/android/graphics/Region.html?ref=blog.danlew.net#op%28android.graphics.Region,%20android.graphics.Region,%20android.graphics.Region.Op%29">Region.op()</a> - I found this useful for comparing two generic areas before rendering. If I’ve got two Paths, do they overlap? I can figure that out with this method.</p><p><a href="http://developer.android.com/reference/android/app/Application.html?ref=blog.danlew.net#registerActivityLifecycleCallbacks%28android.app.Application.ActivityLifecycleCallbacks%29">Application.registerActivityLifecycleCallbacks</a> - Though lacking documentation I feel this is self-evident. Just a handy tool.</p><p><a href="http://tools.android.com/tech-docs/new-build-system/user-guide?ref=blog.danlew.net#TOC-Build-Types">versionNameSuffix</a> - This gradle setting lets you modify the versionName field in your manifest based on different build types. For example, I would setup my debug build type to end in “-SNAPSHOT”; that way you can easily tell if you’re on a debug build or release build.</p><p><a href="http://developer.android.com/reference/android/database/CursorJoiner.html?ref=blog.danlew.net">CursorJoiner</a> - If you’re using a single database then a join in SQL is the natural solution, but what if you’ve received data from two separate ContentProviders? In that case CursorJoiner can be helpful.</p><p><a href="http://www.genymotion.com/?ref=blog.danlew.net">Genymotion</a> - A much faster Android emulator. I use it all day.</p><p><a href="http://developer.android.com/guide/practices/screens_support.html?ref=blog.danlew.net#qualifiers">-nodpi</a> - Most qualifiers (-mdpi, -hdpi, -xhdpi, etc.) automatically scale assets&#x2F;dimensions if you’re on a device that isn’t explicitly defined. Sometimes you just want something consistent though; in that case use -nodpi.</p><p><a href="http://developer.android.com/reference/android/content/BroadcastReceiver.html?ref=blog.danlew.net#setDebugUnregister%28boolean%29">BroadcastRecevier.setDebugUnregister()</a> - Another handy debugging tool.</p><p><a href="http://developer.android.com/reference/android/app/Activity.html?ref=blog.danlew.net#recreate%28%29">Activity.recreate()</a> - Forces an Activity to recreate itself for whatever reason.</p><p><a href="http://developer.android.com/reference/android/content/pm/PackageManager.html?ref=blog.danlew.net#checkSignatures%28java.lang.String,%20java.lang.String%29">PackageManager.checkSignatures()</a> - You can use this to find out if two apps (presumably your own) are installed at the same time. Without checking signatures someone could imitate your app easily by just using the same package name.</p><h2 id="More"><a href="#More" class="headerlink" title="More"></a>More</h2><ol><li><a href="https://www.androidperformance.com/en/android-tips-round-up-1.html">Part 1</a></li><li><a href="https://www.androidperformance.com/en/android-tips-round-up-2.html">Part 2</a></li><li><a href="https://www.androidperformance.com/en/android-tips-round-up-3.html">Part 3</a></li><li><a href="https://www.androidperformance.com/en/android-tips-round-up-4.html">Part 4</a></li><li><a href="https://www.androidperformance.com/en/android-tips-round-up-5.html">Part 5</a></li></ol><p>Original Article: <a href="http://blog.danlew.net/2014/04/28/android-tips-round-up-part-3/">http://blog.danlew.net/2014/04/28/android-tips-round-up-part-3/</a></p><h1 id="About-Me-amp-amp-Blog"><a href="#About-Me-amp-amp-Blog" class="headerlink" title="About Me &amp;&amp; Blog"></a>About Me &amp;&amp; Blog</h1><p>Below is my personal intro and related links. I look forward to exchanging ideas with fellow professionals. “When three walk together, one can always be my teacher!”</p><ol><li><a href="https://www.androidperformance.com/en/about/">Blogger Intro</a></li><li><a href="https://www.androidperformance.com/en/2019/12/01/BlogMap/">Blog Content Navigation</a>: A guide for my blog content.</li><li><a href="https://www.androidperformance.com/en/2018/05/07/Android-performance-optimization-skills-and-tools/">Curated Excellent Blog Articles - Android Performance Optimization Must-Knows</a></li><li><a href="https://www.androidperformance.com/en/2023/12/30/the-performance/">Android Performance Optimization Knowledge Planet</a></li></ol><blockquote><p><strong>One walks faster alone, but a group walks further together.</strong></p></blockquote><p><img src="/en/images/WechatIMG581.webp" alt="Scan WeChat QR Code"></p>]]></content>
    
    
    <summary type="html">&lt;p&gt;Here’s the third round-up of Android tips I’ve been posting.&lt;/p&gt;</summary>


    <category term="Android" scheme="https://androidperformance.com/en/categories/Android/"/>
    
    
  </entry>
  
  <entry>
    <title>Compiling Android Lollipop Firmware for Nexus 5</title>
    <link href="https://androidperformance.com/en/2015/02/04/build-rom-for-nexus5/"/>
    <id>https://androidperformance.com/en/2015/02/04/build-rom-for-nexus5/</id>
    <published>2015-02-04T12:51:19.000Z</published>
    <updated>2026-05-10T23:29:51.066Z</updated>
    
    <content type="html"><![CDATA[<p>Following my previous article, <a href="https://www.androidperformance.com/en/view-android-source-code-with-androidstudio.html">Using Android Studio to View Android Lollipop Source Code</a>, we know that simply reading code has its limits—understanding can remain superficial and easily forgotten. In contrast, code you’ve personally written or modified tends to leave a much deeper impression, and the process becomes easier to grasp during the implementation phase. While studying the source code, being able to modify it, run it on a phone, and see the results firsthand significantly boosts both learning efficiency and enthusiasm. This article explains how to compile the Android Lollipop source code yourself and run it on a Nexus 5.</p><p><strong>Why compile your own firmware instead of using Google’s factory images?</strong><br>Google’s factory images are “User” builds, which are highly restrictive and prevent you from pushing files to the system at will. Compiling your own “Userdebug” build gives you the freedom and root access needed for deep development.</p><span id="more"></span><p>This article is a historical Android L&#x2F;Nexus 5 workflow and should not be copied directly for current AOSP builds. For a fresh setup today, first bring up the official <code>android-latest-release</code> flow and Cuttlefish: <code>repo init --partial-clone -b android-latest-release -u https://android.googlesource.com/platform/manifest</code>, <code>repo sync -c -j8</code>, <code>source build/envsetup.sh</code>, <code>lunch product_name-release_config-build_variant</code>, and <code>m</code>. If your target is a physical device, choose a currently supported Pixel target and its matching proprietary binaries. Nexus 5&#x2F;hammerhead, Android L’s <code>aosp_hammerhead-userdebug</code>, old driver pages, and old fastboot details should be treated as a historical example for understanding user&#x2F;userdebug builds, vendor blobs, and flashing.</p><p>This guide assumes you have already downloaded the Android Lollipop source code and own a Nexus 5 (an essential tool for system developers). If you haven’t downloaded the source or haven’t configured your build environment yet, please refer to the official guides: <a href="https://source.android.com/source/initializing.html">Initializing a Build Environment</a> and <a href="https://source.android.com/source/downloading.html">Downloading the Source</a>. (Note: These resources are best accessed through a direct connection without local restrictions).</p><p>It’s also important to understand <strong>AOSP</strong> (Android Open Source Project). The source code downloaded from Google is the AOSP version, which does not include Google’s proprietary applications (GMS). This is the same baseline that manufacturers receive. Google’s factory images, however, include the full suite of Google services. Passing Google’s certification to include these services is a complex and often expensive process, which is why many domestic manufacturers omit them.</p><hr><h2 id="1-Initializing-the-Build-Environment"><a href="#1-Initializing-the-Build-Environment" class="headerlink" title="1. Initializing the Build Environment"></a>1. Initializing the Build Environment</h2><p>Run the following command in your terminal:</p><figure class="highlight bash"><table><tr><td class="gutter"><pre><span class="line">1</span><br></pre></td><td class="code"><pre><span class="line">. build/envsetup.sh</span><br></pre></td></tr></table></figure><h2 id="2-Choosing-the-Target"><a href="#2-Choosing-the-Target" class="headerlink" title="2. Choosing the Target"></a>2. Choosing the Target</h2><p>Run the <code>lunch</code> command:</p><figure class="highlight bash"><table><tr><td class="gutter"><pre><span class="line">1</span><br></pre></td><td class="code"><pre><span class="line">lunch</span><br></pre></td></tr></table></figure><h2 id="3-Selecting-the-Device"><a href="#3-Selecting-the-Device" class="headerlink" title="3. Selecting the Device"></a>3. Selecting the Device</h2><p>You will see a menu similar to this:</p><figure class="highlight plaintext"><table><tr><td class="gutter"><pre><span class="line">1</span><br><span class="line">2</span><br><span class="line">3</span><br><span class="line">4</span><br><span class="line">5</span><br><span class="line">6</span><br><span class="line">7</span><br><span class="line">8</span><br></pre></td><td class="code"><pre><span class="line">You&#x27;re building on Linux</span><br><span class="line"></span><br><span class="line">Lunch menu... pick a combo:</span><br><span class="line">     1. aosp_arm-eng</span><br><span class="line">     2. aosp_arm64-eng</span><br><span class="line">     ...</span><br><span class="line">     16. aosp_hammerhead-userdebug</span><br><span class="line">     ...</span><br></pre></td></tr></table></figure><h3 id="3-1-Device-Reference-Table"><a href="#3-1-Device-Reference-Table" class="headerlink" title="3.1 Device Reference Table"></a>3.1 Device Reference Table</h3><table><thead><tr><th>DEVICE</th><th>CODE NAME</th><th>BUILD CONFIGURATION</th></tr></thead><tbody><tr><td>Nexus 6</td><td>shamu</td><td>aosp_shamu-userdebug</td></tr><tr><td>Nexus 9</td><td>volantis (flounder)</td><td>aosp_flounder-userdebug</td></tr><tr><td><strong>Nexus 5 (GSM&#x2F;LTE)</strong></td><td><strong>hammerhead</strong></td><td><strong>aosp_hammerhead-userdebug</strong></td></tr><tr><td>Nexus 7 (Wi-Fi)</td><td>razor (flo)</td><td>aosp_flo-userdebug</td></tr><tr><td>Nexus 4</td><td>occam (mako)</td><td>full_mako-userdebug</td></tr></tbody></table><h3 id="3-2-Build-Types-Explanation"><a href="#3-2-Build-Types-Explanation" class="headerlink" title="3.2 Build Types Explanation"></a>3.2 Build Types Explanation</h3><table><thead><tr><th>BUILDTYPE</th><th>USE</th></tr></thead><tbody><tr><td><strong>user</strong></td><td>Limited access; suited for production releases.</td></tr><tr><td><strong>userdebug</strong></td><td>Similar to “user” but with root access and debuggability; preferred for development.</td></tr><tr><td><strong>eng</strong></td><td>Development configuration with additional debugging tools; maximum debuggability.</td></tr></tbody></table><p>After selecting <code>aosp_hammerhead-userdebug</code>, you will see a confirmation summary:</p><figure class="highlight plaintext"><table><tr><td class="gutter"><pre><span class="line">1</span><br><span class="line">2</span><br><span class="line">3</span><br><span class="line">4</span><br><span class="line">5</span><br><span class="line">6</span><br><span class="line">7</span><br></pre></td><td class="code"><pre><span class="line">============================================</span><br><span class="line">PLATFORM_VERSION=5.0.x</span><br><span class="line">TARGET_PRODUCT=aosp_hammerhead</span><br><span class="line">TARGET_BUILD_VARIANT=userdebug</span><br><span class="line">TARGET_BUILD_TYPE=release</span><br><span class="line">...</span><br><span class="line">============================================</span><br></pre></td></tr></table></figure><h2 id="4-Setting-Up-Drivers-Proprietary-Binaries"><a href="#4-Setting-Up-Drivers-Proprietary-Binaries" class="headerlink" title="4. Setting Up Drivers (Proprietary Binaries)"></a>4. Setting Up Drivers (Proprietary Binaries)</h2><p>Next, you need to download the proprietary drivers required for Nexus 5 from the <a href="https://developers.google.com/android/nexus/drivers#hammerheadlrx22c">Google Developers website</a>. You will typically need drivers from <strong>Broadcom</strong> (NFC, Bluetooth, Wi-Fi), <strong>LG</strong> (Camera, Sensors, Audio), and <strong>Qualcomm</strong> (Graphics, GSM, GPS, etc.).</p><p>Once downloaded, extract the three <code>.sh</code> files into your Android source root. Execute them, and they will place the relevant driver files into the <code>vendor/</code> directory.</p><h2 id="5-Starting-the-Build"><a href="#5-Starting-the-Build" class="headerlink" title="5. Starting the Build"></a>5. Starting the Build</h2><p>Run the compilation command:</p><figure class="highlight bash"><table><tr><td class="gutter"><pre><span class="line">1</span><br></pre></td><td class="code"><pre><span class="line">make -j8</span><br></pre></td></tr></table></figure><p>(Adjust <code>-j8</code> based on your number of CPU cores). If everything is configured correctly, after a significant wait, you will see a success message indicating the <code>system.img</code> has been installed.</p><h2 id="6-Flashing-the-Firmware"><a href="#6-Flashing-the-Firmware" class="headerlink" title="6. Flashing the Firmware"></a>6. Flashing the Firmware</h2><p>Power off your Nexus 5 and enter fastboot mode (typically by holding Volume Down + Power). From the root of your source directory, run:</p><figure class="highlight bash"><table><tr><td class="gutter"><pre><span class="line">1</span><br></pre></td><td class="code"><pre><span class="line">fastboot -w flashall</span><br></pre></td></tr></table></figure><p>The device will automatically reboot once the process is complete.</p><hr><h2 id="7-The-Result-A-Pure-AOSP-Desktop"><a href="#7-The-Result-A-Pure-AOSP-Desktop" class="headerlink" title="7. The Result: A Pure AOSP Desktop"></a>7. The Result: A Pure AOSP Desktop</h2><p><img src="/en/images/build-image-for-nexus-5/Nexus5.webp" alt="Nexus 5 AOSP Desktop"></p><hr><h1 id="About-Me-amp-amp-Blog"><a href="#About-Me-amp-amp-Blog" class="headerlink" title="About Me &amp;&amp; Blog"></a>About Me &amp;&amp; Blog</h1><p>Below are my personal details and links. I look forward to connecting and sharing knowledge with fellow developers!</p><ol><li><a href="https://www.androidperformance.com/en/about/">About Me</a>: Includes my WeChat and WeChat group links.</li><li><a href="https://www.androidperformance.com/en/2019/12/01/BlogMap/">Blog Navigation</a>: A guide to the content on this blog.</li><li><a href="https://www.androidperformance.com/en/2018/05/07/Android-performance-optimization-skills-and-tools/">Curated Android Performance Articles</a>: A collection of must-read performance optimization articles. Self-nominations&#x2F;recommendations are welcome!</li><li><a href="https://www.androidperformance.com/en/2023/12/30/the-performance/">Android Performance Knowledge Planet</a>: Join our community for more insights.</li></ol><blockquote><p><strong>“If you want to go fast, go alone. If you want to go far, go together.”</strong></p></blockquote><p><img src="/en/images/WechatIMG581.webp" alt="WeChat QR Code"></p>]]></content>
    
    
    <summary type="html">&lt;p&gt;Following my previous article, &lt;a href=&quot;https://www.androidperformance.com/en/view-android-source-code-with-androidstudio.html&quot;&gt;Using Android Studio to View Android Lollipop Source Code&lt;/a&gt;, we know that simply reading code has its limits—understanding can remain superficial and easily forgotten. In contrast, code you’ve personally written or modified tends to leave a much deeper impression, and the process becomes easier to grasp during the implementation phase. While studying the source code, being able to modify it, run it on a phone, and see the results firsthand significantly boosts both learning efficiency and enthusiasm. This article explains how to compile the Android Lollipop source code yourself and run it on a Nexus 5.&lt;/p&gt;
&lt;p&gt;&lt;strong&gt;Why compile your own firmware instead of using Google’s factory images?&lt;/strong&gt;&lt;br&gt;Google’s factory images are “User” builds, which are highly restrictive and prevent you from pushing files to the system at will. Compiling your own “Userdebug” build gives you the freedom and root access needed for deep development.&lt;/p&gt;</summary>


    <category term="Android" scheme="https://androidperformance.com/en/categories/Android/"/>
    
    
    <category term="Linux" scheme="https://androidperformance.com/en/tags/Linux/"/>
    
  </entry>
  
  <entry>
    <title>Android Performance Optimization - Introduction to Systrace (Part 1)</title>
    <link href="https://androidperformance.com/en/2015/01/30/android-performance-tools-systrace-1/"/>
    <id>https://androidperformance.com/en/2015/01/30/android-performance-tools-systrace-1/</id>
    <published>2015-01-30T12:24:31.000Z</published>
    <updated>2026-05-10T23:29:51.064Z</updated>
    
    <content type="html"><![CDATA[<p>This is a 2015 introduction to the Systrace tool. The workflows that mention Eclipse, Device Monitor, <code>sdk/tools/systrace</code>, and User builds being unable to capture traces are no longer the default path today. What remains useful is the basic idea: Systrace showed SurfaceFlinger, WindowManager, View, CPU scheduling, and other system behavior on one timeline. For current trace capture and analysis, start from the <a href="https://www.androidperformance.com/en/2024/03/27/Android-Perfetto-101/">Android Perfetto Series Catalog</a>.</p><p>The workflow has changed like this:</p><table><thead><tr><th>Old flow</th><th>Current flow</th></tr></thead><tbody><tr><td>Click Systrace in Eclipse &#x2F; Android Studio Device Monitor</td><td>Use System Tracing from Developer Options, or run <code>adb shell perfetto</code></td></tr><tr><td><code>python systrace.py --time=10 -o trace.html ...</code></td><td><code>adb shell perfetto -t 10s -b 64mb ... --out /data/misc/perfetto-traces/trace.perfetto-trace</code></td></tr><tr><td>Generate HTML and open it in Chrome</td><td>Generate <code>.perfetto-trace</code> and open it in <a href="https://ui.perfetto.dev/">Perfetto UI</a> or <code>trace_processor</code></td></tr><tr><td>Mainly zoom and click inside the HTML view</td><td>Read tracks and slices first, then narrow evidence with search, SQL, and metrics</td></tr><tr><td>User builds were treated as mostly unusable</td><td>User builds can capture limited information; system-level detail still benefits from Userdebug&#x2F;eng</td></tr></tbody></table><p>This is the first article in the Android Performance Optimization Tools series. This series mainly introduces the tools used during the Android performance optimization process, how to use these tools to discover problems, and how to solve them. In terms of performance optimization, Android provides many performance tools for everyone to use. Following our consistent “discover problem - solve problem” thinking, discovering the problem is the most important part. Trying to solve a problem without first identifying it properly often leads to half the effort for twice the result.</p><p>In this article, we’ll start with a brief introduction to the Systrace tool.</p><h2 id="Introduction-to-Systrace"><a href="#Introduction-to-Systrace" class="headerlink" title="Introduction to Systrace"></a>Introduction to Systrace</h2><p>Systrace is a performance data sampling and analysis tool introduced in Android 4.1. It helps developers collect execution information from key Android subsystems (such as SurfaceFlinger, WindowManagerService, and other critical Framework modules, services, and the View system), allowing for a more intuitive analysis of system bottlenecks and performance improvements.</p><p>Systrace’s capabilities include tracking system I&#x2F;O operations, kernel workqueues, CPU load, and the health of various Android subsystems. On the Android platform, it’s composed of three main parts:</p><ul><li><strong>Kernel Space</strong>: Systrace leverages the <code>ftrace</code> feature in the Linux Kernel. Therefore, to use Systrace, the relevant <code>ftrace</code> modules in the kernel must be enabled.</li><li><strong>Data Collection</strong>: Android defines a <code>Trace</code> class that applications can use to output statistical information to <code>ftrace</code>. Additionally, the <code>atrace</code> program in Android reads statistical info from <code>ftrace</code> and passes it to data analysis tools.</li><li><strong>Data Analysis Tools</strong>: Android provides <code>systrace.py</code> (a Python script located in <code>Android SDK directory/platform-tools/systrace</code> that calls <code>atrace</code> internally) to configure data collection (such as tags, output filename, etc.), collect <code>ftrace</code> statistics, and generate a resulting HTML file for user viewing. Essentially, Systrace is a wrapper around the Linux Kernel’s <code>ftrace</code>. Applications need to utilize the <code>Trace</code> class provided by Android to use Systrace.</li></ul><p>Official documentation and usage for Systrace can be found here: <a href="http://developer.android.com/tools/help/systrace.html" title="SysTrace Official Introduction">Systrace</a></p><span id="more"></span><h2 id="Simple-Usage-of-Systrace"><a href="#Simple-Usage-of-Systrace" class="headerlink" title="Simple Usage of Systrace"></a>Simple Usage of Systrace</h2><p>Before using Systrace, understand how to use it on various platforms. Given the widespread use of Eclipse and Android Studio, I’ll quote the official usage methods, although the process is the same regardless of the tool:</p><ul><li>Prepare the UI you want to trace on the phone.</li><li>Click to start capturing (or execute the command in the CLI).</li><li>Perform operations on the phone.</li><li>Once the preset time is up, a Trace file will be generated. Open this file in <strong>Chrome</strong> for analysis.</li></ul><h4 id="Using-Eclipse"><a href="#Using-Eclipse" class="headerlink" title="Using Eclipse"></a>Using <strong>Eclipse</strong></h4><ol><li><p>In Eclipse, open an Android application project.</p><ol><li>Switch to the DDMS perspective, by selecting Window &gt; Perspectives &gt; DDMS.</li><li>In the Devices tab, select the device on which to run a trace. If no devices are listed, make sure your device is connected via USB cable and that debugging is enabled on the device.</li><li>Click the Systrace icon at the top of the Devices panel to configure tracing.</li><li>Set the tracing options and click OK to start the trace.</li></ol></li></ol><h4 id="Using-Android-Studio"><a href="#Using-Android-Studio" class="headerlink" title="Using ** Android Studio**"></a>Using ** Android Studio**</h4><ol><li><p>In Android Studio, open an Android application project.</p><ol><li>Open the Device Monitor by selecting Tools &gt; Android &gt; Monitor.</li><li>In the Devices tab, select the device on which to run a trace. If no devices are listed, make sure your device is connected via USB cable and that debugging is enabled on the device.</li><li>Click the Systrace icon at the top of the Devices panel to configure tracing.</li><li>Set the tracing options and click OK to start the trace.</li></ol></li></ol><h4 id="Using-Device-Monitor"><a href="#Using-Device-Monitor" class="headerlink" title="Using Device Monitor"></a>Using <strong>Device Monitor</strong></h4><ol><li><p>Navigate to your SDK tools&#x2F; directory.</p><ol><li>Run the monitor program.</li><li>In the Devices tab, select the device on which to run a trace. If no devices are listed, make sure your device is connected via USB cable and that debugging is enabled on the device.</li><li>Click the Systrace icon at the top of the Devices panel to configure tracing.</li><li>Set the tracing options and click OK to start the trace.</li></ol></li></ol><h4 id="Command-Line-Usage"><a href="#Command-Line-Usage" class="headerlink" title="Command Line Usage"></a>Command Line Usage</h4><p>The command-line approach is more flexible and faster. Once configured, you can get results quickly (<strong>highly recommended</strong>).</p><p>The current command-line entry point is <code>perfetto</code>. For example:</p><figure class="highlight bash"><table><tr><td class="gutter"><pre><span class="line">1</span><br><span class="line">2</span><br><span class="line">3</span><br><span class="line">4</span><br><span class="line">5</span><br></pre></td><td class="code"><pre><span class="line">adb shell perfetto -t 10s -b 64mb \</span><br><span class="line">  <span class="built_in">sched</span> freq idle am wm gfx view binder_driver \</span><br><span class="line">  --out /data/misc/perfetto-traces/trace_file.perfetto-trace</span><br><span class="line"></span><br><span class="line">adb pull /data/misc/perfetto-traces/trace_file.perfetto-trace .</span><br></pre></td></tr></table></figure><p>If you need app-level <code>android.os.Trace</code> custom points, add the package name:</p><figure class="highlight bash"><table><tr><td class="gutter"><pre><span class="line">1</span><br><span class="line">2</span><br><span class="line">3</span><br></pre></td><td class="code"><pre><span class="line">adb shell perfetto -t 10s -b 64mb -a com.example.app \</span><br><span class="line">  <span class="built_in">sched</span> freq idle am wm gfx view binder_driver \</span><br><span class="line">  --out /data/misc/perfetto-traces/app_trace.perfetto-trace</span><br></pre></td></tr></table></figure><p>The old Systrace command below is still useful when reading old articles or reproducing old system environments:</p><figure class="highlight bash"><table><tr><td class="gutter"><pre><span class="line">1</span><br><span class="line">2</span><br></pre></td><td class="code"><pre><span class="line">$ <span class="built_in">cd</span> android-sdk/platform-tools/systrace</span><br><span class="line">$ python systrace.py --time=10 -o mynewtrace.html <span class="built_in">sched</span> gfx view wm</span><br></pre></td></tr></table></figure><p>You can see the old Systrace tool path from the command above. Configuring the corresponding path and Alias in Bash makes it quick to use. The original article said User builds cannot capture traces; the more accurate current statement is that User builds can capture limited information through System Tracing &#x2F; Perfetto, while system services, kernel details, and vendor policy analysis still benefit from Userdebug or eng builds.</p><p>Old Systrace capture generates an HTML trace file. Current Perfetto capture generates a <code>.perfetto-trace</code> file. Old HTML can be opened in Chrome or the Perfetto legacy UI; new trace files should normally be opened in Perfetto UI. We will discuss how to analyze trace files in the sections below. Regardless of the tool used, you select parameters before capturing. The following list keeps the old <code>systrace.py</code> parameters:</p><ul><li><p>-h, –help Show the help message.</p></li><li><p>-o  Write the HTML trace report to the specified file (i.e., the output filename).</p></li><li><p>-t N, –time&#x3D;N Trace activity for N seconds. The default value is 5 seconds. (Trace capture duration, e.g., -t 8).</p></li><li><p>-b N, –buf-size&#x3D;N Use a trace buffer size of N kilobytes. This option lets you limit the total size of the data collected during a trace.</p></li><li><p>-k</p></li><li><p>—ktrace&#x3D; Trace the activity of specific kernel functions, specified in a comma-separated list.</p></li><li><p>-l, –list-categories List the available tracing category tags. The available tags are:</p><ul><li><strong>gfx</strong> - Graphics</li><li><strong>input</strong> - Input</li><li><strong>view</strong> - View</li><li>webview - WebView</li><li><strong>wm</strong> - Window Manager</li><li><strong>am</strong> - Activity Manager</li><li>audio - Audio</li><li>video - Video</li><li>camera - Camera</li><li>hal - Hardware Modules</li><li>res - Resource Loading</li><li><strong>dalvik</strong> - Dalvik VM</li><li>rs - RenderScript</li><li><strong>sched</strong> - CPU Scheduling</li><li><strong>freq</strong> - CPU Frequency</li><li><strong>membus</strong> - Memory Bus Utilization</li><li><strong>idle</strong> - CPU Idle</li><li><strong>disk</strong> - Disk input and output</li><li><strong>load</strong> - CPU Load</li><li><strong>sync</strong> - Synchronization Manager</li><li><strong>workq</strong> - Kernel Workqueues Note: Some trace categories are not supported on all devices. Tip: If you want to see the names of tasks in the trace output, you must include the sched category in your command parameters.</li></ul></li><li><p>-a</p></li><li><p>—app&#x3D; Enable tracing for applications, specified as a comma-separated list of package names. The apps must contain tracing instrumentation calls from the Trace class. For more information, see Analyzing Display and Performance.</p></li><li><p>—link-assets Link to the original CSS or JavaScript resources instead of embedding them in the HTML trace report.</p></li><li><p>—from-file&#x3D; Create the interactive Systrace report from a file, instead of running a live trace.</p></li><li><p>—asset-dir&#x3D; Specify a directory for the trace report assets. This option is useful for maintaining a single set of assets for multiple Systrace reports.</p></li><li><p>-e</p></li><li><p>—serial&#x3D; Conduct the trace on a specific connected device, identified by its device serial number.</p></li></ul><p>While there are many parameters, you don’t need to consider all of them when using tools; just check the corresponding boxes. For the command line, you’ll manually add the parameters.</p><p>We usually configure this command as an Alias:</p><figure class="highlight plaintext"><table><tr><td class="gutter"><pre><span class="line">1</span><br><span class="line">2</span><br></pre></td><td class="code"><pre><span class="line">alias st-start=&#x27;python /home/gaojianwu/Software/android-studio/sdk/platform-tools/systrace/systrace.py&#x27;</span><br><span class="line">alias st-start-gfx-trace = ‘st-start -t 8 gfx input view sched freq wm am hwui workq res dalvik sync disk load perf hal rs idle mmc’</span><br></pre></td></tr></table></figure><p>This way, you can just type <strong>st-start</strong> when using it. Of course, to distinguish and maintain each file, you also need to add <strong>-o xxx.Trace</strong>. You don’t need to understand all the commands and parameters at once; just remember the simple usage. You’ll become familiar with them during the analysis process.</p><h1 id="About-Me-amp-amp-Blog"><a href="#About-Me-amp-amp-Blog" class="headerlink" title="About Me &amp;&amp; Blog"></a>About Me &amp;&amp; Blog</h1><p>Below is my personal intro and related links. I look forward to exchanging ideas with fellow professionals. “When three walk together, one can always be my teacher!”</p><ol><li><a href="https://www.androidperformance.com/en/about/">Blogger Intro</a></li><li><a href="https://www.androidperformance.com/en/2019/12/01/BlogMap/">Blog Content Navigation</a>: A guide for my blog content.</li><li><a href="https://www.androidperformance.com/en/2018/05/07/Android-performance-optimization-skills-and-tools/">Curated Excellent Blog Articles - Android Performance Optimization Must-Knows</a></li><li><a href="https://www.androidperformance.com/en/2023/12/30/the-performance/">Android Performance Optimization Knowledge Planet</a></li></ol><blockquote><p><strong>One walks faster alone, but a group walks further together.</strong></p></blockquote><p><img src="/en/images/WechatIMG581.webp" alt="Scan WeChat QR Code"></p>]]></content>
    
    
    <summary type="html">&lt;p&gt;This is a 2015 introduction to the Systrace tool. The workflows that mention Eclipse, Device Monitor, &lt;code&gt;sdk/tools/systrace&lt;/code&gt;, and User builds being unable to capture traces are no longer the default path today. What remains useful is the basic idea: Systrace showed SurfaceFlinger, WindowManager, View, CPU scheduling, and other system behavior on one timeline. For current trace capture and analysis, start from the &lt;a href=&quot;https://www.androidperformance.com/en/2024/03/27/Android-Perfetto-101/&quot;&gt;Android Perfetto Series Catalog&lt;/a&gt;.&lt;/p&gt;
&lt;p&gt;The workflow has changed like this:&lt;/p&gt;
&lt;table&gt;
&lt;thead&gt;
&lt;tr&gt;
&lt;th&gt;Old flow&lt;/th&gt;
&lt;th&gt;Current flow&lt;/th&gt;
&lt;/tr&gt;
&lt;/thead&gt;
&lt;tbody&gt;&lt;tr&gt;
&lt;td&gt;Click Systrace in Eclipse &amp;#x2F; Android Studio Device Monitor&lt;/td&gt;
&lt;td&gt;Use System Tracing from Developer Options, or run &lt;code&gt;adb shell perfetto&lt;/code&gt;&lt;/td&gt;
&lt;/tr&gt;
&lt;tr&gt;
&lt;td&gt;&lt;code&gt;python systrace.py --time=10 -o trace.html ...&lt;/code&gt;&lt;/td&gt;
&lt;td&gt;&lt;code&gt;adb shell perfetto -t 10s -b 64mb ... --out /data/misc/perfetto-traces/trace.perfetto-trace&lt;/code&gt;&lt;/td&gt;
&lt;/tr&gt;
&lt;tr&gt;
&lt;td&gt;Generate HTML and open it in Chrome&lt;/td&gt;
&lt;td&gt;Generate &lt;code&gt;.perfetto-trace&lt;/code&gt; and open it in &lt;a href=&quot;https://ui.perfetto.dev/&quot;&gt;Perfetto UI&lt;/a&gt; or &lt;code&gt;trace_processor&lt;/code&gt;&lt;/td&gt;
&lt;/tr&gt;
&lt;tr&gt;
&lt;td&gt;Mainly zoom and click inside the HTML view&lt;/td&gt;
&lt;td&gt;Read tracks and slices first, then narrow evidence with search, SQL, and metrics&lt;/td&gt;
&lt;/tr&gt;
&lt;tr&gt;
&lt;td&gt;User builds were treated as mostly unusable&lt;/td&gt;
&lt;td&gt;User builds can capture limited information; system-level detail still benefits from Userdebug&amp;#x2F;eng&lt;/td&gt;
&lt;/tr&gt;
&lt;/tbody&gt;&lt;/table&gt;
&lt;p&gt;This is the first article in the Android Performance Optimization Tools series. This series mainly introduces the tools used during the Android performance optimization process, how to use these tools to discover problems, and how to solve them. In terms of performance optimization, Android provides many performance tools for everyone to use. Following our consistent “discover problem - solve problem” thinking, discovering the problem is the most important part. Trying to solve a problem without first identifying it properly often leads to half the effort for twice the result.&lt;/p&gt;
&lt;p&gt;In this article, we’ll start with a brief introduction to the Systrace tool.&lt;/p&gt;
&lt;h2 id=&quot;Introduction-to-Systrace&quot;&gt;&lt;a href=&quot;#Introduction-to-Systrace&quot; class=&quot;headerlink&quot; title=&quot;Introduction to Systrace&quot;&gt;&lt;/a&gt;Introduction to Systrace&lt;/h2&gt;&lt;p&gt;Systrace is a performance data sampling and analysis tool introduced in Android 4.1. It helps developers collect execution information from key Android subsystems (such as SurfaceFlinger, WindowManagerService, and other critical Framework modules, services, and the View system), allowing for a more intuitive analysis of system bottlenecks and performance improvements.&lt;/p&gt;
&lt;p&gt;Systrace’s capabilities include tracking system I&amp;#x2F;O operations, kernel workqueues, CPU load, and the health of various Android subsystems. On the Android platform, it’s composed of three main parts:&lt;/p&gt;
&lt;ul&gt;
&lt;li&gt;&lt;strong&gt;Kernel Space&lt;/strong&gt;: Systrace leverages the &lt;code&gt;ftrace&lt;/code&gt; feature in the Linux Kernel. Therefore, to use Systrace, the relevant &lt;code&gt;ftrace&lt;/code&gt; modules in the kernel must be enabled.&lt;/li&gt;
&lt;li&gt;&lt;strong&gt;Data Collection&lt;/strong&gt;: Android defines a &lt;code&gt;Trace&lt;/code&gt; class that applications can use to output statistical information to &lt;code&gt;ftrace&lt;/code&gt;. Additionally, the &lt;code&gt;atrace&lt;/code&gt; program in Android reads statistical info from &lt;code&gt;ftrace&lt;/code&gt; and passes it to data analysis tools.&lt;/li&gt;
&lt;li&gt;&lt;strong&gt;Data Analysis Tools&lt;/strong&gt;: Android provides &lt;code&gt;systrace.py&lt;/code&gt; (a Python script located in &lt;code&gt;Android SDK directory/platform-tools/systrace&lt;/code&gt; that calls &lt;code&gt;atrace&lt;/code&gt; internally) to configure data collection (such as tags, output filename, etc.), collect &lt;code&gt;ftrace&lt;/code&gt; statistics, and generate a resulting HTML file for user viewing. Essentially, Systrace is a wrapper around the Linux Kernel’s &lt;code&gt;ftrace&lt;/code&gt;. Applications need to utilize the &lt;code&gt;Trace&lt;/code&gt; class provided by Android to use Systrace.&lt;/li&gt;
&lt;/ul&gt;
&lt;p&gt;Official documentation and usage for Systrace can be found here: &lt;a href=&quot;http://developer.android.com/tools/help/systrace.html&quot; title=&quot;SysTrace Official Introduction&quot;&gt;Systrace&lt;/a&gt;&lt;/p&gt;</summary>


    <category term="Android" scheme="https://androidperformance.com/en/categories/Android/"/>
    
    
    <category term="Android" scheme="https://androidperformance.com/en/tags/Android/"/>
    
    <category term="Systrace" scheme="https://androidperformance.com/en/tags/Systrace/"/>
    
    <category term="RenderThread" scheme="https://androidperformance.com/en/tags/RenderThread/"/>
    
    <category term="Linux" scheme="https://androidperformance.com/en/tags/Linux/"/>
    
  </entry>
  
  <entry>
    <title>Viewing Android Lollipop Source Code with Android Studio</title>
    <link href="https://androidperformance.com/en/2015/01/16/view-android-source-code-with-androidstudio/"/>
    <id>https://androidperformance.com/en/2015/01/16/view-android-source-code-with-androidstudio/</id>
    <published>2015-01-16T13:54:32.000Z</published>
    <updated>2026-05-10T23:29:51.069Z</updated>
    
    <content type="html"><![CDATA[<h2 id="Android-Studio"><a href="#Android-Studio" class="headerlink" title="Android Studio"></a>Android Studio</h2><p>As Google’s “own son,” the Nexus phone series receives special treatment that is obvious to everyone. After Android 5.0 was released, the Nexus 5 was updated to the latest system immediately. Similarly, Android Studio, as Google’s official IDE, is highly valued. I switched from Eclipse to Android Studio right from the start, upgrading from the initial beta versions all the way to the current 1.0 stable version (1.1 was released today, and I’ve already upgraded).</p><span id="more"></span><p>The <code>idegen</code> flow in this article is the old Android Lollipop-era way to import the whole AOSP tree into Android Studio. If you only need to read source today, start with <a href="https://cs.android.com/">cs.android.com</a>. If you need local IDE navigation and editing, sync AOSP with the current flow, run <code>source build/envsetup.sh &amp;&amp; lunch &lt;TARGET&gt;</code>, and use AIDEGen to generate projects for concrete modules, for example <code>aidegen Settings framework</code> or <code>aidegen packages/apps/Settings frameworks/base</code>. Importing the entire tree is still heavy; opening module-sized projects is usually more practical. For mixed Rust&#x2F;C++&#x2F;Java modules, use the relevant AIDEGen language and IDE options instead of maintaining the old <code>android.ipr</code>&#x2F;<code>android.iml</code> files.</p><p>I don’t need to elaborate on the benefits of Android Studio; the following two points should be enough to convince you to switch:</p><ul><li>Android Studio is the official IDE designated by Google. The official website has removed ADT. You can check it on the <a href="http://developer.android.com/sdk/installing/index.html">Android Developer Website</a>. Currently, only Android Studio is available for download.</li><li>Google has also stated that ADT is no longer being maintained.</li></ul><p>Switching to Android Studio is the general trend. There are countless posts online about how to use Android Studio, so I won’t waste words praising it. Just look at the image below; it should give you enough desire to switch. For more details, you can view the <a href="http://developer.android.com/tools/studio/index.html">Android Studio Official Documentation</a>.</p><p><img src="/en/images/view-android-source-code-with-androidstudio/androidstudio.webp" alt="Android Studio Preview"></p><h2 id="Android-5-0-Lollipop"><a href="#Android-5-0-Lollipop" class="headerlink" title="Android 5.0: Lollipop"></a>Android 5.0: Lollipop</h2><p>Android Lollipop was launched by Google this year. You can check the <a href="http://developer.android.com/about/versions/lollipop.html">Official Lollipop Introduction</a> for detailed information. As developers, we shouldn’t just stay on the surface (like Lollipop’s fancy interface and the new <a href="http://developer.android.com/about/versions/lollipop.html#Material">Material Design</a> language); we need to understand the underlying principles.</p><h2 id="Preparation"><a href="#Preparation" class="headerlink" title="Preparation"></a>Preparation</h2><p>Before using Android Studio to view the source code, you need to do a few things:</p><ul><li>Download the Android Lollipop source code (it doesn’t necessarily have to be Lollipop; other versions are fine too).</li><li>Perform a full compilation (you cannot import the source code without compiling it first).</li></ul><p>You can refer to the <a href="https://source.android.com/source/initializing.html">Google Official Tutorial</a> to ensure everything goes smoothly.</p><h2 id="Steps"><a href="#Steps" class="headerlink" title="Steps"></a>Steps</h2><ol><li>Enter the Android source code root directory.</li><li>Execute:<br><code>mmm development/tools/idegen/</code><br>This command compiles the <code>idegen</code> project and generates the <code>idegen.jar</code> file. Upon success, it will show the location of the jar package and display <code>make completed successfully</code>.</li><li>Execute:<br><code>sh ./development/tools/idegen/idegen.sh</code><br>This command generates the corresponding files: <code>android.iws</code>, <code>android.ipr</code>, and <code>android.iml</code>.</li><li>After generating the files, open Android Studio, select “Open an existing Android Studio project”, choose the Android source code root directory, and import it (the <code>android.ipr</code> file is the key one). After configuring the SDK version, you can view the Android source code.</li><li>That’s it, there is no next step.</li></ol><h2 id="Troubleshooting"><a href="#Troubleshooting" class="headerlink" title="Troubleshooting"></a>Troubleshooting</h2><ul><li><p><strong>Compilation fails during the first command.</strong> Common reasons include:</p><ul><li>Android source code was not downloaded completely.</li><li>A full compilation was not performed.</li><li>Environment variable configuration issues.<br>The solution depends on the specific error. There are many posts online about this; I recommend searching on <a href="http://www.google.com/">Google</a> or asking on <a href="http://stackoverflow.com/">StackOverflow</a>.</li></ul></li><li><p><strong>Error during the second command:</strong></p></li></ul><figure class="highlight plaintext"><table><tr><td class="gutter"><pre><span class="line">1</span><br><span class="line">2</span><br><span class="line">3</span><br><span class="line">4</span><br><span class="line">5</span><br></pre></td><td class="code"><pre><span class="line">Exception in thread &quot;main&quot; java.io.FileNotFoundException: ./out/target/product/hammerhead/obj/GYP/shared_intermediates/res.java (Is a directory)</span><br><span class="line">at java.io.FileInputStream.open(Native Method)</span><br><span class="line">at java.io.FileInputStream.&lt;init&gt;(FileInputStream.java:138)</span><br><span class="line">at java.io.FileReader.&lt;init&gt;(FileReader.java:72)</span><br><span class="line">...</span><br></pre></td></tr></table></figure><pre><code>**Solution:** Rename the file:`./out/target/product/hammerhead/obj/GYP/shared_intermediates/res.java`to:`./out/target/product/hammerhead/obj/GYP/shared_intermediates/res.j`</code></pre><h2 id="Conclusion"><a href="#Conclusion" class="headerlink" title="Conclusion"></a>Conclusion</h2><p>Using Android Studio to view Android source code is a great experience. Here are the pros and cons:</p><h3 id="Pros"><a href="#Pros" class="headerlink" title="Pros"></a>Pros</h3><ul><li>Perfect integration with Android.</li><li>Comprehensive code completion.</li><li>Powerful code navigation.</li><li>Better looking IDE than Eclipse (I’m talking about the dark theme).</li><li>Powerful plugins (based on IntelliJ IDEA).</li><li>Free (SourceInsight gets a negative score here. What? You use a cracked version? Pretend I didn’t say anything).</li></ul><h3 id="Cons"><a href="#Cons" class="headerlink" title="Cons"></a>Cons</h3><ul><li>Support for C++ code is not very good.</li><li>Has a certain learning curve.</li></ul><h1 id="About-Me-amp-amp-Blog"><a href="#About-Me-amp-amp-Blog" class="headerlink" title="About Me &amp;&amp; Blog"></a>About Me &amp;&amp; Blog</h1><p>Below is my personal intro and related links. I look forward to exchanging ideas with fellow professionals. “When three walk together, one can always be my teacher!”</p><ol><li><a href="https://www.androidperformance.com/en/about/">Blogger Intro</a></li><li><a href="https://www.androidperformance.com/en/2019/12/01/BlogMap/">Blog Content Navigation</a>: A guide for my blog content.</li><li><a href="https://www.androidperformance.com/en/2018/05/07/Android-performance-optimization-skills-and-tools/">Curated Excellent Blog Articles - Android Performance Optimization Must-Knows</a></li><li><a href="https://www.androidperformance.com/en/2023/12/30/the-performance/">Android Performance Optimization Knowledge Planet</a></li></ol><blockquote><p><strong>One walks faster alone, but a group walks further together.</strong></p></blockquote><p><img src="/en/images/WechatIMG581.webp" alt="Scan WeChat QR Code"></p>]]></content>
    
    
    <summary type="html">&lt;h2 id=&quot;Android-Studio&quot;&gt;&lt;a href=&quot;#Android-Studio&quot; class=&quot;headerlink&quot; title=&quot;Android Studio&quot;&gt;&lt;/a&gt;Android Studio&lt;/h2&gt;&lt;p&gt;As Google’s “own son,” the Nexus phone series receives special treatment that is obvious to everyone. After Android 5.0 was released, the Nexus 5 was updated to the latest system immediately. Similarly, Android Studio, as Google’s official IDE, is highly valued. I switched from Eclipse to Android Studio right from the start, upgrading from the initial beta versions all the way to the current 1.0 stable version (1.1 was released today, and I’ve already upgraded).&lt;/p&gt;</summary>


    <category term="Android" scheme="https://androidperformance.com/en/categories/Android/"/>
    
    
    <category term="Android" scheme="https://androidperformance.com/en/tags/Android/"/>
    
    <category term="Java" scheme="https://androidperformance.com/en/tags/Java/"/>
    
  </entry>
  
  <entry>
    <title>Android Performance Optimization: Overdraw - Practical Application</title>
    <link href="https://androidperformance.com/en/2015/01/13/android-performance-optimization-overdraw-2/"/>
    <id>https://androidperformance.com/en/2015/01/13/android-performance-optimization-overdraw-2/</id>
    <published>2015-01-13T11:38:53.000Z</published>
    <updated>2026-05-10T23:29:51.064Z</updated>
    
    <content type="html"><![CDATA[<h2 id="Introduction"><a href="#Introduction" class="headerlink" title="Introduction"></a>Introduction</h2><p>The <a href="https://www.androidperformance.com/en/2014/10/20/android-performance-optimization-overdraw-1/">previous article</a> covered the theory of overdraw and tools to detect it. While iOS users rely on Apple’s curation, Android users rely on developers’ discipline. Unfortunately, many market-leading Android apps still suffer from significant overdraw issues. As a developer, I want to see Android bridge and eventually surpass the experience gap with iOS.</p><p>This post walks through a practical overdraw optimization process. Since every app is different, these steps are a reference to help you start your own optimization journey.</p><p>If you missed the theory part, check it here: <a href="https://www.androidperformance.com/en/2014/10/20/android-performance-optimization-overdraw-1/">Android Performance Optimization: Overdraw (Part 1)</a></p><hr><span id="more"></span><p>This case study is still useful for learning how to find redundant backgrounds and hierarchy cost, but the concrete tools should be replaced. The old flow used Hierarchy View in Monitor&#x2F;DDMS to confirm View backgrounds layer by layer. Today, open Android Studio Layout Inspector for Component Tree, Attributes, and layout snapshots, use Debug GPU Overdraw&#x2F;Profile GPU Rendering to find suspicious regions, and use Perfetto Frame Timeline&#x2F;System Trace to compare app frames, RenderThread, SurfaceFlinger composition, and CPU scheduling before and after the change.</p><h2 id="Identifying-Overdraw-Regions"><a href="#Identifying-Overdraw-Regions" class="headerlink" title="Identifying Overdraw Regions"></a>Identifying Overdraw Regions</h2><h3 id="1-Enable-Overdraw-Visualization"><a href="#1-Enable-Overdraw-Visualization" class="headerlink" title="1. Enable Overdraw Visualization"></a>1. Enable Overdraw Visualization</h3><p>Settings -&gt; Accessibility -&gt; Developer Options -&gt; Debug GPU Overdraw -&gt; Show Overdraw Areas.</p><h3 id="2-Baseline-Comparison"><a href="#2-Baseline-Comparison" class="headerlink" title="2. Baseline Comparison"></a>2. Baseline Comparison</h3><p>Kill the app to be tested and reopen it. Let’s compare a <strong>File Manager</strong> app and the <strong>Settings</strong> app:</p><p><img src="/en/images/overdraw-1/filemanager-1.webp" alt="File Manager"><img src="/en/images/overdraw-1/settings.webp" alt="Settings"></p><p>Following the color code (Blue -&gt; Green -&gt; Pink -&gt; Red), the File Manager has severe overdraw, while the Settings app is within an acceptable range. We’ll focus on optimizing the File Manager.</p><h3 id="3-Quick-Analysis-of-the-File-Manager"><a href="#3-Quick-Analysis-of-the-File-Manager" class="headerlink" title="3. Quick Analysis of the File Manager:"></a>3. Quick Analysis of the File Manager:</h3><ul><li><strong>The Global Background</strong>: Looking at the ActionBar and SmartBar, the entire app seems to have an opaque background. This forces the system to draw an invisible base layer before rendering the UI components on top. This is likely an attribute of the app’s theme and shows up as Blue (1x overdraw).</li><li><strong>Content Region</strong>: The base of the content area is Green (2x overdraw). If we remove the global background mentioned above, this area would still have an unnecessary layer compared to the Settings app.</li></ul><h2 id="Step-by-Step-Optimization"><a href="#Step-by-Step-Optimization" class="headerlink" title="Step-by-Step Optimization"></a>Step-by-Step Optimization</h2><h3 id="1-Remove-the-Default-Window-Background"><a href="#1-Remove-the-Default-Window-Background" class="headerlink" title="1. Remove the Default Window Background"></a>1. Remove the Default Window Background</h3><p>The global background analysis suggests an extra layer at the standard window level. This is often part of the <code>ActionBarOverlayLayout</code>. You can easily remove this by adding one line in your Activity’s <code>onCreate</code>:</p><p><code>this.getWindow().setBackgroundDrawableResource(android.R.color.transparent);</code></p><p><strong>Result:</strong><br><img src="/en/images/overdraw-1/filemanager-2.webp" alt="Optimization Step 1"><img src="/en/images/overdraw-1/filemanager-3.webp" alt="Optimization Step 1 - Unfolded"><br>The Blue tint on the ActionBar is gone, and the content area has shifted from Green back toward Blue.</p><h3 id="2-Eliminate-Redundant-Child-View-Backgrounds"><a href="#2-Eliminate-Redundant-Child-View-Backgrounds" class="headerlink" title="2. Eliminate Redundant Child View Backgrounds"></a>2. Eliminate Redundant Child View Backgrounds</h3><p>The content area was still showing significant overdraw. Using <strong>Hierarchy Viewer</strong>, we identified a <code>DragRelativeLayout</code> (inherited from <code>SlidingMenu</code>) which consists of a <code>CustomViewAbove</code> and a <code>CustomViewBehind</code>.</p><p><img src="/en/images/overdraw-1/HierarchyView-2.webp" alt="Hierarchy View Analysis"></p><p>Inspection revealed that <code>CustomViewBehind</code> was explicitly setting a background color in its constructor:<br><code>setBackgroundColor(getResources().getColor(R.color.mz_slidingmenu_background_light));</code></p><p>Since this view is completely covered by <code>CustomViewAbove</code> after initialization, its background is entirely redundant.</p><p><strong>Result:</strong><br><img src="/en/images/overdraw-1/filemanager-4.webp" alt="Optimization Step 2"><img src="/en/images/overdraw-1/filemanager-5.webp" alt="Optimization Step 2 - Unfolded"><br>Overdraw is significantly reduced across the primary navigation panes.</p><h3 id="3-Detailed-Component-Optimization"><a href="#3-Detailed-Component-Optimization" class="headerlink" title="3. Detailed Component Optimization"></a>3. Detailed Component Optimization</h3><p>Continuing the analysis, <code>CustomViewAbove</code> still had some bottlenecks. Deep in the hierarchy, a ListView (<code>FilesList</code>) was causing overdraw. By refining the <code>onDraw()</code> logic in <code>PartitionItemLayout</code> (specifically adjusting <code>setBounds</code>), we achieved near-perfect results.</p><p><strong>Final Result:</strong><br><img src="/en/images/overdraw-1/filemanager-6.webp" alt="Final Result"><img src="/en/images/overdraw-1/filemanager-7.webp" alt="Final Result - Unfolded"><br>The interface is now mostly Blue—a sign of a highly optimized rendering path!</p><hr><h2 id="Improving-Code-Quality"><a href="#Improving-Code-Quality" class="headerlink" title="Improving Code Quality"></a>Improving Code Quality</h2><h3 id="Using-Lint"><a href="#Using-Lint" class="headerlink" title="Using Lint"></a>Using Lint</h3><p>Lint highlights redundant layouts. For example, it might suggest that a <code>FrameLayout</code> wrapping a single <code>RelativeLayout</code> is unnecessary. Flattening these “useless parents” directly improves inflation and rendering speed.</p><p><img src="/en/images/overdraw-1/lint-1.webp" alt="Lint Warning"></p><h3 id="Tracer-for-OpenGL-ES"><a href="#Tracer-for-OpenGL-ES" class="headerlink" title="Tracer for OpenGL ES"></a>Tracer for OpenGL ES</h3><p>Located in the Android Device Monitor, this tool captures GL traces for specific frames. Comparing traces from before and after optimization confirms that we are no longer drawing the redundant window and <code>CustomViewBehind</code> backgrounds. Over the course of multiple interactions, these savings significantly reduce GPU load.</p><p>Detailed documentation: <a href="http://developer.android.com/tools/help/tracer.html">Tracer for OpenGL ES</a></p><h1 id="About-Me-amp-amp-Blog"><a href="#About-Me-amp-amp-Blog" class="headerlink" title="About Me &amp;&amp; Blog"></a>About Me &amp;&amp; Blog</h1><p>(Links and introduction)</p>]]></content>
    
    
    <summary type="html">&lt;h2 id=&quot;Introduction&quot;&gt;&lt;a href=&quot;#Introduction&quot; class=&quot;headerlink&quot; title=&quot;Introduction&quot;&gt;&lt;/a&gt;Introduction&lt;/h2&gt;&lt;p&gt;The &lt;a href=&quot;https://www.androidperformance.com/en/2014/10/20/android-performance-optimization-overdraw-1/&quot;&gt;previous article&lt;/a&gt; covered the theory of overdraw and tools to detect it. While iOS users rely on Apple’s curation, Android users rely on developers’ discipline. Unfortunately, many market-leading Android apps still suffer from significant overdraw issues. As a developer, I want to see Android bridge and eventually surpass the experience gap with iOS.&lt;/p&gt;
&lt;p&gt;This post walks through a practical overdraw optimization process. Since every app is different, these steps are a reference to help you start your own optimization journey.&lt;/p&gt;
&lt;p&gt;If you missed the theory part, check it here: &lt;a href=&quot;https://www.androidperformance.com/en/2014/10/20/android-performance-optimization-overdraw-1/&quot;&gt;Android Performance Optimization: Overdraw (Part 1)&lt;/a&gt;&lt;/p&gt;
&lt;hr&gt;</summary>


    <category term="Android" scheme="https://androidperformance.com/en/categories/Android/"/>
    
    
    <category term="Startup" scheme="https://androidperformance.com/en/tags/Startup/"/>
    
    <category term="Performance" scheme="https://androidperformance.com/en/tags/Performance/"/>
    
    <category term="Overdraw" scheme="https://androidperformance.com/en/tags/Overdraw/"/>
    
  </entry>
  
  <entry>
    <title>Android Performance Optimization: Overdraw - Theory</title>
    <link href="https://androidperformance.com/en/2014/10/20/android-performance-optimization-overdraw-1/"/>
    <id>https://androidperformance.com/en/2014/10/20/android-performance-optimization-overdraw-1/</id>
    <published>2014-10-20T15:19:23.000Z</published>
    <updated>2026-05-10T23:29:51.064Z</updated>
    
    <content type="html"><![CDATA[<p>It’s been a while since my last update. After joining a new company, things have been busy, but I’ve been spending a lot of time researching Android performance. I’ve realized there’s so much I still don’t know, so I’m starting from the application level and working my way down. This series will document my learnings on Android performance optimization.</p><p>First, we’ll discuss <strong>GPU Overdraw</strong>, which is often the most direct point of contact for developers. This topic is split into two parts: Part 1 covers the theory and optimization suggestions, and Part 2 will walk through a practical optimization example.</p><h2 id="What-is-Overdraw"><a href="#What-is-Overdraw" class="headerlink" title="What is Overdraw?"></a>What is Overdraw?</h2><p><strong>GPU Overdraw</strong> refers to the system drawing more than one layer on a single pixel during a frame. For example, if a <code>TextView</code> has a background color, the pixels displaying the text are drawn twice: once for the background and once for the characters. Overdraw inevitably impacts performance because memory bandwidth is finite. When overdraw exceeds the available bandwidth, the frame rate drops. Bandwidth limits vary significantly across different devices.</p><span id="more"></span><p>The overdraw concepts in this article still apply, but the tooling should be updated. Hierarchy Viewer, ADT, monitor, and Tracer for OpenGL are older entry points. Today, first use Debug GPU Overdraw&#x2F;Profile GPU Rendering in Developer Options to find suspicious screens, then use Layout Inspector&#x2F;Compose Layout Inspector to inspect hierarchy, backgrounds, useless parents, and Compose recomposition, and finally use Perfetto Frame Timeline&#x2F;System Trace to verify whether missed frames, draw cost, or SurfaceFlinger composition pressure actually improved.</p><h2 id="Causes-of-Overdraw"><a href="#Causes-of-Overdraw" class="headerlink" title="Causes of Overdraw"></a>Causes of Overdraw</h2><ol><li>Too many overlapping Views.</li><li>Complex, deeply nested view hierarchies.</li><li>Long inflation times due to complex XML.</li></ol><h2 id="Impact-of-Poor-XML-Layouts"><a href="#Impact-of-Poor-XML-Layouts" class="headerlink" title="Impact of Poor XML Layouts"></a>Impact of Poor XML Layouts</h2><ol><li><strong>Inflation Overhead</strong>: Layout files are XML. Inflation involves parsing XML, creating objects, and linking them. More tags, attributes, and deeper trees increase the time spent in parsing, recursion, and function calls.</li><li><strong>Lifecycle Bottlenecks</strong>: Inflation is just the beginning. After <code>requestLayout</code>, the system must execute <code>measure</code>, <code>layout</code>, and <code>draw</code>. The time for each step is dictated by layout quality. Poorly designed layouts increase the cost of every frame, leading to noticeable delays in rendering.</li></ol><h2 id="Basic-Tools-for-Detecting-Overdraw"><a href="#Basic-Tools-for-Detecting-Overdraw" class="headerlink" title="Basic Tools for Detecting Overdraw"></a>Basic Tools for Detecting Overdraw</h2><p>Android provides three primary tools: <strong>Hierarchy Viewer</strong>, <strong>Tracer for OpenGL</strong>, and <strong>Show GPU Overdraw</strong>. The first two are found in the SDK monitor tools, while the last is a built-in Developer Option.</p><ol><li><strong>Testing</strong>: Enable “Debug GPU Overdraw” in Developer Options. (On some devices like Meizu, look under Accessibility -&gt; Developer Tools -&gt; Hardware Accelerated Rendering -&gt; Debug GPU Overdraw -&gt; Show Overdraw Areas. Note: Meizu phones require enabling developer mode first by dialing <code>*#*#6961#*#*</code> in the phone app). This feature is available only on Android 4.2 and above.</li><li><strong>Color Coding</strong>: Overdraw is visualized from best to worst: <strong>Blue -&gt; Green -&gt; Light Red -&gt; Red</strong>.<ul><li><strong>Blue</strong>: 1x overdraw (optimal).</li><li><strong>Green</strong>: 2x overdraw.</li><li><strong>Light Red</strong>: 3x overdraw.</li><li><strong>Red</strong>: 4x+ overdraw (critical issue).</li></ul></li><li><strong>Acceptance Criteria</strong>:<ul><li>Aim to keep overdraw at 2x or lower.</li><li>Avoid 4x overdraw entirely.</li><li>Avoid 3x overdraw (Light Red) areas larger than 1&#x2F;4 of the screen.</li></ul></li></ol><h2 id="Optimization-Tools"><a href="#Optimization-Tools" class="headerlink" title="Optimization Tools"></a>Optimization Tools</h2><h3 id="1-Lint"><a href="#1-Lint" class="headerlink" title="1. Lint"></a>1. Lint</h3><ul><li><strong>Eclipse</strong>: Click to run, suggestions appear in the bottom window.</li><li><strong>Android Studio</strong>: Built-in Lint tool highlights suboptimal code or layouts in yellow.</li><li>Lint provides excellent suggestions for both UI and code risks. A good rule of thumb is to clear as many Lint warnings as possible.</li><li>It can also be run via the command line. For details, refer to: <a href="http://tools.android.com/">tools.android.com</a></li></ul><p><img src="/en/images/overdraw-1/lint.webp" alt="Lint"></p><h3 id="2-Common-Lint-Suggestions-from-official-documentation"><a href="#2-Common-Lint-Suggestions-from-official-documentation" class="headerlink" title="2. Common Lint Suggestions (from official documentation)"></a>2. Common Lint Suggestions (from official documentation)</h3><ul><li><strong>Use compound drawables</strong>: A <code>LinearLayout</code> containing an <code>ImageView</code> and a <code>TextView</code> can often be replaced by a single <code>TextView</code> with a <code>drawableStart</code> (compound drawable).</li><li><strong>Merge root frame</strong>: If a <code>FrameLayout</code> is the root and provides no background&#x2F;padding, replace it with a <code>&lt;merge&gt;</code> tag to flatten the hierarchy.</li><li><strong>Remove useless leaves</strong>: A layout with no children or background can often be removed (since it’s invisible) for a flatter and more efficient layout hierarchy.</li><li><strong>Remove useless parents</strong>: A layout with children that has no siblings, is not a <code>ScrollView</code> or root layout, and has no background can be removed, moving its children directly into the parent for a flatter hierarchy.</li><li><strong>Flatten Deep Layouts</strong>: Avoid deep nesting. Use <code>RelativeLayout</code> or <code>GridLayout</code> to improve performance. The default maximum depth warning threshold is configurable.</li></ul><h3 id="3-Hierarchy-Viewer-HV"><a href="#3-Hierarchy-Viewer-HV" class="headerlink" title="3. Hierarchy Viewer (HV)"></a>3. Hierarchy Viewer (HV)</h3><p>This tool is part of ADT (or monitor - newer SDK versions recommend using monitor instead of standalone HV). It’s invaluable for analyzing view hierarchies and identifying layout issues. By default, HV works only on non-encrypted devices (engineering devices, tablets, or emulators). To use it on any phone, you need to add <code>ViewServer</code> to your app (an open-source library). Connect your device, open Hierarchy Viewer (located in <code>tools/</code> directory, run <code>hierarchyviewer</code> command), select the target process, and click “Load View Hierarchy” to display the current interface’s layout tree. Each node shows three traffic lights representing the performance of <strong>Measure, Layout, and Draw</strong> operations.</p><h2 id="Layout-Optimization-Principles"><a href="#Layout-Optimization-Principles" class="headerlink" title="Layout Optimization Principles"></a>Layout Optimization Principles</h2><p>By following these best practices, you can create high-performance, reusable UIs:</p><ul><li>Prefer <code>RelativeLayout</code> and <code>LinearLayout</code> over <code>AbsoluteLayout</code>.<ul><li>For layouts with similar hierarchy depth, <code>LinearLayout</code> is slightly more efficient than <code>RelativeLayout</code>.</li><li>For complex layouts, use <code>RelativeLayout</code> to avoid the nesting that <code>LinearLayout</code> would require.</li></ul></li><li>Extract reusable components using the <code>&lt;include&gt;</code> tag.</li><li>Use <code>&lt;ViewStub&gt;</code> for layouts not needed at startup.</li><li>Dynamic inflation performs better than <code>setVisibility()</code>. However, <code>ViewStub</code> is the best choice.</li><li>Use the <code>&lt;merge&gt;</code> tag to reduce hierarchy depth.</li><li><strong>Remove redundant backgrounds</strong>: Use Hierarchy Viewer to export layers as PSD files and inspect in Photoshop (see this <a href="https://www.youtube.com/watch?v=URyoiAt8098">video tutorial</a>).<ul><li>For multi-layered layouts, only the top layer should have a solid background color.</li><li>For selectors used as backgrounds (e.g., in ListView items), set the “normal” state to <code>@android:color/transparent</code>.</li></ul></li><li>Avoid <code>layout_weight</code> in nested <code>LinearLayouts</code>, as it requires children to be measured twice. This is especially critical in <code>ListView</code> and <code>GridView</code> where items are repeatedly created.</li><li>Keep layouts <strong>broad and shallow</strong> instead of narrow and deep (visible in Hierarchy Viewer’s Tree view).</li></ul><h2 id="Source-Code-References"><a href="#Source-Code-References" class="headerlink" title="Source Code References"></a>Source Code References</h2><p>For those interested in the underlying implementation:</p><p>Overdraw rendering logic is located at: <code>/frameworks/base/libs/hwui/OpenGLRenderer.cpp</code></p><figure class="highlight cpp"><table><tr><td class="gutter"><pre><span class="line">1</span><br><span class="line">2</span><br><span class="line">3</span><br><span class="line">4</span><br><span class="line">5</span><br><span class="line">6</span><br><span class="line">7</span><br><span class="line">8</span><br><span class="line">9</span><br><span class="line">10</span><br><span class="line">11</span><br><span class="line">12</span><br><span class="line">13</span><br><span class="line">14</span><br><span class="line">15</span><br><span class="line">16</span><br><span class="line">17</span><br><span class="line">18</span><br><span class="line">19</span><br><span class="line">20</span><br><span class="line">21</span><br><span class="line">22</span><br><span class="line">23</span><br><span class="line">24</span><br><span class="line">25</span><br><span class="line">26</span><br><span class="line">27</span><br><span class="line">28</span><br><span class="line">29</span><br><span class="line">30</span><br><span class="line">31</span><br><span class="line">32</span><br><span class="line">33</span><br><span class="line">34</span><br><span class="line">35</span><br><span class="line">36</span><br><span class="line">37</span><br><span class="line">38</span><br><span class="line">39</span><br><span class="line">40</span><br><span class="line">41</span><br><span class="line">42</span><br></pre></td><td class="code"><pre><span class="line"><span class="function"><span class="type">void</span> <span class="title">OpenGLRenderer::renderOverdraw</span><span class="params">()</span> </span>&#123;</span><br><span class="line">    <span class="keyword">if</span> (mCaches.debugOverdraw &amp;&amp; <span class="built_in">getTargetFbo</span>() == <span class="number">0</span>) &#123;</span><br><span class="line">        <span class="type">const</span> Rect* clip = &amp;mTilingClip;</span><br><span class="line"></span><br><span class="line">        mCaches.<span class="built_in">enableScissor</span>();</span><br><span class="line">        mCaches.<span class="built_in">setScissor</span>(clip-&gt;left, mFirstSnapshot-&gt;height - clip-&gt;bottom,</span><br><span class="line">                clip-&gt;right - clip-&gt;left, clip-&gt;bottom - clip-&gt;top);</span><br><span class="line"></span><br><span class="line">        <span class="comment">// 1x overdraw</span></span><br><span class="line">        mCaches.stencil.<span class="built_in">enableDebugTest</span>(<span class="number">2</span>);</span><br><span class="line">        <span class="built_in">drawColor</span>(mCaches.<span class="built_in">getOverdrawColor</span>(<span class="number">1</span>), SkXfermode::kSrcOver_Mode);</span><br><span class="line"></span><br><span class="line">        <span class="comment">// 2x overdraw</span></span><br><span class="line">        mCaches.stencil.<span class="built_in">enableDebugTest</span>(<span class="number">3</span>);</span><br><span class="line">        <span class="built_in">drawColor</span>(mCaches.<span class="built_in">getOverdrawColor</span>(<span class="number">2</span>), SkXfermode::kSrcOver_Mode);</span><br><span class="line"></span><br><span class="line">        <span class="comment">// 3x overdraw</span></span><br><span class="line">        mCaches.stencil.<span class="built_in">enableDebugTest</span>(<span class="number">4</span>);</span><br><span class="line">        <span class="built_in">drawColor</span>(mCaches.<span class="built_in">getOverdrawColor</span>(<span class="number">3</span>), SkXfermode::kSrcOver_Mode);</span><br><span class="line"></span><br><span class="line">        <span class="comment">// 4x overdraw and higher</span></span><br><span class="line">        mCaches.stencil.<span class="built_in">enableDebugTest</span>(<span class="number">4</span>, <span class="literal">true</span>);</span><br><span class="line">        <span class="built_in">drawColor</span>(mCaches.<span class="built_in">getOverdrawColor</span>(<span class="number">4</span>), SkXfermode::kSrcOver_Mode);</span><br><span class="line"></span><br><span class="line">        mCaches.stencil.<span class="built_in">disable</span>();</span><br><span class="line">    &#125;</span><br><span class="line">&#125;</span><br><span class="line"></span><br><span class="line"><span class="function"><span class="type">void</span> <span class="title">OpenGLRenderer::countOverdraw</span><span class="params">()</span> </span>&#123;</span><br><span class="line">    <span class="type">size_t</span> count = mWidth * mHeight;</span><br><span class="line">    <span class="type">uint32_t</span>* buffer = <span class="keyword">new</span> <span class="type">uint32_t</span>[count];</span><br><span class="line">    <span class="built_in">glReadPixels</span>(<span class="number">0</span>, <span class="number">0</span>, mWidth, mHeight, GL_RGBA, GL_UNSIGNED_BYTE, &amp;buffer[<span class="number">0</span>]);</span><br><span class="line"></span><br><span class="line">    <span class="type">size_t</span> total = <span class="number">0</span>;</span><br><span class="line">    <span class="keyword">for</span> (<span class="type">size_t</span> i = <span class="number">0</span>; i &lt; count; i++) &#123;</span><br><span class="line">        total += buffer[i] &amp; <span class="number">0xff</span>;</span><br><span class="line">    &#125;</span><br><span class="line"></span><br><span class="line">    mOverdraw = total / <span class="built_in">float</span>(count);</span><br><span class="line"></span><br><span class="line">    <span class="keyword">delete</span>[] buffer;</span><br><span class="line">&#125;</span><br></pre></td></tr></table></figure><p>For QA teams, there’s also an OverDraw numerical metric. The source code for this is located in <code>Framework/base/core/java/android/view/HardwareRender.java</code> (note: this display was removed in Android 5.0):</p><figure class="highlight java"><table><tr><td class="gutter"><pre><span class="line">1</span><br><span class="line">2</span><br><span class="line">3</span><br><span class="line">4</span><br><span class="line">5</span><br><span class="line">6</span><br><span class="line">7</span><br><span class="line">8</span><br><span class="line">9</span><br><span class="line">10</span><br><span class="line">11</span><br><span class="line">12</span><br><span class="line">13</span><br><span class="line">14</span><br><span class="line">15</span><br><span class="line">16</span><br><span class="line">17</span><br><span class="line">18</span><br><span class="line">19</span><br><span class="line">20</span><br><span class="line">21</span><br><span class="line">22</span><br><span class="line">23</span><br><span class="line">24</span><br><span class="line">25</span><br><span class="line">26</span><br><span class="line">27</span><br><span class="line">28</span><br><span class="line">29</span><br><span class="line">30</span><br><span class="line">31</span><br><span class="line">32</span><br><span class="line">33</span><br><span class="line">34</span><br><span class="line">35</span><br><span class="line">36</span><br><span class="line">37</span><br><span class="line">38</span><br></pre></td><td class="code"><pre><span class="line"><span class="keyword">private</span> <span class="keyword">void</span> <span class="title function_">debugOverdraw</span><span class="params">(View.AttachInfo attachInfo, Rect dirty,</span></span><br><span class="line"><span class="params">                HardwareCanvas canvas, DisplayList displayList)</span> &#123;</span><br><span class="line"></span><br><span class="line">            <span class="keyword">if</span> (mDebugOverdraw == OVERDRAW_TYPE_COUNT) &#123;</span><br><span class="line">                <span class="keyword">if</span> (mDebugOverdrawLayer == <span class="literal">null</span>) &#123;</span><br><span class="line">                    mDebugOverdrawLayer = createHardwareLayer(mWidth, mHeight, <span class="literal">true</span>);</span><br><span class="line">                &#125; <span class="keyword">else</span> <span class="keyword">if</span> (mDebugOverdrawLayer.getWidth() != mWidth ||</span><br><span class="line">                        mDebugOverdrawLayer.getHeight() != mHeight) &#123;</span><br><span class="line">                    mDebugOverdrawLayer.resize(mWidth, mHeight);</span><br><span class="line">                &#125;</span><br><span class="line"></span><br><span class="line">                <span class="keyword">if</span> (!mDebugOverdrawLayer.isValid()) &#123;</span><br><span class="line">                    mDebugOverdraw = -<span class="number">1</span>;</span><br><span class="line">                    <span class="keyword">return</span>;</span><br><span class="line">                &#125;</span><br><span class="line"></span><br><span class="line">                <span class="type">HardwareCanvas</span> <span class="variable">layerCanvas</span> <span class="operator">=</span> mDebugOverdrawLayer.start(canvas, dirty);</span><br><span class="line">                countOverdraw(layerCanvas);</span><br><span class="line">                <span class="keyword">final</span> <span class="type">int</span> <span class="variable">restoreCount</span> <span class="operator">=</span> layerCanvas.save();</span><br><span class="line">                layerCanvas.drawDisplayList(displayList, <span class="literal">null</span>, DisplayList.FLAG_CLIP_CHILDREN);</span><br><span class="line">                layerCanvas.restoreToCount(restoreCount);</span><br><span class="line">                mDebugOverdrawLayer.end(canvas);</span><br><span class="line"></span><br><span class="line">                <span class="type">float</span> <span class="variable">overdraw</span> <span class="operator">=</span> getOverdraw(layerCanvas);</span><br><span class="line">                <span class="type">DisplayMetrics</span> <span class="variable">metrics</span> <span class="operator">=</span> attachInfo.mRootView.getResources().getDisplayMetrics();</span><br><span class="line"></span><br><span class="line">                drawOverdrawCounter(canvas, overdraw, metrics.density);</span><br><span class="line">            &#125;</span><br><span class="line">&#125;</span><br><span class="line"></span><br><span class="line"><span class="keyword">private</span> <span class="keyword">void</span> <span class="title function_">drawOverdrawCounter</span><span class="params">(HardwareCanvas canvas, <span class="type">float</span> overdraw, <span class="type">float</span> density)</span> &#123;</span><br><span class="line">            <span class="keyword">final</span> <span class="type">String</span> <span class="variable">text</span> <span class="operator">=</span> String.format(<span class="string">&quot;%.2fx&quot;</span>, overdraw);</span><br><span class="line">            <span class="keyword">final</span> <span class="type">Paint</span> <span class="variable">paint</span> <span class="operator">=</span> setupPaint(density);</span><br><span class="line">            <span class="comment">// HSBtoColor will clamp the values in the 0..1 range</span></span><br><span class="line">            paint.setColor(Color.HSBtoColor(<span class="number">0.28f</span> - <span class="number">0.28f</span> * overdraw / <span class="number">3.5f</span>, <span class="number">0.8f</span>, <span class="number">1.0f</span>));</span><br><span class="line"></span><br><span class="line">            canvas.drawText(text, density * <span class="number">4.0f</span>, mHeight - paint.getFontMetrics().bottom, paint);</span><br><span class="line">&#125;</span><br></pre></td></tr></table></figure><h2 id="Reference-Articles"><a href="#Reference-Articles" class="headerlink" title="Reference Articles"></a>Reference Articles</h2><ol><li><a href="http://www.curious-creature.org/2012/12/01/android-performance-case-study/">Optimization Process</a></li><li><a href="http://blog.csdn.net/yihongyuelan/article/details/12169647">Decompiling and Adding GPU Display</a></li><li><a href="http://developer.android.com/training/improving-layouts/optimizing-layout.html#Inspect">Optimizing Layouts</a></li><li><a href="http://developer.android.com/training/improving-layouts/reusing-layouts.html">Reusing Layouts</a></li><li><a href="http://developer.android.com/training/improving-layouts/loading-ondemand.html">Loading Layouts On-Demand</a></li><li><a href="http://developer.android.com/training/improving-layouts/smooth-scrolling.html">Smooth Scrolling</a></li><li><a href="http://developer.android.com/tools/help/hierarchy-viewer.html">Hierarchy Viewer Documentation</a></li><li><a href="http://tools.android.com/tips/lint">Lint Tips</a></li></ol><h1 id="About-Me-amp-amp-Blog"><a href="#About-Me-amp-amp-Blog" class="headerlink" title="About Me &amp;&amp; Blog"></a>About Me &amp;&amp; Blog</h1><p>Here’s my personal introduction and related links. I look forward to exchanging ideas with fellow developers - “When three walk together, there must be one who can be my teacher!”</p><ol><li><a href="/en/about/">About the Author</a> : Includes my WeChat and WeChat group links.</li><li><a href="/en/2019/12/01/BlogMap/">Blog Content Navigation</a> : A navigation guide to my blog content.</li><li><a href="/en/2018/05/07/Android-performance-optimization-skills-and-tools/">Personally Curated Excellent Blog Articles - Must-Know Android Performance Optimization</a> : Welcome to recommend articles (contact me via WeChat).</li><li><a href="/en/2023/12/30/the-performance/">Android Performance Optimization Knowledge Planet</a> : Welcome to join, thank you for your support!</li></ol><blockquote><p><strong>One person can walk faster, but a group can walk farther.</strong></p></blockquote><p><img src="/en/images/WechatIMG581.webp" alt="WeChat QR Code"></p>]]></content>


    
    
    <summary type="html">&lt;p&gt;It’s been a while since my last update. After joining a new company, things have been busy, but I’ve been spending a lot of time researching Android performance. I’ve realized there’s so much I still don’t know, so I’m starting from the application level and working my way down. This series will document my learnings on Android performance optimization.&lt;/p&gt;
&lt;p&gt;First, we’ll discuss &lt;strong&gt;GPU Overdraw&lt;/strong&gt;, which is often the most direct point of contact for developers. This topic is split into two parts: Part 1 covers the theory and optimization suggestions, and Part 2 will walk through a practical optimization example.&lt;/p&gt;
&lt;h2 id=&quot;What-is-Overdraw&quot;&gt;&lt;a href=&quot;#What-is-Overdraw&quot; class=&quot;headerlink&quot; title=&quot;What is Overdraw?&quot;&gt;&lt;/a&gt;What is Overdraw?&lt;/h2&gt;&lt;p&gt;&lt;strong&gt;GPU Overdraw&lt;/strong&gt; refers to the system drawing more than one layer on a single pixel during a frame. For example, if a &lt;code&gt;TextView&lt;/code&gt; has a background color, the pixels displaying the text are drawn twice: once for the background and once for the characters. Overdraw inevitably impacts performance because memory bandwidth is finite. When overdraw exceeds the available bandwidth, the frame rate drops. Bandwidth limits vary significantly across different devices.&lt;/p&gt;</summary>


    <category term="Android" scheme="https://androidperformance.com/en/categories/Android/"/>
    
    
    <category term="Android" scheme="https://androidperformance.com/en/tags/Android/"/>
    
    <category term="Memory" scheme="https://androidperformance.com/en/tags/Memory/"/>
    
    <category term="Performance" scheme="https://androidperformance.com/en/tags/Performance/"/>
    
    <category term="Overdraw" scheme="https://androidperformance.com/en/tags/Overdraw/"/>
    
  </entry>
  
  <entry>
    <title>Android Tips: How to Prevent EditText from Automatically Getting Focus</title>
    <link href="https://androidperformance.com/en/2014/06/03/android-edittext-do-not-auto-get-focus/"/>
    <id>https://androidperformance.com/en/2014/06/03/android-edittext-do-not-auto-get-focus/</id>
    <published>2014-06-02T16:31:49.000Z</published>
    <updated>2026-05-10T23:29:51.064Z</updated>
    
    <content type="html"><![CDATA[<p>In Android development, using <code>EditText</code> is very common. However, sometimes <code>EditText</code> automatically grabs focus when entering a page, causing the soft keyboard to pop up immediately. While this is convenient in some cases, most of the time we prefer the keyboard to appear only when the user explicitly clicks on the <code>EditText</code>.</p><span id="more"></span><p>Here is a simple and practical trick. You just need to add the following two attributes to the <strong>parent Layout</strong> of the <code>EditText</code>:</p><figure class="highlight xml"><table><tr><td class="gutter"><pre><span class="line">1</span><br><span class="line">2</span><br></pre></td><td class="code"><pre><span class="line">android:focusable=&quot;true&quot;</span><br><span class="line">android:focusableInTouchMode=&quot;true&quot;</span><br></pre></td></tr></table></figure><p>The principle behind this is simple: when the user enters the page, the parent control captures the focus first. As a result, the <code>EditText</code> does not get focus, and the soft keyboard does not pop up automatically. The keyboard will only appear when the user clicks on the <code>EditText</code>.</p><h1 id="About-Me-amp-amp-Blog"><a href="#About-Me-amp-amp-Blog" class="headerlink" title="About Me &amp;&amp; Blog"></a>About Me &amp;&amp; Blog</h1><p>Below is my personal intro and related links. I look forward to exchanging ideas with fellow professionals. “When three walk together, one can always be my teacher!”</p><ol><li><a href="https://www.androidperformance.com/en/about/">Blogger Intro</a></li><li><a href="https://www.androidperformance.com/en/2019/12/01/BlogMap/">Blog Content Navigation</a>: A guide for my blog content.</li><li><a href="https://www.androidperformance.com/en/2018/05/07/Android-performance-optimization-skills-and-tools/">Curated Excellent Blog Articles - Android Performance Optimization Must-Knows</a></li><li><a href="https://www.androidperformance.com/en/2023/12/30/the-performance/">Android Performance Optimization Knowledge Planet</a></li></ol><blockquote><p><strong>One walks faster alone, but a group walks further together.</strong></p></blockquote><p><img src="/en/images/WechatIMG581.webp" alt="Scan WeChat QR Code"></p>]]></content>
    
    
    <summary type="html">&lt;p&gt;In Android development, using &lt;code&gt;EditText&lt;/code&gt; is very common. However, sometimes &lt;code&gt;EditText&lt;/code&gt; automatically grabs focus when entering a page, causing the soft keyboard to pop up immediately. While this is convenient in some cases, most of the time we prefer the keyboard to appear only when the user explicitly clicks on the &lt;code&gt;EditText&lt;/code&gt;.&lt;/p&gt;</summary>


    <category term="Android" scheme="https://androidperformance.com/en/categories/Android/"/>
    
    
    <category term="Android" scheme="https://androidperformance.com/en/tags/Android/"/>
    
    <category term="Java" scheme="https://androidperformance.com/en/tags/Java/"/>
    
  </entry>
  
  <entry>
    <title>Android Tips Round-Up, Part 2</title>
    <link href="https://androidperformance.com/en/2014/05/31/android-tips-round-up-2/"/>
    <id>https://androidperformance.com/en/2014/05/31/android-tips-round-up-2/</id>
    <published>2014-05-31T10:20:47.000Z</published>
    <updated>2026-05-10T23:29:51.066Z</updated>
    
    <content type="html"><![CDATA[<p>Here’s the second round-up of Android tips I’ve been posting.</p><span id="more"></span><p><a href="http://developer.android.com/reference/android/text/format/DateUtils.html?ref=blog.danlew.net#formatDateTime%28android.content.Context,%20long,%20int%29">DateUtils.formatDateTime()</a> - One-stop shop for localized date&#x2F;time strings.</p><p>[AlarmManager.setInexactRepeating](<a href="http://developer.android.com/reference/android/app/AlarmManager.html?ref=blog.danlew.net#setInexactRepeating">http://developer.android.com/reference/android/app/AlarmManager.html?ref=blog.danlew.net#setInexactRepeating</a>(int, long, long, android.app.PendingIntent)) - Saves on battery life by grouping multiple alarms together. Even if you’re only calling a single alarm this is better (just make sure to call AlarmManager.cancel() when done).</p><p>[Formatter.formatFileSize()](<a href="http://developer.android.com/reference/android/text/format/Formatter.html?ref=blog.danlew.net#formatFileSize">http://developer.android.com/reference/android/text/format/Formatter.html?ref=blog.danlew.net#formatFileSize</a>(android.content.Context, long)) - A localized file size formatter.</p><p><a href="http://developer.android.com/reference/android/app/ActionBar.html?ref=blog.danlew.net#hide()">ActionBar.hide()</a>&#x2F;<a href="http://developer.android.com/reference/android/app/ActionBar.html?ref=blog.danlew.net#show()">.show()</a> - Animates the action bar hiding&#x2F;showing. Lets you switch to full-screen gracefully.</p><p>[Linkify.addLinks()](<a href="http://developer.android.com/reference/android/text/util/Linkify.html?ref=blog.danlew.net#addLinks">http://developer.android.com/reference/android/text/util/Linkify.html?ref=blog.danlew.net#addLinks</a>(android.text.Spannable, int)) - If you need to control how links are added to text.</p><p><a href="http://developer.android.com/reference/android/text/StaticLayout.html?ref=blog.danlew.net">StaticLayout</a> - Useful for measuring text that you’re about to render into a custom View.</p><p><a href="http://developer.android.com/reference/android/app/Activity.html?ref=blog.danlew.net#onBackPressed()">Activity.onBackPressed()</a> - Easy way to manage the back button. While I wouldn’t normally hijack back, sometimes it’s necessary to make a flow work.</p><p><a href="http://developer.android.com/reference/android/view/GestureDetector.html?ref=blog.danlew.net">GestureDetector</a> - Listens to motion events and fires listener events for common actions (like clicks, scrolls and flings). So much easier than implementing your own motion event system.</p><p><a href="http://developer.android.com/reference/android/graphics/DrawFilter.html?ref=blog.danlew.net">DrawFilter</a> - Lets you manipulate a Canvas even if you’re not calling the draw commands. For example, you could create a custom View which sets a DrawFilter which anti-aliases the draws of the parent View.</p><p><a href="http://developer.android.com/reference/android/app/ActivityManager.html?ref=blog.danlew.net#getMemoryClass()">ActivityManager.getMemoryClass()</a> - Gives you an idea of how much memory the device has. Great for figuring out how large to make your caches.</p><p><a href="http://developer.android.com/reference/android/os/SystemClock.html?ref=blog.danlew.net#sleep(long)">SystemClock.sleep()</a> - Convenience method which guarantees sleeping the amount of time entered. I use it for debugging and simulating network delays.</p><p><a href="http://developer.android.com/reference/android/view/ViewStub.html?ref=blog.danlew.net">ViewStub</a> - A View that initially does nothing, but can later inflate a layout. This is a great placeholder for lazy-loading Views. Its only drawback is that it doesn’t support <code>&lt;merge&gt;</code> tags, so it can create unnecessary nesting in the hierarchy if you’re not careful.</p><p><a href="http://developer.android.com/reference/android/util/DisplayMetrics.html?ref=blog.danlew.net#density">DisplayMetrics.density</a> - You can get the density of the screen this way. Most of the time you’ll be better off letting the system scale dimensions automatically, but occasionally it’s useful to have more control (especially with custom Views).</p><p>[Pair.create()](<a href="http://developer.android.com/reference/android/util/Pair.html?ref=blog.danlew.net#create">http://developer.android.com/reference/android/util/Pair.html?ref=blog.danlew.net#create</a>(A, B)) - Handy class, handy creator method.</p><h2 id="More"><a href="#More" class="headerlink" title="More"></a>More</h2><ol><li><a href="https://www.androidperformance.com/en/android-tips-round-up-1.html">Part 1</a></li><li><a href="https://www.androidperformance.com/en/android-tips-round-up-2.html">Part 2</a></li><li><a href="https://www.androidperformance.com/en/android-tips-round-up-3.html">Part 3</a></li><li><a href="https://www.androidperformance.com/en/android-tips-round-up-4.html">Part 4</a></li><li><a href="https://www.androidperformance.com/en/android-tips-round-up-5.html">Part 5</a></li></ol><p>Original Article: <a href="http://blog.danlew.net/2014/04/14/android-tips-round-up-part-2/">http://blog.danlew.net/2014/04/14/android-tips-round-up-part-2/</a></p><h1 id="About-Me-amp-amp-Blog"><a href="#About-Me-amp-amp-Blog" class="headerlink" title="About Me &amp;&amp; Blog"></a>About Me &amp;&amp; Blog</h1><p>Below is my personal intro and related links. I look forward to exchanging ideas with fellow professionals. “When three walk together, one can always be my teacher!”</p><ol><li><a href="https://www.androidperformance.com/en/about/">Blogger Intro</a></li><li><a href="https://www.androidperformance.com/en/2019/12/01/BlogMap/">Blog Content Navigation</a>: A guide for my blog content.</li><li><a href="https://www.androidperformance.com/en/2018/05/07/Android-performance-optimization-skills-and-tools/">Curated Excellent Blog Articles - Android Performance Optimization Must-Knows</a></li><li><a href="https://www.androidperformance.com/en/2023/12/30/the-performance/">Android Performance Optimization Knowledge Planet</a></li></ol><blockquote><p><strong>One walks faster alone, but a group walks further together.</strong></p></blockquote><p><img src="/en/images/WechatIMG581.webp" alt="Scan WeChat QR Code"></p>]]></content>
    
    
    <summary type="html">&lt;p&gt;Here’s the second round-up of Android tips I’ve been posting.&lt;/p&gt;</summary>


    <category term="Android" scheme="https://androidperformance.com/en/categories/Android/"/>
    
    
    <category term="Android" scheme="https://androidperformance.com/en/tags/Android/"/>
    
    <category term="Memory" scheme="https://androidperformance.com/en/tags/Memory/"/>
    
  </entry>
  
  <entry>
    <title>Android Tips Round-Up, Part 1</title>
    <link href="https://androidperformance.com/en/2014/05/28/android-tips-round-up-1/"/>
    <id>https://androidperformance.com/en/2014/05/28/android-tips-round-up-1/</id>
    <published>2014-05-28T15:47:43.000Z</published>
    <updated>2026-05-10T23:29:51.066Z</updated>
    
    <content type="html"><![CDATA[<p><a href="https://blog.danlew.net/2014/03/17/android-tip-of-the-day/">With my recent project</a> I’ve been posting one Android class&#x2F;method a day. People have been asking for an archive of these links, so every couple weeks I’m going to round them up here. I’ll also be adding a bit of color commentary, but still the goal is for this not to be a ton of work for me. :)</p><span id="more"></span><p><a href="http://developer.android.com/reference/android/app/Activity.html?ref=blog.danlew.net#startActivities(android.content.Intent%5B%5D)">Activity.startActivities()</a> - Nice for launching to the middle of an app flow.</p><p><a href="http://developer.android.com/reference/android/text/TextUtils.html?ref=blog.danlew.net#isEmpty(java.lang.CharSequence)">TextUtils.isEmpty()</a> - Simple utility I use everywhere.</p><p><a href="http://developer.android.com/reference/android/text/Html.html?ref=blog.danlew.net#fromHtml(java.lang.String)">Html.fromHtml()</a> - Quick method for formatting Html. It’s not particularly fast so I wouldn’t use it constantly (e.g., don’t use it just to bold part of a string - <a href="http://flavienlaurent.com/blog/2014/01/31/spans/?ref=blog.danlew.net">construct the Spannable manually instead</a>), but it’s fine for rendering text obtained from the web.</p><p><a href="http://developer.android.com/reference/android/widget/TextView.html?ref=blog.danlew.net#setError%28java.lang.CharSequence%29">TextView.setError()</a> - Nice UI when validating user input.</p><p><a href="http://developer.android.com/reference/android/os/Build.VERSION_CODES.html?ref=blog.danlew.net">Build.VERSION_CODES</a> - Not only is it handy for routing code, it’s also summarizes behavioral differences between each version of Android.</p><p><a href="http://developer.android.com/reference/android/util/Log.html?ref=blog.danlew.net#getStackTraceString(java.lang.Throwable)">Log.getStackTraceString()</a> - Convenience utility for logging.</p><p><a href="http://developer.android.com/reference/android/view/LayoutInflater.html?ref=blog.danlew.net#from%28android.content.Context%29">LayoutInflater.from()</a> - Wraps the long-winded getSystemService() call in a simple utility.</p><p><a href="http://developer.android.com/reference/android/view/ViewConfiguration.html?ref=blog.danlew.net#getScaledTouchSlop%28%29">ViewConfiguration.getScaledTouchSlop()</a> - Using the values provided in ViewConfiguration ensures all touch interaction feels consistent across the OS.</p><p><a href="http://developer.android.com/reference/android/telephony/PhoneNumberUtils.html?ref=blog.danlew.net#convertKeypadLettersToDigits%28java.lang.String%29">PhoneNumberUtils.convertKeypadLettersToDigits</a> - Makes handling phone number data a snap, as some companies provide them as letters.</p><p><a href="http://developer.android.com/reference/android/content/Context.html?ref=blog.danlew.net#getCacheDir%28%29">Context.getCacheDir()</a> - Use the cache dir for caching data. Simple enough but some don’t know it exists.</p><p><a href="http://developer.android.com/reference/android/animation/ArgbEvaluator.html?ref=blog.danlew.net">ArgbEvaluator</a> - Transition from one color to another. <a href="https://plus.google.com/108078989781026808271/posts/SbieMPqa2by?ref=blog.danlew.net">As was pointed out by Chris Banes</a>, this class creates a lot of autoboxing churn so it’d be better to just rip out the logic and run it yourself.</p><p><a href="http://developer.android.com/reference/android/view/ContextThemeWrapper.html?ref=blog.danlew.net">ContextThemeWrapper</a> - Nice class for changing the theme of a Context on the fly.</p><p><a href="http://developer.android.com/reference/android/widget/Space.html?ref=blog.danlew.net">Space</a> - Lightweight View which skips drawing. Great for any situation that might require a placeholder.</p><p><a href="http://developer.android.com/reference/android/animation/ValueAnimator.html?ref=blog.danlew.net#reverse%28%29">ValueAnimator.reverse()</a> - I love this for canceling animations smoothly.</p><h2 id="More"><a href="#More" class="headerlink" title="More"></a>More</h2><ol><li><a href="https://www.androidperformance.com/en/android-tips-round-up-1.html">Part 1</a></li><li><a href="https://www.androidperformance.com/en/android-tips-round-up-2.html">Part 2</a></li><li><a href="https://www.androidperformance.com/en/android-tips-round-up-3.html">Part 3</a></li><li><a href="https://www.androidperformance.com/en/android-tips-round-up-4.html">Part 4</a></li><li><a href="https://www.androidperformance.com/en/android-tips-round-up-5.html">Part 5</a></li></ol><p>Original Article: <a href="http://blog.danlew.net/2014/03/30/android-tips-round-up-part-1/">http://blog.danlew.net/2014/03/30/android-tips-round-up-part-1/</a></p><h1 id="About-Me-amp-amp-Blog"><a href="#About-Me-amp-amp-Blog" class="headerlink" title="About Me &amp;&amp; Blog"></a>About Me &amp;&amp; Blog</h1><p>Below is my personal intro and related links. I look forward to exchanging ideas with fellow professionals. “When three walk together, one can always be my teacher!”</p><ol><li><a href="https://www.androidperformance.com/en/about/">Blogger Intro</a></li><li><a href="https://www.androidperformance.com/en/2019/12/01/BlogMap/">Blog Content Navigation</a>: A guide for my blog content.</li><li><a href="https://www.androidperformance.com/en/2018/05/07/Android-performance-optimization-skills-and-tools/">Curated Excellent Blog Articles - Android Performance Optimization Must-Knows</a></li><li><a href="https://www.androidperformance.com/en/2023/12/30/the-performance/">Android Performance Optimization Knowledge Planet</a></li></ol><blockquote><p><strong>One walks faster alone, but a group walks further together.</strong></p></blockquote><p><img src="/en/images/WechatIMG581.webp" alt="Scan WeChat QR Code"></p>]]></content>
    
    
    <summary type="html">&lt;p&gt;&lt;a href=&quot;https://blog.danlew.net/2014/03/17/android-tip-of-the-day/&quot;&gt;With my recent project&lt;/a&gt; I’ve been posting one Android class&amp;#x2F;method a day. People have been asking for an archive of these links, so every couple weeks I’m going to round them up here. I’ll also be adding a bit of color commentary, but still the goal is for this not to be a ton of work for me. :)&lt;/p&gt;</summary>


    <category term="Android" scheme="https://androidperformance.com/en/categories/Android/"/>
    
    
    <category term="Android" scheme="https://androidperformance.com/en/tags/Android/"/>
    
    <category term="Startup" scheme="https://androidperformance.com/en/tags/Startup/"/>
    
    <category term="Memory" scheme="https://androidperformance.com/en/tags/Memory/"/>
    
    <category term="Java" scheme="https://androidperformance.com/en/tags/Java/"/>
    
  </entry>
  
  <entry>
    <title>Android Tools - Log2File</title>
    <link href="https://androidperformance.com/en/2014/05/02/android_log_to_file/"/>
    <id>https://androidperformance.com/en/2014/05/02/android_log_to_file/</id>
    <published>2014-05-02T05:25:35.000Z</published>
    <updated>2026-05-10T23:29:51.066Z</updated>
    
    <content type="html"><![CDATA[<p><code>Log2File</code> is a utility class for Android applications to record logs to a file (such as the SD card).</p><p><strong>Usage Scenarios:</strong></p><ol><li>Unable to connect to a computer for debugging (e.g., USB port is occupied by USB OTG).</li><li>Logs are difficult to capture in real-time.</li><li>Bugs appear randomly and are not easily reproducible.</li><li>Other scenarios where persistent logging is needed.</li></ol><h2 id="0-Introduction"><a href="#0-Introduction" class="headerlink" title="0. Introduction"></a>0. Introduction</h2><p>This article was originally published on my CSDN blog: <a href="http://blog.csdn.net/grackergao/article/details/18322749">http://blog.csdn.net/grackergao/article/details/18322749</a>. I have now migrated it here. The source code is available on Github: <a href="https://github.com/Gracker/Android-Utils/blob/master/Log2File.java">https://github.com/Gracker/Android-Utils/blob/master/Log2File.java</a>.</p><span id="more"></span><h2 id="1-Log2File-Source-Code"><a href="#1-Log2File-Source-Code" class="headerlink" title="1. Log2File Source Code"></a>1. Log2File Source Code</h2><pre class="lang:java decode:true " title="Log2File Source Code">import java.io.BufferedWriter;import java.io.File;import java.io.FileWriter;import java.io.IOException;import java.util.Date;import android.content.Context;import android.os.Environment;public class Log2File{    private static boolean  logInit;    private static BufferedWriter writer;    private Log2File()    {    }    /**     * Initialize Log and create log file     * @param ctx Context     * @param fileName Name of the log file     * @return boolean Success or failure     */    public static boolean init(Context ctx, String fileName)    {        if(!logInit)        {            String state = Environment.getExternalStorageState();            if (Environment.MEDIA_MOUNTED.equals(state))            {                File sdDir = Environment.getExternalStorageDirectory();                File logDir = new File(sdDir.getAbsolutePath() + "/log2file/" +                        ctx.getPackageName() + "/");                try {                    if(!logDir.exists())                    {                        logDir.mkdirs();                    }                    File logFile = new File(logDir, fileName);                    logFile.createNewFile();                    writer = new BufferedWriter(new FileWriter(logFile, true));                    logInit = true;                } catch (IOException e) {                    e.printStackTrace();                }            }        }        return logInit;    }    /**     * Write a log message     * @param msg The message to log     */    public static void w(String msg)    {        if(logInit)        {            try {                Date date = new Date();                writer.write("[" + date.toLocaleString() + "] " + msg);                writer.newLine();                writer.flush();                } catch (IOException e) {                    e.printStackTrace();            }        }    }    /**     * Close the log writer     */    public static void close()    {        if(logInit)        {            try {                writer.close();                writer = null;                } catch (IOException e) {                    e.printStackTrace();            }            logInit = false;        }    }}</pre><h2 id="2-Usage"><a href="#2-Usage" class="headerlink" title="2. Usage"></a>2. Usage</h2><p>Using this utility class is quite simple.</p><ol><li>First, call <code>init</code> to initialize:<pre class="lang:java decode:true " title="Initializing Log2File">Log2File.init(context, fileName);</pre></li><li>Call <code>w()</code> to output logs:<pre class="lang:java decode:true " title="Calling w(String msg) to output logs">Log2File.w(String msg);</pre></li><li>After usage, remember to close the Log:<pre class="lang:java decode:true  crayon-selected" title="Closing Log">Log2File.close();</pre></li></ol><h1 id="About-Me-amp-amp-Blog"><a href="#About-Me-amp-amp-Blog" class="headerlink" title="About Me &amp;&amp; Blog"></a>About Me &amp;&amp; Blog</h1><p>Below is my personal intro and related links. I look forward to exchanging ideas with fellow professionals. “When three walk together, one can always be my teacher!”</p><ol><li><a href="https://www.androidperformance.com/en/about/">Blogger Intro</a>: It includes my WeChat and WeChat group links.</li><li><a href="https://www.androidperformance.com/en/2019/12/01/BlogMap/">Blog Content Navigation</a>: A guide for my blog content.</li><li><a href="https://www.androidperformance.com/en/2018/05/07/Android-performance-optimization-skills-and-tools/">Curated Excellent Blog Articles - Android Performance Optimization Must-Knows</a>: Welcome self-recommendations and recommendations (just message me on WeChat).</li><li><a href="https://www.androidperformance.com/en/2023/12/30/the-performance/">Android Performance Optimization Knowledge Planet</a>: Welcome to join, thanks for your support~</li></ol><blockquote><p><strong>One walks faster alone, but a group walks further together.</strong></p></blockquote><p><img src="/en/images/WechatIMG581.webp" alt="Scan WeChat QR Code"></p>]]></content>
    
    
    <summary type="html">&lt;p&gt;&lt;code&gt;Log2File&lt;/code&gt; is a utility class for Android applications to record logs to a file (such as the SD card).&lt;/p&gt;
&lt;p&gt;&lt;strong&gt;Usage Scenarios:&lt;/strong&gt;&lt;/p&gt;
&lt;ol&gt;
&lt;li&gt;Unable to connect to a computer for debugging (e.g., USB port is occupied by USB OTG).&lt;/li&gt;
&lt;li&gt;Logs are difficult to capture in real-time.&lt;/li&gt;
&lt;li&gt;Bugs appear randomly and are not easily reproducible.&lt;/li&gt;
&lt;li&gt;Other scenarios where persistent logging is needed.&lt;/li&gt;
&lt;/ol&gt;
&lt;h2 id=&quot;0-Introduction&quot;&gt;&lt;a href=&quot;#0-Introduction&quot; class=&quot;headerlink&quot; title=&quot;0. Introduction&quot;&gt;&lt;/a&gt;0. Introduction&lt;/h2&gt;&lt;p&gt;This article was originally published on my CSDN blog: &lt;a href=&quot;http://blog.csdn.net/grackergao/article/details/18322749&quot;&gt;http://blog.csdn.net/grackergao/article/details/18322749&lt;/a&gt;. I have now migrated it here. The source code is available on Github: &lt;a href=&quot;https://github.com/Gracker/Android-Utils/blob/master/Log2File.java&quot;&gt;https://github.com/Gracker/Android-Utils/blob/master/Log2File.java&lt;/a&gt;.&lt;/p&gt;</summary>


    <category term="Android" scheme="https://androidperformance.com/en/categories/Android/"/>
    
    
    <category term="Android" scheme="https://androidperformance.com/en/tags/Android/"/>
    
    <category term="Java" scheme="https://androidperformance.com/en/tags/Java/"/>
    
  </entry>
  
  <entry>
    <title>Ubuntu: Adb Command Cannot Find Device</title>
    <link href="https://androidperformance.com/en/2014/03/25/ubuntu-adb-can-not-find-devices/"/>
    <id>https://androidperformance.com/en/2014/03/25/ubuntu-adb-can-not-find-devices/</id>
    <published>2014-03-25T03:15:17.000Z</published>
    <updated>2026-05-10T23:29:51.068Z</updated>
    
    <content type="html"><![CDATA[<h2 id="1-Problem-Overview"><a href="#1-Problem-Overview" class="headerlink" title="1. Problem Overview"></a>1. Problem Overview</h2><p>Recently, while developing for a Nokia project, I encountered the following issue:</p><p>When I plugged in a Nokia X, the computer did not respond at all—it wasn’t recognized. My colleague’s Windows machine also failed to detect it. After searching Google for a long time, I finally found a solution. Since I didn’t record it originally and later forgot how to configure it when helping someone else, I decided to document it here for everyone.</p><h2 id="2-Solution"><a href="#2-Solution" class="headerlink" title="2. Solution"></a>2. Solution</h2><p>If the <code>adb</code> command indicates that no devices are found, please ensure you have already completed these basic steps:</p><ol><li><strong>Enable USB Debugging</strong> (Settings - Developer Options - USB Debugging). If you don’t see Developer Options, go to “About” and tap the Build Number several times.</li><li><strong>Restart Adb with Sudo</strong>: Try <code>sudo adb kill-server</code> and <code>sudo adb start-server</code>.</li></ol><p>If it still doesn’t work, follow the steps below:</p><span id="more"></span><h3 id="2-1-Run-lsusb"><a href="#2-1-Run-lsusb" class="headerlink" title="2.1. Run lsusb"></a>2.1. Run lsusb</h3><p>Check the USB bus to find the device ID:</p><figure class="highlight bash"><table><tr><td class="gutter"><pre><span class="line">1</span><br><span class="line">2</span><br><span class="line">3</span><br><span class="line">4</span><br><span class="line">5</span><br><span class="line">6</span><br><span class="line">7</span><br><span class="line">8</span><br><span class="line">9</span><br><span class="line">10</span><br></pre></td><td class="code"><pre><span class="line">~ » lsusb</span><br><span class="line">Bus 002 Device 002: ID 8087:0024 Intel Corp. Integrated Rate Matching Hub</span><br><span class="line">Bus 002 Device 001: ID 1d6b:0002 Linux Foundation 2.0 root hub</span><br><span class="line">Bus 001 Device 002: ID 8087:0024 Intel Corp. Integrated Rate Matching Hub</span><br><span class="line">Bus 001 Device 001: ID 1d6b:0002 Linux Foundation 2.0 root hub</span><br><span class="line">Bus 004 Device 001: ID 1d6b:0003 Linux Foundation 3.0 root hub</span><br><span class="line">Bus 003 Device 004: ID 1532:0016 Razer USA, Ltd DeathAdder Mouse</span><br><span class="line">Bus 003 Device 003: ID 05d5:624c Super Gate Technology Co., Ltd</span><br><span class="line">Bus 003 Device 033: ID 0421:06e8 Nokia Mobile Phones</span><br><span class="line">Bus 003 Device 001: ID 1d6b:0002 Linux Foundation 2.0 root hub</span><br></pre></td></tr></table></figure><h3 id="2-2-Register-udev-Rules"><a href="#2-2-Register-udev-Rules" class="headerlink" title="2.2. Register udev Rules"></a>2.2. Register udev Rules</h3><p>Edit <code>/etc/udev/rules.d/51-android.rules</code>:</p><figure class="highlight bash"><table><tr><td class="gutter"><pre><span class="line">1</span><br></pre></td><td class="code"><pre><span class="line">vim /etc/udev/rules.d/51-android.rules</span><br></pre></td></tr></table></figure><p>Add the following rule (using the IDs found in <code>lsusb</code>, e.g., Vendor ID <code>0421</code>):</p><figure class="highlight plaintext"><table><tr><td class="gutter"><pre><span class="line">1</span><br></pre></td><td class="code"><pre><span class="line">SUBSYSTEM==&quot;usb&quot;, ATTR&#123;idVendor&#125;==&quot;0421&quot;, ATTR&#123;idProduct&#125;==&quot;06e8&quot;, MODE=&quot;0666&quot;, GROUP=&quot;plugdev&quot;</span><br></pre></td></tr></table></figure><p>Save the file and run:</p><figure class="highlight bash"><table><tr><td class="gutter"><pre><span class="line">1</span><br><span class="line">2</span><br></pre></td><td class="code"><pre><span class="line">sudo <span class="built_in">chmod</span> a+rx /etc/udev/rules.d/51-android.rules</span><br><span class="line">sudo service udev restart</span><br></pre></td></tr></table></figure><p>The output should show <code>udev</code> restarting correctly.</p><h3 id="2-3-Restart-Adb-with-Sudo"><a href="#2-3-Restart-Adb-with-Sudo" class="headerlink" title="2.3. Restart Adb with Sudo"></a>2.3. Restart Adb with Sudo</h3><p>Navigate to your SDK directory and restart the server:</p><figure class="highlight bash"><table><tr><td class="gutter"><pre><span class="line">1</span><br><span class="line">2</span><br><span class="line">3</span><br></pre></td><td class="code"><pre><span class="line"><span class="built_in">cd</span> ~/tools/android-sdk-linux_x86/platform-tools</span><br><span class="line">sudo ./adb kill-server</span><br><span class="line">sudo ./adb start-server</span><br></pre></td></tr></table></figure><p><strong>Note</strong>: Usually, the above steps are sufficient. However, for specific devices like the Nokia X, you might need one more step:</p><h3 id="2-4-Update-adb-usb-ini"><a href="#2-4-Update-adb-usb-ini" class="headerlink" title="2.4. Update adb_usb.ini"></a>2.4. Update adb_usb.ini</h3><p>Open <code>~/.android/adb_usb.ini</code> and add the Vendor ID (in hex):</p><figure class="highlight ini"><table><tr><td class="gutter"><pre><span class="line">1</span><br><span class="line">2</span><br><span class="line">3</span><br><span class="line">4</span><br><span class="line">5</span><br><span class="line">6</span><br></pre></td><td class="code"><pre><span class="line"><span class="comment"># ANDROID 4th PARTY USB VENDOR ID LIST -- DO NOT EDIT.</span></span><br><span class="line"><span class="comment"># USE &#x27;android update adb&#x27; TO GENERATE.</span></span><br><span class="line"><span class="comment"># 1 USB VENDOR ID PER LINE</span></span><br><span class="line"></span><br><span class="line"><span class="comment"># for nokia x</span></span><br><span class="line">0x0421</span><br></pre></td></tr></table></figure><p>After saving, <code>adb devices</code> should now correctly list your device. The process is similar on Windows.</p><h1 id="About-Me-amp-amp-Blog"><a href="#About-Me-amp-amp-Blog" class="headerlink" title="About Me &amp;&amp; Blog"></a>About Me &amp;&amp; Blog</h1><p>Below is my personal intro and related links. I look forward to exchanging ideas with fellow professionals. “When three walk together, one can always be my teacher!”</p><ol><li><a href="https://www.androidperformance.com/en/about/">Blogger Intro</a></li><li><a href="https://www.androidperformance.com/en/2019/12/01/BlogMap/">Blog Content Navigation</a>: A guide for my blog content.</li><li><a href="https://www.androidperformance.com/en/2018/05/07/Android-performance-optimization-skills-and-tools/">Curated Excellent Blog Articles - Android Performance Optimization Must-Knows</a></li><li><a href="https://www.androidperformance.com/en/2023/12/30/the-performance/">Android Performance Optimization Knowledge Planet</a></li></ol><blockquote><p><strong>One walks faster alone, but a group walks further together.</strong></p></blockquote><p><img src="/en/images/WechatIMG581.webp" alt="Scan WeChat QR Code"></p>]]></content>
    
    
    <summary type="html">&lt;h2 id=&quot;1-Problem-Overview&quot;&gt;&lt;a href=&quot;#1-Problem-Overview&quot; class=&quot;headerlink&quot; title=&quot;1. Problem Overview&quot;&gt;&lt;/a&gt;1. Problem Overview&lt;/h2&gt;&lt;p&gt;Recently, while developing for a Nokia project, I encountered the following issue:&lt;/p&gt;
&lt;p&gt;When I plugged in a Nokia X, the computer did not respond at all—it wasn’t recognized. My colleague’s Windows machine also failed to detect it. After searching Google for a long time, I finally found a solution. Since I didn’t record it originally and later forgot how to configure it when helping someone else, I decided to document it here for everyone.&lt;/p&gt;
&lt;h2 id=&quot;2-Solution&quot;&gt;&lt;a href=&quot;#2-Solution&quot; class=&quot;headerlink&quot; title=&quot;2. Solution&quot;&gt;&lt;/a&gt;2. Solution&lt;/h2&gt;&lt;p&gt;If the &lt;code&gt;adb&lt;/code&gt; command indicates that no devices are found, please ensure you have already completed these basic steps:&lt;/p&gt;
&lt;ol&gt;
&lt;li&gt;&lt;strong&gt;Enable USB Debugging&lt;/strong&gt; (Settings - Developer Options - USB Debugging). If you don’t see Developer Options, go to “About” and tap the Build Number several times.&lt;/li&gt;
&lt;li&gt;&lt;strong&gt;Restart Adb with Sudo&lt;/strong&gt;: Try &lt;code&gt;sudo adb kill-server&lt;/code&gt; and &lt;code&gt;sudo adb start-server&lt;/code&gt;.&lt;/li&gt;
&lt;/ol&gt;
&lt;p&gt;If it still doesn’t work, follow the steps below:&lt;/p&gt;</summary>


    <category term="Android" scheme="https://androidperformance.com/en/categories/Android/"/>
    
    
    <category term="Android" scheme="https://androidperformance.com/en/tags/Android/"/>
    
    <category term="Startup" scheme="https://androidperformance.com/en/tags/Startup/"/>
    
    <category term="Linux" scheme="https://androidperformance.com/en/tags/Linux/"/>
    
    <category term="Java" scheme="https://androidperformance.com/en/tags/Java/"/>
    
  </entry>
  
  <entry>
    <title>Android Service: Building Your Own Notification Center (1) - Introduction to Accessibility Service</title>
    <link href="https://androidperformance.com/en/2014/03/17/android-build-your-own-android-notification-service-app/"/>
    <id>https://androidperformance.com/en/2014/03/17/android-build-your-own-android-notification-service-app/</id>
    <published>2014-03-17T06:07:53.000Z</published>
    <updated>2026-05-10T23:29:51.064Z</updated>
    
    <content type="html"><![CDATA[<h1 id="1-Introduction-to-Accessibility-Service"><a href="#1-Introduction-to-Accessibility-Service" class="headerlink" title="1. Introduction to Accessibility Service"></a>1. Introduction to Accessibility Service</h1><p>Accessibility services are a feature of the Android framework designed to provide alternative navigation feedback to users on behalf of applications installed on Android devices. An accessibility service can communicate information about the application to the user, such as text-to-speech, or haptic feedback when the user’s finger hovers over an important area of the screen.</p><p>This section covers how to create an accessibility service, how to handle information received from applications, and how to provide feedback to the user.</p><span id="more"></span><h1 id="2-Creating-Your-Own-Accessibility-Service"><a href="#2-Creating-Your-Own-Accessibility-Service" class="headerlink" title="2. Creating Your Own Accessibility Service"></a>2. Creating Your Own Accessibility Service</h1><h2 id="2-1-Inheriting-from-AccessibilityService"><a href="#2-1-Inheriting-from-AccessibilityService" class="headerlink" title="2.1 Inheriting from AccessibilityService"></a>2.1 Inheriting from AccessibilityService</h2><p>An accessibility service can be bundled with a standard application or created as a standalone Android project. In either case, the steps to create such a service are the same. In your project, create a class that extends <code>AccessibilityService</code>.</p><figure class="highlight java"><table><tr><td class="gutter"><pre><span class="line">1</span><br><span class="line">2</span><br><span class="line">3</span><br><span class="line">4</span><br><span class="line">5</span><br><span class="line">6</span><br><span class="line">7</span><br><span class="line">8</span><br><span class="line">9</span><br><span class="line">10</span><br><span class="line">11</span><br><span class="line">12</span><br></pre></td><td class="code"><pre><span class="line"><span class="keyword">import</span> android.accessibilityservice.AccessibilityService;</span><br><span class="line"><span class="keyword">import</span> android.view.accessibility.AccessibilityEvent;</span><br><span class="line"></span><br><span class="line"><span class="keyword">public</span> <span class="keyword">class</span> <span class="title class_">MyAccessibilityService</span> <span class="keyword">extends</span> <span class="title class_">AccessibilityService</span> &#123;</span><br><span class="line">    <span class="meta">@Override</span></span><br><span class="line">    <span class="keyword">public</span> <span class="keyword">void</span> <span class="title function_">onAccessibilityEvent</span><span class="params">(AccessibilityEvent event)</span> &#123;</span><br><span class="line">    &#125;</span><br><span class="line"></span><br><span class="line">    <span class="meta">@Override</span></span><br><span class="line">    <span class="keyword">public</span> <span class="keyword">void</span> <span class="title function_">onInterrupt</span><span class="params">()</span> &#123;</span><br><span class="line">    &#125;</span><br><span class="line">&#125;</span><br></pre></td></tr></table></figure><h2 id="2-2-Declaring-the-Service-in-Manifest"><a href="#2-2-Declaring-the-Service-in-Manifest" class="headerlink" title="2.2 Declaring the Service in Manifest"></a>2.2 Declaring the Service in Manifest</h2><p>Like any other service, you must declare it in the manifest file. Remember to specify that it handles the <code>android.accessibilityservice.AccessibilityService</code> intent, so that the service is called when an application triggers an <code>AccessibilityEvent</code>.</p><figure class="highlight xml"><table><tr><td class="gutter"><pre><span class="line">1</span><br><span class="line">2</span><br><span class="line">3</span><br><span class="line">4</span><br><span class="line">5</span><br><span class="line">6</span><br><span class="line">7</span><br><span class="line">8</span><br><span class="line">9</span><br><span class="line">10</span><br></pre></td><td class="code"><pre><span class="line"><span class="tag">&lt;<span class="name">application</span>&gt;</span></span><br><span class="line">...</span><br><span class="line"><span class="tag">&lt;<span class="name">service</span> <span class="attr">android:name</span>=<span class="string">&quot;.MyAccessibilityService&quot;</span>&gt;</span></span><br><span class="line">     <span class="tag">&lt;<span class="name">intent-filter</span>&gt;</span></span><br><span class="line">         <span class="tag">&lt;<span class="name">action</span> <span class="attr">android:name</span>=<span class="string">&quot;android.accessibilityservice.AccessibilityService&quot;</span> /&gt;</span></span><br><span class="line">     <span class="tag">&lt;/<span class="name">intent-filter</span>&gt;</span></span><br><span class="line">     . . .</span><br><span class="line"><span class="tag">&lt;/<span class="name">service</span>&gt;</span></span><br><span class="line">...</span><br><span class="line"><span class="tag">&lt;/<span class="name">application</span>&gt;</span></span><br></pre></td></tr></table></figure><h2 id="2-3-Configuring-the-Service"><a href="#2-3-Configuring-the-Service" class="headerlink" title="2.3 Configuring the Service"></a>2.3 Configuring the Service</h2><p>If you are creating a new project for this service and do not intend to have an application component, you can remove the Activity class (usually <code>MainActivity.java</code>) from your source files and the corresponding <code>&lt;activity&gt;</code> element from your manifest file.</p><p><strong>Configuring Your Accessibility Service</strong></p><p>You must provide configuration parameters for your accessibility service to tell the system how and when you want it to run. Which event types do you want to respond to? Is the service active for all applications or only specific package names? What kind of feedback does it use?</p><p>You have two ways to set these variables. The backward-compatible method is to set them in code using <code>setServiceInfo(android.accessibilityservice.AccessibilityServiceInfo)</code>. To do this, override the <code>onServiceConnected()</code> method and configure your service there.</p><figure class="highlight java"><table><tr><td class="gutter"><pre><span class="line">1</span><br><span class="line">2</span><br><span class="line">3</span><br><span class="line">4</span><br><span class="line">5</span><br><span class="line">6</span><br><span class="line">7</span><br><span class="line">8</span><br><span class="line">9</span><br><span class="line">10</span><br><span class="line">11</span><br><span class="line">12</span><br><span class="line">13</span><br><span class="line">14</span><br><span class="line">15</span><br></pre></td><td class="code"><pre><span class="line"><span class="keyword">import</span> android.accessibilityservice.AccessibilityServiceInfo;</span><br><span class="line"><span class="keyword">import</span> android.view.accessibility.AccessibilityEvent;</span><br><span class="line"></span><br><span class="line"><span class="meta">@Override</span></span><br><span class="line"><span class="keyword">protected</span> <span class="keyword">void</span> <span class="title function_">onServiceConnected</span><span class="params">()</span> &#123;</span><br><span class="line">    <span class="type">AccessibilityServiceInfo</span> <span class="variable">info</span> <span class="operator">=</span> <span class="keyword">new</span> <span class="title class_">AccessibilityServiceInfo</span>();</span><br><span class="line">    info.eventTypes = AccessibilityEvent.TYPE_VIEW_CLICKED |</span><br><span class="line">            AccessibilityEvent.TYPE_VIEW_FOCUSED;</span><br><span class="line">    info.packageNames = <span class="keyword">new</span> <span class="title class_">String</span>[]</span><br><span class="line">            &#123;<span class="string">&quot;com.example.android.myFirstApp&quot;</span>, <span class="string">&quot;com.example.android.mySecondApp&quot;</span>&#125;;</span><br><span class="line">    info.feedbackType = AccessibilityServiceInfo.FEEDBACK_SPOKEN;</span><br><span class="line">    info.flags = AccessibilityServiceInfo.DEFAULT;</span><br><span class="line">    info.notificationTimeout = <span class="number">100</span>;</span><br><span class="line">    <span class="built_in">this</span>.setServiceInfo(info);</span><br><span class="line">&#125;</span><br></pre></td></tr></table></figure><p>Since Android 4.0, there is another way: verify the service using an XML file. If you define your service via XML, certain configurable options like <code>canRetrieveWindowContent</code> become available. The same configuration as above, defined in XML, would look like this:</p><figure class="highlight xml"><table><tr><td class="gutter"><pre><span class="line">1</span><br><span class="line">2</span><br><span class="line">3</span><br><span class="line">4</span><br><span class="line">5</span><br><span class="line">6</span><br><span class="line">7</span><br><span class="line">8</span><br></pre></td><td class="code"><pre><span class="line"><span class="tag">&lt;<span class="name">accessibility-service</span> <span class="attr">xmlns:android</span>=<span class="string">&quot;http://schemas.android.com/apk/res/android&quot;</span></span></span><br><span class="line"><span class="tag">     <span class="attr">android:accessibilityEventTypes</span>=<span class="string">&quot;typeViewClicked|typeViewFocused&quot;</span></span></span><br><span class="line"><span class="tag">     <span class="attr">android:packageNames</span>=<span class="string">&quot;com.example.android.myFirstApp, com.example.android.mySecondApp&quot;</span></span></span><br><span class="line"><span class="tag">     <span class="attr">android:accessibilityFeedbackType</span>=<span class="string">&quot;feedbackSpoken&quot;</span></span></span><br><span class="line"><span class="tag">     <span class="attr">android:notificationTimeout</span>=<span class="string">&quot;100&quot;</span></span></span><br><span class="line"><span class="tag">     <span class="attr">android:settingsActivity</span>=<span class="string">&quot;com.example.android.apis.accessibility.TestBackActivity&quot;</span></span></span><br><span class="line"><span class="tag">     <span class="attr">android:canRetrieveWindowContent</span>=<span class="string">&quot;true&quot;</span></span></span><br><span class="line"><span class="tag">/&gt;</span></span><br></pre></td></tr></table></figure><p>If using the XML path, you must specify it in your manifest file by adding a <code>&lt;meta-data&gt;</code> tag to your service declaration pointing to the XML resource file. Assuming you stored your XML file at <code>res/xml/serviceconfig.xml</code>, the new tag would look like this:</p><figure class="highlight xml"><table><tr><td class="gutter"><pre><span class="line">1</span><br><span class="line">2</span><br><span class="line">3</span><br><span class="line">4</span><br><span class="line">5</span><br><span class="line">6</span><br><span class="line">7</span><br></pre></td><td class="code"><pre><span class="line"><span class="tag">&lt;<span class="name">service</span> <span class="attr">android:name</span>=<span class="string">&quot;.MyAccessibilityService&quot;</span>&gt;</span></span><br><span class="line">     <span class="tag">&lt;<span class="name">intent-filter</span>&gt;</span></span><br><span class="line">         <span class="tag">&lt;<span class="name">action</span> <span class="attr">android:name</span>=<span class="string">&quot;android.accessibilityservice.AccessibilityService&quot;</span> /&gt;</span></span><br><span class="line">     <span class="tag">&lt;/<span class="name">intent-filter</span>&gt;</span></span><br><span class="line">     <span class="tag">&lt;<span class="name">meta-data</span> <span class="attr">android:name</span>=<span class="string">&quot;android.accessibilityservice&quot;</span></span></span><br><span class="line"><span class="tag">     <span class="attr">android:resource</span>=<span class="string">&quot;@xml/serviceconfig&quot;</span> /&gt;</span></span><br><span class="line"><span class="tag">&lt;/<span class="name">service</span>&gt;</span></span><br></pre></td></tr></table></figure><h2 id="2-4-Responding-to-AccessibilityEvents"><a href="#2-4-Responding-to-AccessibilityEvents" class="headerlink" title="2.4 Responding to AccessibilityEvents"></a>2.4 Responding to AccessibilityEvents</h2><p>Now that your service is set up to run and listen for events, write some code so it knows what to do when an <code>AccessibilityEvent</code> actually arrives!</p><p>Start by overriding the <code>onAccessibilityEvent(AccessibilityEvent)</code> method. use <code>getEventType()</code> to determine the event type, and <code>getContentDescription()</code> to extract any label text associated with the event.</p><figure class="highlight java"><table><tr><td class="gutter"><pre><span class="line">1</span><br><span class="line">2</span><br><span class="line">3</span><br><span class="line">4</span><br><span class="line">5</span><br><span class="line">6</span><br><span class="line">7</span><br><span class="line">8</span><br><span class="line">9</span><br><span class="line">10</span><br><span class="line">11</span><br><span class="line">12</span><br><span class="line">13</span><br><span class="line">14</span><br><span class="line">15</span><br><span class="line">16</span><br><span class="line">17</span><br><span class="line">18</span><br><span class="line">19</span><br><span class="line">20</span><br><span class="line">21</span><br><span class="line">22</span><br><span class="line">23</span><br><span class="line">24</span><br><span class="line">25</span><br></pre></td><td class="code"><pre><span class="line"><span class="keyword">import</span> android.view.accessibility.AccessibilityNodeInfo;</span><br><span class="line"></span><br><span class="line"><span class="meta">@Override</span></span><br><span class="line"><span class="keyword">public</span> <span class="keyword">void</span> <span class="title function_">onAccessibilityEvent</span><span class="params">(AccessibilityEvent event)</span> &#123;</span><br><span class="line">    <span class="keyword">final</span> <span class="type">int</span> <span class="variable">eventType</span> <span class="operator">=</span> event.getEventType();</span><br><span class="line">    <span class="type">String</span> <span class="variable">eventText</span> <span class="operator">=</span> <span class="literal">null</span>;</span><br><span class="line">    <span class="keyword">switch</span>(eventType) &#123;</span><br><span class="line">        <span class="keyword">case</span> AccessibilityEvent.TYPE_VIEW_CLICKED:</span><br><span class="line">            eventText = <span class="string">&quot;Clicked: &quot;</span>;</span><br><span class="line">            <span class="keyword">break</span>;</span><br><span class="line">        <span class="keyword">case</span> AccessibilityEvent.TYPE_VIEW_FOCUSED:</span><br><span class="line">            eventText = <span class="string">&quot;Focused: &quot;</span>;</span><br><span class="line">            <span class="keyword">break</span>;</span><br><span class="line">        <span class="keyword">default</span>:</span><br><span class="line">            eventText = <span class="string">&quot;Unknown Event: &quot;</span>;</span><br><span class="line">            <span class="keyword">break</span>;</span><br><span class="line">    &#125;</span><br><span class="line"></span><br><span class="line">    eventText = eventText + event.getContentDescription();</span><br><span class="line"></span><br><span class="line">    <span class="comment">// Do something nifty with this text, like speak the composed string</span></span><br><span class="line">    <span class="comment">// back to the user.</span></span><br><span class="line">    <span class="comment">// speakToUser(eventText); // Assuming speakToUser is defined elsewhere</span></span><br><span class="line">    <span class="comment">// ...</span></span><br><span class="line">&#125;</span><br></pre></td></tr></table></figure><p><strong>Querying the View Hierarchy for More Context</strong></p><p>This step is optional but very useful. A feature introduced in Android 4.0 (API level 14) allows an <code>AccessibilityService</code> to query the view hierarchy to collect information about the UI component that generated the event, as well as its parent and children. To do this, make sure you have set the following in your XML configuration:</p><figure class="highlight xml"><table><tr><td class="gutter"><pre><span class="line">1</span><br></pre></td><td class="code"><pre><span class="line">android:canRetrieveWindowContent=&quot;true&quot;</span><br></pre></td></tr></table></figure><p>If set, you can obtain an <code>AccessibilityNodeInfo</code> object via <code>getSource()</code>. If the window where the event originated is still the active window, this call returns an object; otherwise, it returns null. The following code demonstrates how to receive an event and perform the following steps:</p><ol><li>Immediately capture the parent of the view that triggered the event.</li><li>In that view, look for a child view that is a label and a checkbox.</li><li>If found, create a string to report to the user indicating whether the item is checked.</li><li>If traversal of the view hierarchy returns null at any point, exit the method.</li></ol><figure class="highlight java"><table><tr><td class="gutter"><pre><span class="line">1</span><br><span class="line">2</span><br><span class="line">3</span><br><span class="line">4</span><br><span class="line">5</span><br><span class="line">6</span><br><span class="line">7</span><br><span class="line">8</span><br><span class="line">9</span><br><span class="line">10</span><br><span class="line">11</span><br><span class="line">12</span><br><span class="line">13</span><br><span class="line">14</span><br><span class="line">15</span><br><span class="line">16</span><br><span class="line">17</span><br><span class="line">18</span><br><span class="line">19</span><br><span class="line">20</span><br><span class="line">21</span><br><span class="line">22</span><br><span class="line">23</span><br><span class="line">24</span><br><span class="line">25</span><br><span class="line">26</span><br><span class="line">27</span><br><span class="line">28</span><br><span class="line">29</span><br><span class="line">30</span><br><span class="line">31</span><br><span class="line">32</span><br><span class="line">33</span><br><span class="line">34</span><br><span class="line">35</span><br><span class="line">36</span><br><span class="line">37</span><br><span class="line">38</span><br><span class="line">39</span><br><span class="line">40</span><br><span class="line">41</span><br><span class="line">42</span><br><span class="line">43</span><br><span class="line">44</span><br><span class="line">45</span><br><span class="line">46</span><br><span class="line">47</span><br><span class="line">48</span><br><span class="line">49</span><br><span class="line">50</span><br><span class="line">51</span><br><span class="line">52</span><br><span class="line">53</span><br></pre></td><td class="code"><pre><span class="line"><span class="comment">// Alternative onAccessibilityEvent, that uses AccessibilityNodeInfo</span></span><br><span class="line"></span><br><span class="line"><span class="meta">@Override</span></span><br><span class="line"><span class="keyword">public</span> <span class="keyword">void</span> <span class="title function_">onAccessibilityEvent</span><span class="params">(AccessibilityEvent event)</span> &#123;</span><br><span class="line"></span><br><span class="line">    <span class="type">AccessibilityNodeInfo</span> <span class="variable">source</span> <span class="operator">=</span> event.getSource();</span><br><span class="line">    <span class="keyword">if</span> (source == <span class="literal">null</span>) &#123;</span><br><span class="line">        <span class="keyword">return</span>;</span><br><span class="line">    &#125;</span><br><span class="line"></span><br><span class="line">    <span class="comment">// Grab the parent of the view that fired the event.</span></span><br><span class="line">    <span class="comment">// Assuming getListItemNodeInfo is a helper method to find the list item parent</span></span><br><span class="line">    <span class="type">AccessibilityNodeInfo</span> <span class="variable">rowNode</span> <span class="operator">=</span> getListItemNodeInfo(source);</span><br><span class="line">    <span class="keyword">if</span> (rowNode == <span class="literal">null</span>) &#123;</span><br><span class="line">        <span class="keyword">return</span>;</span><br><span class="line">    &#125;</span><br><span class="line"></span><br><span class="line">    <span class="comment">// Using this parent, get references to both child nodes, the label and the checkbox.</span></span><br><span class="line">    <span class="type">AccessibilityNodeInfo</span> <span class="variable">labelNode</span> <span class="operator">=</span> rowNode.getChild(<span class="number">0</span>);</span><br><span class="line">    <span class="keyword">if</span> (labelNode == <span class="literal">null</span>) &#123;</span><br><span class="line">        rowNode.recycle();</span><br><span class="line">        <span class="keyword">return</span>;</span><br><span class="line">    &#125;</span><br><span class="line"></span><br><span class="line">    <span class="type">AccessibilityNodeInfo</span> <span class="variable">completeNode</span> <span class="operator">=</span> rowNode.getChild(<span class="number">1</span>);</span><br><span class="line">    <span class="keyword">if</span> (completeNode == <span class="literal">null</span>) &#123;</span><br><span class="line">        rowNode.recycle();</span><br><span class="line">        <span class="keyword">return</span>;</span><br><span class="line">    &#125;</span><br><span class="line"></span><br><span class="line">    <span class="comment">// Determine what the task is and whether or not it&#x27;s complete, based on</span></span><br><span class="line">    <span class="comment">// the text inside the label, and the state of the check-box.</span></span><br><span class="line">    <span class="keyword">if</span> (rowNode.getChildCount() &lt; <span class="number">2</span> || !rowNode.getChild(<span class="number">1</span>).isCheckable()) &#123;</span><br><span class="line">        rowNode.recycle();</span><br><span class="line">        <span class="keyword">return</span>;</span><br><span class="line">    &#125;</span><br><span class="line"></span><br><span class="line">    <span class="type">CharSequence</span> <span class="variable">taskLabel</span> <span class="operator">=</span> labelNode.getText();</span><br><span class="line">    <span class="keyword">final</span> <span class="type">boolean</span> <span class="variable">isComplete</span> <span class="operator">=</span> completeNode.isChecked();</span><br><span class="line">    <span class="type">String</span> <span class="variable">completeStr</span> <span class="operator">=</span> <span class="literal">null</span>;</span><br><span class="line"></span><br><span class="line">    <span class="comment">// Assuming getString(R.string.checked) and getString(R.string.not_checked) are defined</span></span><br><span class="line">    <span class="keyword">if</span> (isComplete) &#123;</span><br><span class="line">        <span class="comment">// completeStr = getString(R.string.checked);</span></span><br><span class="line">        completeStr = <span class="string">&quot; (checked)&quot;</span>;</span><br><span class="line">    &#125; <span class="keyword">else</span> &#123;</span><br><span class="line">        <span class="comment">// completeStr = getString(R.string.not_checked);</span></span><br><span class="line">        completeStr = <span class="string">&quot; (not checked)&quot;</span>;</span><br><span class="line">    &#125;</span><br><span class="line">    <span class="type">String</span> <span class="variable">reportStr</span> <span class="operator">=</span> taskLabel + completeStr;</span><br><span class="line">    <span class="comment">// speakToUser(reportStr); // Assuming speakToUser is defined elsewhere</span></span><br><span class="line">    rowNode.recycle(); <span class="comment">// Recycle the node info to avoid memory leaks</span></span><br><span class="line">&#125;</span><br></pre></td></tr></table></figure><p>Now you have a complete, working accessibility service. You can also try configuring how it interacts with the user using Android’s text-to-speech engine or using the Vibrator for haptic feedback.</p><p>Finally, to use the configured service, you must go to “Settings -&gt; Accessibility” and enable the corresponding service for it to respond to events.</p><h1 id="About-Me-amp-amp-Blog"><a href="#About-Me-amp-amp-Blog" class="headerlink" title="About Me &amp;&amp; Blog"></a>About Me &amp;&amp; Blog</h1><p>Below is my personal intro and related links. I look forward to exchanging ideas with fellow professionals. “When three walk together, one can always be my teacher!”</p><ol><li><a href="https://www.androidperformance.com/en/about/">Blogger Intro</a></li><li><a href="https://www.androidperformance.com/en/2019/12/01/BlogMap/">Blog Content Navigation</a>: A guide for my blog content.</li><li><a href="https://www.androidperformance.com/en/2018/05/07/Android-performance-optimization-skills-and-tools/">Curated Excellent Blog Articles - Android Performance Optimization Must-Knows</a></li><li><a href="https://www.androidperformance.com/en/2023/12/30/the-performance/">Android Performance Optimization Knowledge Planet</a></li></ol><blockquote><p><strong>One walks faster alone, but a group walks further together.</strong></p></blockquote><p><img src="/en/images/WechatIMG581.webp" alt="Scan WeChat QR Code"></p>]]></content>
    
    
    <summary type="html">&lt;h1 id=&quot;1-Introduction-to-Accessibility-Service&quot;&gt;&lt;a href=&quot;#1-Introduction-to-Accessibility-Service&quot; class=&quot;headerlink&quot; title=&quot;1. Introduction to Accessibility Service&quot;&gt;&lt;/a&gt;1. Introduction to Accessibility Service&lt;/h1&gt;&lt;p&gt;Accessibility services are a feature of the Android framework designed to provide alternative navigation feedback to users on behalf of applications installed on Android devices. An accessibility service can communicate information about the application to the user, such as text-to-speech, or haptic feedback when the user’s finger hovers over an important area of the screen.&lt;/p&gt;
&lt;p&gt;This section covers how to create an accessibility service, how to handle information received from applications, and how to provide feedback to the user.&lt;/p&gt;</summary>


    <category term="Android" scheme="https://androidperformance.com/en/categories/Android/"/>
    
    
    <category term="Android" scheme="https://androidperformance.com/en/tags/Android/"/>
    
    <category term="Startup" scheme="https://androidperformance.com/en/tags/Startup/"/>
    
    <category term="Java" scheme="https://androidperformance.com/en/tags/Java/"/>
    
    <category term="Compose" scheme="https://androidperformance.com/en/tags/Compose/"/>
    
  </entry>
  
</feed>