
上一篇文章我们使用第三种方法来实现延迟加载。不过上一篇写的比较简单,只是讲解了如何去实现,这一篇就来讲一下为何要这么做,以及这么做后面的原理。
其中会涉及到一些 Android 中的比较重要的类,以及 Activity 生命周期中比较重要的几个函数。
其实这个其中的原理比较简单,不过要弄清楚其实现的过程,还是一件蛮好玩的事情,其中会用到一些工具,自己加调试代码等,一步一步下来,自己对 Activity 的启动的理解又深了一层,希望大家读完之后也会对大家有一定的帮助。
在 Android 开发中,应用启动速度是一个非常重要的点,应用启动优化也是一个非常重要的过程.对于应用启动优化,其实核心思想就是在启动过程中少做事情,具体实践的时候无非就是下面几种:
- 异步加载
- 延时加载
- 懒加载
不用一一去解释,做过启动优化的估计都使用过,本篇文章将详细讲解一下一种延时加载的实现以及其原理.
其实这种加载的实现是非常简单的,但是其中的原理可能比较复杂,还涉及到Looper/Handler/MessageQueue/VSYNC等.以及其中碰到的一些问题,还会有一些我自己额外的思考.
前言
本篇文章是自己的一个学习笔记,记录了 Android 5.0 中 hwui 中的 RenderThread 的简单工作流程。由于是学习笔记,所以其中一些细节不会太详细,我只是将大概的流程走一遍,将其工作流标注出来,下次遇到问题的时候就可以知道去哪里查。
下图是我用 Systrace 抓取的一个应用启动的时候 RenderThread 的第一次 Draw 的 Trace 图,从这里面的顺序来看 RenderThread 的流程。熟悉应用启动流程的话应该知道,只有当第一次 DrawFrame 完成之后,整个应用的界面才会显示在手机上,在这之前,用户看到的是应用的 StartingWindow 的界面。
链表和数组可以按照人们意愿排列元素的次序,但是,如果想要查看某个指定的元素,却又忘记了它的位置,就需要访问所有的元素,直到找到为止。如果集合中元素很多,将会消耗很多时间。有一种数据结构可以快速查找所需要查找的对象,这个就是哈希表(hash table).
HashMap是基于哈希表的 Map 接口的实现。此实现提供所有可选的映射操作,并允许使用 null 值和 null 键。(除了非同步和允许使用 null 之外,HashMap 类与 Hashtable 大致相同。)此类不保证映射的顺序,特别是它不保证该顺序恒久不变。
本文按源码顺序拆 HashMap:先看数据结构是数组+链表的组合,再看构造函数里 initialCapacity 与 loadFactor 的默认值含义;接着是 put 操作的扩容流程、key 为 null 时的特殊存放位置,以及 hash 冲突的解决方式;get 操作的查找路径与 put 一致,区别在判定逻辑;最后是 fail-fast 机制怎么用 modCount 在迭代器里检测并发修改。Java 8 的红黑树改造不在本文范围。
Android 内存优化系列文章:
- Android代码内存优化建议-Android官方篇
- Android代码内存优化建议-Java官方篇
- Android代码内存优化建议-Android资源篇
- Android代码内存优化建议-OnTrimMemory优化
OnTrimMemory 回调是 Android 4.0 之后提供的一个API,这个 API 是提供给开发者的,它的主要作用是提示开发者在系统内存不足的时候,通过处理部分资源来释放内存,从而避免被 Android 系统杀死。这样应用在下一次启动的时候,速度就会比较快。
本文通过问答的方式,从各个方面来讲解 OnTrimMemory 回调的使用过程和效果。想要开发高性能且用户体验良好的 Android 应用,那么这篇文章你不应该错过。
Android 内存优化系列文章:
- Android代码内存优化建议-Android官方篇
- Android代码内存优化建议-Java官方篇
- Android代码内存优化建议-Android资源篇
- Android代码内存优化建议-OnTrimMemory优化
这篇文章主要介绍在实际Android应用程序的开发中,容易导致内存泄露的一些情况。开发人员如果在进行代码编写之前就有内存泄露方面的基础知识,那么写出来的代码会强壮许多,写这篇文章也是这个初衷。本文从Android开发中的资源使用情况入手,介绍了如何在Bitmap、数据库查询、9-patch、过渡绘制等方面优化内存的使用。
Android 内存优化系列文章:
- Android代码内存优化建议-Android官方篇
- Android代码内存优化建议-Java官方篇
- Android代码内存优化建议-Android资源篇
- Android代码内存优化建议-OnTrimMemory优化
为了使垃圾回收器可以正常释放程序所占用的内存,在编写代码的时候就一定要注意尽量避免出现内存泄漏的情况(通常都是由于全局成员变量持有对象引用所导致的),并且在适当的时候去释放对象引用。对于大多数的应用程序而言,后面其它的事情就可以都交给垃圾回收器去完成了,如果一个对象的引用不再被其它对象所持有,那么系统就会将这个对象所分配的内存进行回收。
我们在开发软件的时候应当自始至终都把内存的问题充分考虑进去,这样的话才能开发出更加高性能的软件。而内存问题也并不是无规律可行的,Android系统给我们提出了很多内存优化的建议技巧,只要按照这些技巧来编写程序,就可以让我们的程序在内存性能发面表现得相当不错。
Android 内存优化系列文章:
- Android代码内存优化建议-Android官方篇
- Android代码内存优化建议-Java官方篇
- Android代码内存优化建议-Android资源篇
- Android代码内存优化建议-OnTrimMemory优化
这篇文章主要是介绍了一些小细节的优化技巧,当这些小技巧综合使用起来的时候,对于整个App的性能提升还是有作用的,只是不能较大幅度的提升性能而已。选择合适的算法与数据结构才应该是你首要考虑的因素,在这篇文章中不会涉及这方面。你应该使用这篇文章中的小技巧作为平时写代码的习惯,这样能够提升代码的效率。
本文的原文为Google官方Training的性能优化部分,这一章节主要讲解的是高性能Android代码优化建议,建议所有Android应用开发者都仔细阅读这份文档,并将所提到的编码思想运用到实际的Android开发中。
昨天的Google IO之后,Google放出了Android M Preview for Nexus6. 固件大家可以去Google的官网去下,下好了刷完之后,就可以体验一下最新的Android M了。下面是设置 里面的主界面和彩蛋界面:
单例模式也叫单子模式,是一种常用的软件设计模式。在应用这个模式时,单例对象的类必须保证只有一个实例存在。本文就从单例模式的两种构建方式来带大家了解一下单例,最后介绍一种高级且简洁的单例模式。
单例听上去简单,但在 Java 里有不少容易踩坑的地方:双重检查锁要不要 volatile、静态内部类持有的初始化时机、用枚举实现单例为什么天然防反射和防序列化。本文会按”懒汉/饿汉的常规写法 → 双重检查锁 → 静态内部类 → 枚举”的顺序,把每种实现的适用场景和坑点串起来讲一遍。
系列文章目录:
- Android性能优化典范综述
- Android性能优化典范之Render Performance
- Android性能优化典范之Understanding Overdraw
- Android性能优化典范之Understanding VSYNC
- Android性能优化典范之Profile GPU Rendering
“If you can measure it, you can optimize it” is a common term in the computing world, and for Android’s rendering system, the same thing holds true. In order to optimize your pipeline to be more efficient for rendering, you need a tool to give you feedback on where the current perf problems lie.
And in this video, +Colt McAnlis walks you through an on-device tool that’s built for this exact reason. “Profile GPU Rendering” will help you understand the stages of the rendering pipeline, and also get a chance to see what portions of it might be taking too long, and what you can do about it for your application.
GPU Profile工具
渲染性能问题往往是偷取你宝贵帧数的罪魁祸首,这种问题很容易产生,很容易出现,而且在一个非常方便的工具的帮助下,也非常容易去追踪. 使用Peofile GPU Rendering tool,你可以在手机上就可以看到究竟是什么导致你的应用程序出现卡顿,变慢的情况.
系列文章目录:
- Android性能优化典范综述
- Android性能优化典范之Render Performance
- Android性能优化典范之Understanding Overdraw
- Android性能优化典范之Understanding VSYNC
- Android性能优化典范之Profile GPU Rendering
Unbeknown to most developers, there’s a simple hardware design that defines everything about how fast your application can draw things to the screen.
You may have heard the term VSYNC - VSYNC stands for vertical synchronization and it’s an event that happens every time your screen starts to refresh the content it wants to show you.
Effectively, VSYNC is the product of two components Refresh Rate (how fast the hardware can refresh the screen), and Frames Per Second (how fast the GPU can draw images), and in this video +Colt McAnlis walks through each of these topics, and discusses where VSYNC (and the 16ms rendering barrier) comes from, and why it’s critical to understand if you want a silky smooth application.
基本概念
想要开发一个高性能的应用程序,首先你得了解他的硬件工作原理,那么最好的办法就是去使用它,应用程序运行速度的快慢,很容易被人误解为硬件进程的控制问题,然而这最主要的根源在于渲染性能.如果你想要提高你应用程序的渲染性能,你就必须知道什么是VSYNC.
系列文章目录:
- Android性能优化典范综述
- Android性能优化典范之Render Performance
- Android性能优化典范之Understanding Overdraw
- Android性能优化典范之Understanding VSYNC
- Android性能优化典范之Profile GPU Rendering
One of the most problematic performance problems on Android is the easiest to create; thankfully, it’s also easy to fix.
OVERDRAW is a term used to describe how many times a pixel has been re-drawn in a single frame of rendering. It’s a troublesome issue, because in most cases, pixels that are overdrawn do not end up contributing to the final rendered image. As such, it amounts to wasted work for your GPU and CPU.
Fixing overdraw has everything to do with using the available on-device tools, like Show GPU Overdraw, and then adjusting your view hierarchy in order to reduce areas where it may be occurring.
OverDraw概念
视频开头作者举了一个例子,说如果你是一个粉刷匠,你应该会知道,给墙壁粉刷是一件工作量非常大的工作,而且如果你需要重新粉刷一遍的话(比如对颜色不满意),那么第一次的粉刷就白干了. 同样的道理,如果你的应用程序中出现了过度绘制问题,那么你之前所做的事情也就白费了.如果你想兼顾高性能和完美的设计,那么你的程序可能会出现一个性能问题:OverDraw!
OverDraw是一个术语, 它表示某些组件在屏幕上的一个像素点的绘制超过1次.如下面的图所示,我们有一堆重叠的卡片,被用户激活的卡片在最上面,而那些没有激活的卡片在下面,这意味着我们画大力气绘制的那些卡片,基本都是不可见的.问题就在于次,我们像素渲染的并不全是用户最后能看打的部分, 这是在浪费GPU的时间!
系列文章目录:
- Android性能优化典范综述
- Android性能优化典范之Render Performance
- Android性能优化典范之Understanding Overdraw
- Android性能优化典范之Understanding VSYNC
- Android性能优化典范之Profile GPU Rendering
Rendering performance is all about how fast you can draw your activity, and get it updated on the screen. Success here means your users feeling like your application is smooth and responsive, which means that you’ve got to get all your logic completed, and all your rendering done in 16ms or less, each and every frame. But that might be a bit more difficult than you think.
In this video, +Colt McAnlis takes a look at what “rendering performance” means to developers, alongside some of the most common pitfalls that are ran into; and let’s not forget the important stuff: the tools that help you track down, and fix these issues before they become large problems.
Android渲染知识
当你觉得自己开发了一个改变世界的应用的时候,你的用户可能并不会这么认为,他们认为你的应用又慢又卡,达不到他们所期望的那种顺滑,更谈不上改变这该死的世界了,回收站走你!等等!明明我这个应用在我的Nexus5上非常顺滑啊?你咋能说又慢又卡呢?如果你对Android的碎片化有一定了解的话,你就应该知道,很多低配置的手机并不像Nexus5那样有强大的处理器和GPU,以及没有被怎么污染的原生系统。
如果有大量的用户投诉说你的应用又卡又慢的时候,不要总是抱怨用户的低端手机,有时候问题就出在你的应用本身,也就意味着你的Android存在比较严重的渲染性能问题。只有真正了解问题发生的根源,才能有效的解决问题。所以了解Android渲染相关的知识,是一个Android开发者必不可少的知识。
系列文章目录:
- Android性能优化典范综述
- Android性能优化典范之Render Performance
- Android性能优化典范之Understanding Overdraw
- Android性能优化典范之Understanding VSYNC
- Android性能优化典范之Profile GPU Rendering
2015年1月6日,Google官方发布了一系列关于Android性能优化的小视频,将其命名为Android Performance Patterns,这一些列视频放在YouTube上,观看的话需要科学地上网。
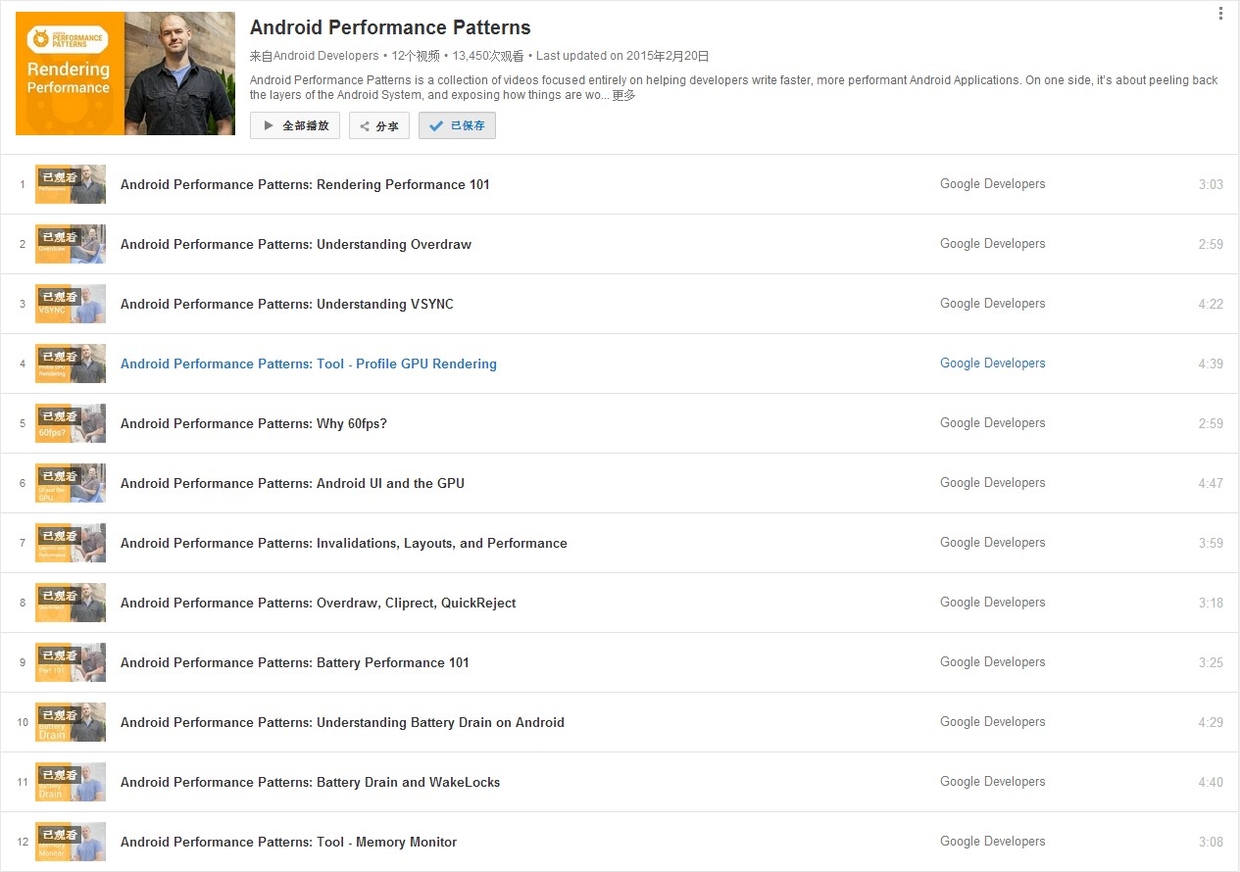
现在回看这组视频,需要把“渲染机制”和“工具入口”分开理解。16ms 帧预算、过度绘制、VSYNC、主线程/渲染线程协作这些机制仍然是图形性能的基础;但当年配套使用的 Hierarchy Viewer、TraceView、Android Device Monitor、Google+ 社群已经不是今天的主线。现在应该用 Layout Inspector/Compose Layout Inspector 看 View 或 Compose 层级,用 Profile GPU Rendering 和 Debug GPU Overdraw 做快速可视化,用 Perfetto Frame Timeline/System Trace 看真实帧生命周期、SurfaceFlinger、CPU 调度和 Binder 关系,用 Macrobenchmark FrameTimingMetric 把滑动/页面切换场景固化成可回归测试。
官方简介:
Android Performance Patterns is a collection of videos focused entirely on helping developers write faster, more performant Android Applications. On one side, it’s about peeling back the layers of the Android System, and exposing how things are working under the hood. On the other side, it’s about teaching you how the tools work, and what to look for in order to extract the right perf out of your app.
But at the end of the day, Android Performance Patterns is all giving you the right resources, at the right time to help make the fastest, smoothest, most awesome experience for your users. And that’s the whole point, right?
总之就是一系列讲解Android性能相关的视频。这些小视频的时间非常短,在3-5分钟之内,主讲人的英文语速也非常快,初期这些视频没有翻译的时候,着实考验了一把听力。好消息是现在这些视频已经都有中英文字幕了。
这些视频的时间虽然很短,但是信息量却非常大,有些他一句话带过的内容,我们却需要花费很多的时间去研究他的原理,或者研究一个调试工具如何使用。也就是说,这一系列视频并没有真正教你如何去优化你的应用,而是告诉你关于Android性能优化你需要知道的知识,这样你去优化你的Android应用的时候,知道该用什么工具,该采取什么样的步骤,需要达到什么样的目标。