

Introduction
The previous article covered the theory of overdraw and tools to detect it. While iOS users rely on Apple’s curation, Android users rely on developers’ discipline. Unfortunately, many market-leading Android apps still suffer from significant overdraw issues. As a developer, I want to see Android bridge and eventually surpass the experience gap with iOS.
This post walks through a practical overdraw optimization process. Since every app is different, these steps are a reference to help you start your own optimization journey.
If you missed the theory part, check it here: Android Performance Optimization: Overdraw (Part 1)
Identifying Overdraw Regions
1. Enable Overdraw Visualization
Settings -> Accessibility -> Developer Options -> Debug GPU Overdraw -> Show Overdraw Areas.
2. Baseline Comparison
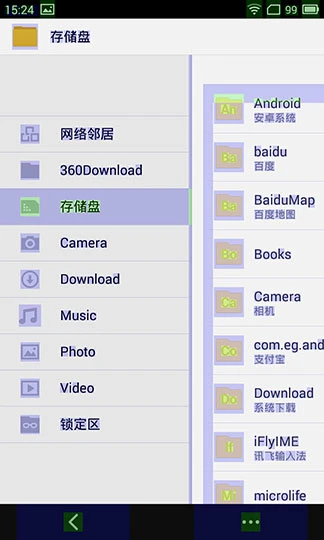
Kill the app to be tested and reopen it. Let’s compare a File Manager app and the Settings app:
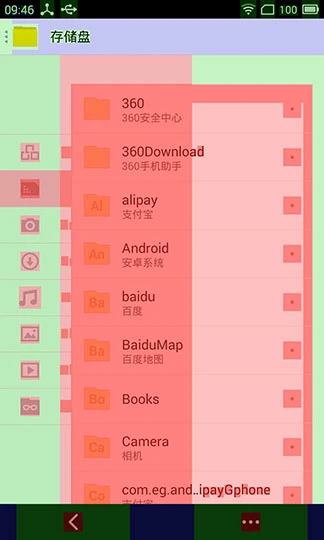
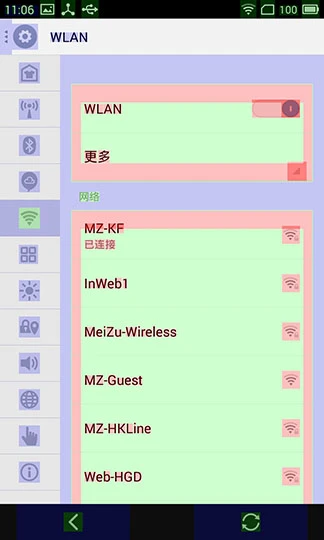
Following the color code (Blue -> Green -> Pink -> Red), the File Manager has severe overdraw, while the Settings app is within an acceptable range. We’ll focus on optimizing the File Manager.
3. Quick Analysis of the File Manager:
- The Global Background: Looking at the ActionBar and SmartBar, the entire app seems to have an opaque background. This forces the system to draw an invisible base layer before rendering the UI components on top. This is likely an attribute of the app’s theme and shows up as Blue (1x overdraw).
- Content Region: The base of the content area is Green (2x overdraw). If we remove the global background mentioned above, this area would still have an unnecessary layer compared to the Settings app.
Step-by-Step Optimization
1. Remove the Default Window Background
The global background analysis suggests an extra layer at the standard window level. This is often part of the ActionBarOverlayLayout. You can easily remove this by adding one line in your Activity’s onCreate:
this.getWindow().setBackgroundDrawableResource(android.R.color.transparent);
Result: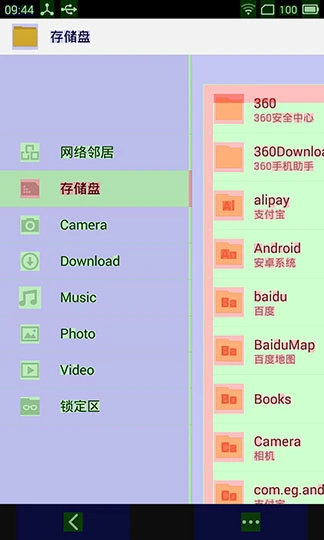
The Blue tint on the ActionBar is gone, and the content area has shifted from Green back toward Blue.
2. Eliminate Redundant Child View Backgrounds
The content area was still showing significant overdraw. Using Hierarchy Viewer, we identified a DragRelativeLayout (inherited from SlidingMenu) which consists of a CustomViewAbove and a CustomViewBehind.
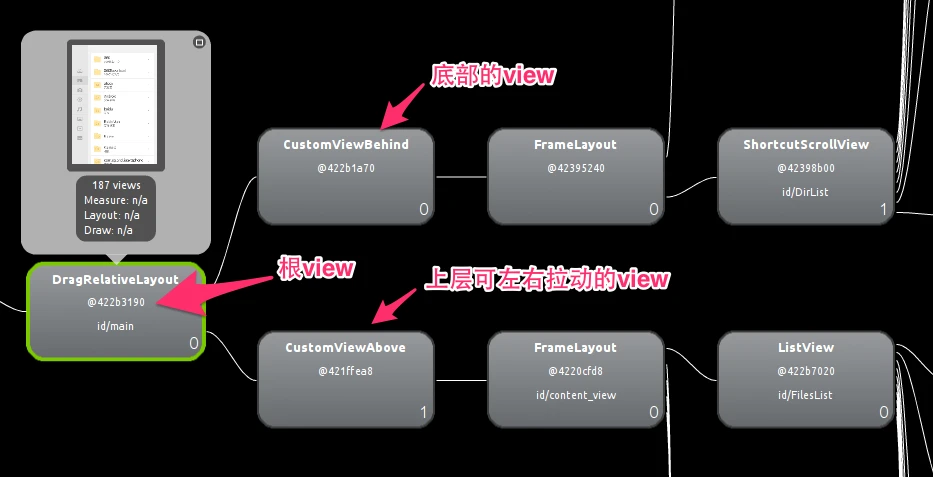
Inspection revealed that CustomViewBehind was explicitly setting a background color in its constructor:setBackgroundColor(getResources().getColor(R.color.mz_slidingmenu_background_light));
Since this view is completely covered by CustomViewAbove after initialization, its background is entirely redundant.
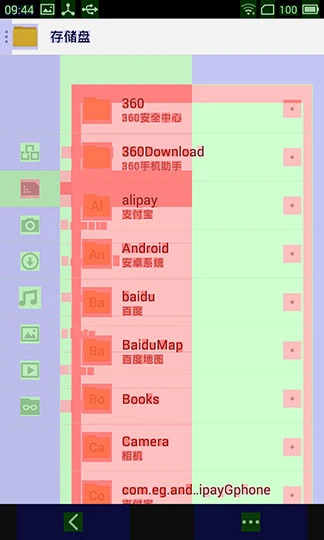
Result: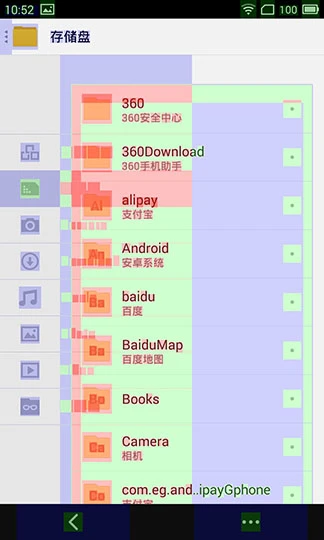
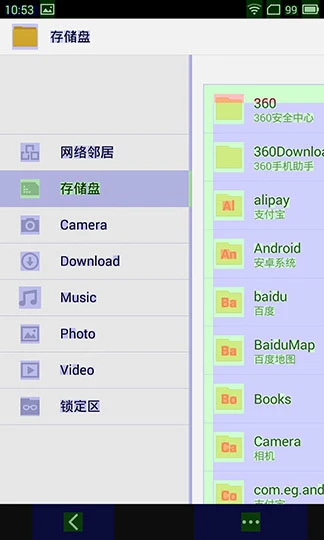
Overdraw is significantly reduced across the primary navigation panes.
3. Detailed Component Optimization
Continuing the analysis, CustomViewAbove still had some bottlenecks. Deep in the hierarchy, a ListView (FilesList) was causing overdraw. By refining the onDraw() logic in PartitionItemLayout (specifically adjusting setBounds), we achieved near-perfect results.
Final Result: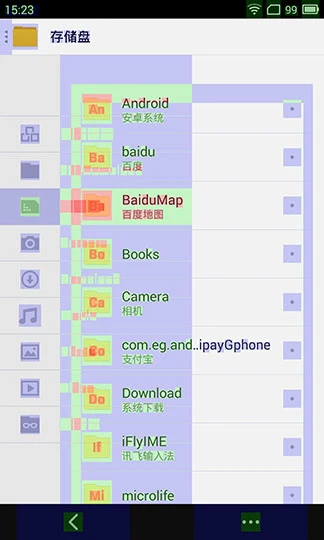
The interface is now mostly Blue—a sign of a highly optimized rendering path!
Improving Code Quality
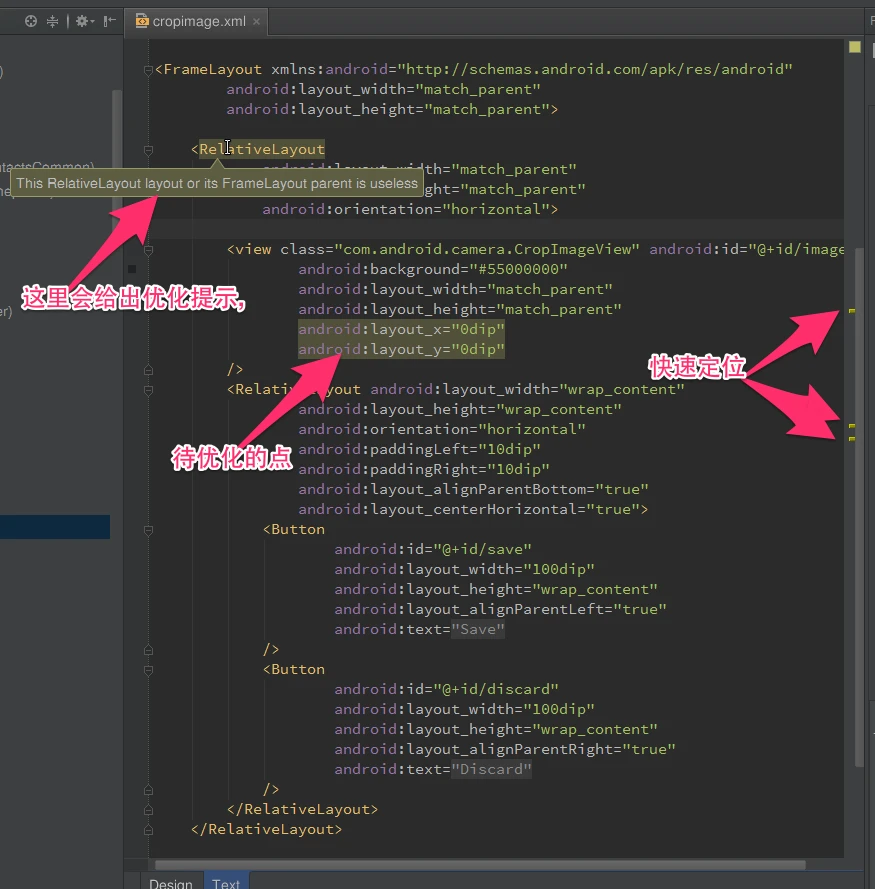
Using Lint
Lint highlights redundant layouts. For example, it might suggest that a FrameLayout wrapping a single RelativeLayout is unnecessary. Flattening these “useless parents” directly improves inflation and rendering speed.
Tracer for OpenGL ES
Located in the Android Device Monitor, this tool captures GL traces for specific frames. Comparing traces from before and after optimization confirms that we are no longer drawing the redundant window and CustomViewBehind backgrounds. Over the course of multiple interactions, these savings significantly reduce GPU load.
Detailed documentation: Tracer for OpenGL ES
About Me && Blog
(Links and introduction)