
This is the seventh article in the Perfetto series, focusing on MainThread (UI Thread) and RenderThread, the two most critical threads in any Android application. This article will examine the workflow of MainThread and RenderThread from Perfetto’s perspective, covering topics such as jank, software rendering, and frame drop calculations.
As Google officially promotes Perfetto as the replacement for Systrace, Perfetto has become the mainstream choice in performance analysis. This article combines specific Perfetto trace information to help readers understand the complete workflow of MainThread and RenderThread, enabling you to:
- Accurately identify key trace tags: Understand the roles of critical threads like UI Thread and RenderThread
- Understand the complete frame rendering process: Every step from Vsync signal to screen display
- Locate performance bottlenecks: Quickly find the root cause of jank and performance issues through trace information
Table of Contents
- Series Catalog
- Rendering Flow Analysis Based on Perfetto
- Evolution of Dual-Thread Rendering Architecture
- Main Thread Creation Process
- ActivityThread Functionality
- RenderThread Creation and Development
- Performance
- Perfetto’s Unique FrameTimeline Feature
- Vsync Signals in Perfetto
- References
- Attachments
- About Me && Blog
Series Catalog
- Android Perfetto Series Catalog
- Android Perfetto Series 1: Introduction to Perfetto
- Android Perfetto Series 2: Capturing Perfetto Traces
- Android Perfetto Series 3: Familiarizing with Perfetto View
- Android Perfetto Series 4: Opening Large Traces via Command Line
- Android Perfetto Series 5: Android App Rendering Flow Based on Choreographer
- Android Perfetto Series 6: Why 120Hz? Advantages and Challenges of High Refresh Rates
- Android Perfetto Series 7: MainThread and RenderThread Deep Dive
- Android Perfetto Series 8: Understanding Vsync Mechanism and Performance Analysis
- Android Perfetto Series 9: CPU Information Interpretation
- Android Perfetto Series 10: Binder Scheduling and Lock Contention
- Android Perfetto Series 11: PerfettoSQL, Trace Processor and Regression Detection
- Android Perfetto Series 12: Trace Dataflow and Data Loss
- Android Perfetto Series 13: Perfetto SDK, Track Event and App Field Traces
- Android Perfetto Series 14: heapprofd and Memory Profiling
- Android Perfetto Series 15: Boot Traces and Long-running Field Tracing
- Android Perfetto Series 16: GPU, Power Counters and Hardware Bottlenecks
- Android Perfetto Series 17: Scenario Automation and Platform Tracing
- Android Perfetto Series 18: Input Response Latency
- Video (Bilibili) - Android Perfetto Basics and Case Sharing
- Video (Bilibili) - Android Perfetto: Trace Graph Types - AOSP, WebView, Flutter + OEM System Optimization
If you haven’t read the Systrace series yet, here are the links:
- Systrace Series Catalog: A systematic introduction to Systrace, Perfetto’s predecessor, and learning about Android performance optimization and Android system operation basics through Systrace.
- Personal Blog: My personal blog, mainly Android-related content, with some life and work-related content as well.
Welcome to join the WeChat group or community on the About Me page to discuss your questions, what you’d most like to see about Perfetto, and all Android development-related topics with fellow group members.
The trace files used in this article have been uploaded to Github: https://github.com/Gracker/SystraceForBlog/tree/master/Android_Perfetto/demo_app_aosp_scroll.perfetto-trace, feel free to download them.
Version note: Android 17 (API 37) is the current technical reference, and the same analysis approach can be checked on Android 12 and later. Source excerpts were organized from AOSP main at writing time, while screenshots come from the attached device trace; illustrative excerpts are not verbatim Android 17 release source. Verify signatures and track names against the target branch and trace.
Rendering Flow Analysis Based on Perfetto
Using a scrolling list as an example, we’ll inspect main-thread and RenderThread activity near one frame in Perfetto. The phases vary by frame and rendering path, so check frame tokens before treating nearby slices as one frame.
Frame Concept and Basic Parameters
Before analyzing Perfetto traces, distinguish the display’s nominal interval in a fixed mode from the number of distinct app frames actually presented:
- 60Hz mode: Nominal refresh interval about 16.67ms
- 90Hz mode: Nominal refresh interval about 11.11ms
- 120Hz mode: Nominal refresh interval about 8.33ms
The display can repeat the preceding frame; none of these modes proves that the app produced that many new frames per second.
When analyzing rendering performance in Perfetto, focus on these two threads:
- UI Thread: The application main thread, handling user input, business logic, and layout calculations
- RenderThread: The rendering thread, preparing and submitting GPU commands and interacting with the buffer submission path; the GPU executes those commands
Main Thread and RenderThread Workflow
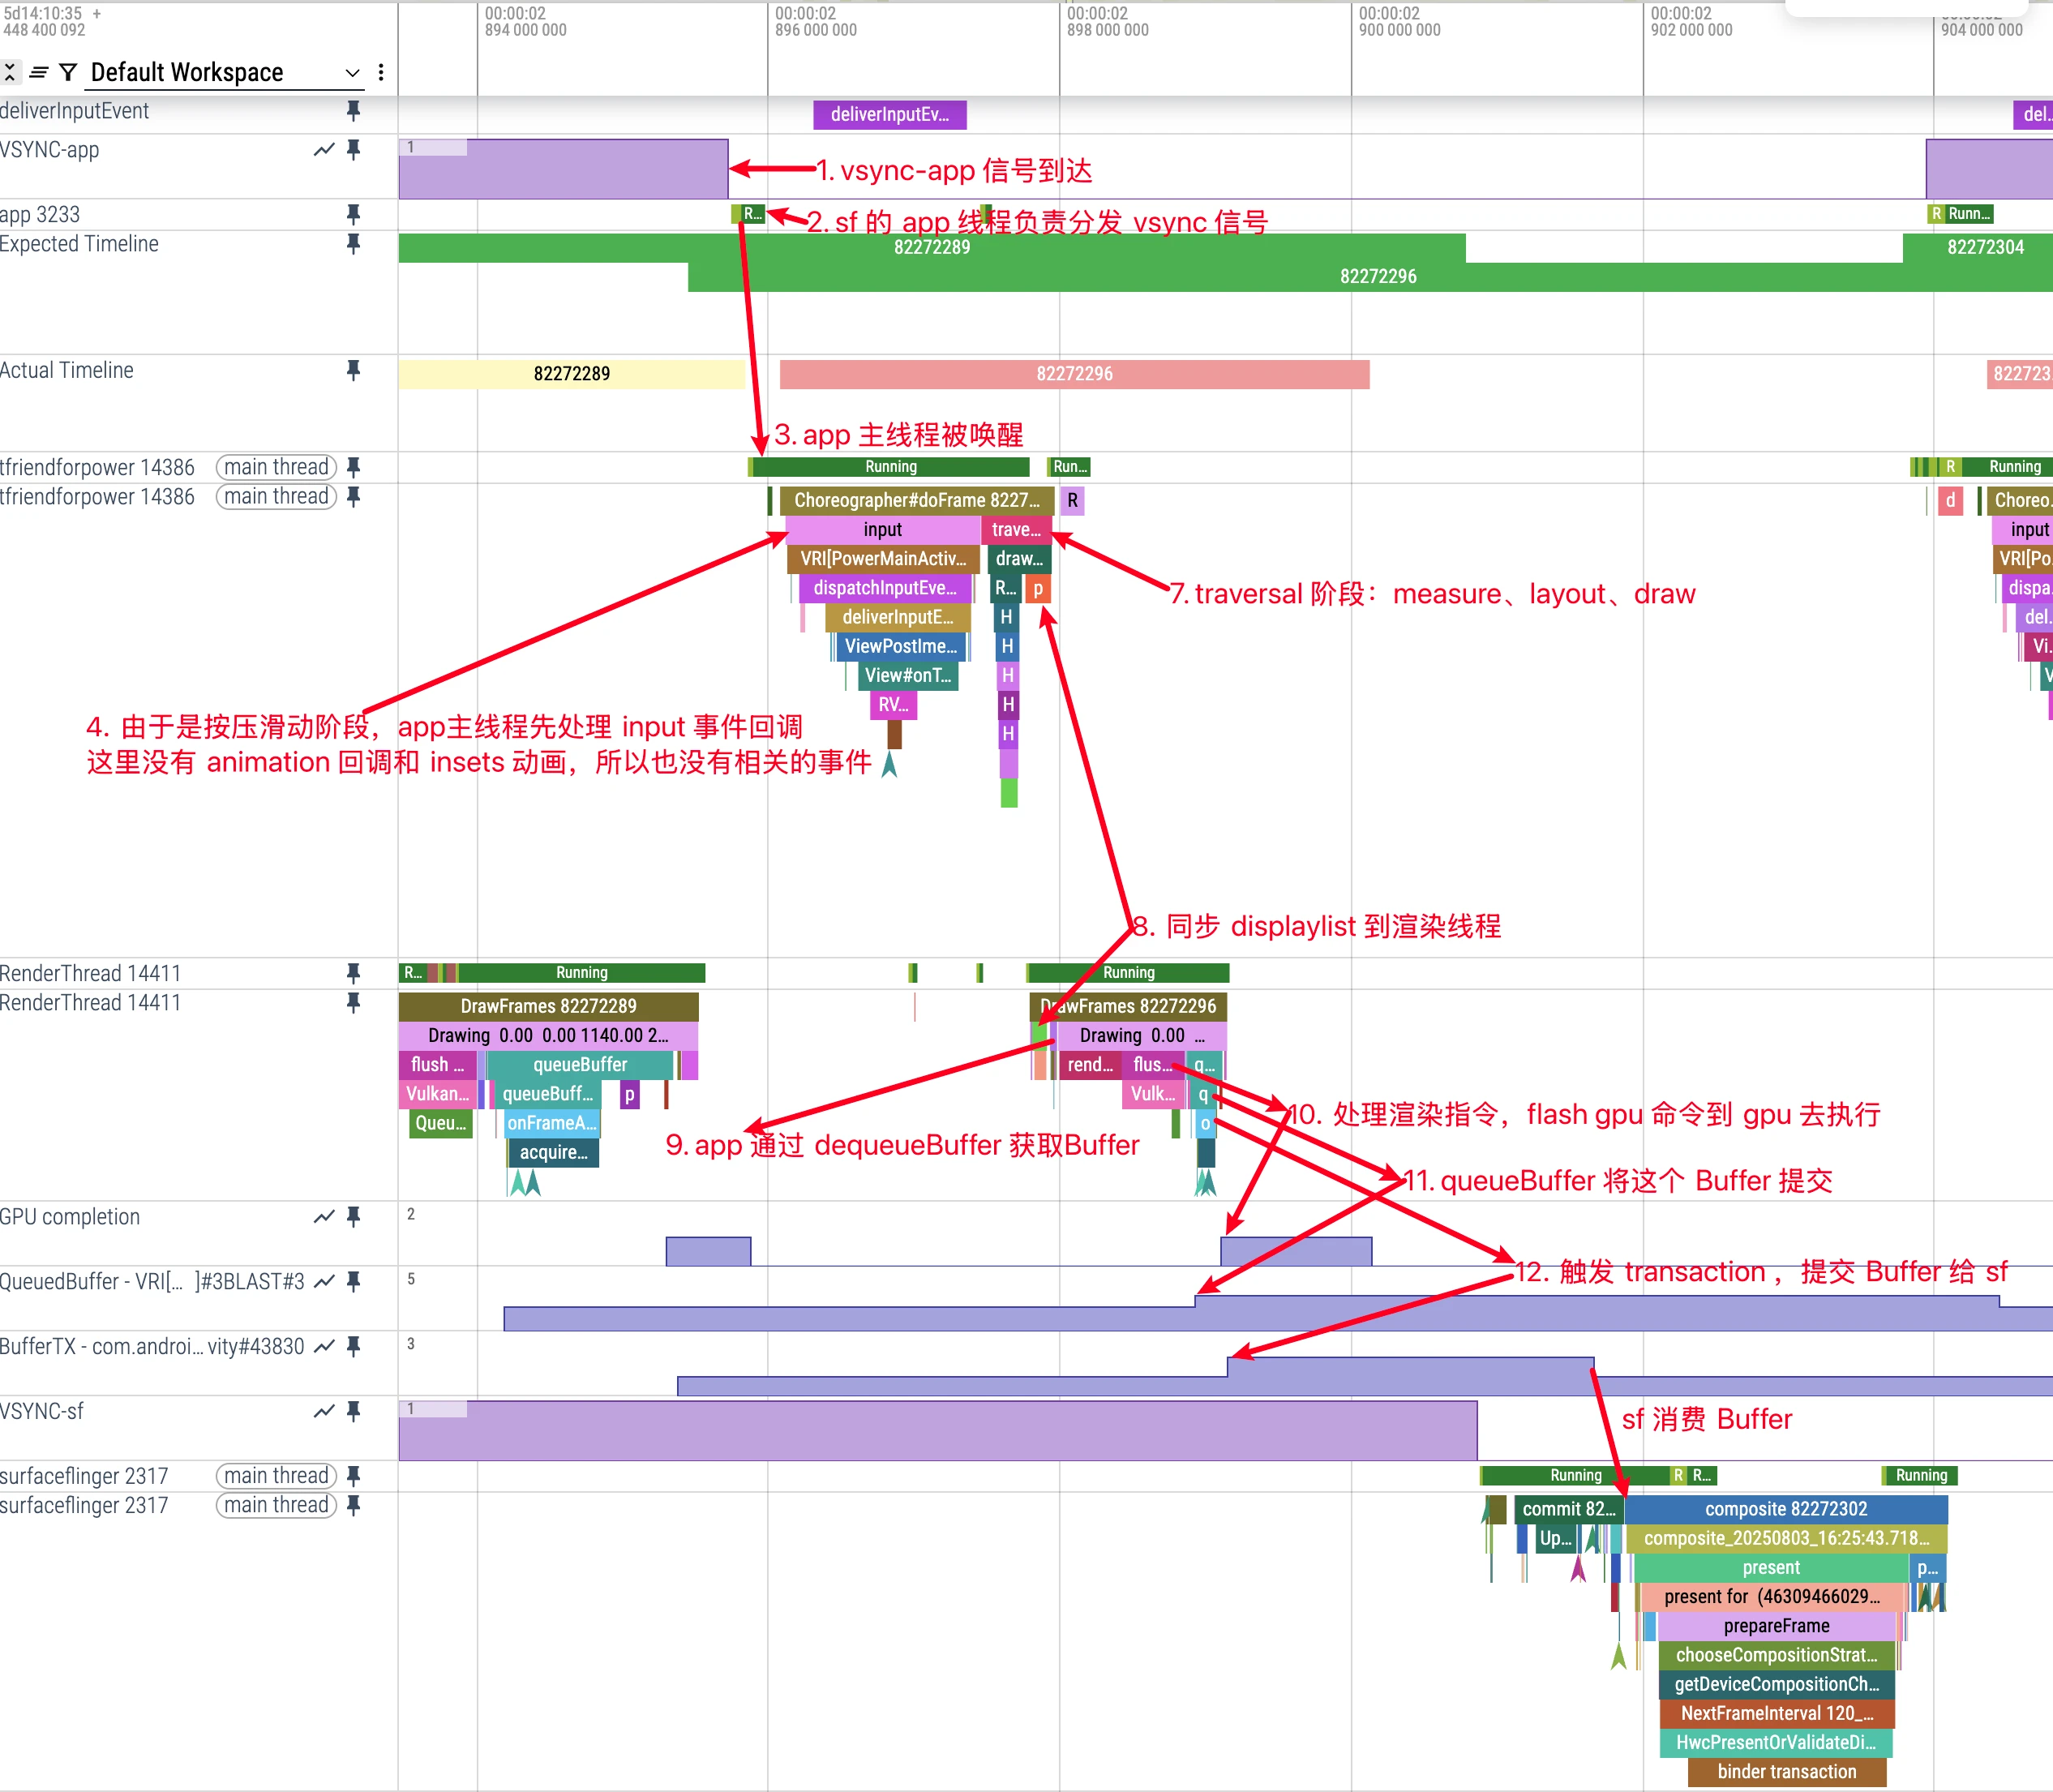
The Perfetto screenshot shows main-thread and RenderThread activity near one frame. We can imagine the Perfetto diagram as a river: the main thread handles logic upstream, and the render thread submits drawing work downstream. Check frame tokens before treating adjacent slices as one frame.
Important Note: Not every frame executes all steps. Input, Animation, and Insets Animation are all on-demand. Traversal (measure, layout, draw) is also on-demand: requestLayout, invalidate, and window or visibility changes are common reasons for scheduleTraversals() to post CALLBACK_TRAVERSAL. In continuous scrolling/animation scenarios, it often looks like it runs every frame.
Try to “play” this complete process in your mind through the following description:
1. Main Thread Waits for Vsync Signal
- Perfetto trace: The main thread may be Sleeping between two periods of work
- Process description: With a pending frame, Choreographer requests a Vsync callback. Sleeping alone does not prove the thread is waiting specifically for Vsync.
2. Vsync-app Signal Delivery Process
- Perfetto trace:
vsync-apprelated events, SurfaceFlinger app thread activity - Process description: SurfaceFlinger’s scheduler uses display timing, including hardware callbacks and software prediction, to schedule events for applications that requested them
Important Notes:
- Vsync-app is requested on-demand: Apps only receive vsync-app signals when actively requested; no request means no signal
- Multi-app sharing mechanism: Multiple apps may request vsync-app signals simultaneously
- Signal attribution issue: The vsync-app signal in SurfaceFlinger may be requested by other apps; if the currently analyzed app hasn’t requested it, there will be no frame output, which is normal
3. SurfaceFlinger Wakes Up App Main Thread
- Perfetto trace:
FrameDisplayEventReceiver.onVsync - Process description: SurfaceFlinger sends the Vsync signal to registered apps through the FrameDisplayEventReceiver mechanism. The app’s Choreographer receives the signal and begins the frame drawing process
4. Processing Input Events (Input)
- Perfetto trace:
Inputblock - Process description: Runs when the frame has a registered Input callback; not every system input event is handled in this callback
- Trigger conditions:
- Has Input callback: When finger presses and slides on screen (like list scrolling, page dragging)
- No Input callback: During inertial scrolling after finger lift, static state
- Note: Check whether the callback was registered for this frame; finger state alone does not determine whether the slice appears
5. Processing Animations (Animation)
- Perfetto trace:
Animationblock - Process description: Only executes when animations need updating, updates animation state and current frame’s animation values
- Trigger conditions:
- Has Animation callback: During inertial scrolling, property animations running, list item creation and content changes, page transition animations, etc.
- No Animation callback: Interface static state, pure Input interaction phase (when no animation effects)
- Note: Animation callback is also determined by callbacks posted in the previous frame to decide whether to execute in the current frame
6. Processing Insets Animations
- Perfetto trace:
Insets Animationblock - Process description: Only executes when window inset changes occur, handles window boundary animations
- Trigger conditions:
- Has Insets Animation callback: Keyboard show/hide, status bar show/hide, navigation bar changes, etc.
- No Insets Animation callback: Window boundary stable state, most common interaction scenarios
7. Traversal (Measure, Layout, Draw Preparation)
- Perfetto trace:
performTraversals,measure,layout,draw - Process description: These are the three core UI rendering stages, but they do not run as a complete set on every Vsync. Execution depends on whether the current frame has layout/draw requests.
7.1 Measure Phase
- Purpose: Determine the size of each View
- Process: Starting from the root View, recursively measure the width and height of all child Views
- Key concepts:
MeasureSpec: Encapsulates parent container’s size requirements for child Views (EXACTLY, AT_MOST, UNSPECIFIED)onMeasure(): Each View overrides this method to implement its own measurement logic
- Perfetto representation:
measureevent, duration depends on View hierarchy complexity
7.2 Layout Phase
- Purpose: Determine each View’s position coordinates in the parent container
- Process: Based on Measure phase results, assign actual display positions to each View
- Key concepts:
layout(left, top, right, bottom): Set View’s four boundary coordinatesonLayout(): ViewGroup overrides this method to determine child View positions
- Perfetto representation:
layoutevent, usually faster than measure
7.3 Draw Phase
- Purpose: Draw View content onto canvas
- Modern implementation: Doesn’t directly draw pixels, but builds DisplayList (drawing instruction list)
- Key process:
draw(Canvas): Draw View’s own contentonDraw(Canvas): Subclass overrides to implement specific drawing logicdispatchDraw(Canvas): ViewGroup uses this to draw child Views
- Perfetto representation:
drawevent, mainly builds DisplayList under hardware acceleration
ViewRootImpl.performTraversals Core Code
1 | // frameworks/base/core/java/android/view/ViewRootImpl.java |
Note: In latest AOSP,
performTraversalsis much more complex (relayout, surface changes, sync groups, canceled draws, visibility, etc.). The snippet keeps only the flow directly related to Measure/Layout/Draw.
Execution conditions for the three phases:
- Measure: Runs on first draw and when layout/configuration/insets/window changes require it, not fixed every frame
- Layout: Runs when
layoutRequestedis true and the app is in a drawable state - Draw: Runs only when draw conditions are satisfied; canceled/pre-draw-blocked cases reschedule traversal
8. Sync DisplayList to Render Thread
- Perfetto trace: syncAndDrawFrame, visible “sync” or “syncAndDrawFrame” event (usually shown as data transfer point from main thread to render thread)
- Process description: Main thread syncs current-frame RenderNode/DisplayList state to RenderThread through
syncAndDrawFrame. This is not pure fire-and-forget async: UI thread waits briefly for a key sync point (DrawFrameTask::postAndWait) and is then unblocked as early as possible; it does not wait until the frame is actually presented.
9. Render Thread Acquires Buffer
- Perfetto trace: You can often observe
DequeueBufferDuration/QueueBufferDurationrelated data (exact tags vary by Android version and OEM). - Process description: During draw submission, RenderThread goes through the
ANativeWindow/RenderPipelinepath for buffer acquire/swap. Whether it waits, and how long it waits, directly affects deadline miss risk.
10. Process Rendering Instructions and Flush to GPU
- Perfetto trace:
drawingrelated blocks - Process description: RenderThread (CPU side) processes the RenderNode tree synced from UI thread via
HardwareRenderer/CanvasContext, builds GPU commands, and submits them. GPU executes asynchronously and produces fences for downstream composition sync.
11. Submit Buffer (Possibly Unsignaled)
- Perfetto trace: queueBuffer (can observe acquireFence state)
- Process description: Frame submission enters SurfaceFlinger through BufferQueue/BLAST. In some scenarios, unsignaled-fence behavior appears (policy-controlled), aiming to reduce end-to-end latency.
12. Trigger Transaction to SurfaceFlinger
- Perfetto trace: TransactionQueue or BLAST transaction events, generally after queueBuffer, some traces don’t have this tag
- Process description: App side associates buffer and layer-property updates via BLAST/SurfaceControl transactions and submits them to SurfaceFlinger. SurfaceFlinger then decides latch timing based on
LatchUnsignaledConfigand related policies, composes, and presents.
Identifying different rendering modes in Perfetto:
- During finger sliding: Look for
InputandTraversal, then confirm whether RenderThread submitted a frame - During inertial scrolling:
AnimationandTraversalare common; whether Input also appears depends on the captured callbacks - In static state: The app may submit no new frame; background animation or another update can still trigger work
Software Drawing vs Hardware Acceleration
Although hardware-accelerated rendering is now basically standard, understanding the differences between the two rendering modes still helps understand Perfetto traces:
| Aspect | Software Drawing | Hardware Acceleration |
|---|---|---|
| Drawing Thread | Main thread | RenderThread |
| Drawing Engine | Skia (CPU) | Skia with an OpenGL/Vulkan GPU backend |
| Perfetto Characteristics | Main thread has large draw events |
Main thread completes quickly, RenderThread handles drawing |
| Performance Impact | May occupy the main thread | Some work moves to RenderThread, but synchronization can still block the main thread |
The above introduces the basic rendering process. For more detailed Choreographer principles, refer to Android Perfetto Series 5: Android App Rendering Flow Based on Choreographer.
Next, we’ll focus on in-depth content about the main thread and render thread:
- Main thread development
- Main thread creation
- Render thread creation
- Division of labor between main thread and render thread
Evolution of Dual-Thread Rendering Architecture
Android’s rendering system has undergone an important evolution from single-thread to dual-thread.
Earlier View Rendering (Before Android 5.0)
In early software-drawn View paths, the main thread handled more UI drawing work:
- Processing user input events
- Executing measure, layout, draw
- Submitting software-drawn buffers; other graphics paths could use other threads
Problems with this design:
- Poor responsiveness: Main thread overloaded, prone to ANR
- Performance bottleneck: Drawing work competes with input and business messages on the main thread
- Unstable frame rate: Complex interfaces easily cause frame drops
Dual-Thread Era (Starting from Android 5.0 Lollipop)
Android 5.0 introduced RenderThread, implementing separation of rendering work:
Main Thread Responsibilities:
- Processing user input and business logic
- Executing View’s measure, layout, draw
- Building DisplayList (drawing instruction list)
- Synchronizing data with render thread
Render Thread Responsibilities:
- Receiving and processing DisplayList
- Generating and submitting OpenGL/Vulkan rendering commands for the GPU to execute
- Managing textures and rendering resources
- Interacting with SurfaceFlinger
Advantages of this architecture:
- Parallel opportunity: After the key sync point, the main thread can process other messages while RenderThread continues
- Sync boundary: The main thread can still block at
syncAndDrawFrame; the two threads are not fully independent - Performance optimization: Better utilization of GPU resources
Main Thread Creation Process
Android App processes are Linux-based, and their management is also based on Linux process management mechanisms, so their creation also calls the fork function
frameworks/base/core/jni/com_android_internal_os_Zygote.cpp
1 | pid_t pid = fork(); |
The forked process, we can consider it as the main thread here, but this thread hasn’t connected with Android yet, so it cannot handle Android App Messages; since Android App threads run based on the message mechanism, this forked main thread needs to bind with Android’s Message messaging to handle various Android App Messages.
This introduces ActivityThread. To be precise, ActivityThread should be named ProcessThread more appropriately. ActivityThread connects the forked process with App Messages, and their cooperation forms what we know as the Android App main thread. So ActivityThread is actually not a Thread, but it initializes the MessageQueue, Looper, and Handler required by the Message mechanism, and its Handler handles most Message messages, so we habitually think ActivityThread is the main thread, but it’s actually just a logical processing unit of the main thread.
ActivityThread Creation
After app process fork, the main path is:ZygoteConnection.handleChildProc → ZygoteInit.zygoteInit → RuntimeInit.applicationInit → ActivityThread.main
com/android/internal/os/ZygoteConnection.java
1 | private Runnable handleChildProc(ZygoteArguments parsedArgs, FileDescriptor pipeFd, |
For regular app processes, this goes through zygoteInit and eventually reaches ActivityThread.main. childZygoteInit is for child-zygote flow, not the normal app path.
android/app/ActivityThread.java
1 | public static void main(String[] args) { |
The comments are very clear, so I won’t elaborate here. Once Looper.loop() starts, the main thread begins dispatching messages; ActivityThread.main() does not normally return while the app is running.
ActivityThread Functionality
ActivityThread’s Handler dispatches many component lifecycle messages on the main thread. Subsequent work in a Service or Receiver can move to other threads, so this does not mean every operation of all four component types runs on the main thread.
1 | class H extends Handler { // Illustrative message types; check values in the target branch |
You can see that process creation, Activity startup, Service management, Receiver management, and Provider management are all handled here, then proceed to specific handleXXX. On Android 17, apps targeting API 37 or higher use a new lock-free MessageQueue implementation. Looper and Handler usage remains the same, but checks for queue-internal lock contention must account for the app’s targetSdkVersion.
RenderThread Creation and Development
After discussing the main thread, let’s talk about RenderThread. Early software-drawn View paths put more drawing work on the main thread through Skia; other graphics paths could already use GPU work. RenderThread was added in Android Lollipop to take on part of the View rendering work.
Software Drawing
What we generally refer to as hardware acceleration means GPU acceleration, which can be understood as using RenderThread to call GPU for rendering acceleration. Hardware acceleration is enabled by default in current Android, so if we don’t set anything, our processes will have both main thread and render thread by default (with visible content). If we add this to the Application tag in the App’s AndroidManifest:
1 | android:hardwareAccelerated="false" |
We can disable hardware acceleration for ordinary View drawing. That path then relies more on main-thread software drawing; whether the process still has a RenderThread depends on other Surfaces or components. Its Trace tracking performance is as follows (resources are older, using Systrace diagram)
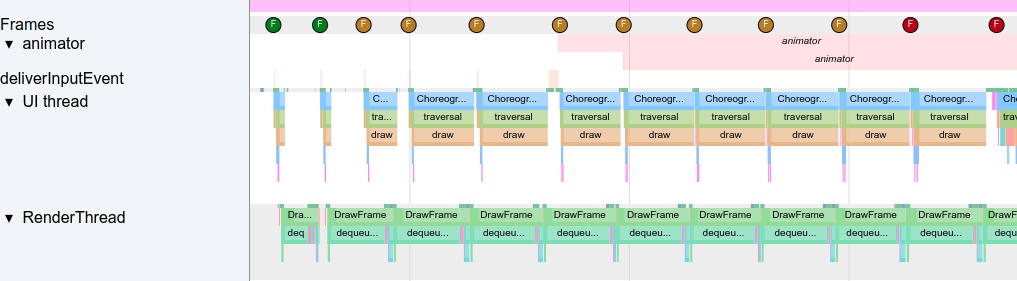
Compared with the Perfetto diagram with hardware acceleration enabled at the beginning of this article, you can see that the main thread takes longer to execute because it needs to perform rendering work, making it more prone to jank. At the same time, the idle interval between frames becomes shorter, compressing the execution time of other Messages. In Perfetto, this difference can be clearly observed through the length and density of thread activity.
Hardware-Accelerated Drawing
Under normal circumstances, hardware acceleration is enabled. Main thread draw mainly builds/updates DisplayList (RenderNode tree), then syncs via syncAndDrawFrame. UI thread waits briefly on key sync path, returns quickly to process messages, and RenderThread continues rendering/submission.
Render Thread Initialization
Render thread initialization occurs when content actually needs to be drawn. Generally, when we start an Activity, during the first draw execution, it checks whether the render thread is initialized; if not, it proceeds with initialization
android/view/ViewRootImpl.java
1 | // Render thread initialization |
The BlastBufferQueue created here will play a key role in subsequent rendering processes:
- Provides efficient Buffer management for RenderThread
- Supports batch Transaction submission, reducing interaction overhead with SurfaceFlinger
- QueuedBuffer metric changes can be observed in Perfetto
Subsequently, draw is called directly
android/view/ThreadedRenderer.java
1 | mAttachInfo.mThreadedRenderer.draw(mView, mAttachInfo, this); |
The draw above updates DisplayList first, then calls syncAndDrawFrame for the key UI Thread to RenderThread sync stage.
UI Thread and RenderThread DisplayList Synchronization Mechanism
In the syncAndDrawFrame key function, the following important synchronization operations occur:
1 | // frameworks/base/libs/hwui/renderthread/RenderProxy.cpp |
syncAndDrawFrame is not fully non-blocking. In latest AOSP, DrawFrameTask::drawFrame() calls postAndWait(): it posts work to RenderThread queue and then waits on a condition variable; RenderThread unblocks UI at an appropriate sync point. So this is “wait a bit, unblock UI as early as possible”, not “UI never waits”.
1 | // frameworks/base/libs/hwui/renderthread/DrawFrameTask.cpp |
The specific synchronization process includes:
- RenderNode tree transfer: The RenderNode tree (containing DisplayList) built by the main thread during the draw process is passed to RenderThread
- Property synchronization: View’s transformation matrices, transparency, clipping regions, and other properties are synchronized together
- Resource sharing: Drawing resources like textures, Paths, and Paints establish sharing mechanisms between the two threads
- Rendering state transfer: Rendering state information needed for the current frame is passed to RenderThread
This synchronization process is the core of Android hardware-accelerated rendering. It implements a division of labor where UI Thread focuses on logic processing and RenderThread focuses on rendering.
The core implementation of the render thread is in the libhwui library, with code located at frameworks/base/libs/hwui
RenderThread and BlastBufferQueue Interaction Flow
After RenderThread receives the synced DisplayList, it begins actual rendering work. During this process, it interacts closely with BlastBufferQueue:
1 | // frameworks/base/libs/hwui/renderthread/CanvasContext.cpp |
Note: The old intuitive flow (
dequeueBuffer/queueBuffer/flushTransaction) is still useful as a mental model, but in latest mainline these details are consolidated intoRenderPipeline/ANativeWindowpath, andCanvasContext::draw()is no longer in the old shape.
Key Features of BlastBufferQueue:
- App-side management: Unlike traditional BufferQueue created by SurfaceFlinger, BlastBufferQueue is created and managed by the App side
- Buffer acquisition: Producer and consumer are local to the app, but
dequeueBuffercan still wait when no buffer is available - Buffer rotation: Measure any waiting-time or high-refresh-rate benefit on the target device trace
- Asynchronous submission: Asynchronously submits completed frames to SurfaceFlinger through transaction mechanism
- Supports unsignaled buffer: Cooperating with SurfaceFlinger unsignaled-latch policies can reduce end-to-end latency in specific scenarios
In-depth Discussion on Latching Unsignaled Buffers
Modern Android systems can sometimes latch a Buffer before its acquire fence signals. This policy is called “Latching Unsignaled Buffers”. The present fence records a later presentation stage and must not be confused with the acquire fence.
Traditional mode: SurfaceFlinger checks the Buffer’s acquire fence before reading content that the GPU may still be writing.
Latch Unsignaled mode: Under the supported policy, SurfaceFlinger can latch a Buffer whose acquire fence has not yet signaled. It must still wait before actually reading unfinished content; whether this lowers latency depends on the device and scene.
Control Switch and Policy (Android 13+):
This behavior can be globally debugged through system property debug.sf.auto_latch_unsignaled, but more importantly, it’s controlled by a layered policy called LatchUnsignaledConfig. A typical policy is AutoSingleLayer:
- In Android 13’s default
AutoSingleLayerpolicy, early latch requires a single updated layer with a Buffer-only update and no synchronizing transaction or geometry change. - Multiple updated layers or other excluded transaction conditions do not take that early-latch path.
SurfaceFlinger therefore follows an acquire-fence and layer-update policy; the present fence is used later to assess when presentation completed.
Division of Labor Between Main Thread and Render Thread
The main thread handles process Messages, Input events, Animation logic, Measure, Layout, Draw, and updates DisplayList, but doesn’t directly interact with SurfaceFlinger; the render thread handles rendering-related work, including interaction with BlastBufferQueue and submitting GPU commands. The GPU executes those commands.
When hardware acceleration is enabled, in the Draw phase of Measure, Layout, Draw, Android uses DisplayList for drawing rather than directly using CPU to draw each frame. DisplayList is a record of a series of drawing operations, abstracted as the RenderNode class. The advantages of this indirect drawing operation are as follows:
- DisplayList can be drawn multiple times on demand without interacting with business logic
- Specific drawing operations (like translation, scale, etc.) can be applied to the entire DisplayList without redistributing drawing operations
- When all drawing operations are known, they can be optimized: for example, all text can be drawn together at once
- Processing of DisplayList can be transferred to another thread (i.e., RenderThread)
- After the key sync point releases the main thread, it can process other Messages; later work may still block it
- BlastBufferQueue associates Buffers with SurfaceControl transactions; measure whether it reduces waiting in the target trace
BlastBufferQueue Working Principle
BlastBufferQueue is a key component in modern Android rendering architecture, changing traditional buffer management methods:
Traditional BufferQueue vs BlastBufferQueue:
Different creation entities:
- Traditional BufferQueue: Created and managed by SurfaceFlinger
- BlastBufferQueue: Created and managed by App side (ViewRootImpl)
Buffer acquisition mechanism:
- Traditional method:
dequeueBuffercan block when no Buffer is available - BlastBufferQueue: App side creates a local BufferQueue, but
dequeueBuffercan still block when no Buffer is available
- Traditional method:
Submission mechanism:
- Traditional method: Directly submits to SurfaceFlinger through queueBuffer
- BlastBufferQueue: Associates the Buffer with a SurfaceControl transaction before submission
Observing BlastBufferQueue in Perfetto:
In Perfetto traces, BlastBufferQueue state is displayed through the following key metrics:
App-side QueuedBuffer Metric
- Perfetto display:
QueuedBuffervalue track - AOSP definition (BLASTBufferQueue):
QueuedBuffer = mNumFrameAvailable + mNumAcquired - mPendingRelease.size() - How to read it: This is a composite state metric, not a fixed-offset formula
- Practical use: Focus on trend and duration, not one instantaneous value

QueuedBuffer Value Change Timing
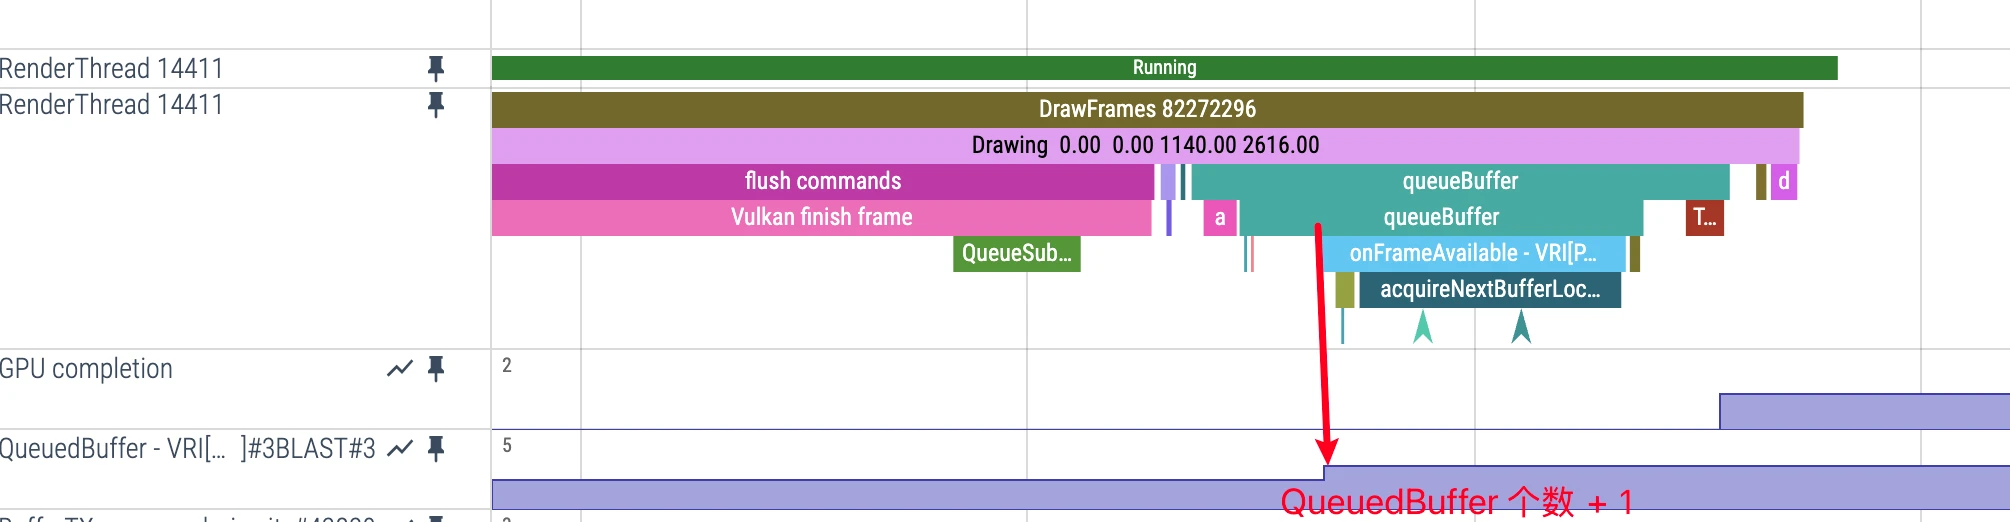
QueuedBuffer +1 timing:
- Common trigger: New buffer arrives into BLAST and becomes pending/processable
- Perfetto representation:
QueuedBuffertrack rises - Meaning: Frame pressure between app side and SF side increases
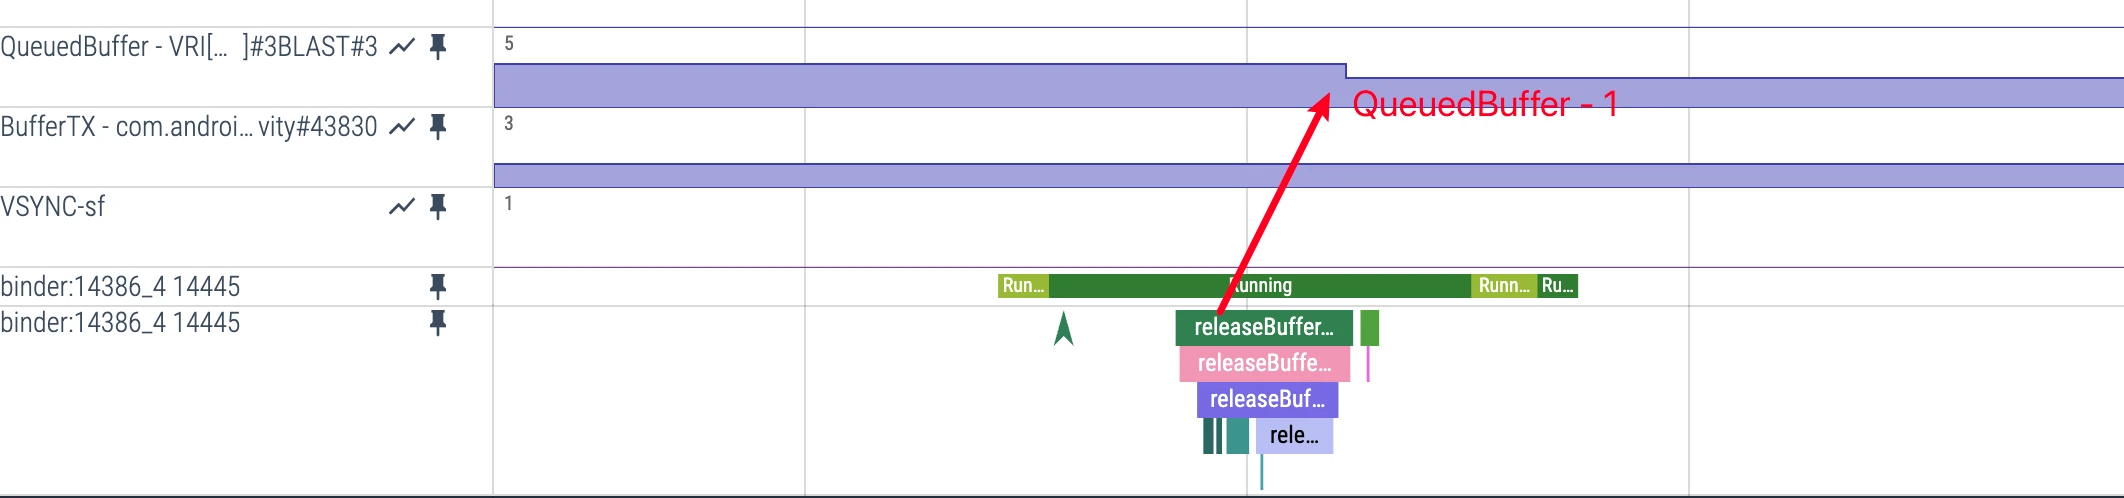
QueuedBuffer -1 timing:
- Trigger condition: Receives SurfaceFlinger’s
releaseBufferCallback - Perfetto representation: Can observe
releaseBufferrelated events - Meaning: A buffer is consumed/handled and released, queue pressure drops
SurfaceFlinger-side BufferTX Metric
- Perfetto display:
BufferTXvalue track in SurfaceFlinger process - AOSP definition (Layer): This tracks per-layer
mPendingBuffers; it increases when buffers arrive server-side and decreases when buffers are latched or dropped - Trigger condition: Depends on transaction and buffer lifecycle together; do not reduce it to “transaction received => +1”
- Note: It is not a universal fixed-max-3 metric; behavior depends on layer type, producer-consumer pacing, and system policy
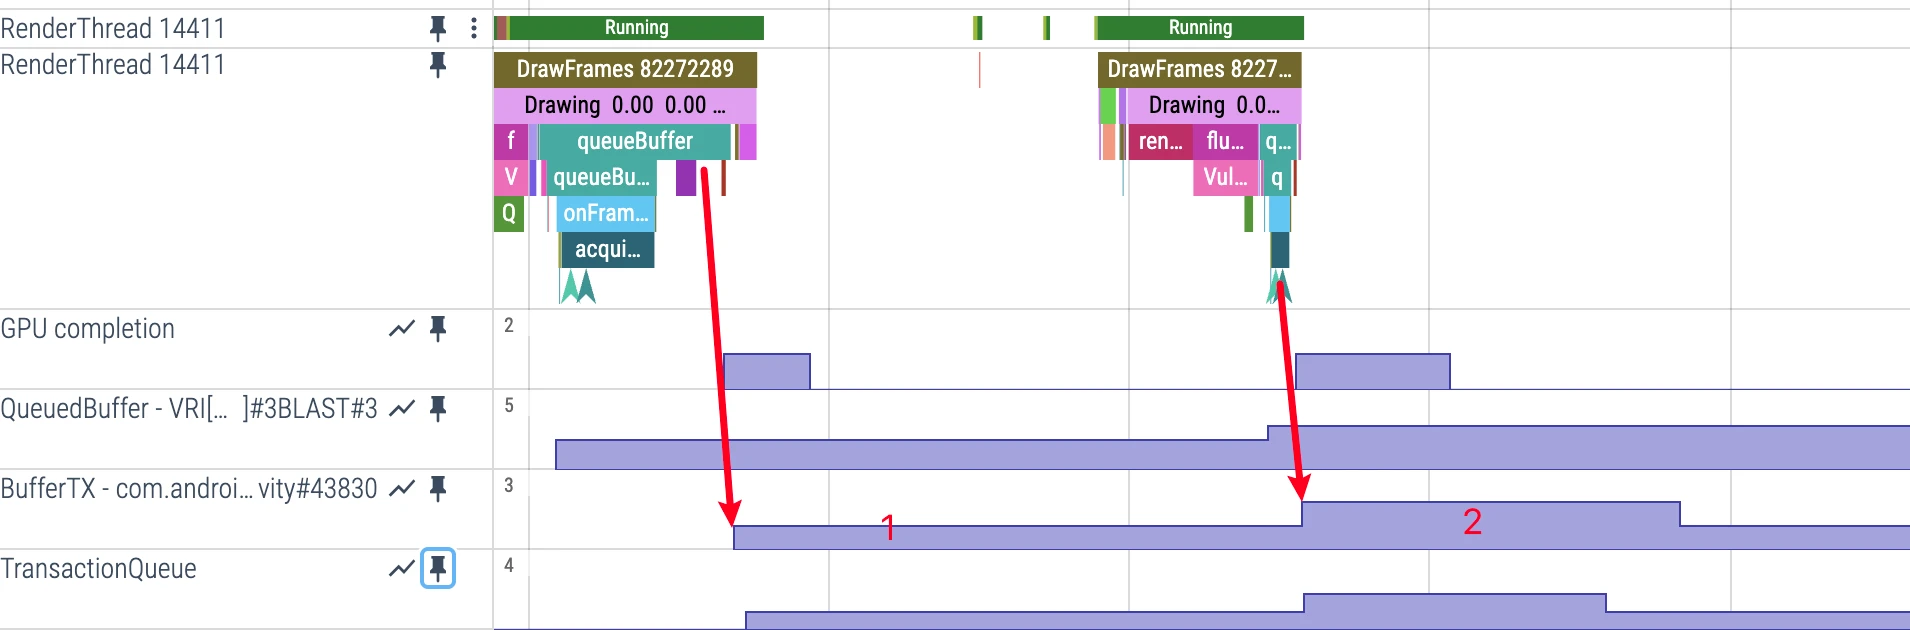
Collaboration Flow Between App Side and SF Side
- App side: after frame submission,
QueuedBufferoften rises - Cross-process: BLAST/SurfaceControl transaction associates updates with frameNumber and enters SF-side processing
- SF side:
BufferTXchanges with pending-buffer lifecycle (arrive +, latch/drop -) - Backflow:
releaseBufferCallbackreaches app side andQueuedBufferfalls
Key Performance Observation Points
When analyzing performance, focus on:
- App-side QueuedBuffer trend: Continuous rise without fallback often means producer-consumer mismatch; correlate with main-thread
performTraversalsand RenderThreadDrawFramesto localize bottleneck - SurfaceFlinger-side BufferTX trend: Persistently high often indicates consumer-side pressure; persistently low while app keeps missing deadlines often points to producer-side starvation
Performance
If the main thread needs to handle all tasks, executing time-consuming operations (e.g., network access or database queries) will block the entire UI thread. Once blocked, the thread cannot dispatch any events, including drawing events. Main thread execution timeout typically brings two problems:
- Jank: At 120Hz the nominal display interval is 8.33ms, but main-thread, RenderThread, and GPU work overlap in a pipeline. Do not add the two thread durations and compare the sum directly with 8.33ms; use the frame deadline and actual presentation result.
- Freeze: If the UI thread is blocked for more than a few seconds (this threshold varies depending on the component), users will see an “Application Not Responding“ (ANR) dialog (some manufacturers block this dialog and will directly crash to desktop)
For users, both situations are undesirable, so for App developers, both issues must be resolved before release. ANR is relatively easy to locate due to detailed call stacks; but intermittent jank may require tools for analysis: Perfetto + Trace View (already integrated in Android Studio). Therefore, understanding the relationship between main thread and render thread and their working principles is very important, which is also an original intention of this series.
Perfetto’s Unique FrameTimeline Feature
An important advantage of Perfetto over Systrace is providing the FrameTimeline feature, which allows you to see jank locations at a glance.
Note: FrameTimeline requires Android 12 or later
Core Concepts of FrameTimeline
According to Perfetto official documentation, jank occurs when a frame’s actual presentation time on screen doesn’t match the scheduler’s expected presentation time. FrameTimeline adds two new tracks for each application with frames displayed on screen:

1. Expected Timeline
- Purpose: Shows the rendering time window allocated by the system to the application
- Start time: When Choreographer callback is scheduled to run
- Meaning: To avoid system jank, the application needs to complete work within this time range
2. Actual Timeline
- Purpose: Shows the actual time the application completed the frame (including GPU work)
- Start time: When
Choreographer#doFrameorAChoreographer_vsyncCallbackstarts running - End time:
max(GPU time, Post time), where Post time is when the frame was submitted to SurfaceFlinger
When you click on a trace in Actual Timeline, it will show the specific consumption time for this frame (can see latency).
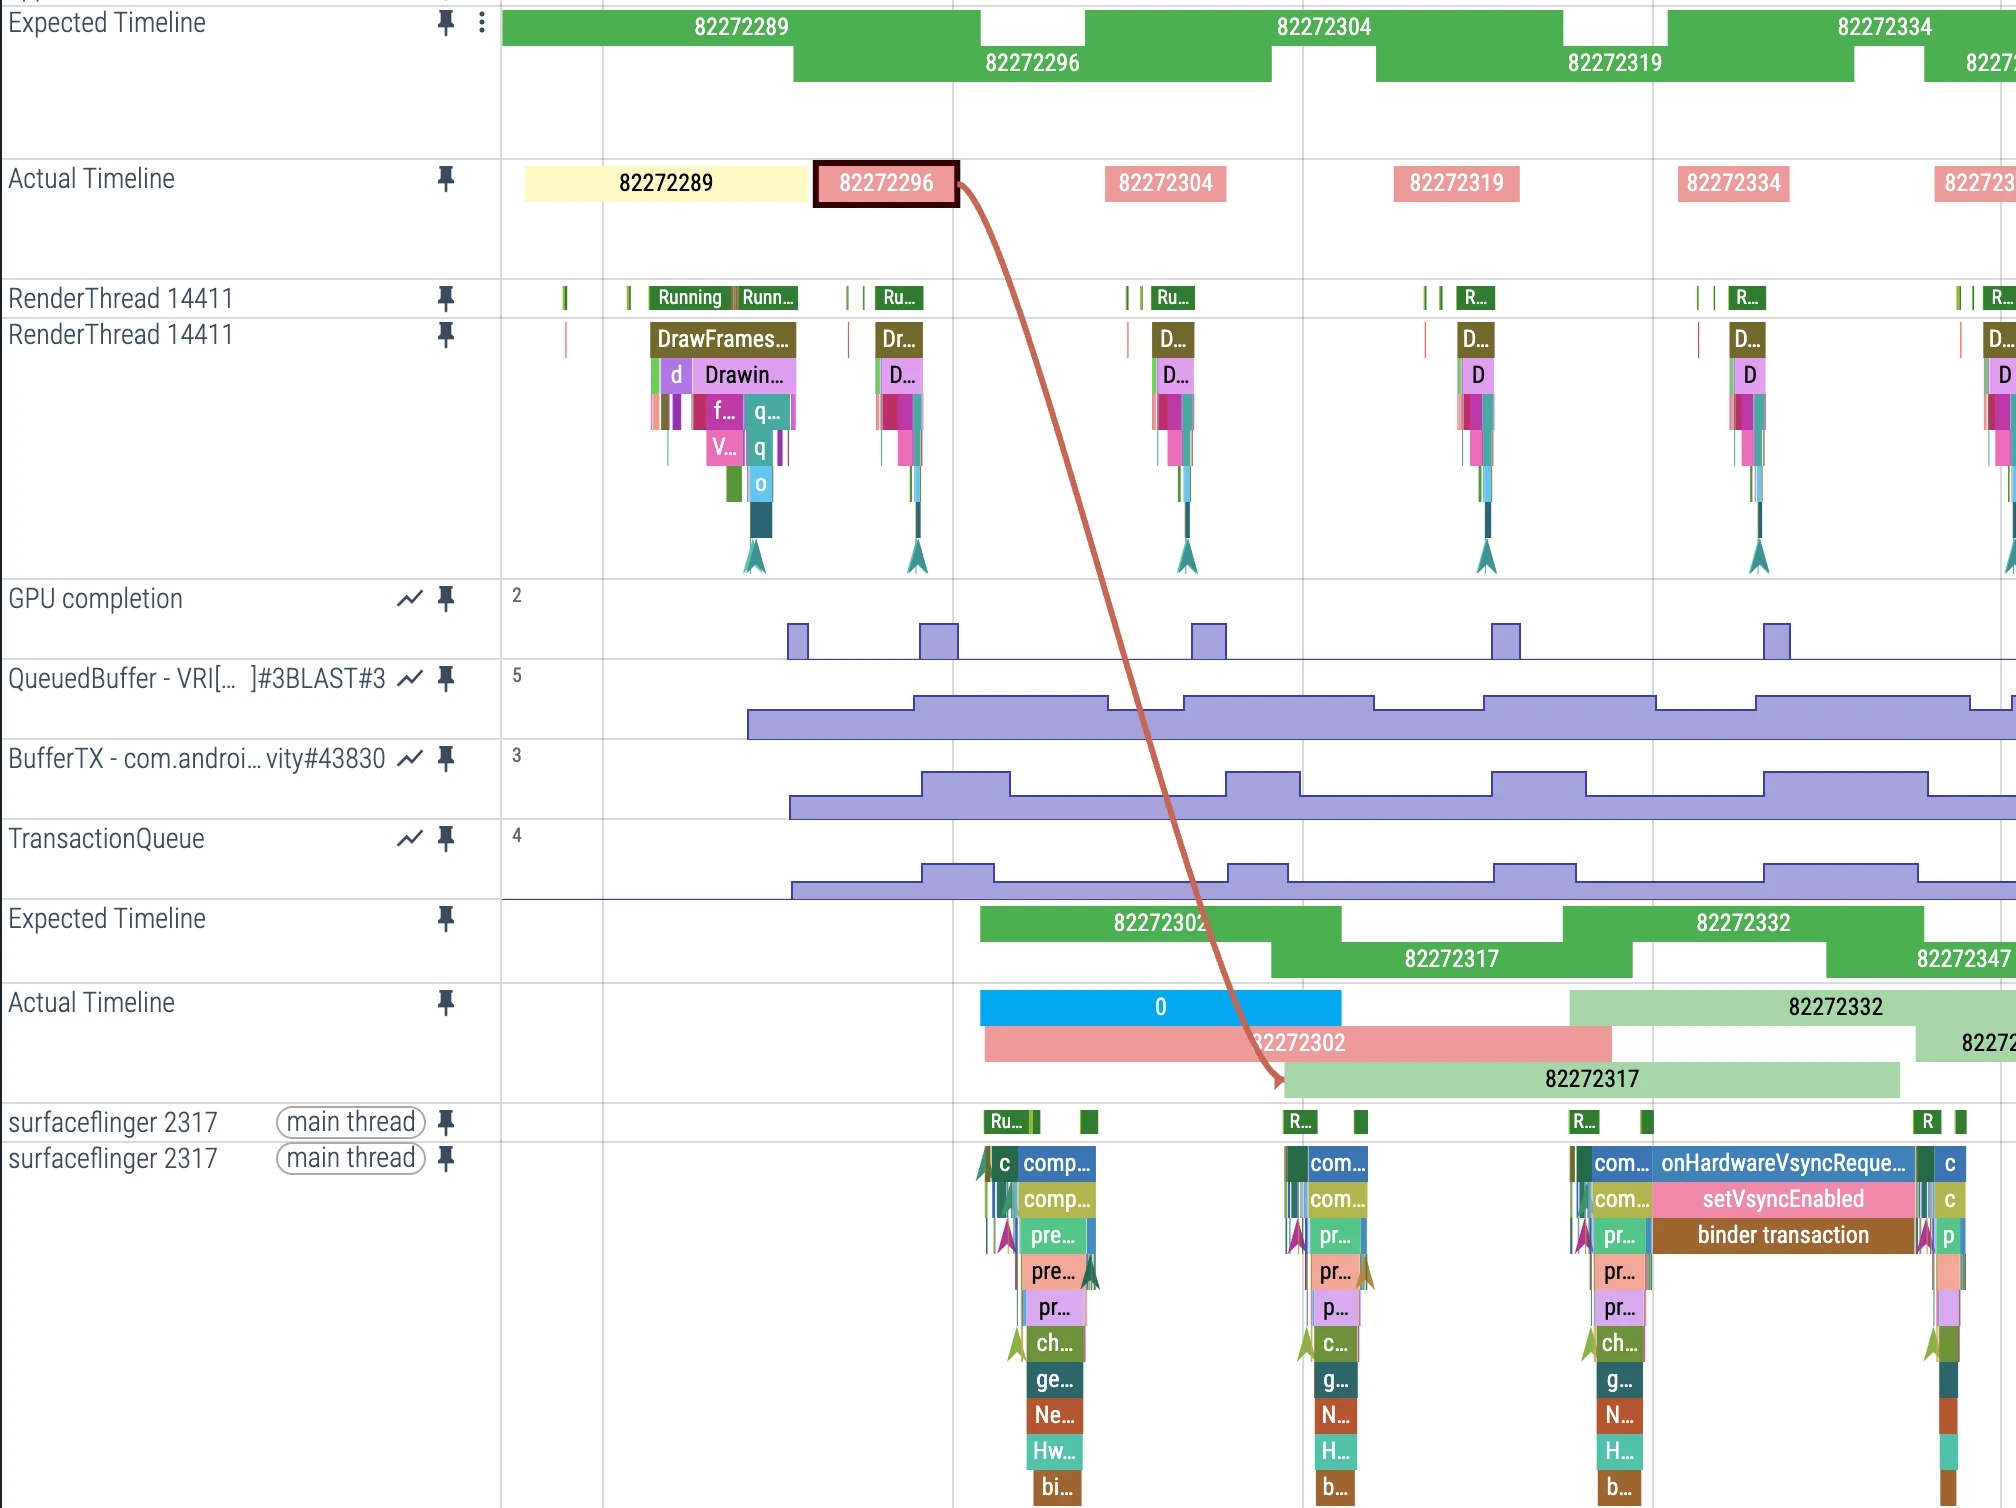
Color Coding System
FrameTimeline uses intuitive colors to identify different frame states:
| Color | Meaning | Description |
|---|---|---|
| Green | Normal frame | No jank observed, ideal state |
| Light green | High latency state | Stable frame rate but delayed frame presentation, causing increased input latency |
| Red | Jank frame | Jank caused by current process |
| Yellow | App-blameless jank | Frame has jank but app is not the cause, jank caused by SurfaceFlinger |
| Blue | Dropped frame | On the SF side a newer frame was chosen; on the app side, a UI state update may have missed RenderThread before it drew |
Clicking different colored ActualTimeline slices shows classifications such as jank_type; inspect threads and fences to identify the underlying cause: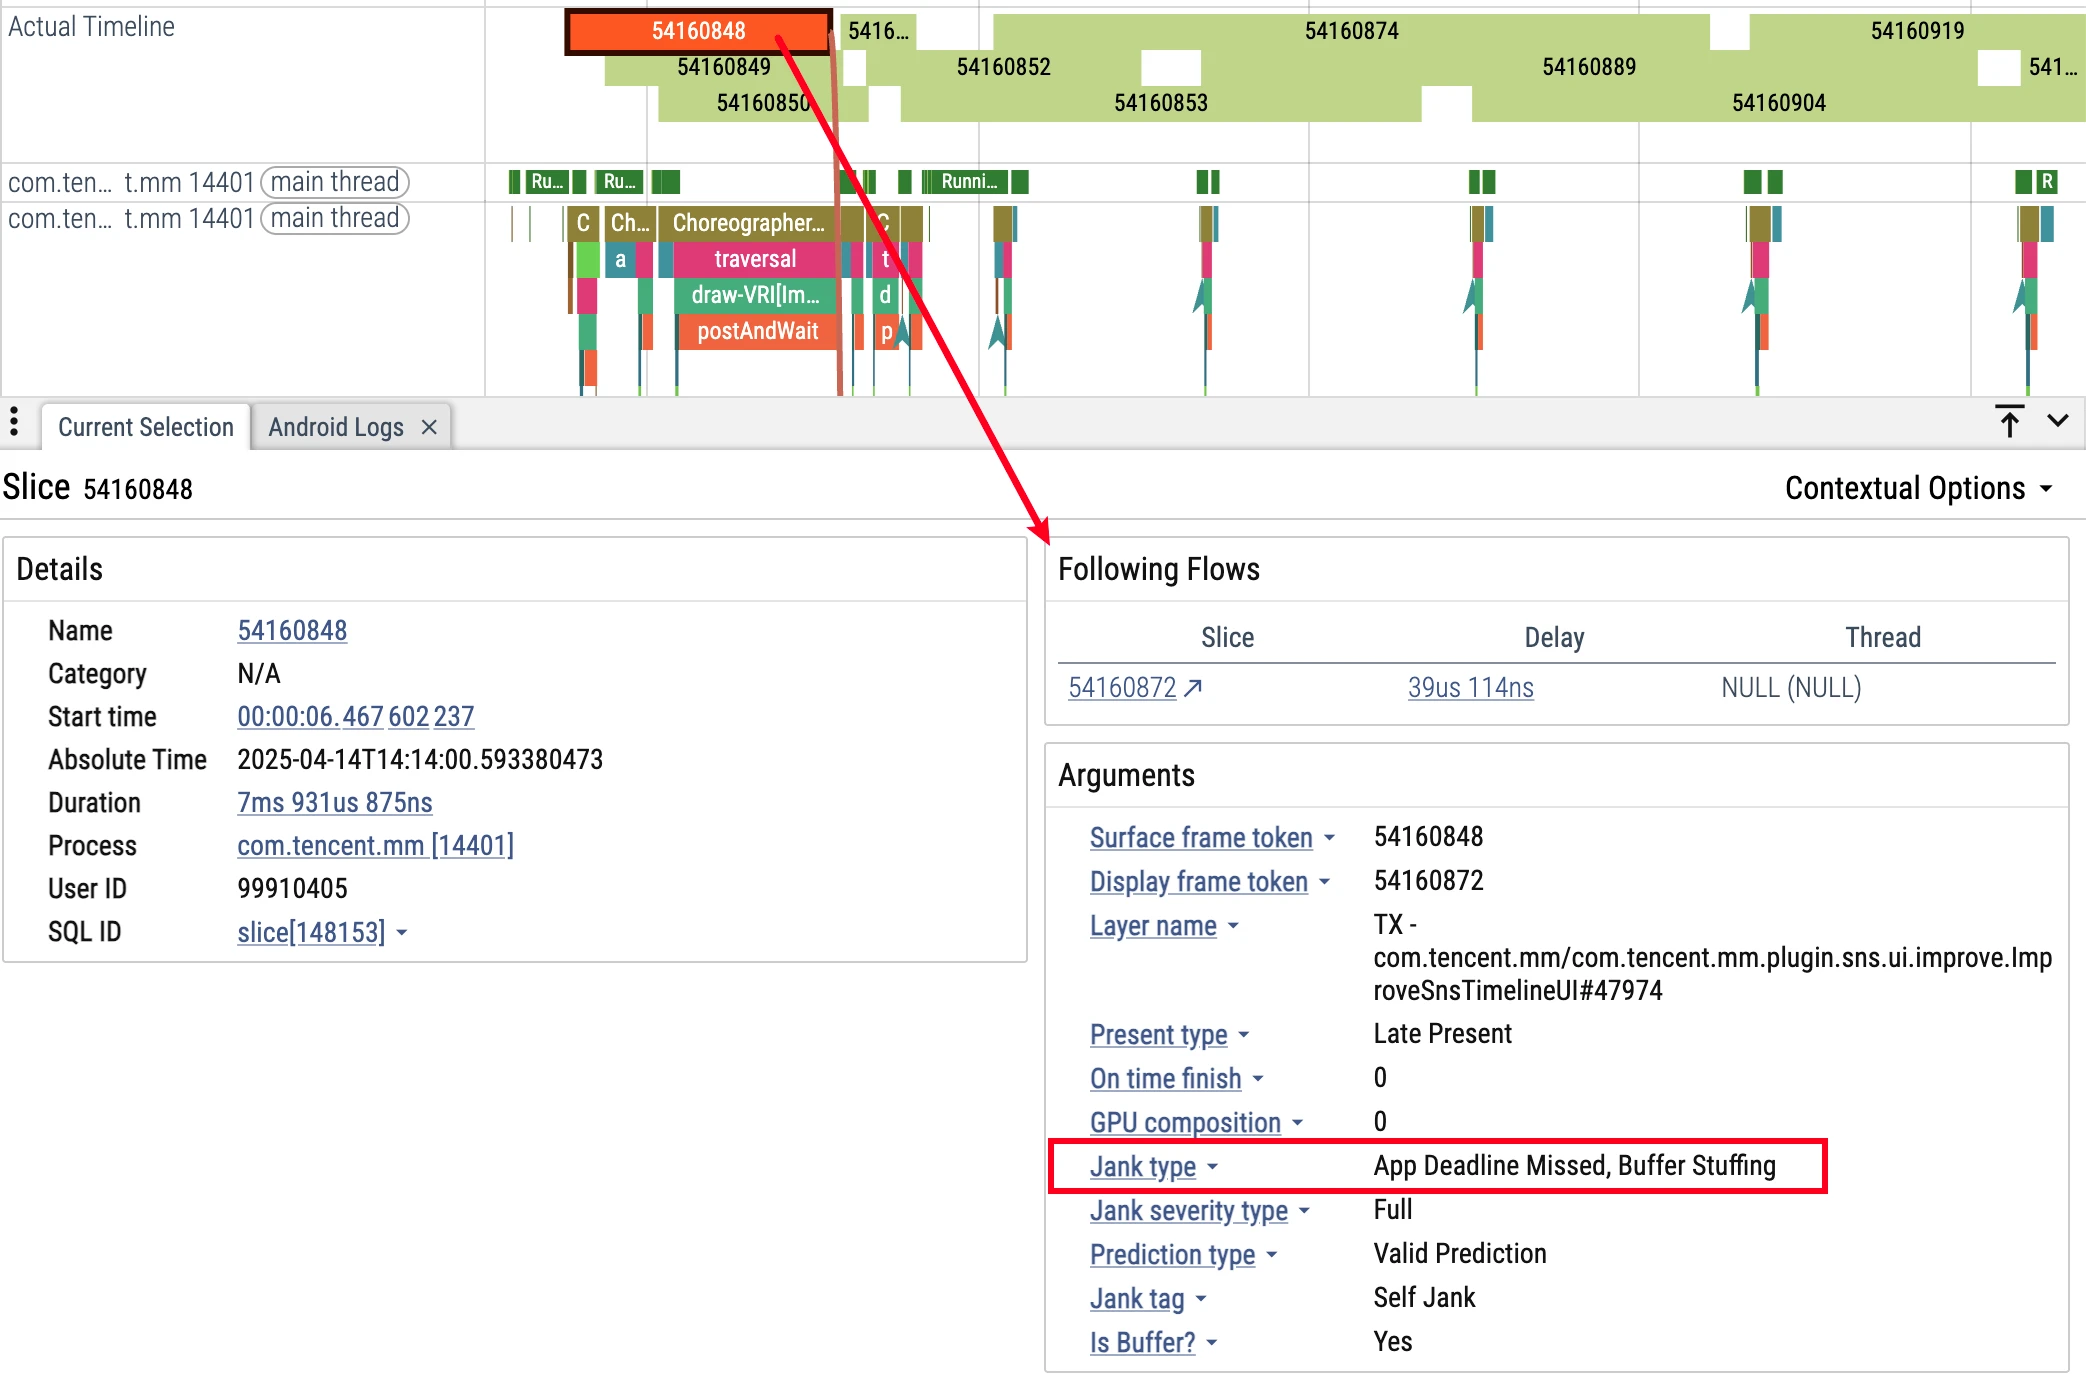
Jank Type Analysis
FrameTimeline can identify multiple jank types:
App-side jank:
- AppDeadlineMissed: App runtime exceeded expectations
- BufferStuffing: App sends new frame before previous frame presents, causing Buffer queue accumulation
SurfaceFlinger jank:
- SurfaceFlingerCpuDeadlineMissed: SurfaceFlinger main thread timeout
- SurfaceFlingerGpuDeadlineMissed: GPU composition time timeout
- DisplayHAL: HAL layer presentation delay
- PredictionError: Scheduler prediction deviation
Configuring FrameTimeline
Enable FrameTimeline in Perfetto configuration:
1 | data_sources { |
Vsync Signals in Perfetto
In this trace, VSYNC-app is displayed as a Counter, which differs from many people’s intuitive understanding:
- 0 → 1 change: Represents a Vsync signal
- 1 → 0 change: Also represents a Vsync signal
- Incorrect understanding: Many people mistakenly think only becoming 1 is a Vsync signal
Correct Vsync Signal Identification
In the diagram below, time points 1, 2, 3, 4 are all Vsync signal arrivals

Key points:
- Each value change in this screenshot corresponds to a recorded Vsync marker: Whether 0→1 or 1→0; this is not a universal encoding for all Vsync tracks
- Signal frequency: On 120Hz devices, there’s approximately one change every 8.33ms (actual may vary slightly due to system scheduling, referring to continuous frame output scenarios)
- Multi-app scenario: Counter may remain active due to other apps’ requests
Analysis Techniques
Determining if App received Vsync:
- Correct method: Check if there’s a corresponding
FrameDisplayEventReceiver.onVsyncevent in the App process - Incorrect method: Judging solely by
vsync-appcounter changes in SurfaceFlinger
References
- https://juejin.im/post/5a9e01c3f265da239d48ce32
- http://www.cocoachina.com/articles/35302
- https://juejin.im/post/5b7767fef265da43803bdc65
- http://gityuan.com/2019/06/15/flutter_ui_draw/
- https://developer.android.google.cn/guide/components/processes-and-threads
Attachments
The Perfetto trace files involved in this article have also been uploaded. You can download and open them in Perfetto UI (https://ui.perfetto.dev/) for analysis
Click this link to download the Perfetto trace files involved in this article
About Me && Blog
Below is a personal introduction and related links. I look forward to communicating with you all. When three people walk together, one of them can be my teacher!
- Blogger Personal Introduction: Contains personal WeChat and WeChat group links.
- Blog Content Navigation: A navigation of personal blog content.
- Excellent Blog Articles Collected and Organized by Individuals - Must-Know for Android Performance Optimization: Welcome everyone to recommend yourself and recommend (WeChat private chat is fine)
- Android Performance Optimization Knowledge Planet: Welcome to join, thanks for support~
One person can go faster, a group of people can go further