
This is the ninth article in the Perfetto series, focusing on CPU information analysis in Perfetto. Perfetto provides far superior data visualization and analysis capabilities compared to Systrace. Understanding CPU-related information is the foundation for locating performance bottlenecks and analyzing power consumption issues.
The goal of this series is to examine the overall operation of the Android system from a brand new graphical perspective through the Perfetto tool, while also providing a new way to learn the Framework. Perhaps you’ve read many source code analysis articles but always feel confused by the complex call chains or can’t remember specific execution flows. Through Perfetto, by visualizing these processes, you may gain a deeper and more intuitive understanding of the system.
Table of Contents
- Perfetto Series Articles
- CPU Information Overview in Perfetto
- Trace Config Required for Capturing CPU Information
- CPU Core Architecture: big.LITTLE
- CPU Scheduling
- CPU Frequency Deep Dive
- Linux Kernel Scheduling Strategy: Core Selection and Migration
- Practice and SQL
- Summary
Perfetto Series Articles
- Android Perfetto Series Catalog
- Android Perfetto Series 1: Introduction to Perfetto
- Android Perfetto Series 2: Capturing Perfetto Traces
- Android Perfetto Series 3: Familiarizing with Perfetto View
- Android Perfetto Series 4: Opening Large Traces via Command Line
- Android Perfetto Series 5: Android App Rendering Flow Based on Choreographer
- Android Perfetto Series 6: Why 120Hz? Advantages and Challenges of High Refresh Rates
- Android Perfetto Series 7: MainThread and RenderThread Deep Dive
- Android Perfetto Series 8: Understanding Vsync Mechanism and Performance Analysis
- Android Perfetto Series 9: CPU Information Interpretation
- Android Perfetto Series 10: Binder Scheduling and Lock Contention
- Android Perfetto Series 11: PerfettoSQL, Trace Processor and Regression Detection
- Android Perfetto Series 12: Trace Dataflow and Data Loss
- Android Perfetto Series 13: Perfetto SDK, Track Event and App Field Traces
- Android Perfetto Series 14: heapprofd and Memory Profiling
- Android Perfetto Series 15: Boot Traces and Long-running Field Tracing
- Android Perfetto Series 16: GPU, Power Counters and Hardware Bottlenecks
- Android Perfetto Series 17: Scenario Automation and Platform Tracing
- Android Perfetto Series 18: Input Response Latency
- Video (Bilibili) - Android Perfetto Basics and Case Sharing
- Video (Bilibili) - Android Perfetto: Trace Graph Types - AOSP, WebView, Flutter + OEM System Optimization
CPU Information Overview in Perfetto
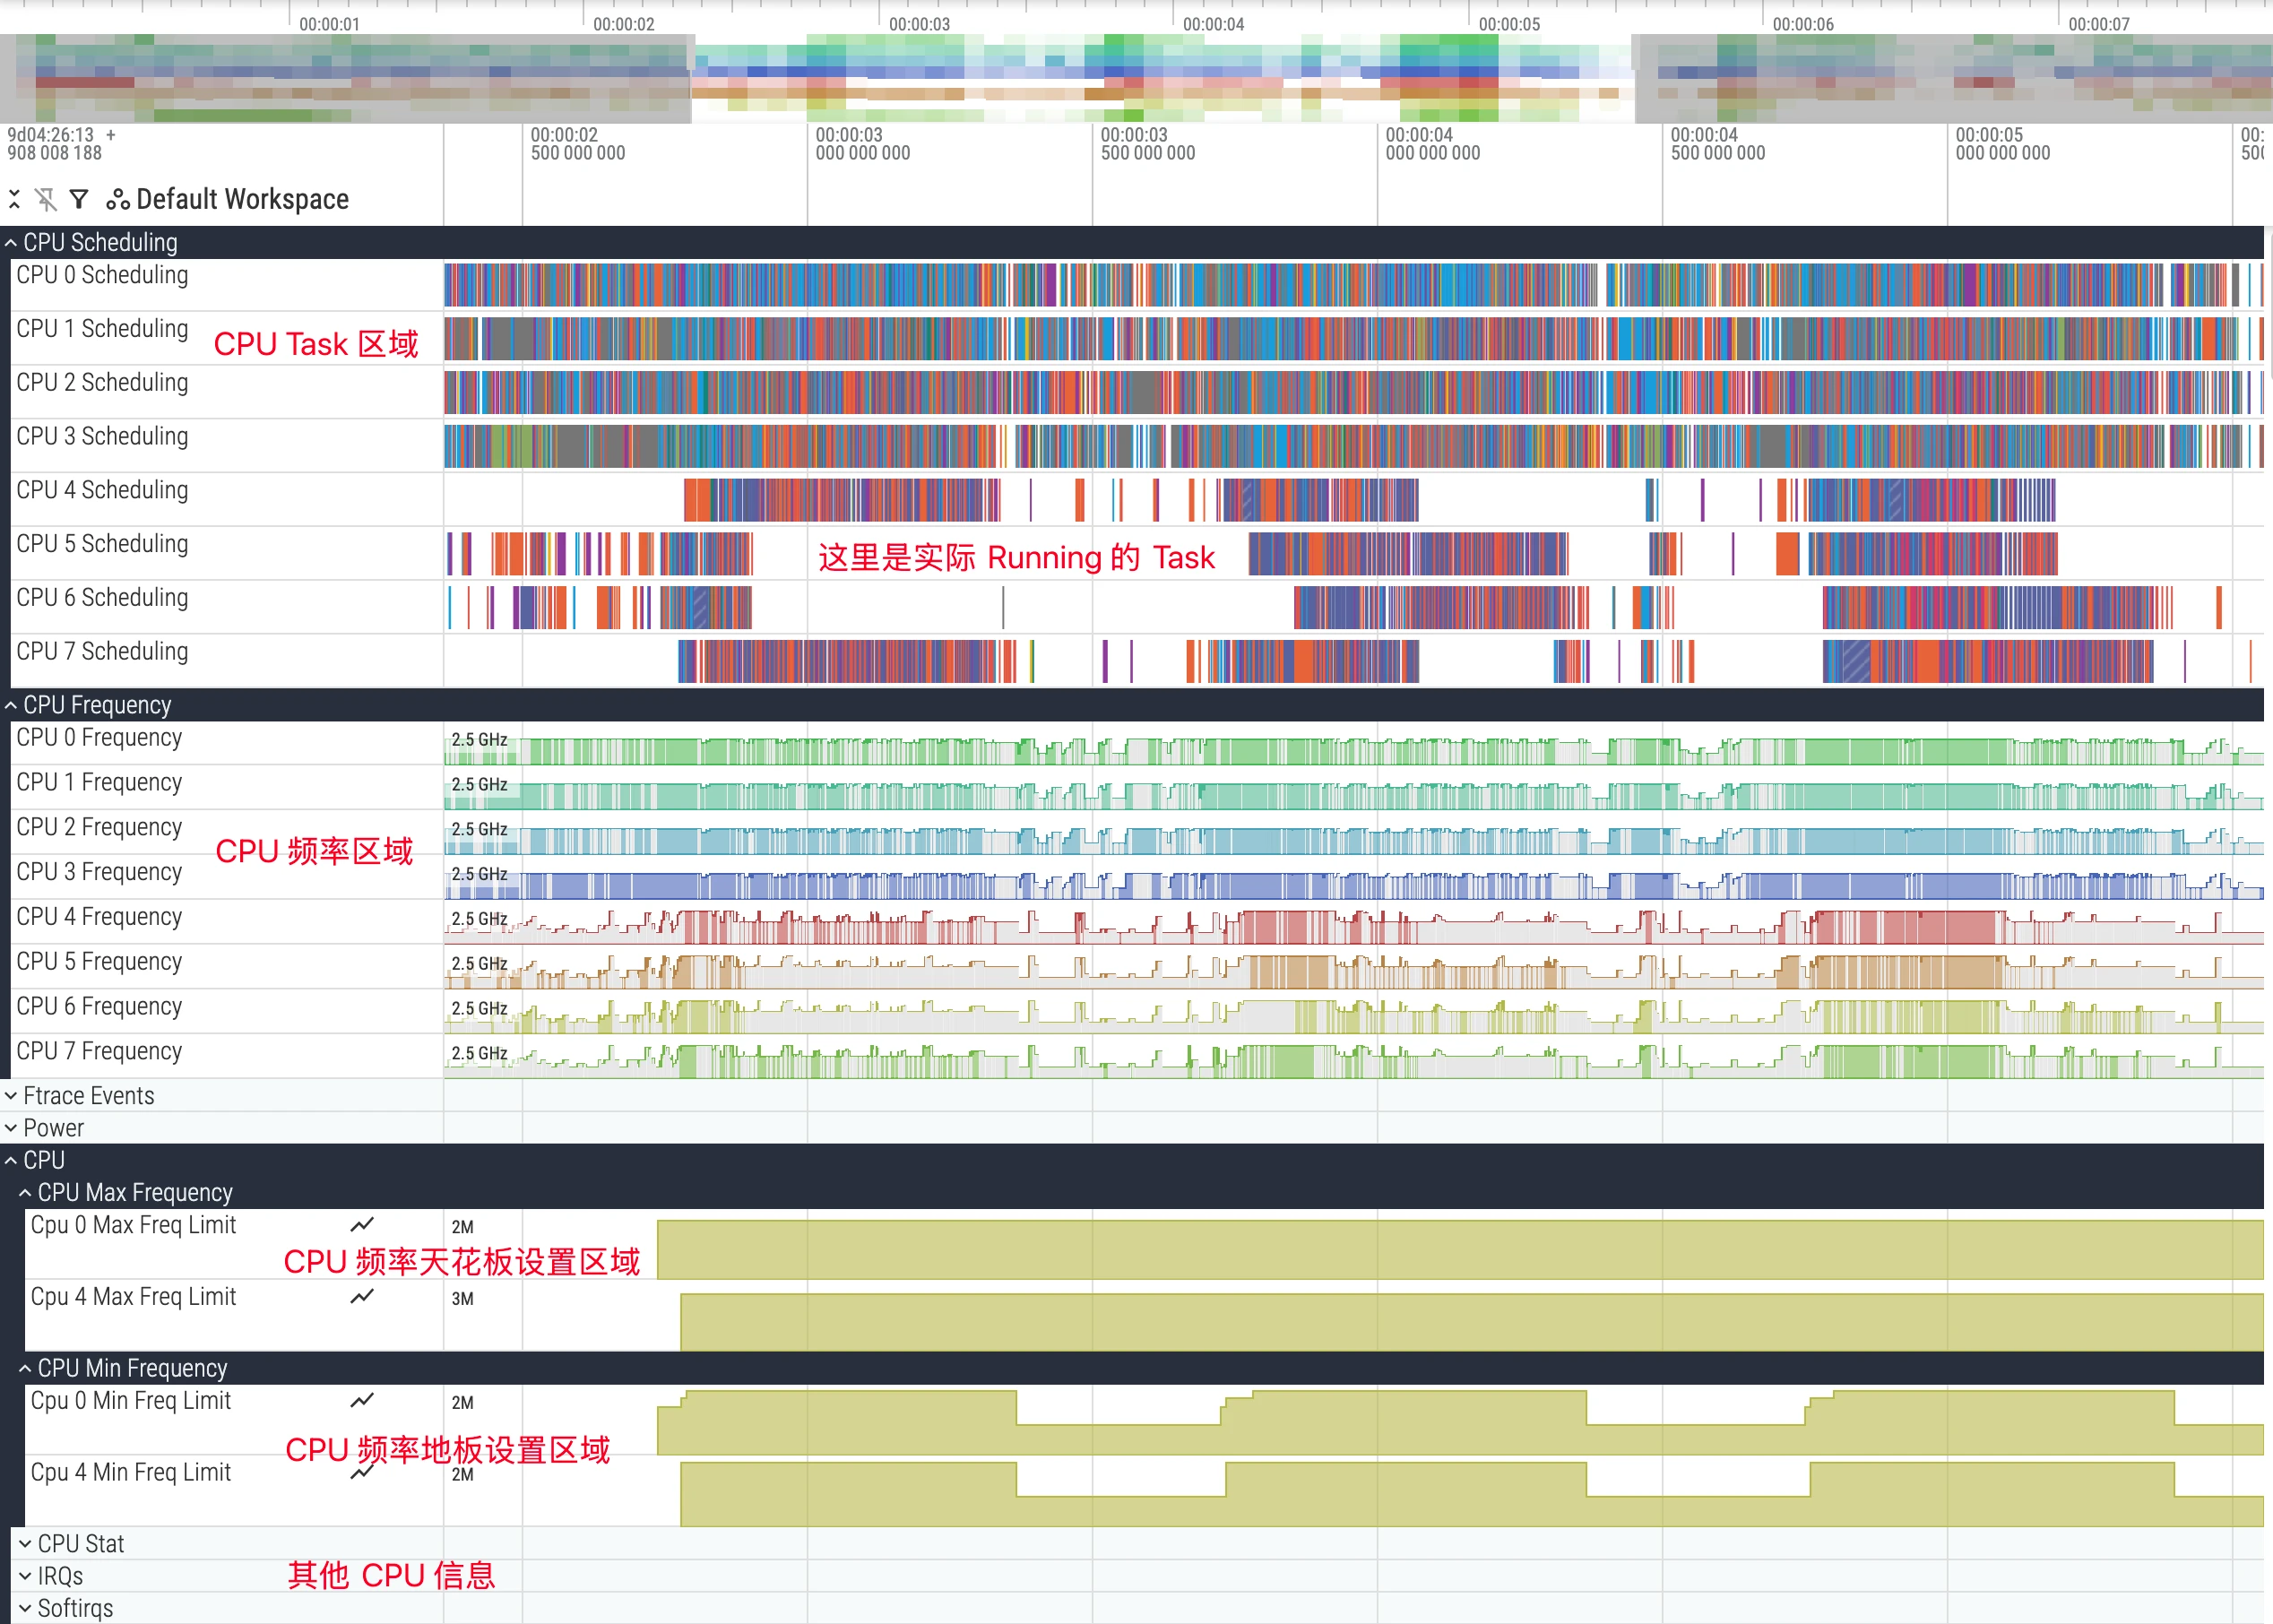
In the Perfetto UI, CPU-related information is usually grouped at the top and is the starting point for performance analysis. It mainly includes the following three core tracks:
- CPU Scheduling: Shows which thread is executing on each CPU core at each time point.
- CPU Frequency: Shows the frequency changes of each CPU core or core cluster.
- CPU Idle: Shows the low-power states (C-States) entered by each CPU core.
By analyzing CPU-related information, you can answer the following key performance questions or perform competitive analysis:
- Why isn’t the application main thread executing? Is it being preempted by other threads?
- What’s the reason for a task executing slowly? Was it scheduled to a low-performance core?
- In specific scenarios, is the CPU frequency limited?
- When the application is in the background, does the CPU effectively enter deep sleep state?
Trace Config Required for Capturing CPU Information
To collect all CPU data needed for analysis in this article, you need a correct TraceConfig. Incorrect configuration will cause certain tracks (such as CPU frequency) or certain kernel events (such as wakeup events) to be missing. Below is the Perfetto official documentation’s recommended configuration for general CPU analysis. You can add it to your Perfetto Config and use it when capturing traces.
1 | data_sources { |
This configuration enables key ftrace events including sched (scheduling), power (frequency and idle), and task (task lifecycle), which are the foundation for deep CPU analysis.
CPU Core Architecture: big.LITTLE
Before diving into analysis, you must understand the CPU core architecture of modern mobile SoCs. Currently, mainstream mobile processors generally adopt the big.LITTLE heterogeneous multi-core architecture, or its variants, such as big.Medium.LITTLE (big-medium-small cores).
- LITTLE cores: Designed for low power consumption, with lower frequencies, used for background tasks and lightweight computing to ensure battery life.
- Big cores: Designed for high performance, with higher frequencies and greater power consumption, used for user interaction, gaming, app launches, and other heavy load scenarios.
- Prime Core: Some flagship chips have an extremely high-frequency prime core for the most demanding single-core performance challenges.
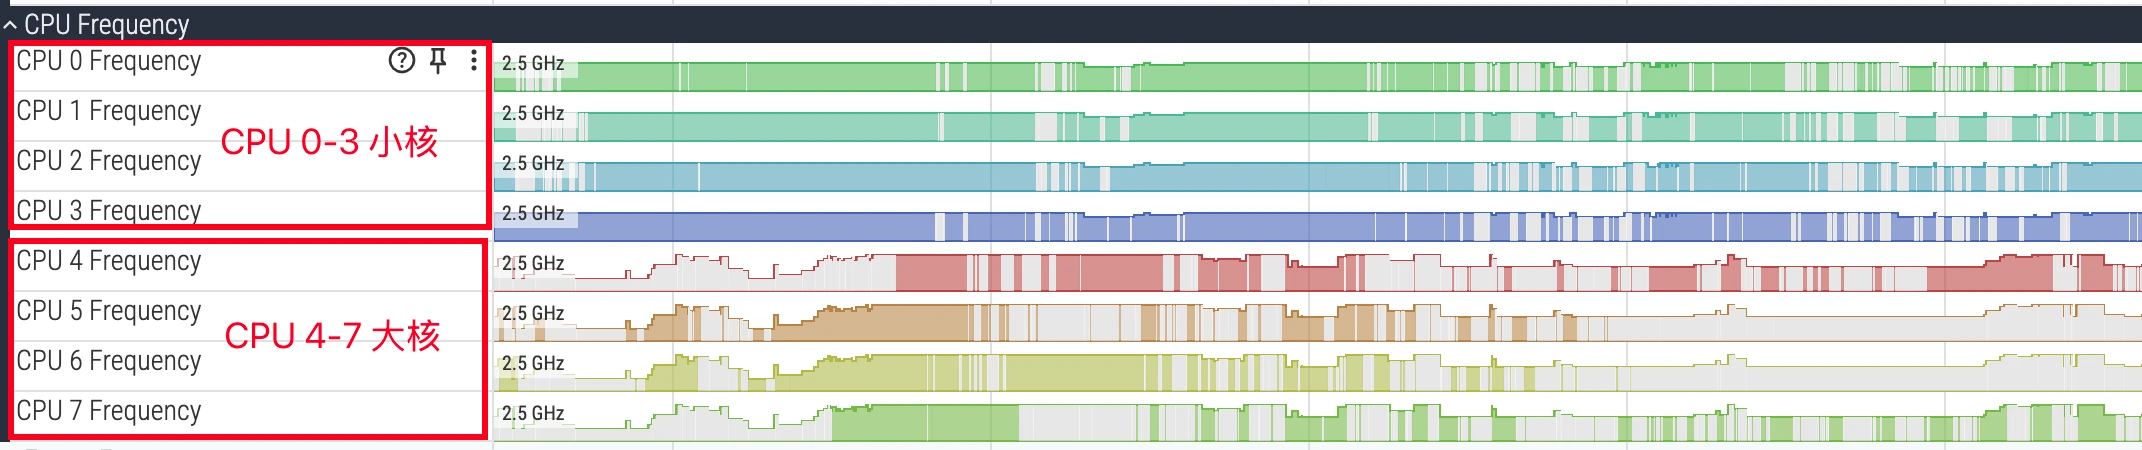
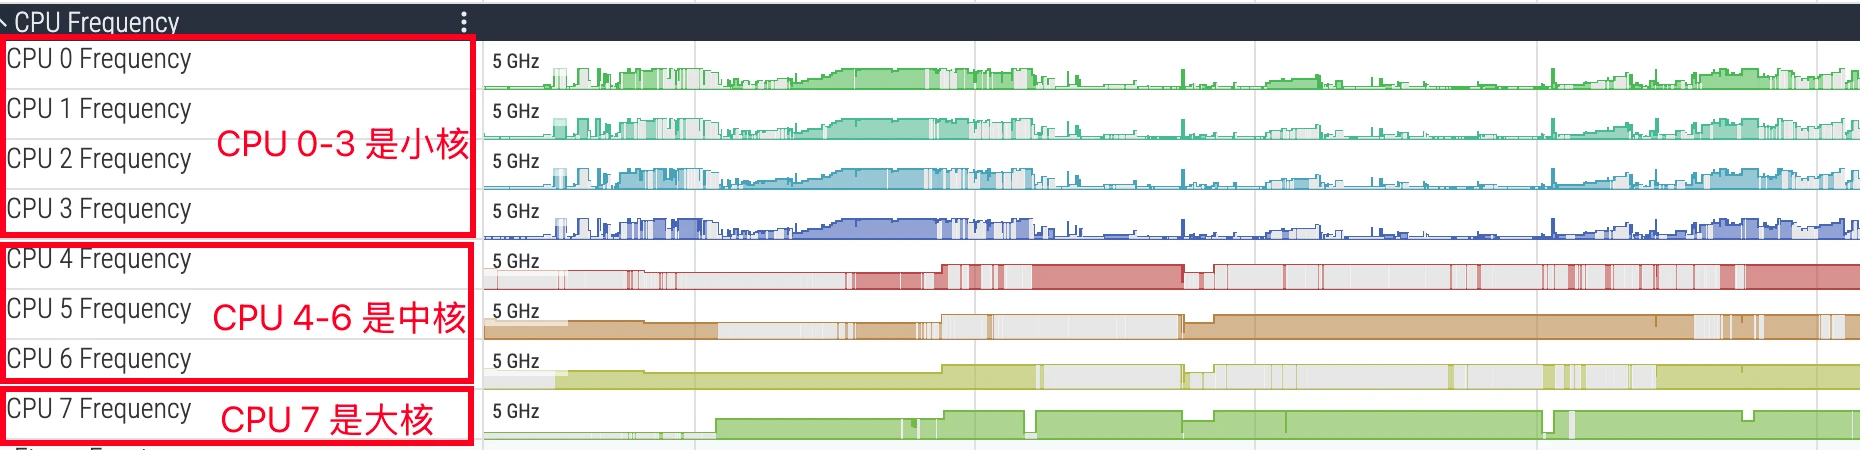
In Perfetto’s CPU tracks, cores are usually numbered starting from 0. For example, in a typical octa-core processor, CPU 0-3 might be LITTLE cores, CPU 4-6 big cores, and CPU 7 the prime core. Identifying core types is crucial for performance analysis: if a compute-intensive task runs on a LITTLE core for an extended period, its execution time will far exceed expectations. During analysis, you need to match the thread’s running core with its task attributes to judge whether the scheduler’s behavior meets expectations.
Below is a typical 4+4 CPU:
Below is a typical 4+3+1 CPU (MTK Dimensity 9500, 9400, and Qualcomm Snapdragon high-end series):
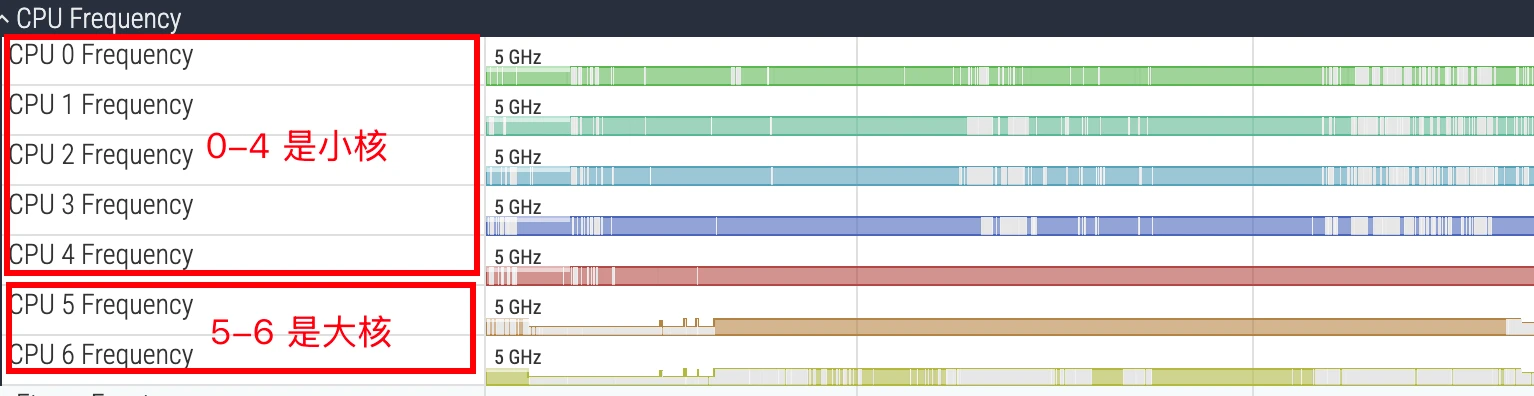
Below is a 5+2 CPU (Qualcomm 8Elite 1 lite version; the standard 8Elite 1 has cores 0-5 as LITTLE cores and 6-7 as big cores, so I won’t include that image here):
Generally, you can find out the big-medium-small core architecture by checking the CPU spec, or by cat-ing the corresponding CPU nodes. I won’t elaborate further here.
CPU Scheduling
The CPU Scheduling track is the most commonly used and most important part. It visualizes the decision-making process of the Linux kernel scheduler. Its data source is the sched/sched_switch event in kernel ftrace.
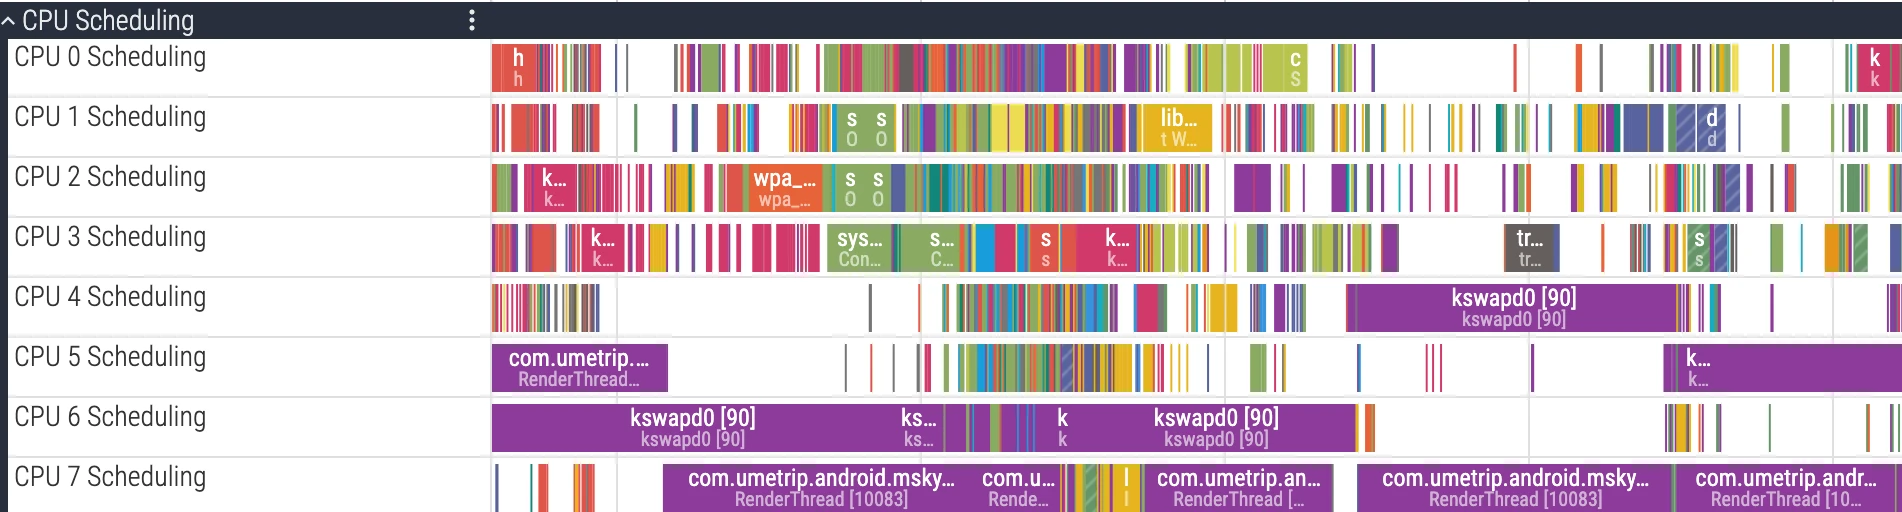
Each CPU core corresponds to an independent track row. Different colored blocks on the track represent specific threads running on that CPU core during that time slice.
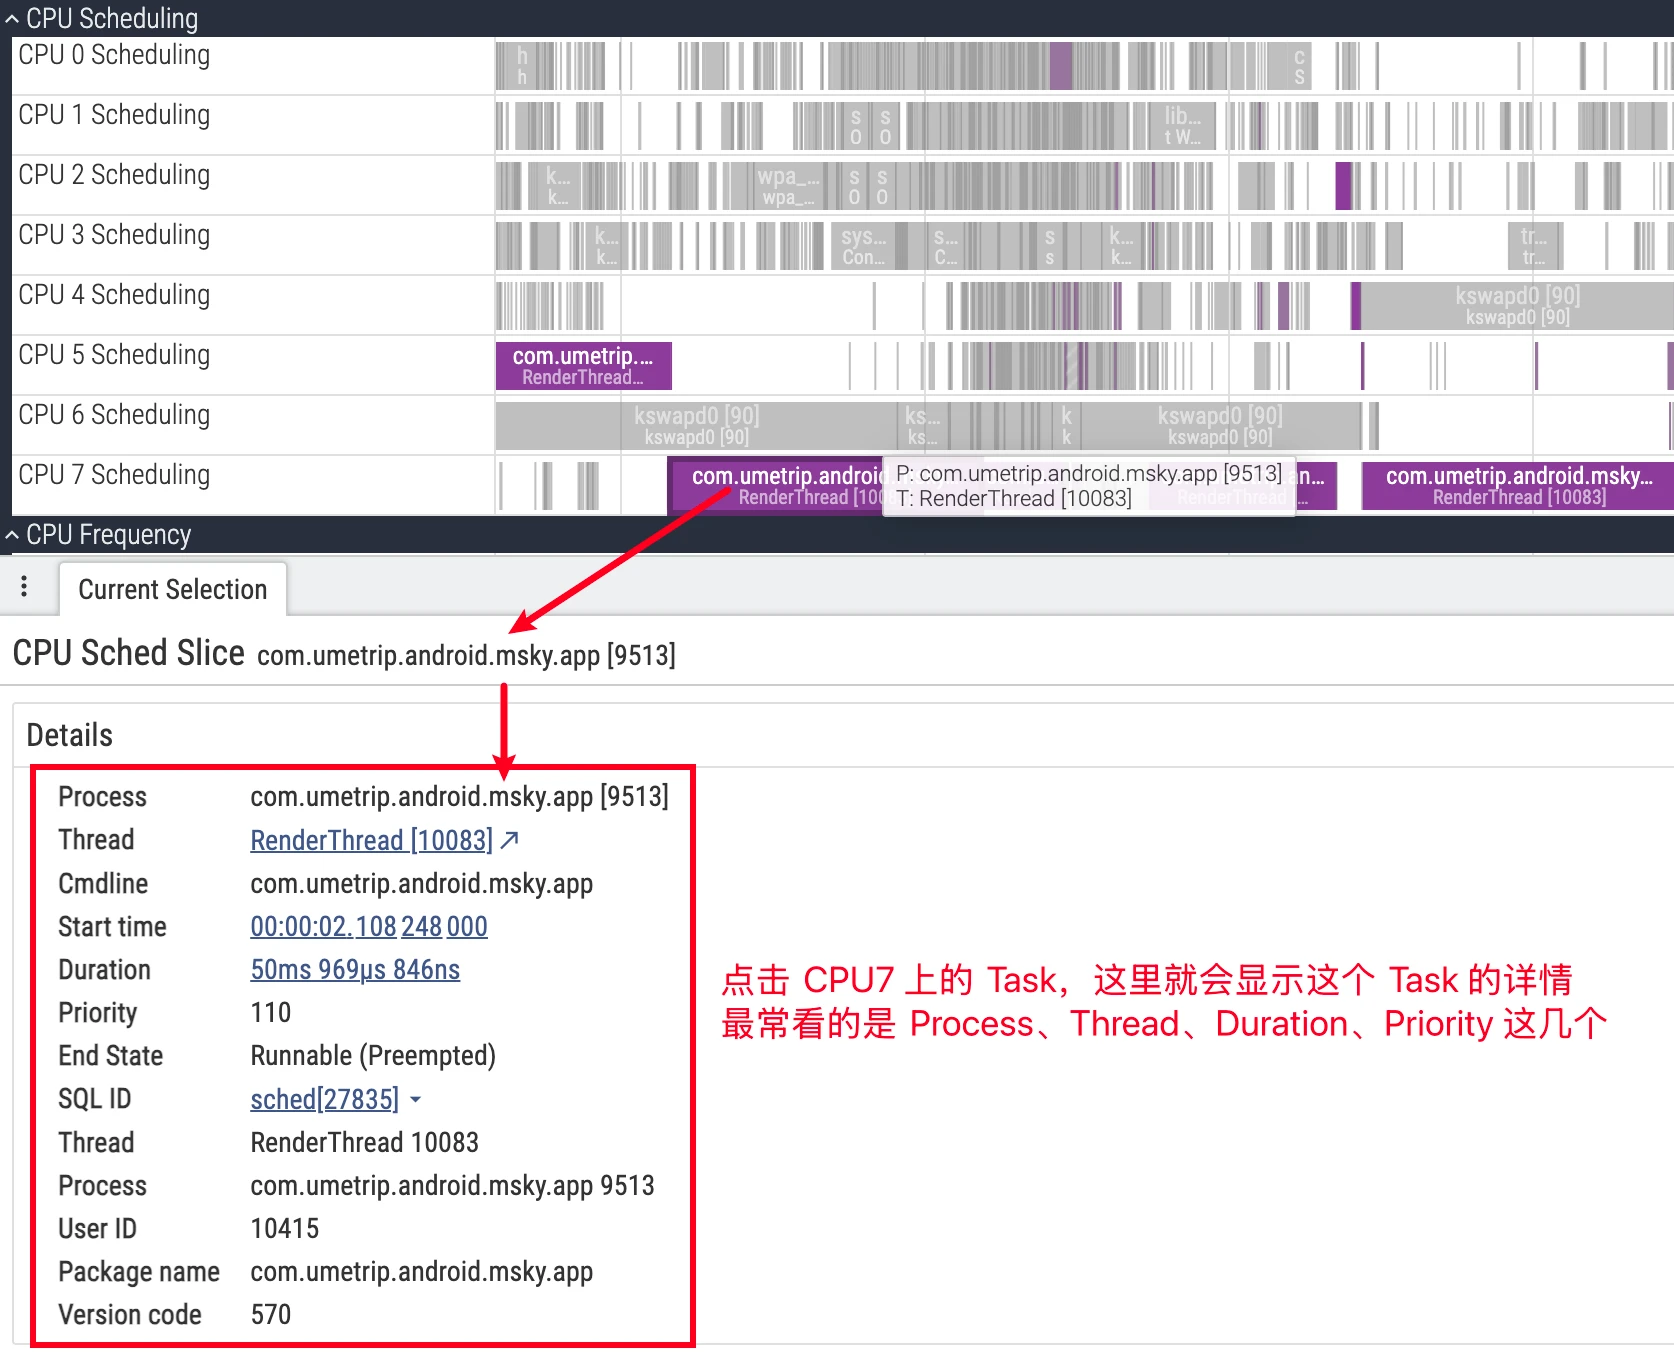
- UI details: Clicking a CPU slice, the details panel will show the
cpu,end_state,priority, associatedprocess/thread, etc. for that scheduling; expanding the process downward also shows each thread’s independent track, facilitating tracking of a single thread’s state evolution (refer to official documentation).
Thread State Deep Dive
Understanding Linux thread states is a prerequisite for performance optimization. In Perfetto, selecting a thread, the Current State panel below will show its current state. This state information comes from Perfetto’s parsed thread_state/thread_state_slice tables.
Running (Green)
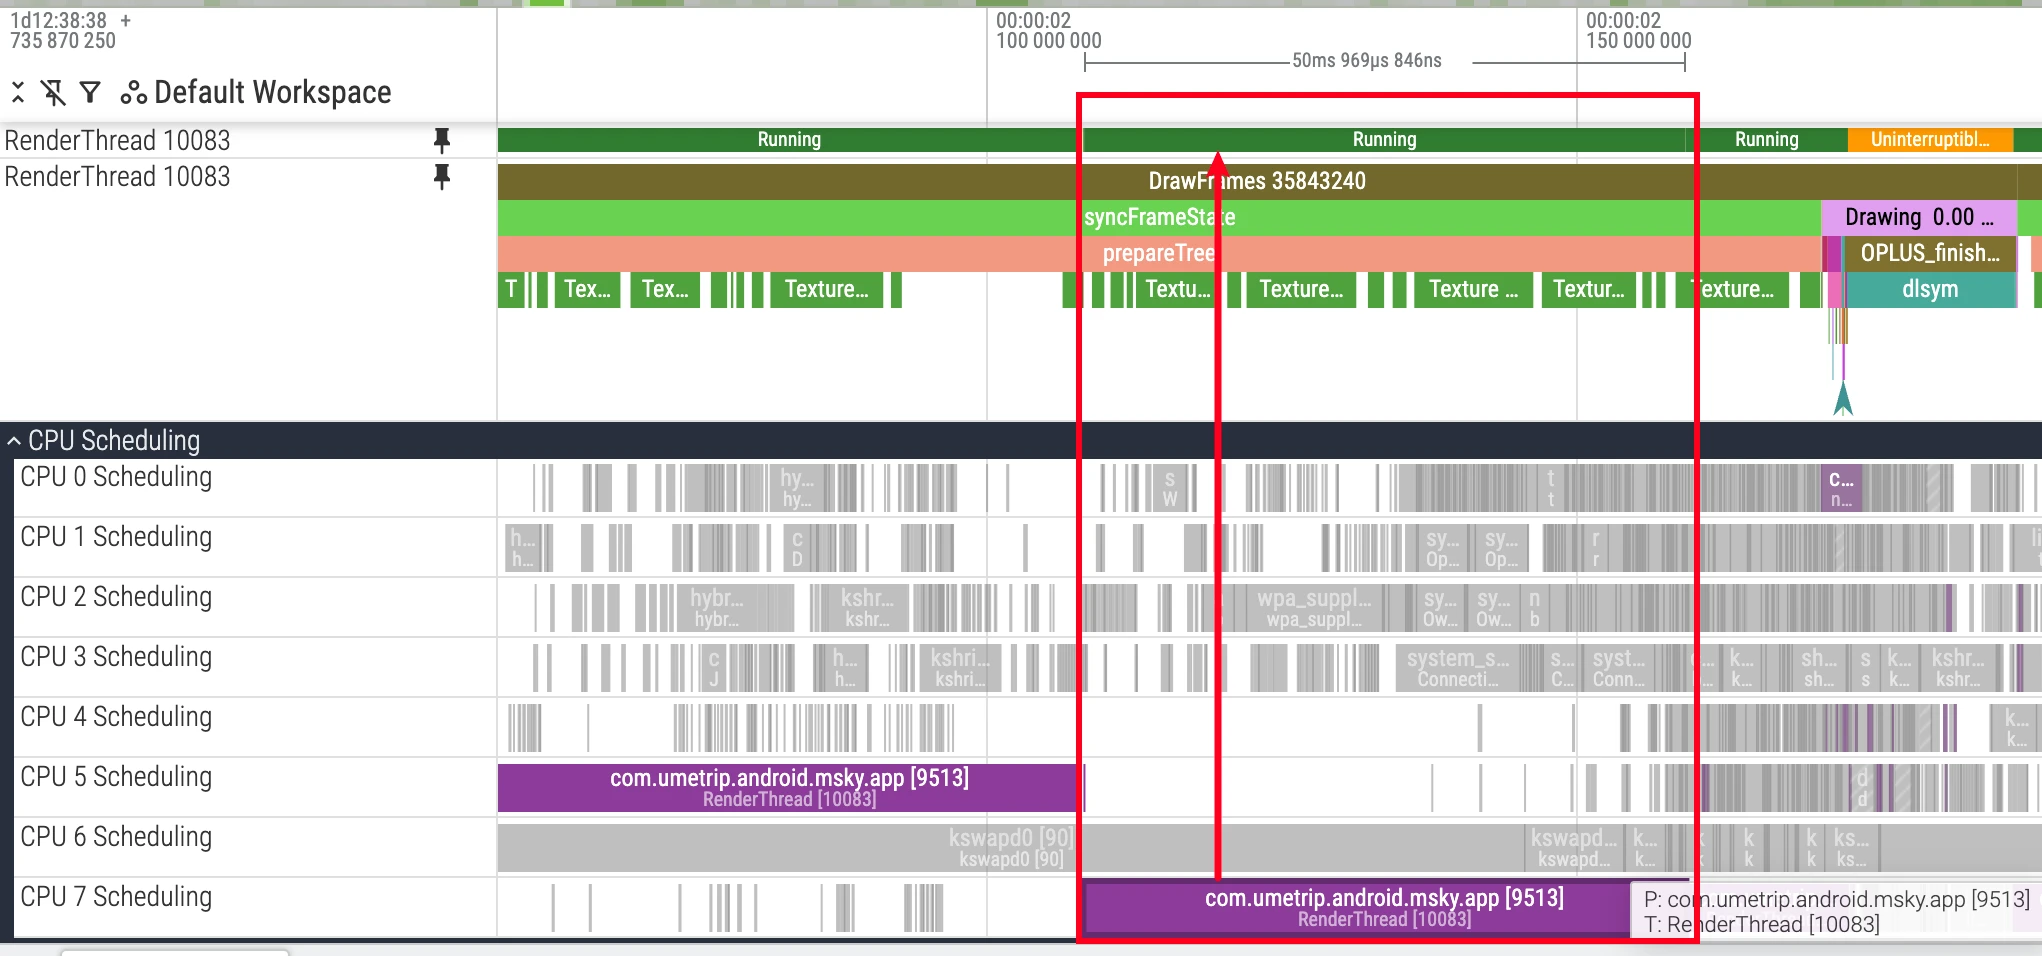
State Definition: Green represents the thread is executing code on the CPU. This is the only state truly consuming CPU resources for computation.
Analysis Points:
- Execution Duration: A long
Runninginterval shows CPU occupancy, which may come from computation, a system call, or busy waiting. Use profiling or trace markers to identify the actual work. - Running Core: Analyze in combination with the CPU’s core architecture (e.g., big.LITTLE). Whether a compute-intensive task is scheduled to the expected performance core (big core) is an important basis for evaluating whether the scheduling strategy is reasonable.
- Running Frequency: The thread’s actual execution speed is also affected by CPU frequency. Even if the thread runs on a big core, if frequency is reduced due to thermal throttling or other reasons, its performance will decline. Therefore, comprehensive analysis is needed in combination with the
CPU Frequencytrack.
R (Runnable)
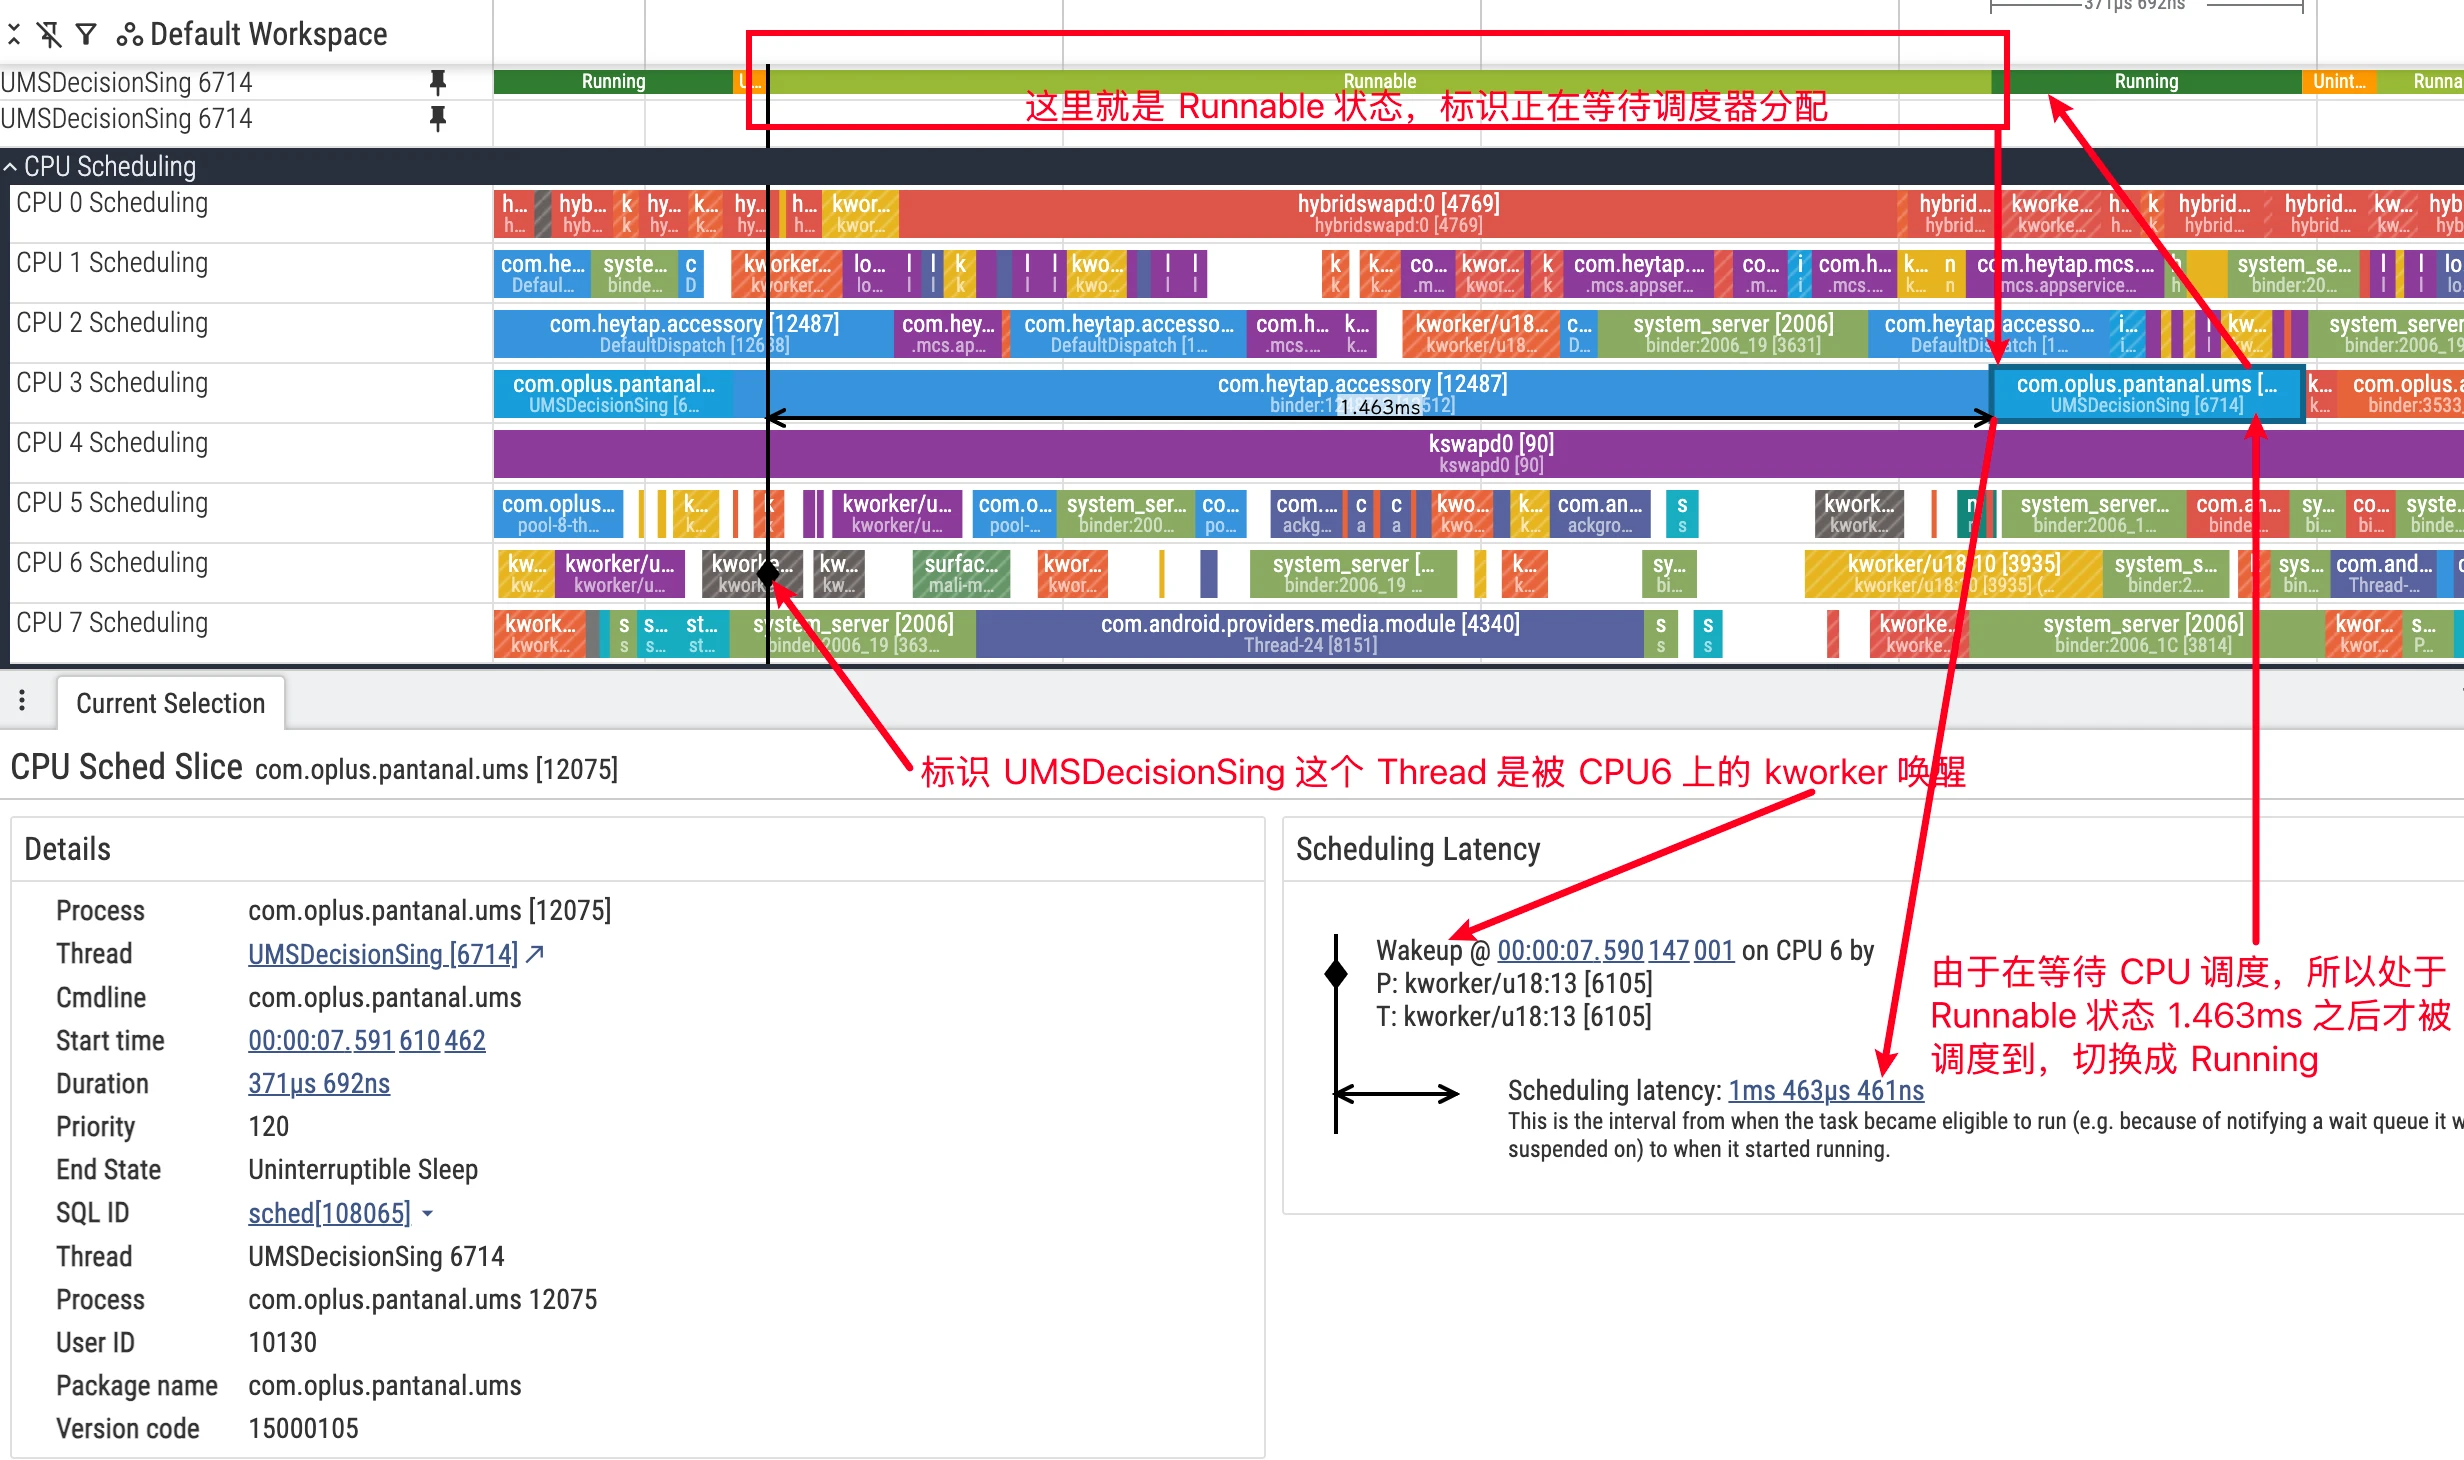
State Definition: The thread has all conditions for running and is waiting for the scheduler to assign a CPU core. In Perfetto’s thread private track, the Runnable state is usually displayed as light green or white bars.
Analysis Points:
Runnableand Jank: A longRunnableinterval means the thread was eligible to run but had not received CPU time. Compare it with the target frame deadline before attributing visible jank to this delay.
Three Types of Runnable:
Careful observation reveals that the “predecessor” of threads entering Runnable state varies. Based on the kernel’s scheduling timing, we can divide it into three situations:
Wake-up from Sleep: This is the most common type. The thread is awakened from
SorDstate because the resource it was waiting for (such as lock, I/O, Binder reply) is ready, entersRunnablestate, waiting to be selected by the scheduler for execution.Still Runnable After Descheduling: A running thread can be switched out while remaining runnable.
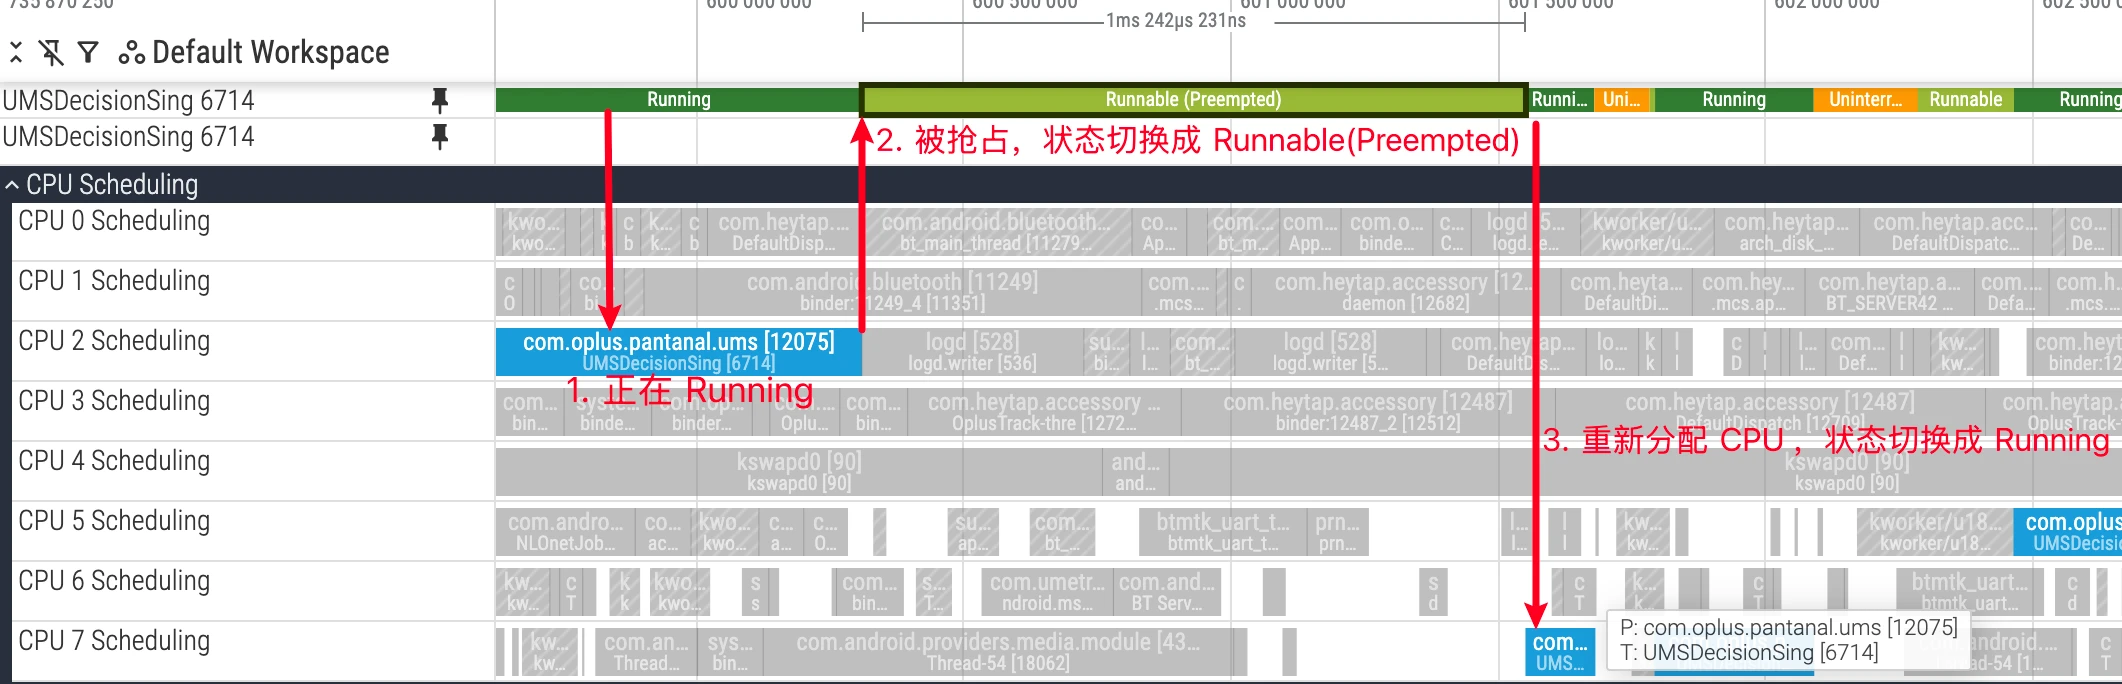
sched_switchmay recordprev_state=R; that field alone does not establish the precise scheduling cause or whether the thread was in user mode.Preempted While Runnable:
prev_state=R+is shown asRunnable (Preempted). It does not prove the thread was executing kernel-mode code or identify the thread that preempted it.
To investigate repeated Runnable (Preempted) periods, compare the next thread on the same CPU, priorities, and system load. Do not infer kernel-mode preemption or change thread priorities from R+ alone.
S (Sleep / Interruptible Sleep)
State Definition: The thread enters sleep while waiting for an event and can be interrupted by signals. This is the most common sleep state and is usually benign because it doesn’t consume CPU resources while waiting.
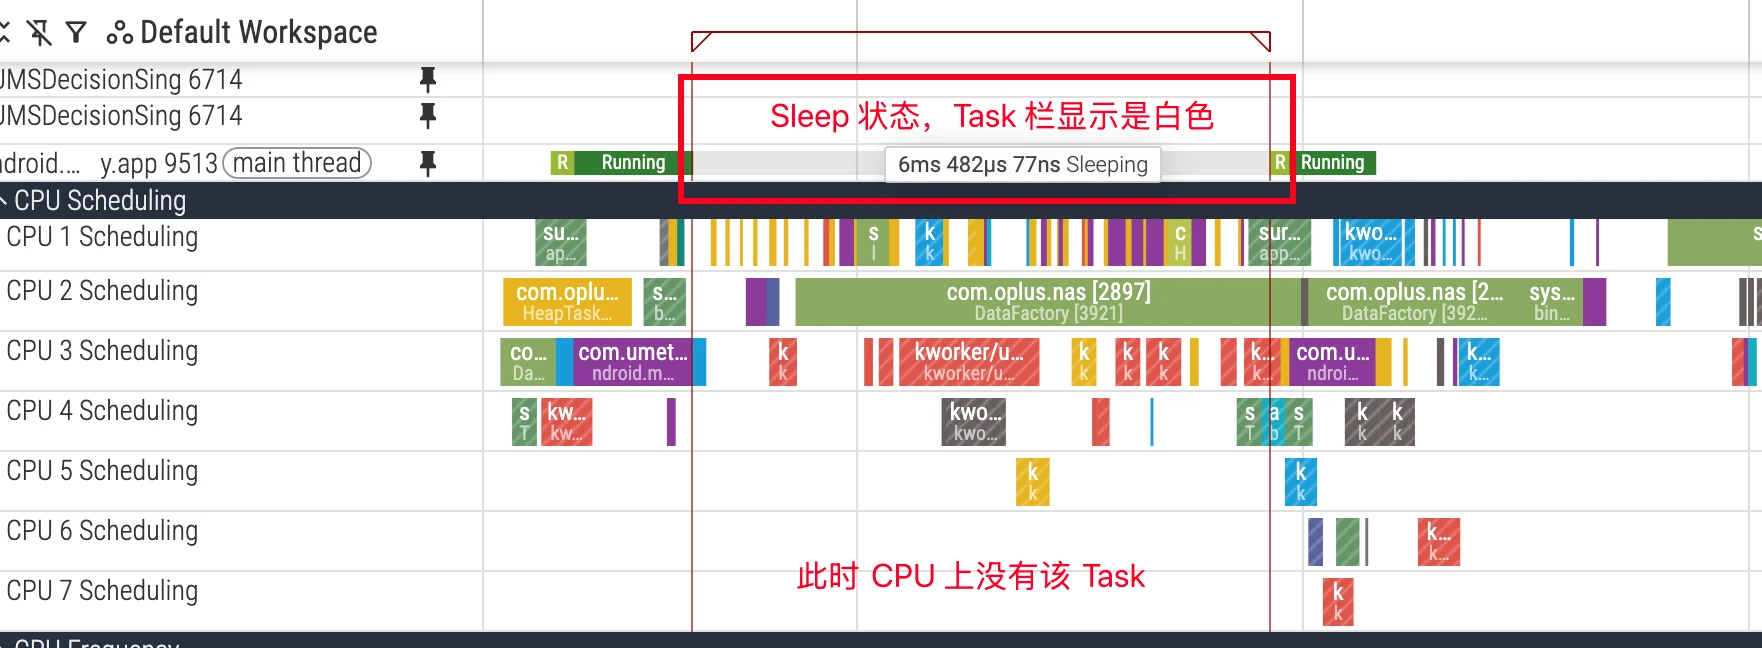
Analysis Points:
- Waiting Resources: If critical threads (such as UI thread) sleep for too long, it will also cause performance issues. Common waiting reasons include:
- Lock Contention: Waiting to acquire a
mutex(Java lock or native futex). - Binder Communication: Waiting for another process to return results through Binder call.
- I/O Operations: Waiting for network socket data (
epoll_wait). - Explicit Sleep: Code called
Thread.sleep()orObject.wait().
- Lock Contention: Waiting to acquire a
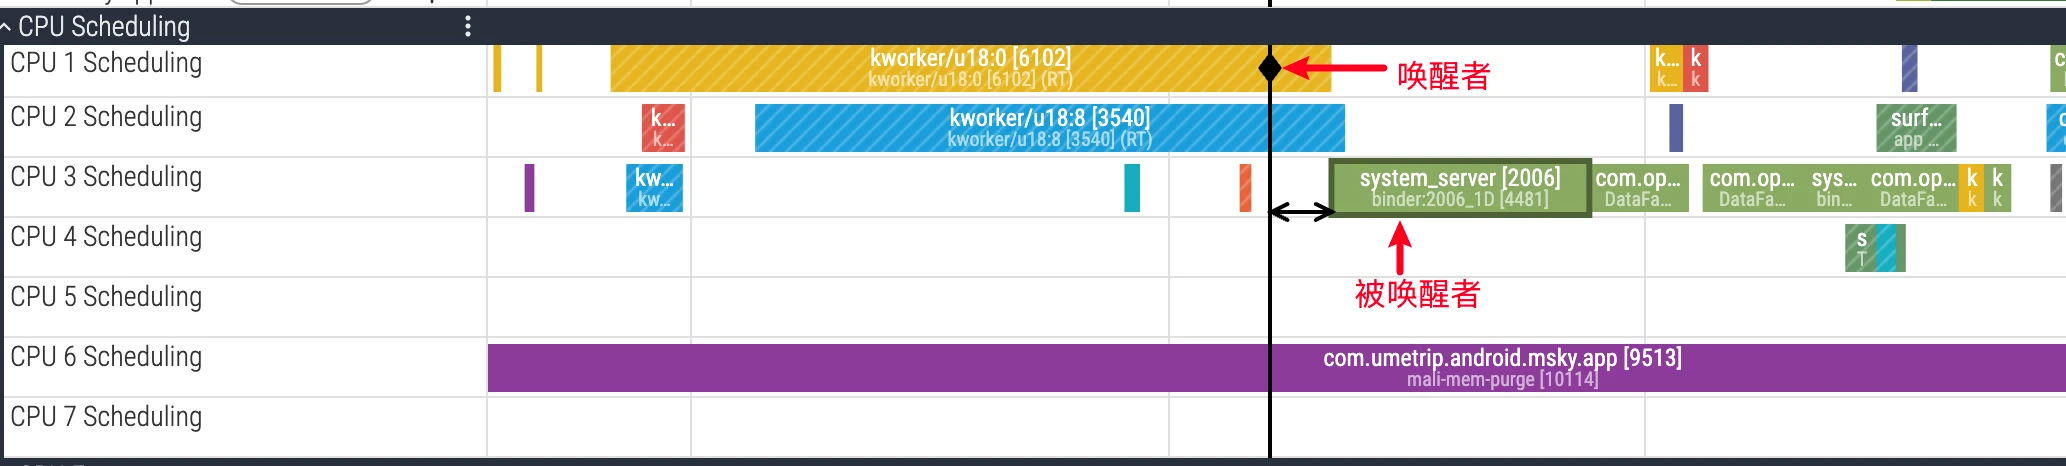
- Dependency Analysis: In Perfetto, selecting a Task that is Running in the CPU area will show UI indicating which Task on which CPU woke it up. This helps quickly locate inter-thread dependencies. Combined with function call stacks, you can further locate the specific code causing sleep.
D (Uninterruptible Sleep)
State Definition: D means uninterruptible sleep in a kernel wait path. It can involve I/O, but is not limited to hardware I/O; use the state field and blocked-function evidence rather than track color alone.
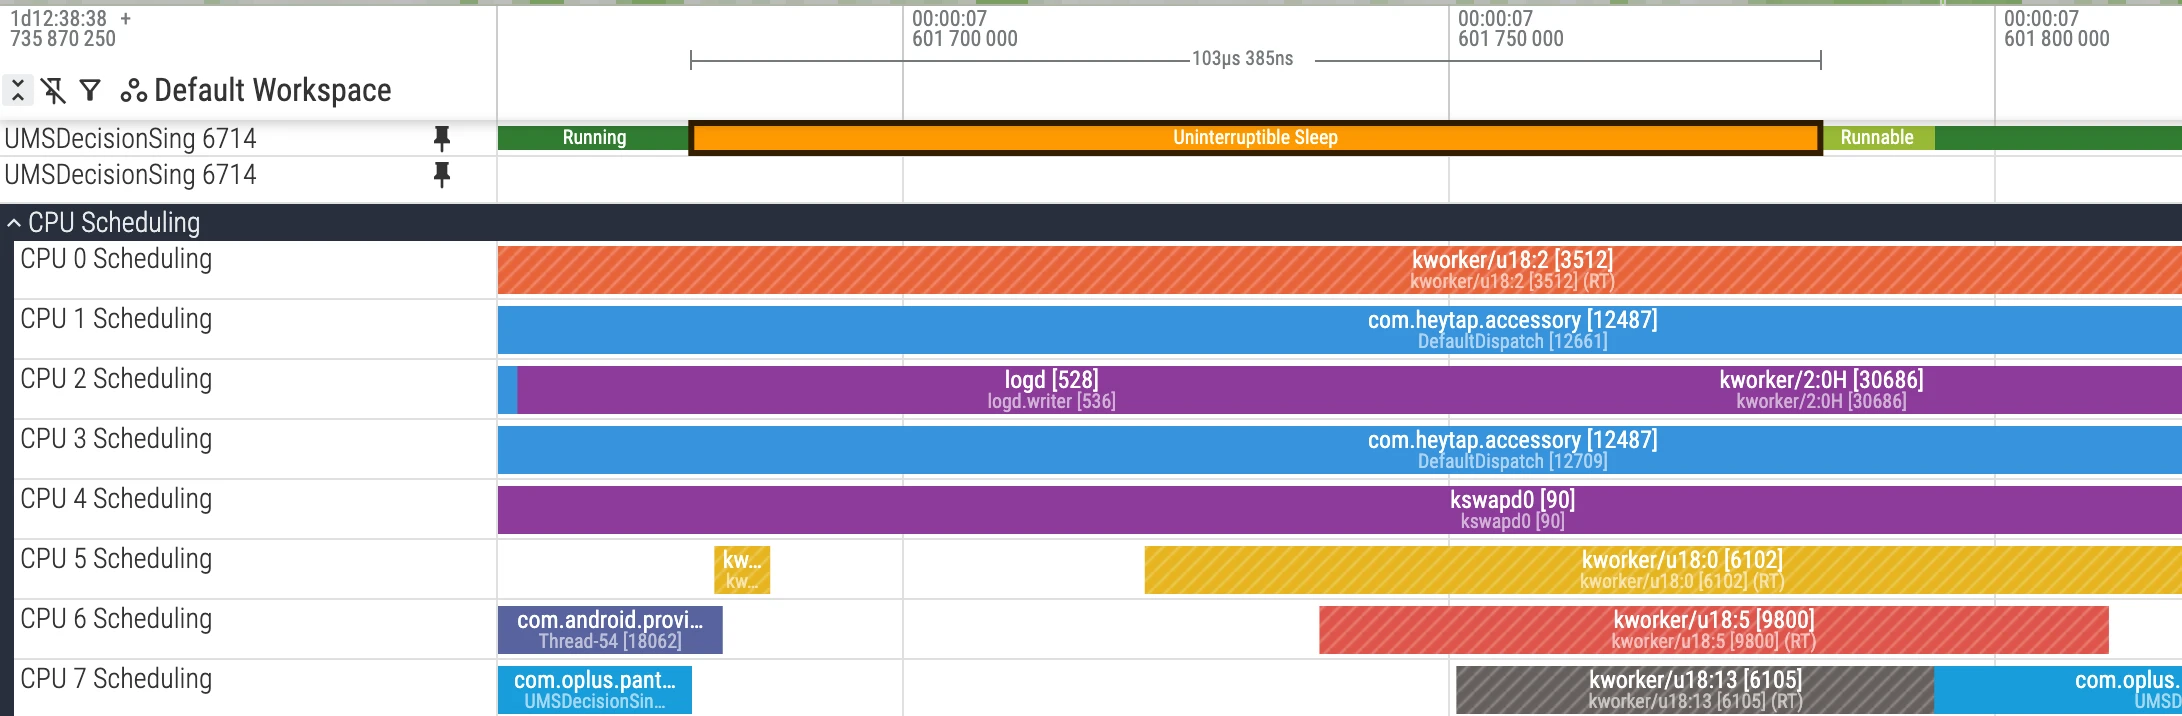
Analysis Points:
- Serious Performance Bottleneck: Long periods in
Dstate mean the thread is completely blocked and cannot respond to any events. If it occurs on the UI thread, it easily leads to ANR. - Common Causes:
- Disk I/O: Frequent or single large file read/write operations.
- Memory Pressure: Reclaim or paging may extend a kernel wait; check the events before attributing it to storage I/O.
- Kernel Driver Issues: Implementation defects in some kernel drivers may also cause threads to fall into
Dstate.
- Investigation Direction: An
io_waitflag is a useful clue, not proof of a particular file or device. Checkblocked_function, I/O events, and the target thread’s call stack.
Wakeup Relationship Analysis
Inter-thread dependencies are a difficult point in performance analysis. For a thread sleeping for a long time, the key is finding out “who it’s waiting for”. Perfetto provides powerful wakeup relationship visualization functionality.
- UI Operation: In Perfetto’s CPU area, left-click to select a thread Task in
Runningstate. Perfetto will automatically draw a dependency arrow from “waker” to “wakee” and highlight the thread slice where the wakeup source is located. - Underlying Principle: This functionality depends on the kernel’s
sched_wakeupftrace event. When thread T1 releases a resource (such as unlocking, completing Binder call), and thread T2 is waiting for that resource, the kernel marks T2 asRunnablestate and records this T1 -> T2 wakeup event. Perfetto parses these events to build the dependency chain between threads.
A wakeup arrow shows when one thread made another runnable. A Binder transaction or lock-owner chain requires the corresponding Binder, contention, or call-stack evidence; one wakeup arrow cannot reconstruct the full dependency chain.
Scheduling Wakeup and Latency Analysis
When thread A suspends on wait(), it enters S (Sleeping) and is removed from the CPU run queue. After thread B calls notify(), the kernel converts thread A to R (Runnable). At this time thread A is “eligible” to be put back into some CPU’s run queue, but this doesn’t mean “immediate” running.
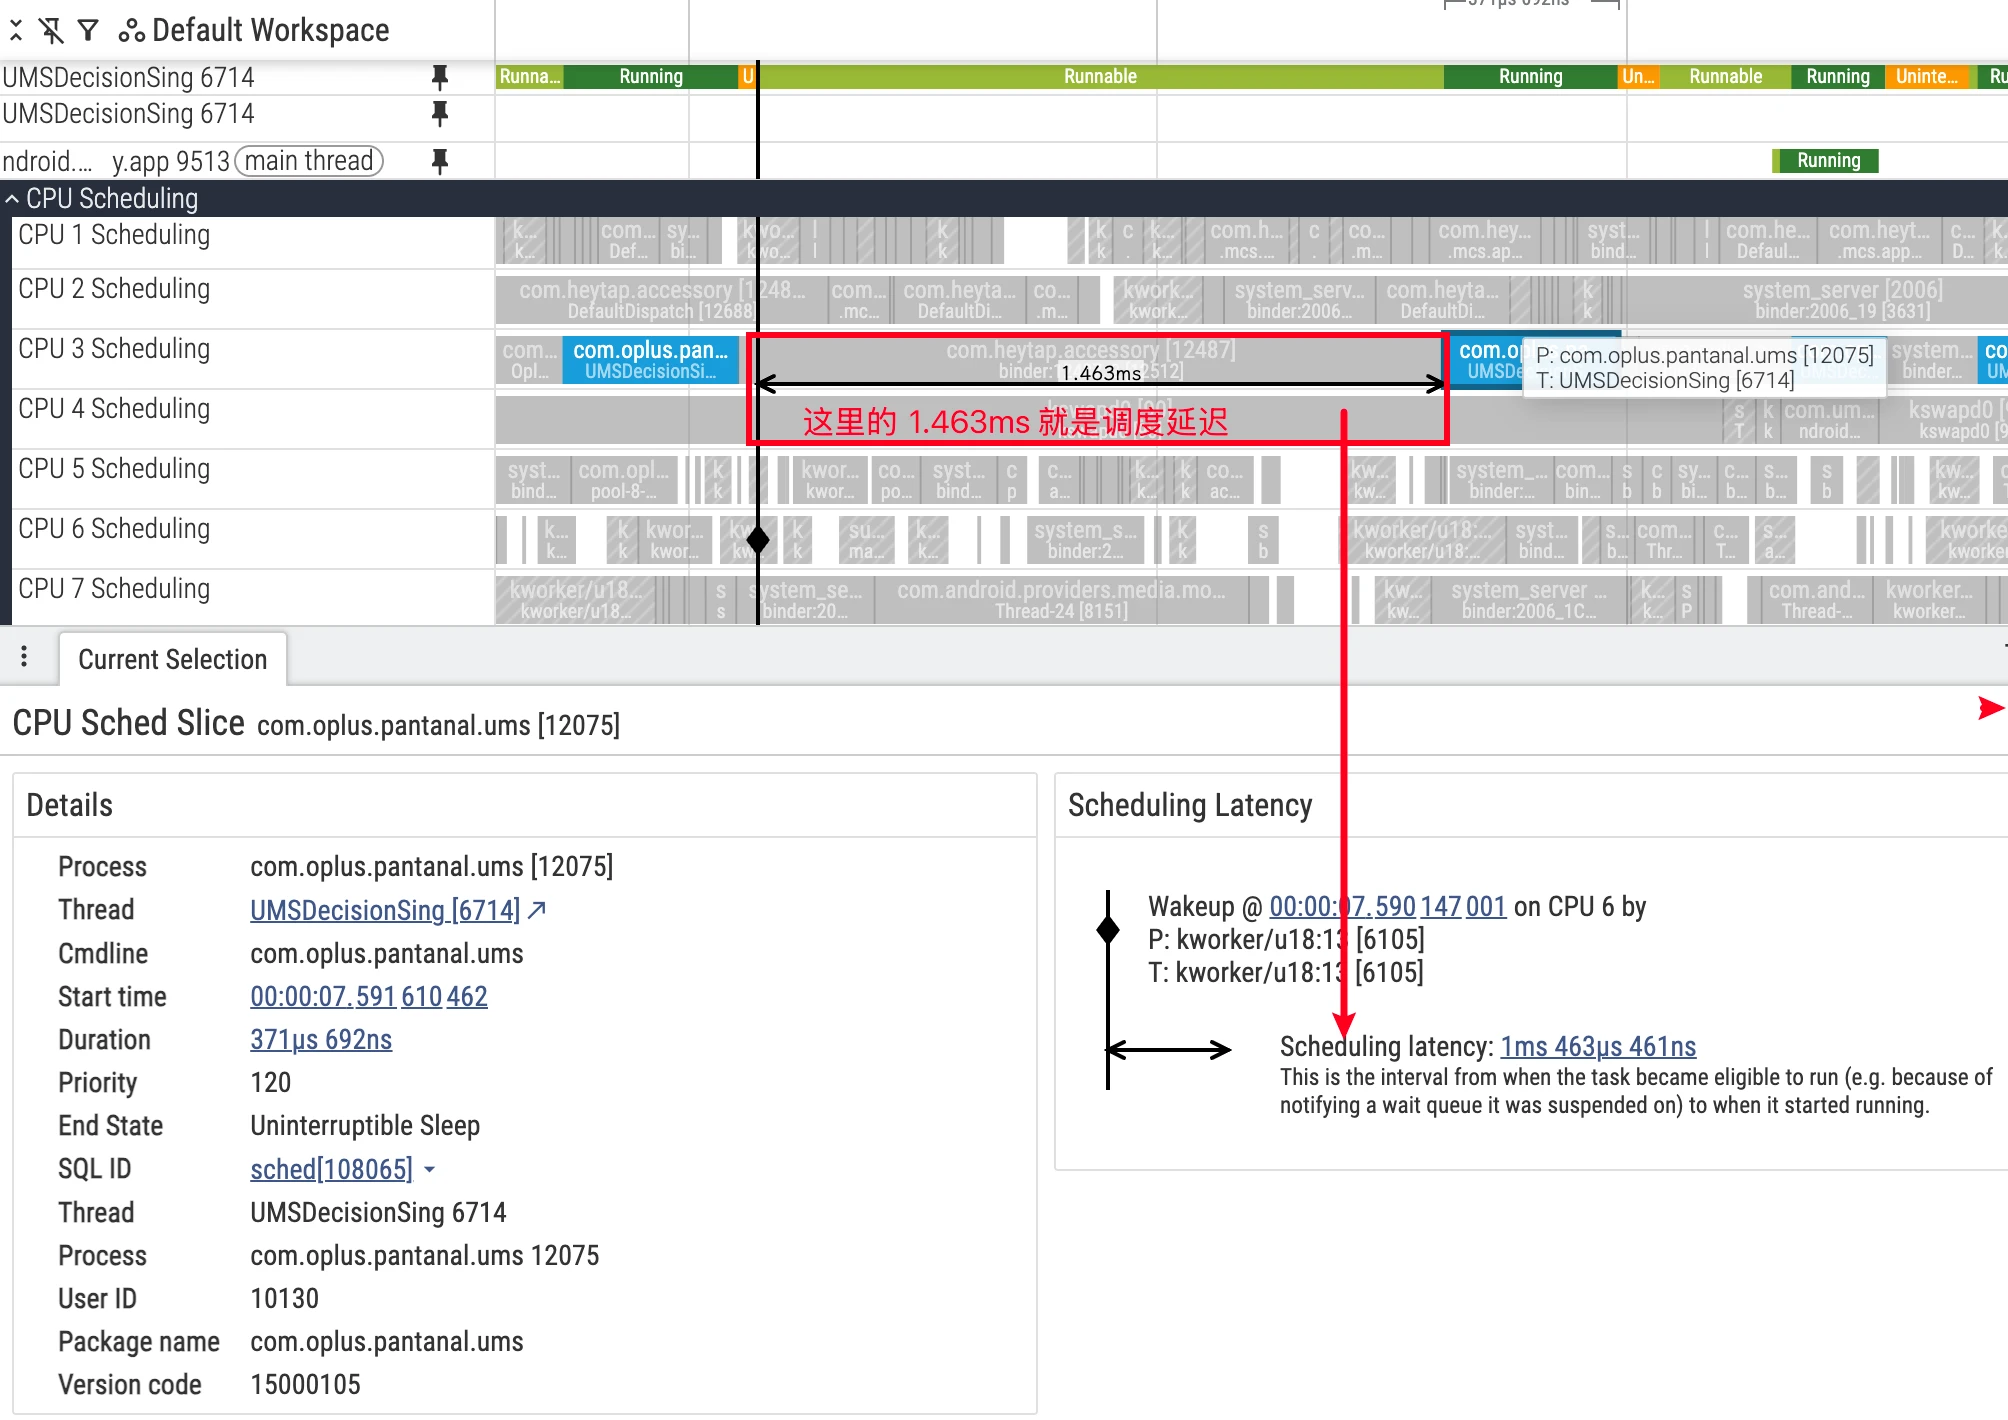
Common waiting reasons include:
- All CPUs are busy: Thread A needs to wait for a queue slot to open up (or currently running threads have higher priority).
- There’s an idle CPU, but migration takes time: The load balancer needs a certain time window to migrate the thread to another CPU.
Unless using real-time priority, most Linux scheduler configurations are not strictly “work-conserving”. The scheduler sometimes “waits” for the current CPU thread to naturally idle to avoid extra overhead and power consumption from cross-CPU migration. This forms observable “queuing delay” in R state. Combined with sched_waking/sched_wakeup_new, you can more precisely characterize the time period from “being awakened” to “actually queued/running” (refer to official documentation: differences and applicable scenarios of sched_waking / sched_wakeup).
- In the target thread’s
thread_statetrack, filterstate=Rslices as direct evidence of “scheduling delay”. - Synchronously compare other heavy-load threads and IRQ/SoftIRQ traces on the same CPU to verify whether there’s time overlap of preemption or high-priority suppression.
- If
R+appears frequently, inspect the next running thread, priority, placement, and load before deciding whether scheduling policy needs adjustment.
Differences Between sched_waking and sched_wakeup and Non-strict Work-conserving
sched_wakingis issued when a thread is marked as runnable (R),sched_wakeupis related to cross-CPU wakeup and may be recorded on source or destination CPU; for most latency analysis, onlysched_wakingis sufficient (see official explanation).- Most Linux scheduling configurations under general priority are not strictly “work-conserving”. The scheduler sometimes “waits for current CPU to idle” to avoid extra overhead and power consumption from cross-core migration. This causes waiting time in R state (queuing delay) which is not abnormal but a result of trade-offs (see Perfetto CPU Scheduling).
User Mode and Kernel Mode: sys_* Slices Locate Empty Flame Graphs
sys_*slices require syscall tracing, usuallyraw_syscalls/sys_enterandraw_syscalls/sys_exiton a supported build; this article’s base config does not enable them. ARunningslice may include kernel work, so a user-space flame graph can be sparse.- If a UI thread’s某段
sched_sliceis very long, but CPU flame graph hotspots are few or almost none:- Open that thread’s
sliceview, check if there are longsys_*slices; - If exists: Bottleneck is mostly in I/O or synchronization primitives, prioritize checking I/O paths, lock granularity, and access patterns;
- If not exists: Return to flame graph, continue profiling user mode hotspot functions.
- Open that thread’s
- Suggestions: Merge I/O, switch to async, optimize lock contention, reduce system call frequency and single data volume.
CPU Time and Wall Time
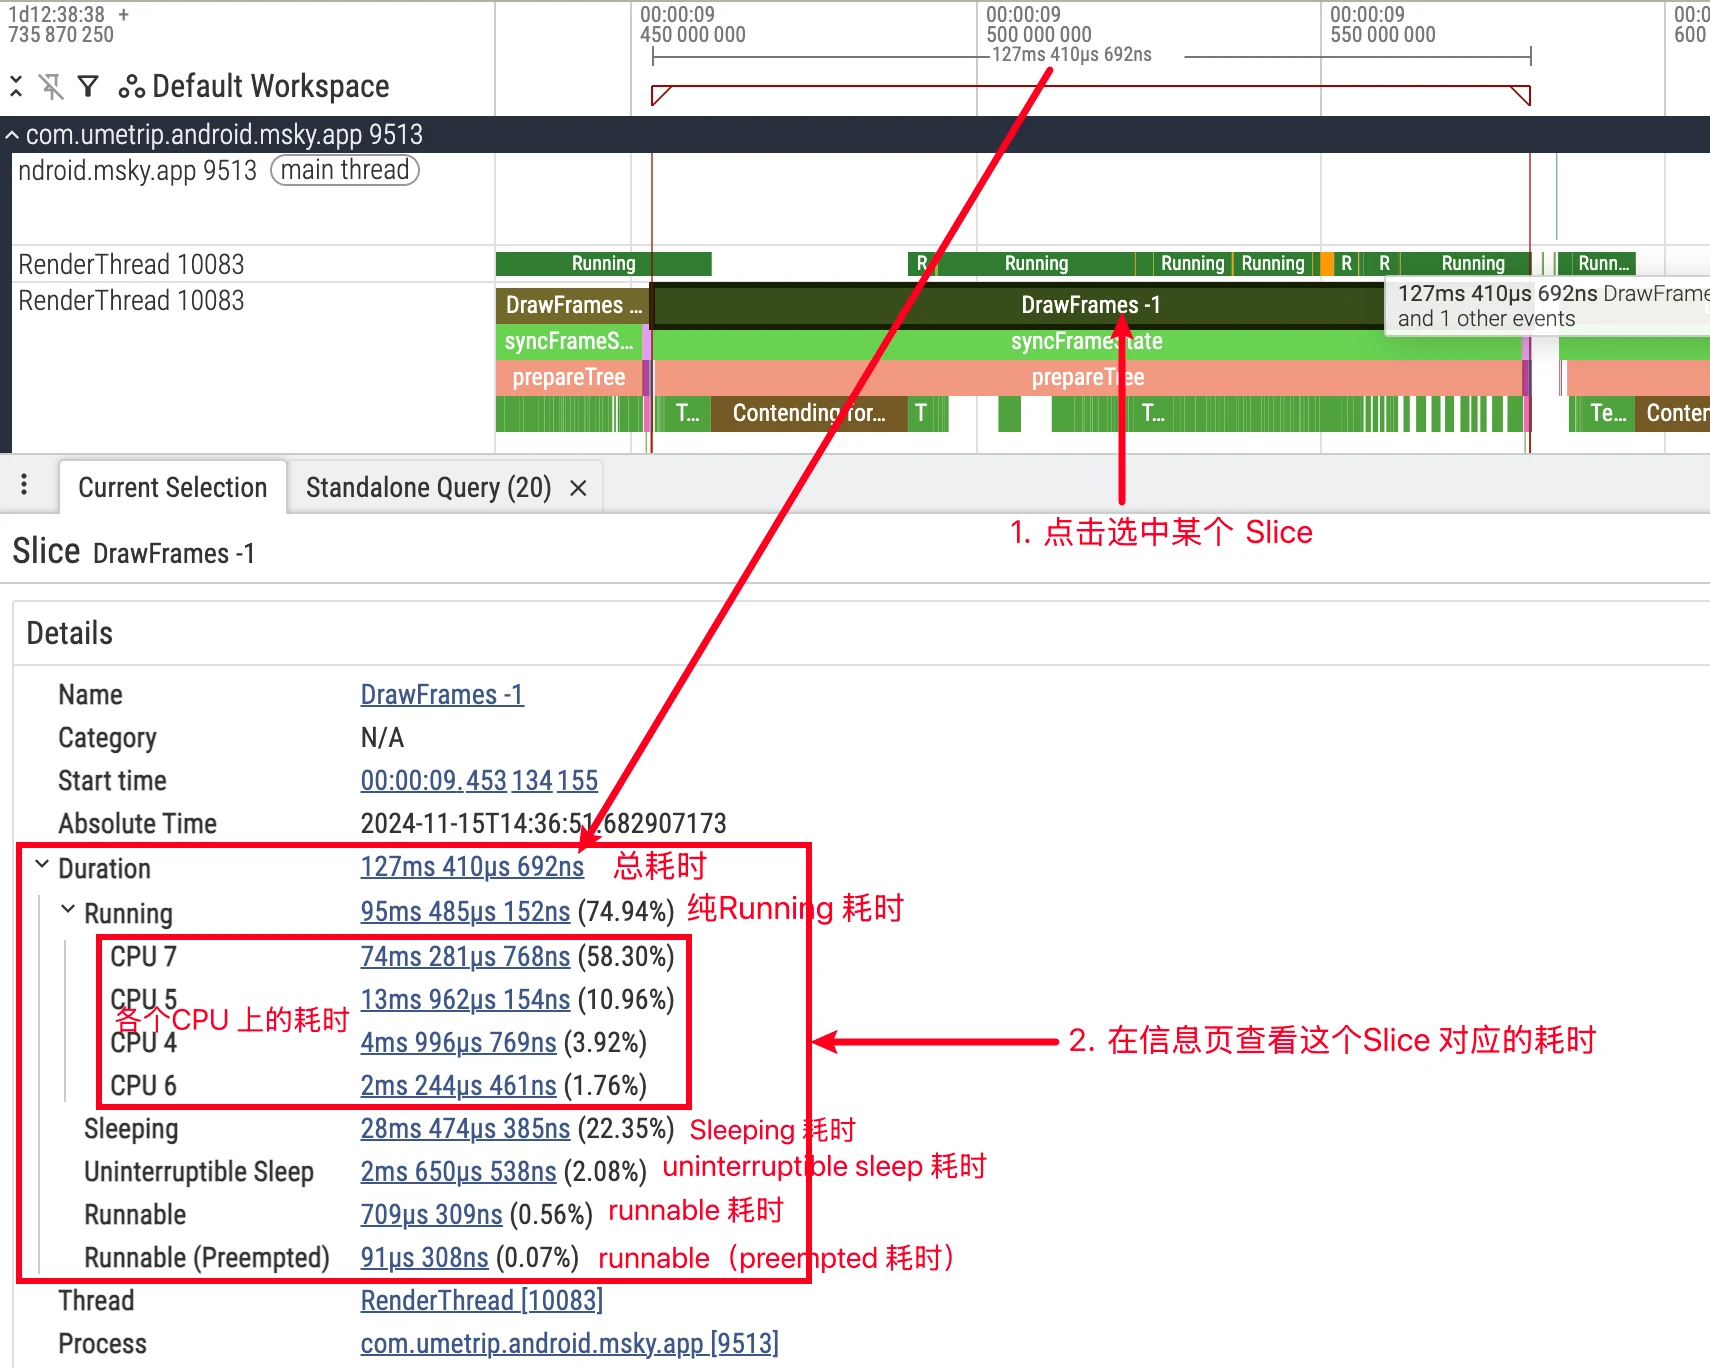
Wallis the real-world time from slice start to end,CPUis the time actually running on CPU.- With complete, non-overlapping thread-state coverage, wall time is approximately the sum of Running, Runnable, and all sleeping/blocked states; missing trace data breaks that accounting.
- Select target slice (e.g.,
Choreographer#doFrame), compareWallwithCPU; - If
Wall ≈ CPU, it’s computation-heavy, use flame graph to locate hotspots; - If
Wall >> CPU, it’s scheduling or dependency waiting, checkthread_state‘sR/S/Ddistribution and wakeup chain.
- Select target slice (e.g.,
CPU Frequency Deep Dive
CPU frequency directly affects code execution speed and is also positively correlated with power consumption. The CPU Frequency track shows each core’s operating frequency (scaling_cur_freq) at specific times. But more importantly, understanding the limiting factors behind it:
Core Factors Affecting CPU Frequency
Task Utilization: This is the main driving factor. Modern Android systems mostly use
schedutilas thecpufreqfrequency scaling policy. It directly associates with the Scheduler, deciding frequency based on thread “busyness” (utilization). A high-load thread (highutil) will promptschedutilto request higher frequency, and vice versa.Scenario Policy (Power HAL): Android Framework passes the current system state, i.e., “scenario”, to the lower layer through Power HAL. For example, during app launch, gaming, or screen touch, Power HAL requests higher performance from the kernel, usually by raising the CPU’s floor frequency (
scaling_min_freq) and/or ceiling frequency (scaling_max_freq), ensuring the CPU can respond quickly.Thermal Throttling: This has the highest priority limitation. When device temperature (from battery, CPU, NPU, and other sensors) exceeds preset thresholds, the thermal control system forcibly lowers the CPU’s ceiling frequency to reduce heat and protect hardware. At this time, even with high-load tasks, CPU frequency cannot increase, a common external cause of game frame drops and app jank.
Power Limitation and Power Saving Mode: In low battery or power saving mode enabled, the system similarly limits maximum performance output by lowering ceiling frequency to extend battery life.
If a heavy task runs while frequency remains low, check current frequency, cluster placement, and scaling_max_freq. A frequency limit may be one contributor; it does not exclude an app-side bottleneck.
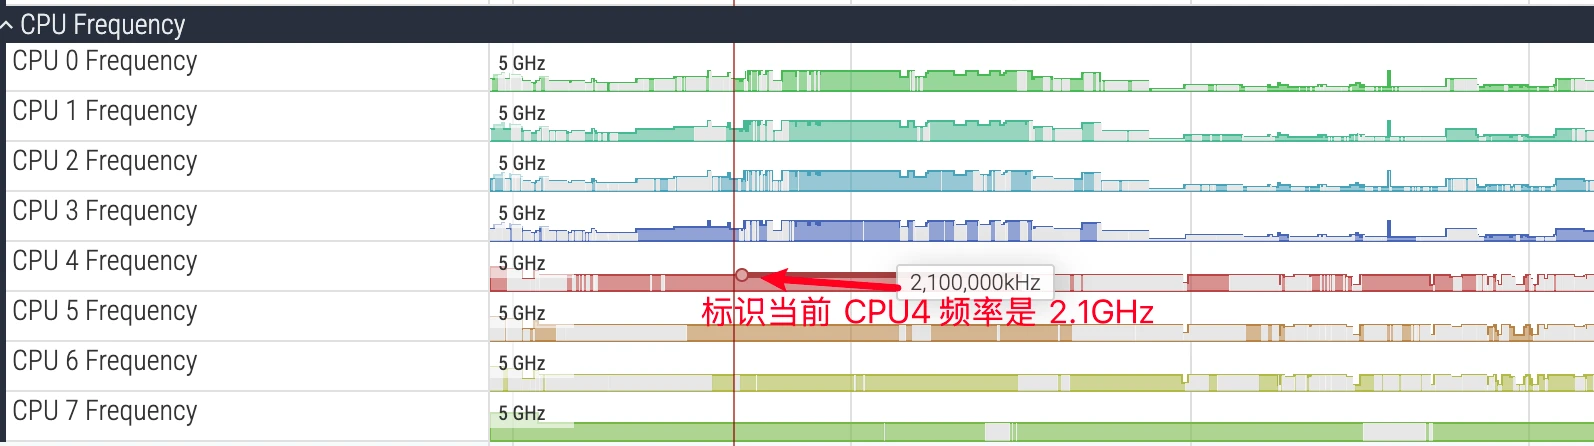
The above image is a marker diagram of the CPU frequency area. Hovering the mouse over it shows the current frequency. CPU frequency changes very quickly. In the image, CPU has colored and non-colored parts. Colored parts indicate the current CPU has Tasks running, non-colored parts indicate the current CPU is empty with no Tasks.
Frequency Data Collection and Platform Differences
- Two acquisition methods:
- Event-driven: Enable
power/cpu_frequency, record events when kernel cpufreq driver changes frequency. Not all platforms support it, reliable on most ARM SoCs, often no data on many modern Intel platforms. - Polling sampling: Enable
linux.sys_statsand setcpufreq_period_ms > 0to sample/sys/devices/system/cpu/cpu*/cpufreq/scaling_cur_freq. Combine it with event-driven tracing for an initial frequency snapshot where supported.
- Event-driven: Enable
- Android devices often scale frequency by “cluster”, common phenomenon is multiple CPUs within the same cluster synchronously changing frequency.
- Known issues:
- Events only generate when frequency changes, short Traces or stable scenarios may have left-side “blanks”. At this time, rely on polling to fill.
- Some UI versions don’t render cpufreq track when Idle state not captured, but data can still be obtained through queries.
- Reference:
CPU frequency and idle statesofficial explanation.
big.LITTLE: Same Frequency Doesn’t Equal Same Performance or Power Consumption
- On heterogeneous CPUs, both at 2.0GHz, LITTLE cores and big cores’ actual computing power and energy consumption are not equivalent. Frequency must be understood in combination with core type.
- Core capacity and IPC: Big cores often complete the same work faster at the same frequency, but their total energy use is not guaranteed to be lower; voltage, duration, and idle behavior also matter.
- Cluster-level DVFS: Mobile SoCs mostly scale frequency by “cluster”. LITTLE core cluster’s high frequency doesn’t equal big core cluster’s medium frequency performance output; different clusters have different voltage-frequency-energy curves, same frequency point cannot be horizontally compared for “performance per watt”.
- Memory/cache/interconnect bottleneck: If hotspot is constrained by memory bandwidth, LLC hit rate, or system interconnect (NoC), simply raising LITTLE core frequency has limited benefit; big cores’ larger cache/stronger prefetch can significantly reduce same task’s memory access waiting, reflecting “same frequency different effect”.
- Energy efficiency curve is non-linear: LITTLE cores approaching maximum frequency often enter energy efficiency steep decline zone (voltage elevation causes marginal energy consumption surge), while big cores at medium frequency points may achieve “higher unit energy efficiency”. Same frequency comparison ignores “voltage-frequency-energy” three-dimensional trade-off.
P-States and governor
- CPU frequency is not a continuous value but discrete performance states P-States. Common governor is
schedutil, selecting appropriate P-State based on task utilization and other signals, coordinating voltage adjustment. - Frequency changes in UI are essentially governor switching between different P-States. High frequency doesn’t necessarily mean faster or more power-efficient, needs to be understood in combination with core cluster type and current upper/lower limit constraints.
- Verification steps:
- In
CPU Frequency, observe whether frequency upper/lower limits are raised/lowered (such as scenario policy/thermal throttling limitingscaling_max_freq). - In
CPU Scheduling, check which type of core critical threads run on (combined with device’s core number division). - If “high frequency + LITTLE core + still slow”, prioritize considering core selection/memory access bottleneck, not simply “frequency insufficient”.
- In
- Recommend combining Power HAL scenarios, thermal management, and task profile (CPU intensive or memory access intensive) for comprehensive optimization, avoid simply using frequency as tuning target. Reference official documentation: Perfetto CPU Scheduling.
Linux Kernel Scheduling Strategy: Core Selection and Migration
After understanding thread states and frequency, we also need to deeply understand two core behaviors of the Linux kernel scheduler (mainly EAS - Energy Aware Scheduling in Android): how to select a CPU core for tasks, and why to migrate tasks from one core to another.
Core Selection Logic (Task Placement)
When a thread is awakened from Sleep state, or a new thread is created, the EAS scheduler needs to select the most suitable CPU core for it. Its core goal is to minimize system power consumption while meeting task performance requirements. The decision-making process is roughly as follows:
- Evaluate Task Load (Task Utilization): The scheduler evaluates the thread’s
util, i.e., how much computing resources it needs. This is a dynamically adjusted value reflecting the thread’s historical busyness. - Find “Sufficient” Core: The scheduler traverses all available CPU cores, comparing task’s
utilwith each core’scapacity(capacity/maximum computing ability). Big cores’capacityis far higher than LITTLE cores. The scheduler looks for cores wherecapacity > util, i.e., cores that can “accommodate” this task. - Find “Most Energy-Efficient” Core: Among all cores meeting
capacityrequirements, the scheduler uses the “Energy Model” preset in the kernel for calculation. This model knows each core’s power consumption at each frequency. The scheduler selects a CPU core that makes the entire system (including the task itself and other running tasks) have the lowest total power consumption as the final choice.
In short: EAS’s goal is not to find the fastest core for a task, but to find a core that’s “just enough” and “most power-efficient”.
Core Migration Logic (Task Migration)
Moving tasks from one CPU core to another is a key means for the scheduler to perform dynamic tuning. It mainly occurs in the following situations:
Load Balancing: This is the most common migration reason. The scheduler periodically checks whether the system is in a “load imbalance” state. For example,
CPU-1(LITTLE core) is packed with high-load tasks causing its utilization to saturate, whileCPU-7(big core) is very idle. At this time, the scheduler judges the system is imbalanced and will “pull” a high-load task fromCPU-1toCPU-7to run, to restore balance and improve performance.Wake-up Migration: When a thread wakes up, the scheduler re-evaluates its best core. If this thread’s
utilchanged during sleep (for example, a background download thread suddenly receives a large file download task,utilspikes), or the core it was running on is now very busy, the scheduler may directly select a more suitable new core for it at wake-up, rather than letting it queue in the original place.
Understanding core selection and migration logic helps us judge whether the scheduler’s behavior is “abnormal”. For example, an obvious foreground UI thread being unreasonably restricted to LITTLE cores for a long time, or “bouncing back and forth” too frequently between big and LITTLE cores, may suggest problems with system scheduling strategy or task priority settings.
Of course, currently Android manufacturers have made a lot of customizations to the scheduler. Critical Tasks usually occupy more CPU and are more likely to get on big cores. There are also many core binding strategies and core signing strategies, causing phenomena seen by each manufacturer to be different. This is also each manufacturer’s core competitiveness (such as Oppo’s Hummingbird Engine).
Practice and SQL
Using SQL for Quantitative Analysis
Perfetto’s built-in SQL query engine is one of its powerful features, allowing developers to perform precise aggregation, filtering, and analysis on Trace data. Below are some commonly used CPU analysis queries.
1. Calculate Total CPU Time for Each Process
This query counts each process’s total running time on all CPUs, sorted in descending order, used to quickly locate processes consuming the most CPU resources.
1 | SELECT |
2. Analyze Single Thread’s Time State Distribution
This query based on the thread_state table can be used to analyze a specific thread’s (example surfaceflinger) time distribution in various states, thus judging its main bottleneck.
1 | SELECT |
3. Find Threads with Highest CPU Consumption Across the Trace
This query covers the entire trace. For a specific window, clip any sched slices that cross its boundaries; filtering only the slice start timestamp is not an exact windowed CPU-time calculation.
1 | SELECT |
4. View Thread’s Running Time Distribution on Each CPU Core
This query helps understand a thread’s CPU affinity and whether it runs on expected big/LITTLE cores.
1 | SELECT |
5. Calculate CPU Utilization for Each Process
This query divides observed CPU time by trace duration and the number of observed CPU tracks, so all observed CPUs fully busy would be 100%. Without that core-count normalization, a multicore process can exceed 100%.
1 | SELECT |
Summary
Proficient analysis of CPU information in Perfetto is a key skill for Android performance optimization. By deeply understanding core architecture, thread states, wakeup relationships, frequency limitations, and C-State, combined with powerful SQL queries for quantitative analysis, developers can precisely locate and solve various performance and power consumption issues.
About Me && Blog
Below is a personal introduction and related links. I look forward to communicating with you all. When three people walk together, one of them can be my teacher!
- Blogger Personal Introduction: Contains personal WeChat and WeChat group links.
- Blog Content Navigation: A navigation of personal blog content.
- Excellent Blog Articles Collected and Organized by Individuals - Must-Know for Android Performance Optimization: Welcome everyone to recommend yourself and recommend (WeChat private chat is fine)
- Android Performance Optimization Knowledge Planet: Welcome to join, thanks for support~
One person can go faster, a group of people can go further