Series Catalog:
- Overview of Android Performance Patterns
- Android Performance Patterns: Render Performance
- Android Performance Patterns: Understanding Overdraw
- Android Performance Patterns: Understanding VSYNC
- Android Performance Patterns: Profile GPU Rendering
In 2015, Google introduced the Android Performance Patterns short-video series. The original playlist is on YouTube; Google’s companion-course announcement also documents the series.
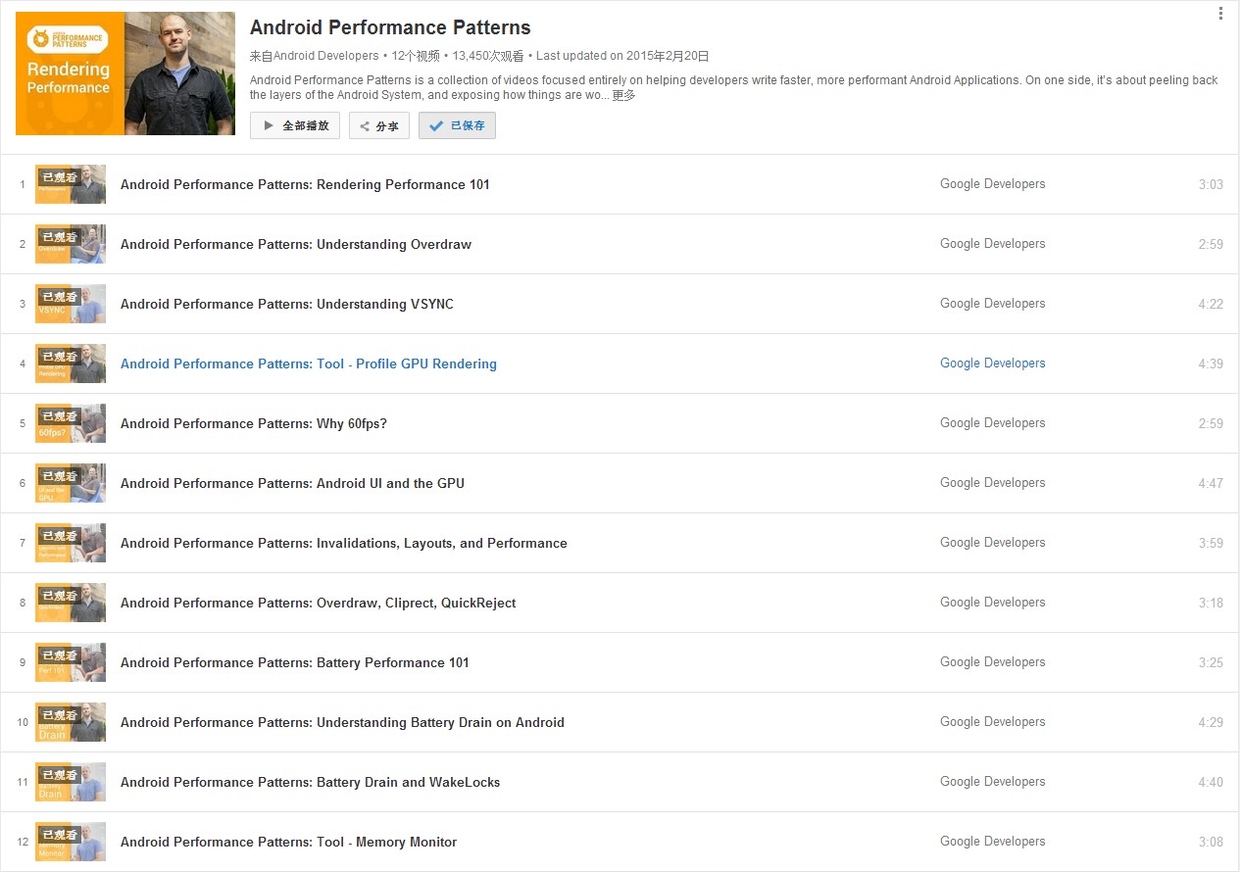
Technical review — 2026-10-13: The original 2015 motivation and viewing experience are retained. The videos remain useful background, while the old tools, Google+ resources, and fixed “16ms” guidance need the version context below.
Overdraw, VSYNC, and main-thread/RenderThread cooperation still matter, but the refresh interval is not always 16ms. It is about 16.67ms at 60Hz, 11.11ms at 90Hz, and 8.33ms at 120Hz. Use the system’s scheduling deadlines and trace data when judging actual frames instead of applying one fixed threshold to every device and scenario.
| Investigation | Current entry point and conditions |
|---|---|
| View / Compose hierarchy and attributes | Use Layout Inspector on debuggable apps. It can also show Compose recomposition/skipping; hierarchy inspection is not a frame-duration measurement |
| Quick rendering-stage and overdraw signals | Developer options provide Profile GPU/HWUI Rendering and Debug GPU Overdraw. The bars represent CPU-side rendering stages, not pure GPU execution time, and do not cover every custom rendering path. See the official guide |
| Frames missing their deadlines | Perfetto FrameTimeline requires Android 12 / API 31+. Relate frames to the thread, scheduling, and SurfaceFlinger tracks actually captured |
| Regressions during scrolling or transitions | Macrobenchmark FrameTimingMetric is available from AndroidX Benchmark 1.1.0. frameOverrunMs requires API 31+ and measures something different from frameDurationCpuMs |
The old Android Device Monitor, which hosted Hierarchy Viewer and Traceview, was deprecated in Android Studio 3.1 and removed in 3.2. Use the current Profiler for method analysis and Layout Inspector for hierarchy inspection. For Macrobenchmark, follow the setup requirements: a release-like, non-debuggable, profileable target, with consistent device and scenario conditions.
Introduction quoted in the original 2015 article:
Android Performance Patterns is a collection of videos focused entirely on helping developers write faster, more performant Android Applications. On one side, it’s about peeling back the layers of the Android System, and exposing how things are working under the hood. On the other side, it’s about teaching you how the tools work, and what to look for in order to extract the right perf out of your app.
But at the end of the day, Android Performance Patterns is all about giving you the right resources at the right time to help make the fastest, smoothest, most awesome experience for your users. And that’s the whole point, right?
The videos explain Android performance in three to five minutes each. The speakers talk fast; before subtitles were available, they really tested my listening. Subtitles were available when this article was written; check each video’s current subtitle tracks rather than assuming complete coverage today.
While the videos are short, they are packed with information. A point the speaker passes over in one sentence can take a lot of reading to understand, or a while spent learning a debugging tool. This means the series doesn’t directly teach you “how to optimize your app” step-by-step; rather, it tells you what you need to know about Android performance so that you know which tools to use, what steps to take, and what goals to aim for.
I was studying Android performance at the time, so I watched the videos several times as soon as they came out. My first plan was to translate them into Chinese. After watching them again, I felt that a translation alone would leave too much unexplained: each topic could fill a blog post, sometimes several. That is what I decided to write.
In each article, I will first list the knowledge points covered in the video and then explain them one by one. Some debugging tools might be detailed in separate posts due to their complexity.
Another person who inspired me to write this series is Hu Kai. His blog http://hukai.me/android-performance-patterns was among the first to translate this content into Chinese. His beautiful layout and high-quality translation helped the content spread widely. He is also the initiator of the android-training-course-in-chinese project on GitHub. I highly respect his passion for sharing. If you are not an Android developer or are not interested in technical details, you can simply read his overview for a quick understanding.
Below are some resources related to the Android Performance Patterns series:
- YouTube Playlist: Android Performance Patterns
- The author’s Google+ profile and the series community are obsolete. Consumer Google+ closed on 2019-04-02. See the official shutdown notice.
- Hu Kai’s blog URL is retained as a historical reference; it could not be reopened in this review. His Android Training translation repository remains accessible, but older translations are not current API contracts.
OK, let us start!!!
About Me && Blog
Below is my personal intro and related links. I look forward to exchanging ideas with fellow professionals. “When three walk together, one can always be my teacher!”
- Blogger Intro
- Blog Content Navigation: A guide for my blog content.
- Curated Excellent Blog Articles - Android Performance Optimization Must-Knows
- Android Performance Optimization Knowledge Planet: The paid community stopped operating in 2026 and no longer accepts new members; this link preserves its history.
One walks faster alone, but a group walks further together.