

Introduction
This article is a translation of Android Performance Case Study Follow-up by the renowned Romain Guy. It explores several techniques, methodologies, and tools for Android performance optimization.
Translation
Two years ago, I published Android Performance Case Study to help Android developers understand the tools and techniques needed to identify, track, and optimize performance bottlenecks.
That article used the Twitter client Falcon Pro as a case study. Its developer, Joaquim Vergès, was kind enough to let me use his app as an example and quickly addressed the issues I found. Fast forward to recently: Joaquim was building Falcon Pro 3 from scratch. Before its release, he contacted me about a scrolling performance issue. Once again, I had to analyze it without access to the source code.
Joaquim had already exhausted most tools. He confirmed that Overdraw wasn’t the culprit and suspected that his use of ViewPager was the cause. He sent over these screenshots:
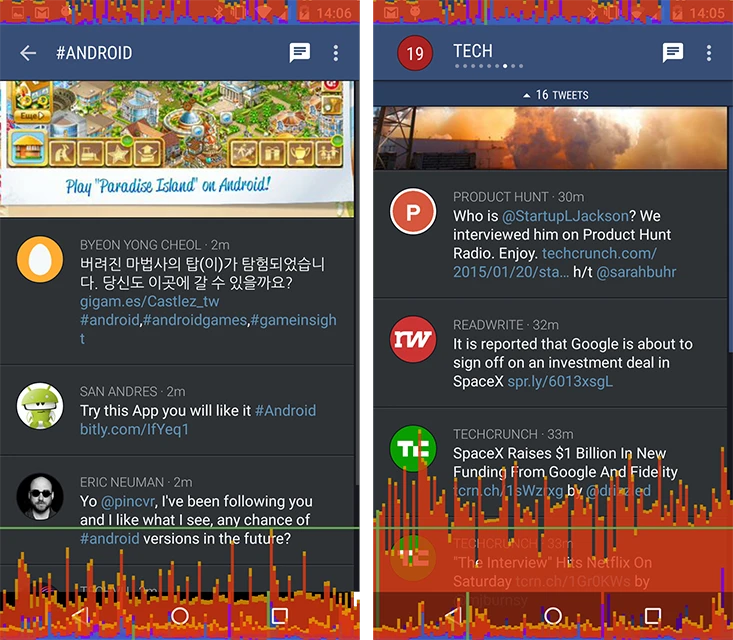
Joaquim used the built-in GPU profiling tool to identify dropped frames. The left screenshot shows the timeline scrolling without a ViewPager; the right shows it with one (captured on a 2014 Moto X). The problem was stark.
My first thought was to check if the ViewPager was abusing hardware layers, as it looked like the system was performing a layer update every frame during scrolling. However, the hardware layers updates debugging tool didn’t show much. I inspected the layout with Hierarchy Viewer, and to my surprise (or rather, disappointment for a quick fix), the ViewPager was behaving correctly.
Then I turned to a powerful but often overlooked tool: Tracer for OpenGL. My previous article explains its usage in detail. It’s important to remember that this tool captures every single drawing command sent by the UI to the GPU.
Android 4.3 and up: Tracer became slightly harder to use starting with Android 4.3 due to the introduction of reordering and merging of drawing commands. While these are amazing optimizations, they prevent Tracer from grouping commands by View. You can restore the old behavior by disabling display list optimizations before starting your app.
Reading OpenGL Traces: Commands in blue are GL operations that draw pixels. Others are for data transfer or state setting and can usually be ignored. Clicking a blue command updates the “Details” tab, showing the content of the render target immediately after that command executes. By clicking through the blue commands, you can literally reconstruct the frame piece by piece. This is my primary way of diagnosing issues with Tracer—seeing how a frame is built provides deep insight into an app’s behavior.
After scrolling through Falcon Pro for a bit, I examined the GL trace. I was surprised to find many SaveLayer/ComposeLayer blocks.
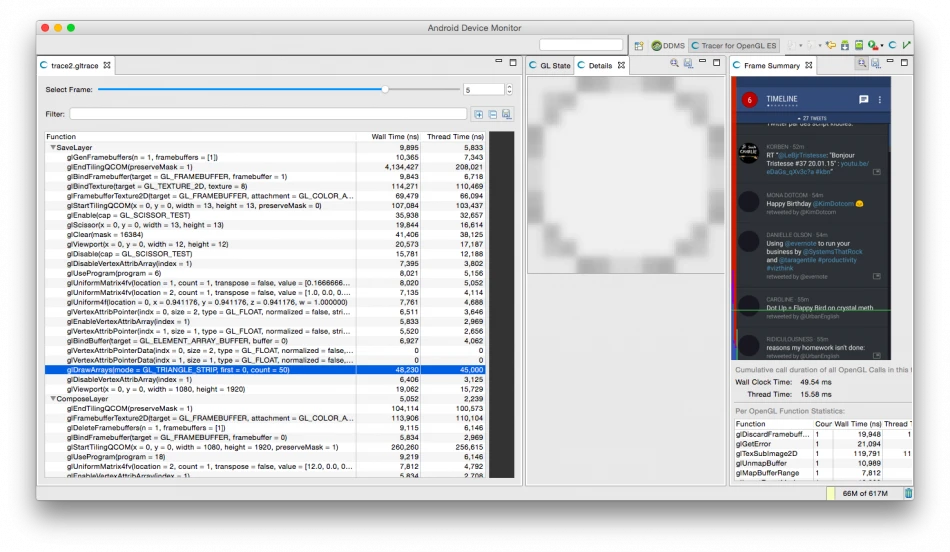
These commands indicate the app is creating temporary hardware layers. These are often created by [Canvas.saveLayer()](http://developer.android.com/reference/android/graphics/Canvas.html#saveLayer(float, float, float, float, android.graphics.Paint, int)). UI widgets trigger this behavior when drawing a View with an alpha < 1 (semi-transparent) under these conditions:
getAlpha()returns < 1onSetAlpha()returns falsegetLayerType()returnsLAYER_TYPE_NONEhasOverlappingRendering()returns true
Chet and I have emphasized in many talks why you should use alpha with care. Each time a widget uses a temporary layer, drawing commands are rerouted to a different render target. Switching render targets is a “heavy” operation for GPUs, especially those with tiling/deferred architectures (like ImaginationTech’s SGX or Qualcomm’s Adreno). On these mobile GPUs, it’s a significant bottleneck. Since we were testing on a 2014 Moto X (Snapdragon/Qualcomm), multiple temporary hardware layers were almost certainly the root cause.
So, what was creating these layers? Tracer provided the answer. In the image above, the GL commands in the SaveLayer group were rendering a small circle. Let’s look at the app:
See the circles at the top? Those are ViewPager indicators. Joaquim was using a third-party library to draw them. Interestingly, the current page was indicated by a solid white circle, while others were a “grayish” white. The library was achieving this “gray” by drawing white circles and then calling setAlpha() on the View to make them semi-transparent.
Solutions
There are several ways to fix this:
- Use an opaque color: Instead of setting opacity on the View, just use a customizable “inactive” color (e.g., a real gray hex value).
- Override
hasOverlappingRendering(): Returnfalse. The framework will then apply the alpha directly to thePaintfor you. This is a powerful optimization: for non-overlapping Views, the system doesn’t need an off-screen buffer; it can just draw each primitive with the reduced alpha.1
2
3
4
5
6
7
8
9/**
* Replaces the default implementation which returns true.
* Use false if your View doesn't have overlapping content
* (e.g., a simple ImageView or TextView without a background).
*/
public boolean hasOverlappingRendering() {
return false;
} - Override
onSetAlpha(): Returntrueand manually apply the alpha to thePaintused to draw the circles.1
2paint.setAlpha((int) (alpha * 255));
canvas.drawCircle(..., paint);
The simplest fix is the second one, though it requires API 16. For older versions, the other two work well. In the end, Joaquim replaced the third-party library with his own optimized indicator implementation.
I hope this post illustrates how seemingly “innocent” or “safe” operations can hide major performance pitfalls. Never assume—always verify, measure, and trace.
Appendix
For more on using Alpha, see: Android Tips: Best Practices for Using Alpha
About Me && Blog
(Links and introduction)