

This is the second article in our MAT series, focusing on advanced techniques for analyzing memory issues in Java and Android applications.
- Android Memory Optimization (1) - Introduction to MAT
- Android Memory Optimization (2) - Advanced MAT Usage
- Android Memory Optimization (3) - Viewing Original Bitmaps in MAT
Characteristics of Java Memory Leaks
- Main features: Reachable but Useless.
- Useless: Objects created but not released after they are no longer needed.
- Inefficient: Re-creating new objects for tasks where existing ones could be reused.
Advanced MAT Techniques
Dumping Memory with Android Studio
Modern versions of Android Studio make capturing heap dumps easy: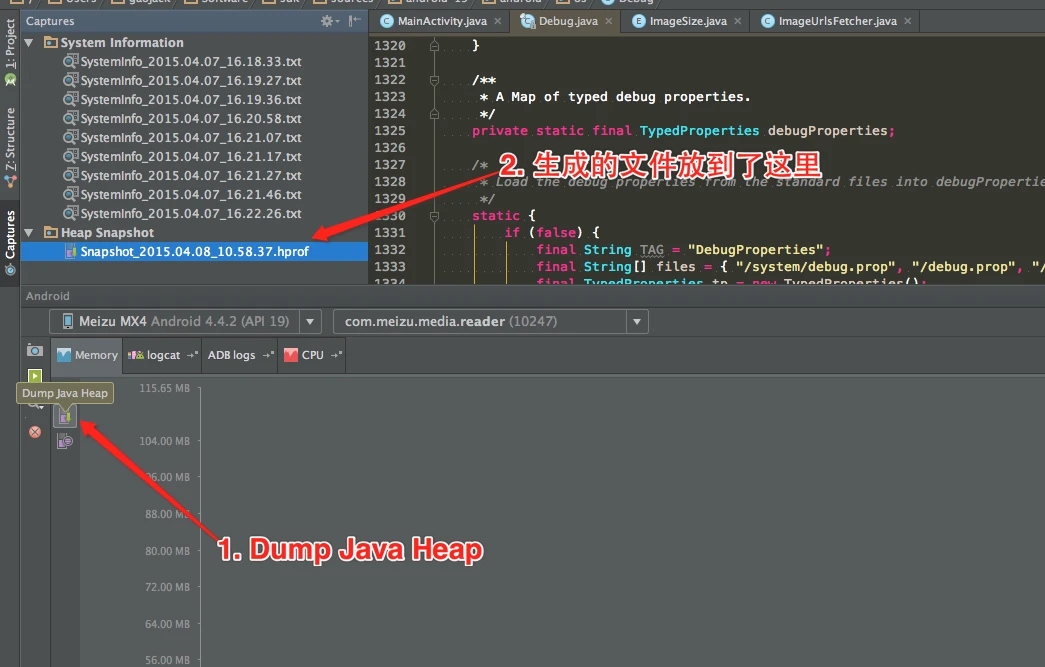
Capture the hprof file, right-click to convert it to standard format, and open it in MAT.
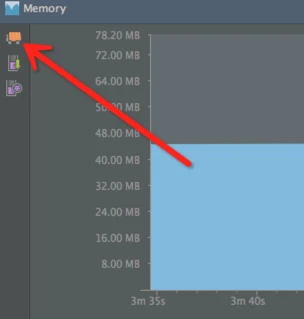
Tip: Before capturing a heap dump, always manually click the Initiate GC button. This ensures your snapshot doesn’t include unreachable objects that are just waiting for a collection cycle.
Unreachable Objects
Unreachable objects are those that can be reclaimed by the GC but haven’t been because no collection has occurred yet. MAT can show these if the dump was taken without a preceding GC.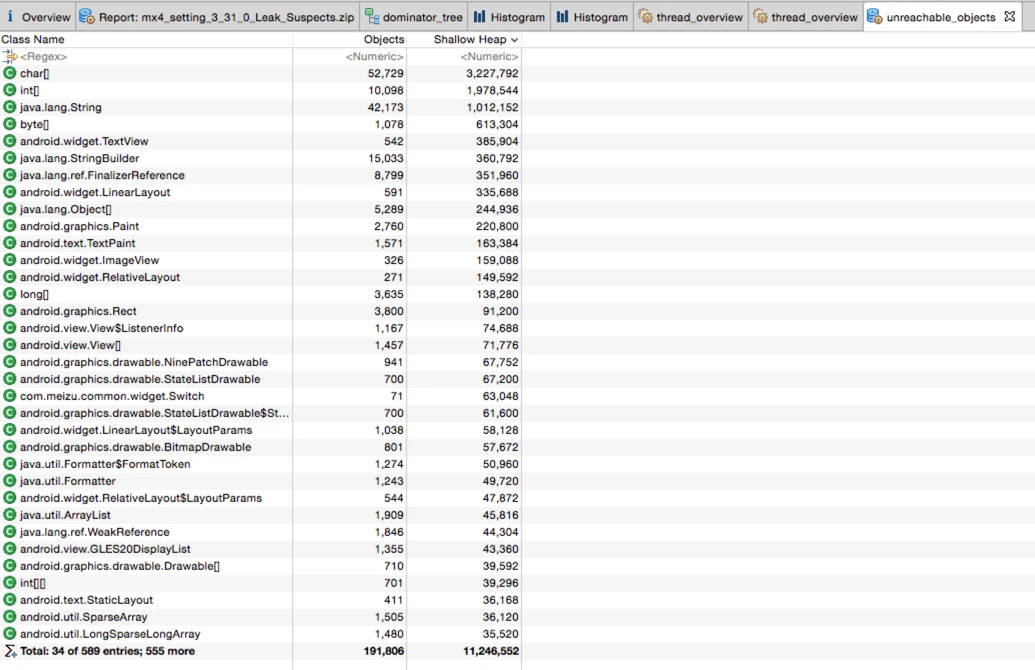
When you click Calculate Retained Size, you’ll notice that unreachable objects have a Retained Heap value of 0, which is expected.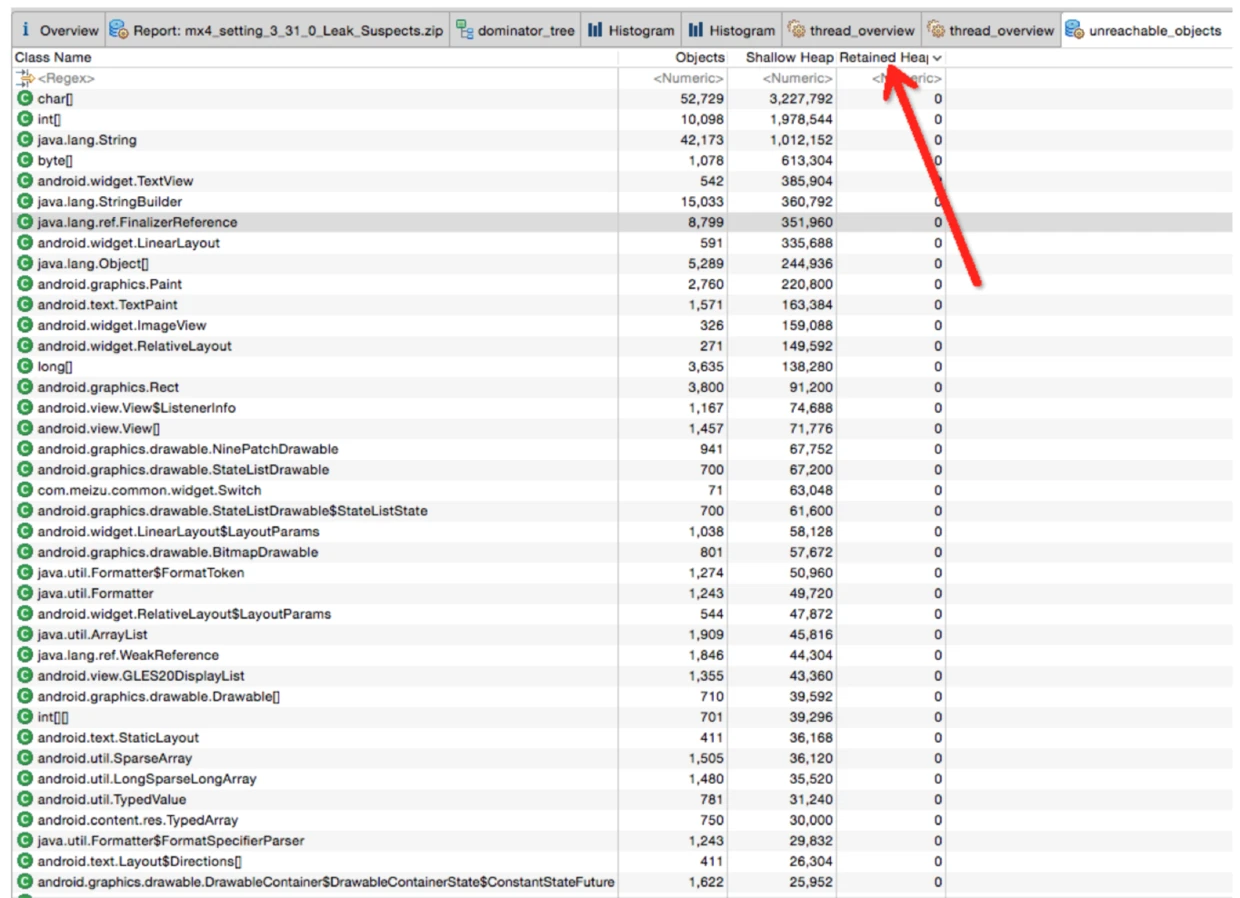
Histogram Analysis
The Histogram is specialized for checking instance counts, particularly for your own classes.
- Sort by Percentage to quickly find the biggest memory consumers.
- Group by different dimensions: Group by class, Group by class loader, or Group by package. Dominator Tree also supports these group types.
- Comparing two Histograms over time is the best way to find leaking objects.
- Histogram vs. Dominator Tree: Histogram looks at memory from the perspective of classes, while Dominator Tree looks from the perspective of object instances. Dominator Tree is superior for understanding complex reference chains.
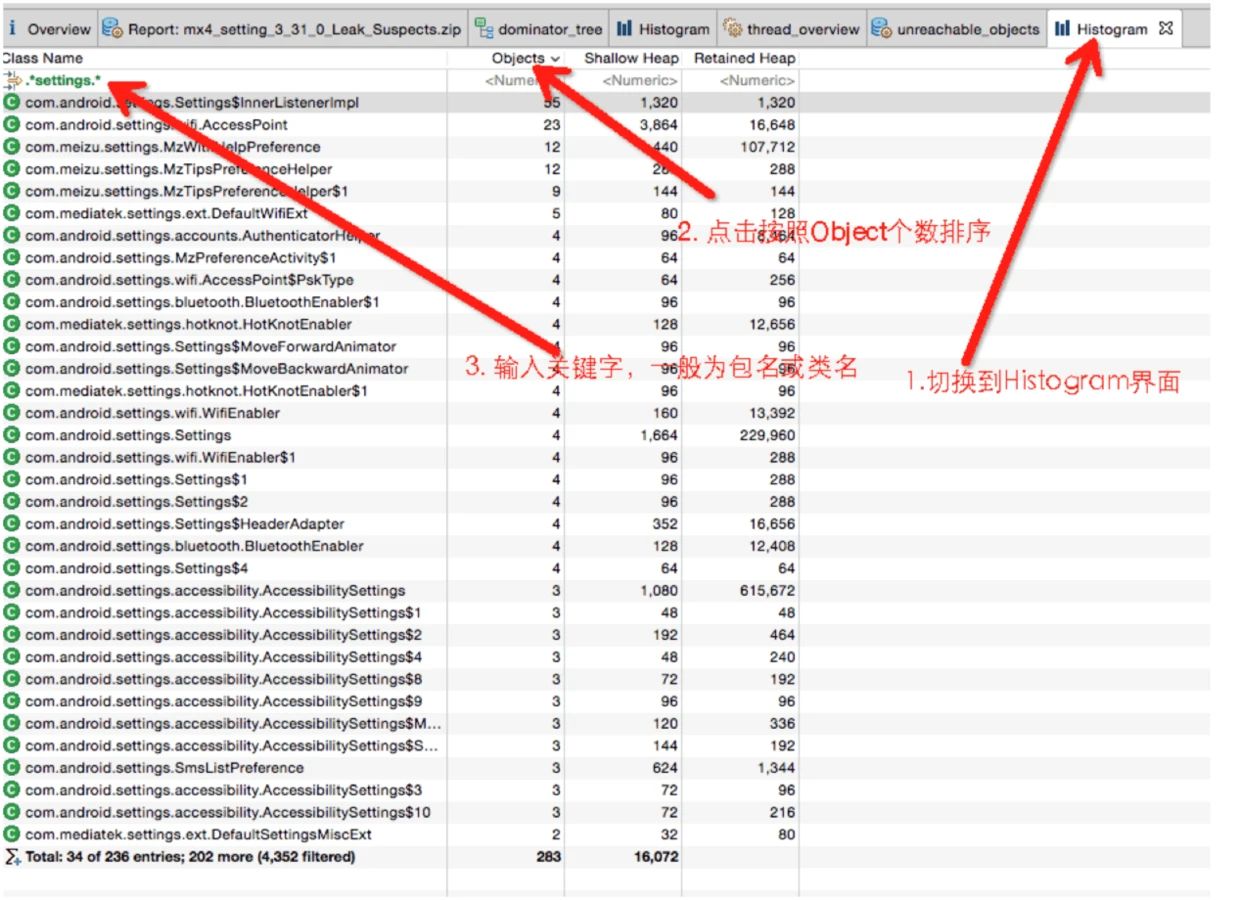
By grouping by package, you can isolate your own code and identify classes that are either reachable-but-useless or being recreated unnecessarily.
Thread Information
MAT can display active threads: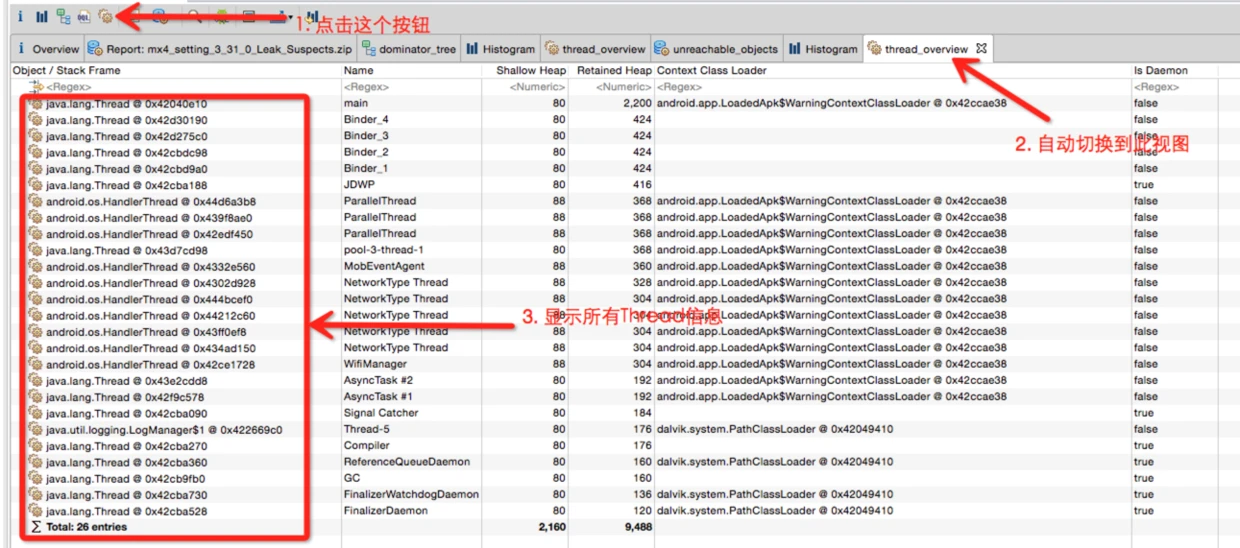
This provides insights into:
- Threads that might be causing memory issues due to their stack size or held references.
- An unusually high number of threads, which itself can be a memory/performance issue.
Context Menus and Help
Right-clicking any item in MAT reveals a wealth of analysis options: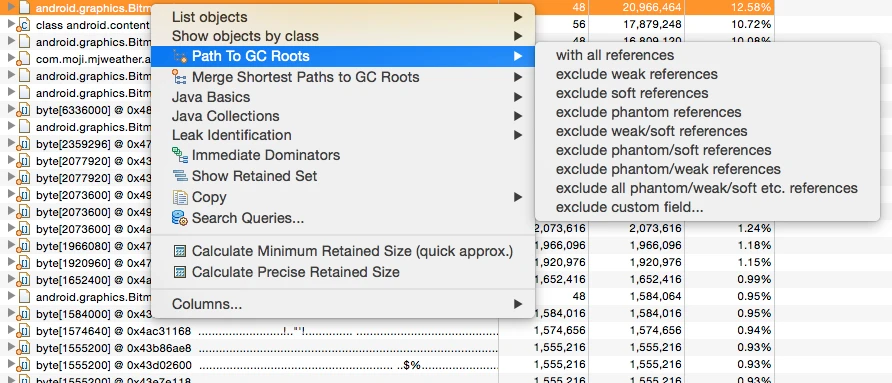
Use the Search Queries option (usually at the bottom) to look up the exact meaning of these commands. Often, these commands are just pre-configured SQL-like queries.
Key queries include:
- List objects -> with incoming references: Find what this object refers to.
- List objects -> with outgoing references: Find what objects refer to this one.
- Path To GC Roots -> exclude all phantom/weak/soft etc. references: Show the path from a GC Root via Strong References only. Since soft/weak/phantom references can be cleared by the JVM, a leak is almost always caused by a persistent strong reference.
- Merge Shortest path to GC root: Find the common path from a GC Root to a group of objects.
Debugging Bitmaps
In many Android apps, Bitmaps occupy the majority of the heap, especially on 2K/4K screens where a single Bitmap can exceed 20MB.
MAT allows you to export the raw byte[] data of a Bitmap to a file, which can then be viewed with third-party tools. This is a game-changer for identifying which images are leaking. See Viewing Original Bitmaps in MAT for the full workflow.
Debugging ArrayLists
Checking content in an ArrayList via standard outgoing references can be tedious as it exposes the internal array structure.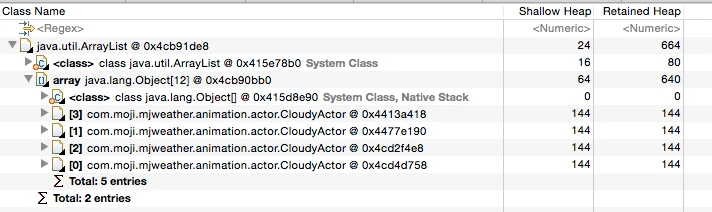
Instead, use MAT’s Extract List Values feature for a much more intuitive view: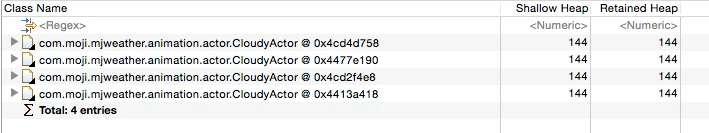
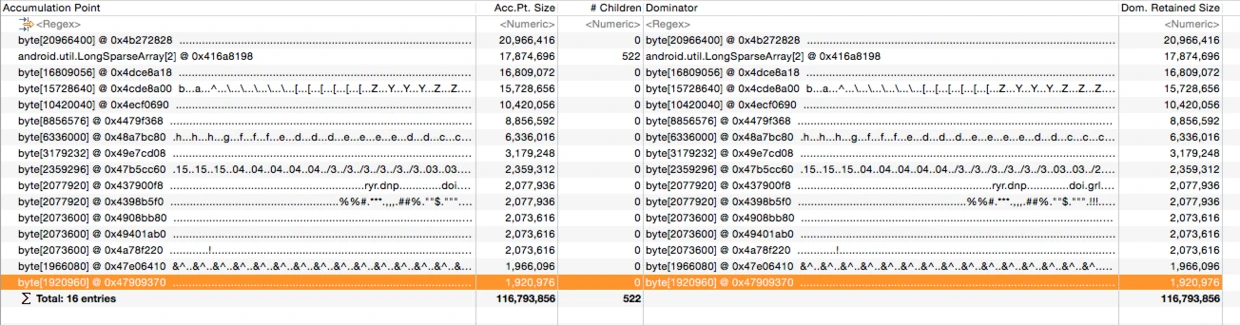
Big Drops In Dominator Tree
The “Big Drops In Dominator Tree” tool identifies accumulation points. It highlights objects where there is a large difference between the retained size of a parent and its children. These are typically places where many small objects are being aggregated under one parent object, indicating a potential hotspot.
About Me && Blog
(Links and introduction)