In the article Android Jank and Frame Drops Due to System Issues, we listed some actual cases of jank caused by system low memory. Since low memory significantly impacts overall device performance, I’m writing a separate article to outline how system low memory affects device performance.
As Android system versions evolve and apps’ codebases expand, Android’s memory requirements continue to grow. However, many devices in the market still have less than 4GB of RAM. These users easily encounter system-wide low memory situations, especially after major system updates or as more apps are installed.
Android low memory leads to performance issues, specifically manifested as slow response and jank. For example: launching an app takes longer than usual; scrolling lists drops more frames; reduced background processes increase cold starts; phones easily overheat. Below, I’ll outline the reasons for these performance issues, debugging methods, and potential optimization measures.
0. Android Jank and Frame Drops: Methodology
1. Android Jank and Frame Drops Due to System Issues
2. Android Jank and Frame Drops Due to App Issues
3. Android Jank and Frame Drops Due to Low Memory
Data and Behavioral Characteristics of Low Memory
Meminfo Information
The simplest method is using Android’s built-in Dumpsys meminfo tool:
1 | adb shell dumpsys meminfo |
If the system is in low memory, it exhibits these characteristics:
- FreeRam value is very small, Used RAM value is very large
- ZRAM usage is very high (if ZRAM is enabled)
LMK && kswapd Thread Activity
During low memory, LMK becomes very active. You can see LMK killing processes in Kernel Log:
1 | [kswapd0] lowmemorykiller: Killing 'u.mzsyncservice' (15609) (tgid 15609), adj 906, |
This log means: because memory is below our set 900 watermark (261272kB), it kills the process with PID 15609 (mzsyncservice, with adj 906).
proc/meminfo
This is where Linux Kernel displays meminfo. For meminfo interpretation, refer to this article: /PROC/MEMINFO之谜
From the results, when the system is in low memory, both MemFree and MemAvailable values are small.
1 | MemTotal: 5630104 kB |
System-wide Lag & Slow Response
During low memory, the entire device feels much more sluggish than during normal memory conditions. Tapping apps or launching applications feels unresponsive or slow.
Specific Impacts of Low Memory on Performance
Impact on Main Thread IO Operations
The main thread experiences大量IO相关的问题 (numerous IO-related issues):
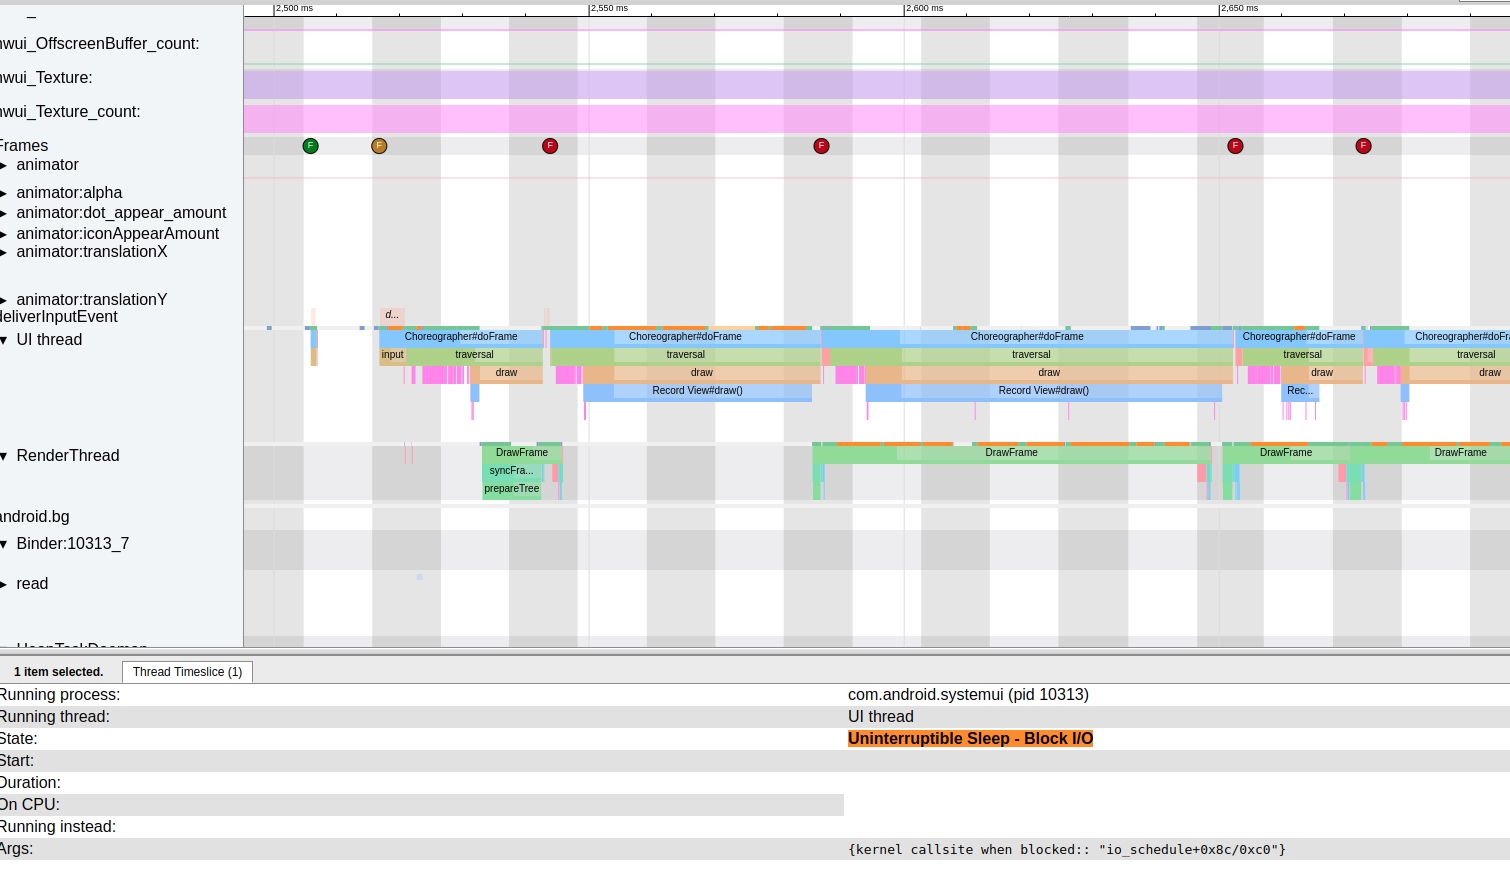
- Reflected in Trace as大量黄色Trace State出现 (numerous yellow Trace States appear), e.g.:
Uninterruptible Sleep | WakeKill - Block I/O. - Check its Block information (
kernel callsite when blocked:: "wait_on_page_bit_killable+0x78/0x88)
Linux system’s page cache链表 (linked list) sometimes contains pages that aren’t fully prepared (i.e., haven’t completely read content from disk). When users恰好访问这个page (恰好访问这个page) at that moment, wait_on_page_locked_killable阻塞 (blocks). This极易出现 (easily occurs) when system IO operations are very繁忙 (busy), with each IO operation needing to wait in queue, and阻塞时间往往比较长 (blocking time tends to be long).
当出现大量的IO操作的时候 (When大量IO操作 occur), the application main thread’s Uninterruptible Sleep also increases. At this point, any IO operation (e.g., view, reading files, reading configuration files, reading odex files) triggers Uninterruptible Sleep,导致整个操作的时间变长 (causing the entire operation time to lengthen).
CPU Competition
Low memory triggers Low Memory Killer processes to频繁进行扫描和杀进程 (frequently scan and kill processes). kswapd0 is a kernel worker thread awakened during memory不足 (insufficiency) to perform memory reclamation. When memory频繁在低水位 (frequently at low watermarks), kswapd0 gets频繁唤醒 (frequently awakened),占用cpu (occupying CPU), causing jank and battery drain.
For example, in the following situation, kswapd0 occupies the超大核 (big core) CPU7 at满频 (full frequency), consuming significant power. If the foreground app’s main thread runs on CPU7 at this time, CPU competition很可能出现 (is very likely to occur),导致调度不到而丢帧 (causing missed scheduling and frame drops).
HeapTaskDaemon also typically runs at high frequency during low memory.
 , to perform memory-related operations.
Process Frequent Killing and Restarting
The impact on AMS mainly集中在进程的查杀上面 (focuses on process killing). Due to LMK intervention, processes in Cache state很容易被杀掉 (are easily killed), then又被他们的父进程或者其他的应用所拉起来 (then restarted by their parent processes or other applications),导致陷入了一种死循环 (leading to a death loop). This significantly impacts system CPU, Memory, IO, and other resources.
For example, below is the result after a Monkey test—QQ gets频繁被杀和重启 (frequently killed and restarted) in a short time.
1 | 07-23 14:32:16.969 1435 3420 I am_proc_bound: [0,30387,com.tencent.mobileqq] |
In the corresponding Systrace - SystemServer, you can see AM频繁杀QQ和起QQ (frequently killing and starting QQ):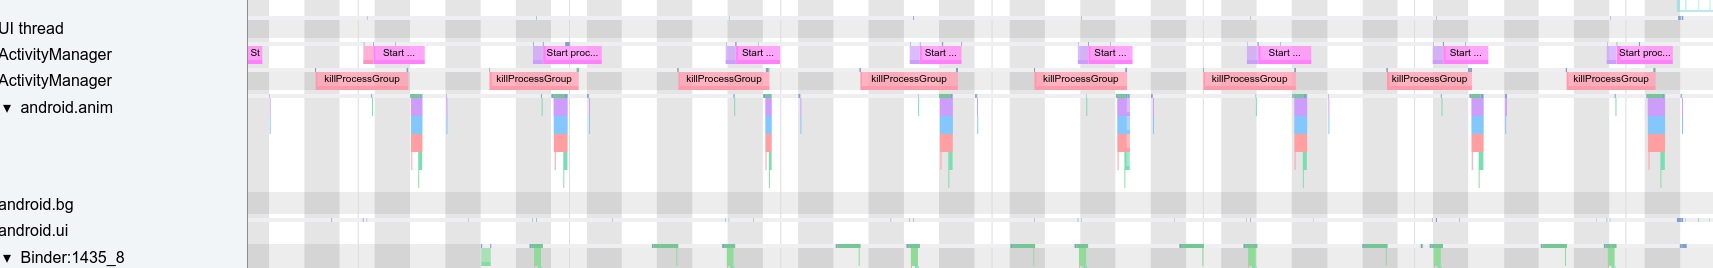
The Kernel portion of this Trace also shows busy CPU: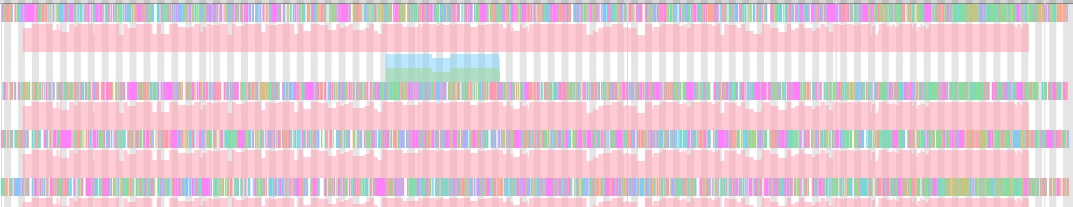
Impact on Memory Allocation and Triggering IO
After prolonged aging use, the phone experiences整机卡顿一下 (system-wide jank) or整体比刚刚开机的时候操作要慢 (overall slower operation than right after boot). This may be due to triggered memory reclamation or block IO, which are often related. Memory reclamation may trigger fast path reclamation, kswapd reclamation, direct reclaim reclamation, LMK process killing reclamation, etc. (fast path reclamation doesn’t perform writeback).
Reclaimed content is anonymous page swapout or file-backed page writeback and clearing. (Assuming手机都是swap file都是内存 (phones use swap files in memory, not disk)). Anything involving files may trigger IO operations, increasing block IO probability.
More commonly: opening previously opened applications isn’t as fast as the first time—needing to load or卡一段时间 (stutter for a while). This may have triggered do_page_fault. This path frequently shows block IO in wait_on_page_bit_killable(). If it’s swapout memory, it needs swapin. If it’s a regular file, it needs read out in pagecache/disk.
do_page_fault → lock_page_or_retry → wait_on_page_bit_killable checks if the page has the PG_locked bit set. If set, it blocks until PG_locked is cleared. The PG_locked flag is cleared only at writeback start and I/O read completion. The readahead to pagecache functionality also affects block IO—too large increases blocking probability.
Examples
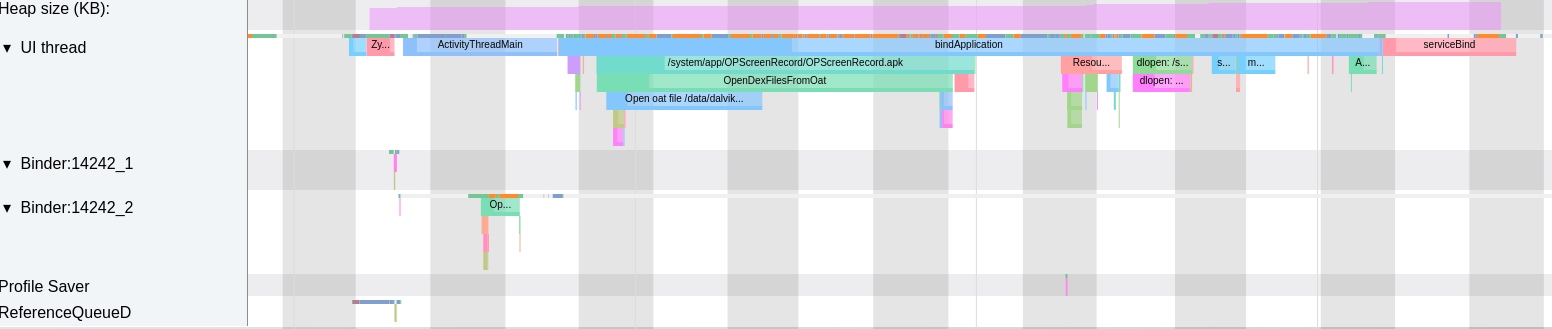
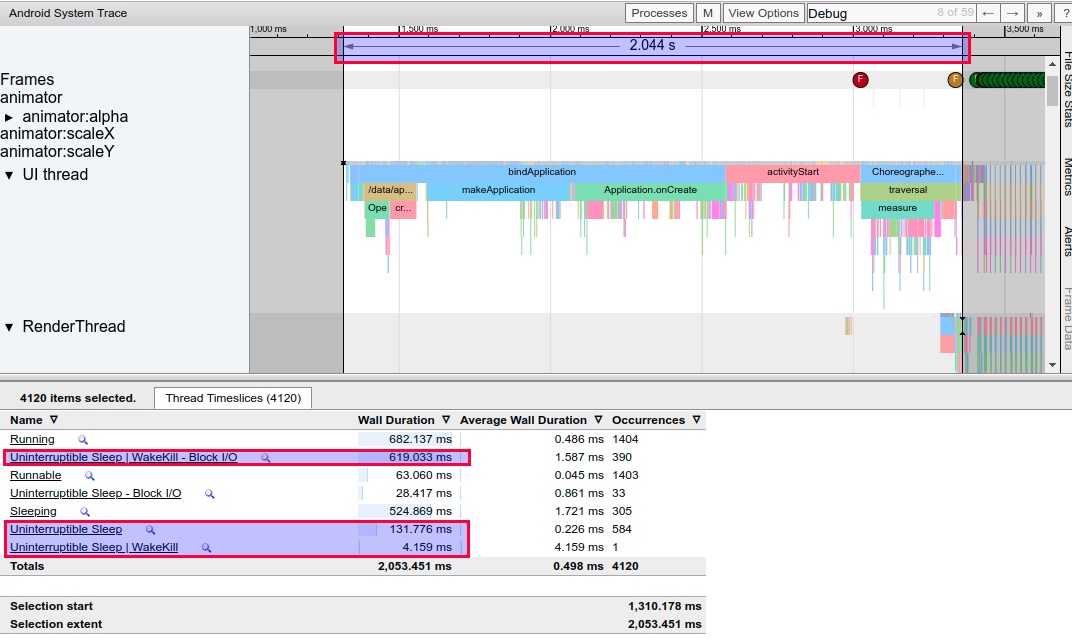
The following Trace is a冷启动 (cold start) of an app抓取 (captured) under low memory conditions. We only take the portion from app launch to first frame display—total耗时 (duration) 2s.
You can see its Running total time is 682 ms.
Startup Under Low Memory
Under low memory, this app from bindApplication to first frame display花费了 (took) 2s. From the Thread information below:
Uninterruptible Sleep | WakeKill - Block I/OandUninterruptible Sleep这两栏总共花费 (these two columns总共花费) ~750 ms (对比下面正常情况才130 ms (compared to only 130 ms under normal conditions below))- Running time is ~600 ms (对比下面正常情况才624 ms (compared to 624 ms under normal conditions below),相差不大 (not much difference))
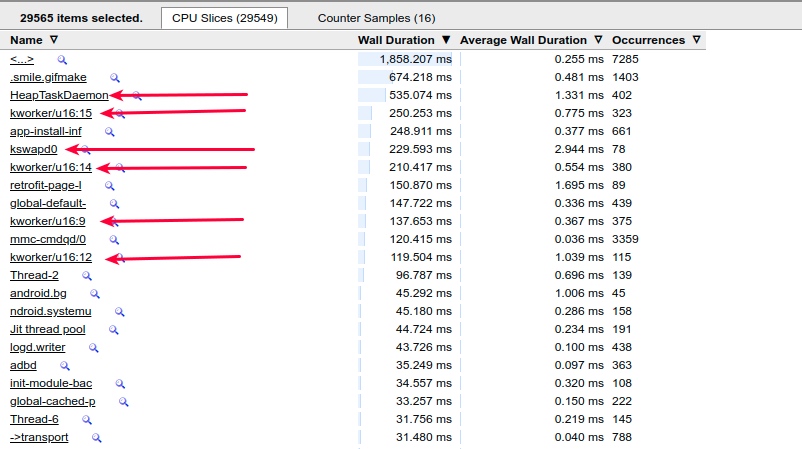
From CPU usage during this period, besides HeapTaskDaemon running较多 (more), other memory and IO-related processes are also非常多 (very numerous), like several kworker and kswapd0.
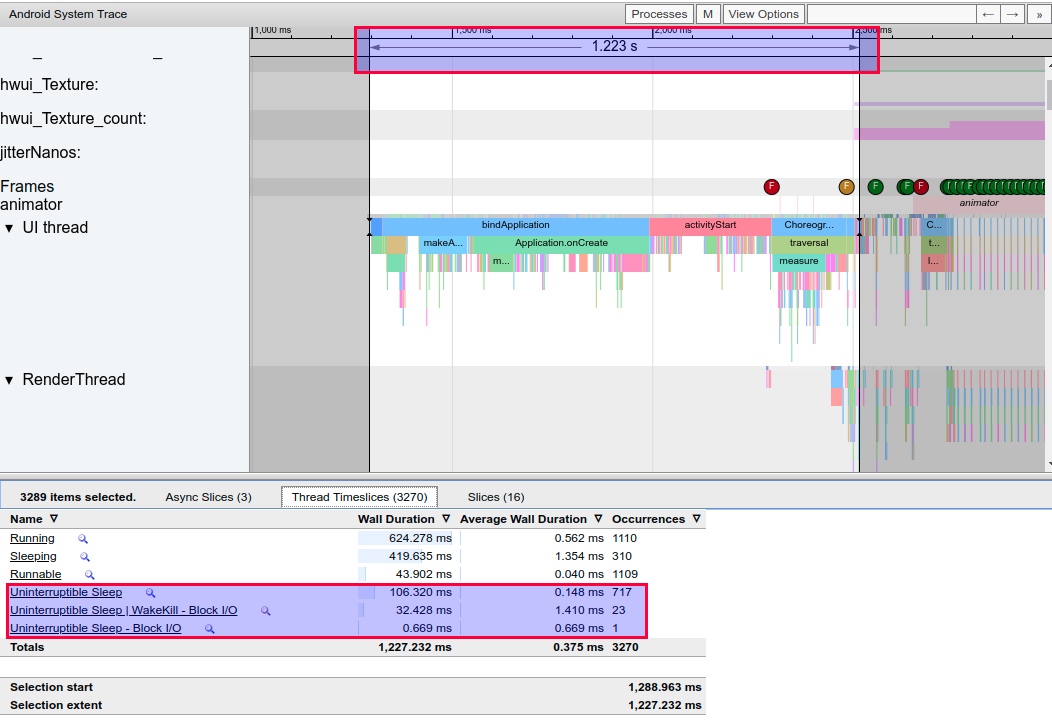
Startup Under Normal Memory
Under normal memory, this app from bindApplication to first frame display只需要 (only needs) 1.22s. From the Thread information below:
Uninterruptible Sleep | WakeKill - Block I/OandUninterruptible Sleep这两栏总共才 (these two columns总共才) 130 ms.- Running time is 624 ms.
From CPU usage during this period, besides HeapTaskDaemon running较多 (more), other memory and IO-related processes are非常少 (very few).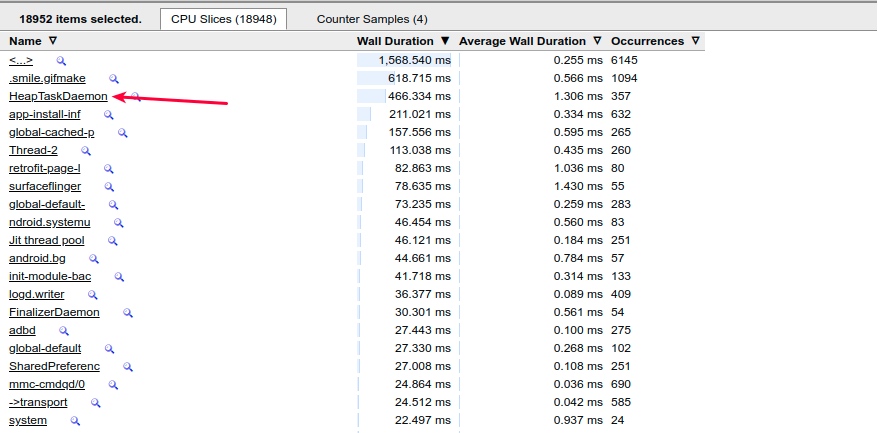
Possible Optimization Solutions (from practical experience and expert sharing)
The following列举的只是一些经验之谈 (listed are just一些经验之谈).具体问题还是得具体分析 (specific problems require specific analysis). On the Android platform,三方应用的管控 (third-party app management) is非常重要 (very important). Many小白用户 (novice users) have一大堆常驻通知和后台服务 (a bunch of persistent notifications and background services),导致这些App的优先级非常高 (causing these apps to have very high priority),很难被杀掉 (hard to kill).导致整机的内存长时间比较低 (causing device memory to remain low for long periods). So after必要的系统优化 (necessary system optimization), focus on三方应用的查杀和管控逻辑 (third-party app killing and management logic),尽量减少后台进程的个数 (minimize background process count),在必要的时候 (when necessary),清理掉无用的进程来释放内存个前台应用使用 (clean up useless processes to release memory for foreground apps).
- Increase
extra_free_kbytesvalue - Increase disk I/O read/write rates, e.g., use UFS 3.0, solid-state drives
- Avoid setting too large
read_ahead_kbvalues - Use cgroup’s blkio to limit background process IO read operations, shortening foreground IO response time
- Perform memory reclamation提前 (in advance), avoiding users encountering it during app usage and perceiving slight jank
- Increase LMK efficiency, avoiding无效的kill (ineffective kills)
kswapd周期性回收更多的high水位 (periodically reclaim more high watermarks)- Adjust
swappinessto balance pagecache and swap - Strategy: Implement特殊策略 (special strategies) for low-memory devices, e.g., more激进杀进程 (aggressive process killing) (this降低用户体验 (reduces user experience), so balance performance and user experience)
- Strategy: When内存不足 (memory insufficient), remind users (or not) to kill unnecessary background processes
- Strategy: When内存严重不足且无法恢复 (memory severely insufficient and unrecoverable), prompt users to restart phone
Optimizing for low memory requires balancing system control and user experience. Managing third-party apps—many of which use aggressive keep-alive and background services—is crucial.
- Tune
extra_free_kbytes: Increase the threshold for memory reclamation. - Increase Disk I/O Speeds: Use UFS 3.0 or better storage hardware.
- Optimize
read_ahead_kb: Avoid excessively high values that increase block probability. - Cgroup blkio: Use cgroups to limit background I/O, prioritizing foreground responsiveness.
- Proactive Reclamation: Reclaim memory before the user interacts with the app.
- LMK Efficiency: Ensure LMK kills the most effective targets to avoid “death-restart” loops.
- Refine
swappiness: Balance anonymous page swapping vs. file cache clearing. - OEM Policies: Implement more aggressive process management on low-RAM devices.
- User Education: Suggest restarting the phone or clearing background apps when memory is critically low.
References
- https://blog.csdn.net/qkhhyga2016/article/details/79540119
- https://blog.csdn.net/zsj100213/article/details/82427527
Zhihu Version of This Article
Since blog comments aren’t convenient for discussion, you can visit the Zhihu version of this article for likes and交流:
知乎 - Android 中的卡顿丢帧原因概述 - 低内存篇
About Me && Blog
Below is my personal introduction and related links. I look forward to exchanging ideas with fellow professionals. “When three people walk together, one must be my teacher!”
- Blogger Introduction : Contains personal WeChat and WeChat group links.
- Blog Content Navigation : A navigation guide for my blog content.
- Curated Excellent Blog Articles - Android Performance Optimization Must-Knows : Welcome self-recommendations and recommendations (WeChat private chat is fine).
- Android Performance Optimization Knowledge Planet : Welcome to join, thanks for your support!
One walks faster alone, but a group walks further together.