Different people have different understandings of smoothness (jank/dropped frames) and different perceptions of jitter thresholds. Therefore, before starting this series, it is necessary to clarify the content to avoid misunderstandings. Here are some basic explanations:
- For mobile users, jank encompasses many scenarios: dropped frames when scrolling lists, excessive white screen during app startup, slow screen wake-up when pressing the power button, unresponsive interface followed by a crash, no response when clicking an icon, incoherent window animations, lagging touch response, or stuttering when entering the desktop after a reboot. These scenarios differ slightly from what developers understand as “jank.” Developers categorize these more finely, which is a cognitive gap between developers and users that must be noted when handling feedback from users or testers.
- For developers, the above scenarios fall into three major categories: Smoothness (dropped frames in lists, incoherent animations, stuttering desktop entry), Responsiveness (long startup white screens, slow screen wake-up, lagging touch), and Stability (unresponsive interface/crashes, no response to icon clicks). This classification is used because each category requires different analysis methods and steps. Quickly identifying the category is crucial.
- Technically, Smoothness, Responsiveness, and Stability (ANR) all feel like “jank” to users because their underlying principles are identical: the main thread’s Message exceeds its processing deadline. They are simply categorized by different timeout thresholds. Understanding these problems requires knowledge of basic system operation mechanisms, which this article will introduce.
- This series primarily analyzes smoothness-related issues. Responsiveness and stability will be covered in dedicated articles. Understanding smoothness first will make analyzing responsiveness and stability much easier.
- This series focuses on using Systrace (Perfetto) for analysis. Systrace is our entry point because many factors affect smoothness—some within the app itself and others within the system. Systrace (Perfetto) provides a holistic view of the system’s operation during the problem, helping us initially pinpoint the root cause.
Table of Contents
- What Do the Frame Colors in Systrace Mean?
- No Red Frame Means No Dropped Frame?
- Why Does the Main Thread Wait for the Render Thread?
- Why Doesn’t It Jank When Swiping Without Releasing?
- If It Doesn’t Jank, How Do We Measure Performance?
- Why Can’t I See Jank in Screen Recordings?
- Series Articles
- Attachments
- About Me && Blog
Systrace Series Articles:
- Introduction to Systrace
- Systrace Basics - Prerequisites for Systrace
- Systrace Basics - Why 60 fps?
- Android Systrace Basics - SystemServer Explained
- Systrace Basics - SurfaceFlinger Explained
- Systrace Basics - Input Explained
- Systrace Basics - Vsync Explained
- Systrace Basics - Vsync-App: Detailed Explanation of Choreographer-Based Rendering Mechanism
- Systrace Basics - MainThread and RenderThread Explained
- Systrace Basics - Binder and Lock Contention Explained
- Systrace Basics - Triple Buffer Explained
- Systrace Basics - CPU Info Explained
- Systrace Smoothness in Action 1: Understanding Jank Principles
- Systrace Smoothness in Action 2: Case Analysis - MIUI Launcher Scroll Jank Analysis
- Systrace Smoothness in Action 3: FAQs During Jank Analysis
- Systrace Responsiveness in Action 1: Understanding Responsiveness Principles
- Systrace Responsiveness in Action 2: Responsiveness Analysis - Using App Startup as an Example
- Systrace Responsiveness in Action 3: Extended Knowledge on Responsiveness
- Systrace Thread CPU State Analysis Tips - Runnable
- Systrace Thread CPU State Analysis Tips - Running
- Systrace Thread CPU State Analysis Tips - Sleep and Uninterruptible Sleep
If you are not familiar with the basic use of Systrace (Perfetto), please catch up on the Systrace Basics Series first. This article assumes you are already familiar with using Systrace (Perfetto).
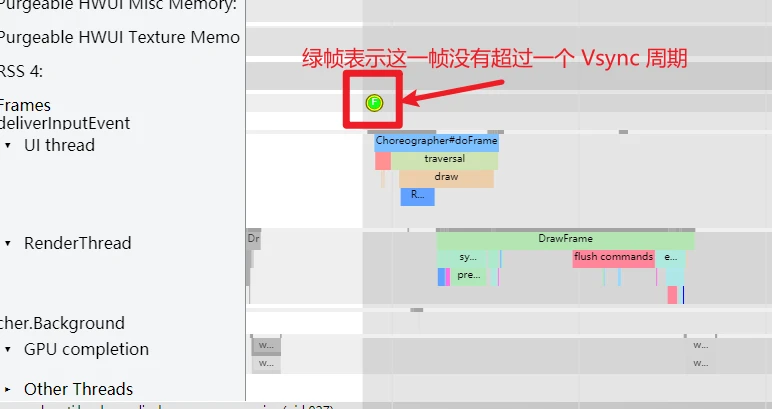
What Do the Frame Colors in Systrace Mean?
Frame markers are the circles found on the app’s UI thread area. There are three colors, each indicating the time spent on that frame.
Clicking a circle highlights the corresponding UI and Render thread tasks (graying out everything else).
Green Frame
The most common, indicating the frame finished within a single Vsync cycle.
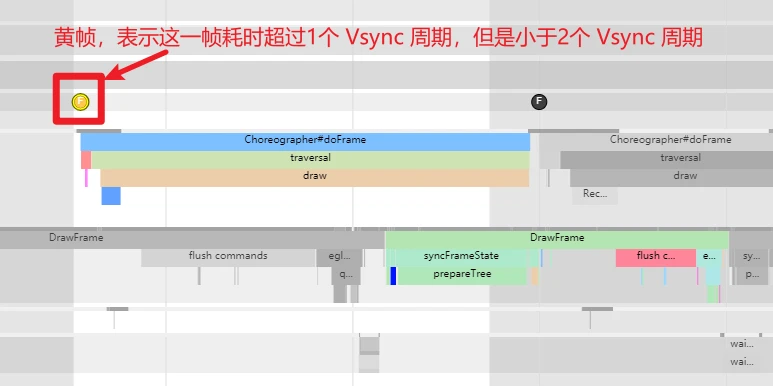
Yellow Frame
Indicates the frame took longer than 1 Vsync cycle but less than 2. Yellow frames suggest potential performance issues that might lead to user-perceived jank.
Red Frame
Indicates the frame took longer than 2 Vsync cycles. Red frames strongly suggest performance issues that are very likely to cause visible jank.
No Red Frame Means No Dropped Frame?
Not necessarily. Judging actual jank requires looking at SurfaceFlinger, not the App traces. This requires the foundational knowledge from Triple Buffer Explained.
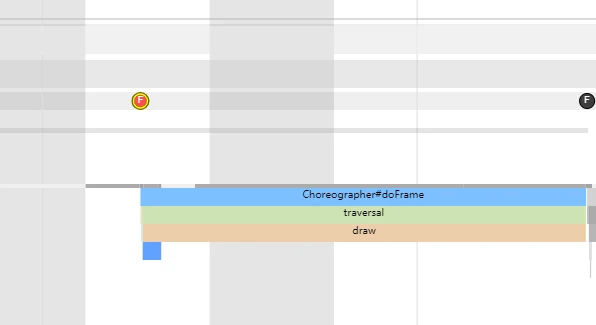
Yellow Frame Without Jank
As noted, yellow frames mean the frame exceeded a cycle. However, thanks to Triple Buffering (and even more buffers on modern high-refresh devices), an App-side delay doesn’t always translate to an SF-side jank.
Yellow Frame With Jank
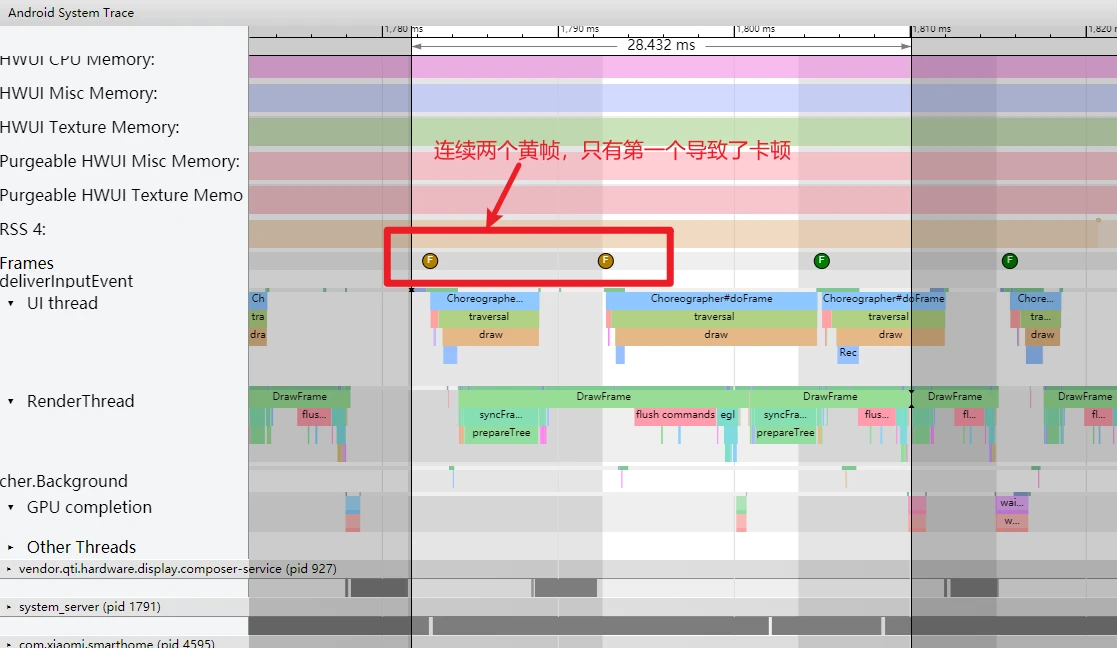
In the Mi Launcher case analyzed in Part 2, there were only yellow frames. Two consecutive yellow frames occurred; the first caused a visible jank, while the second did not.
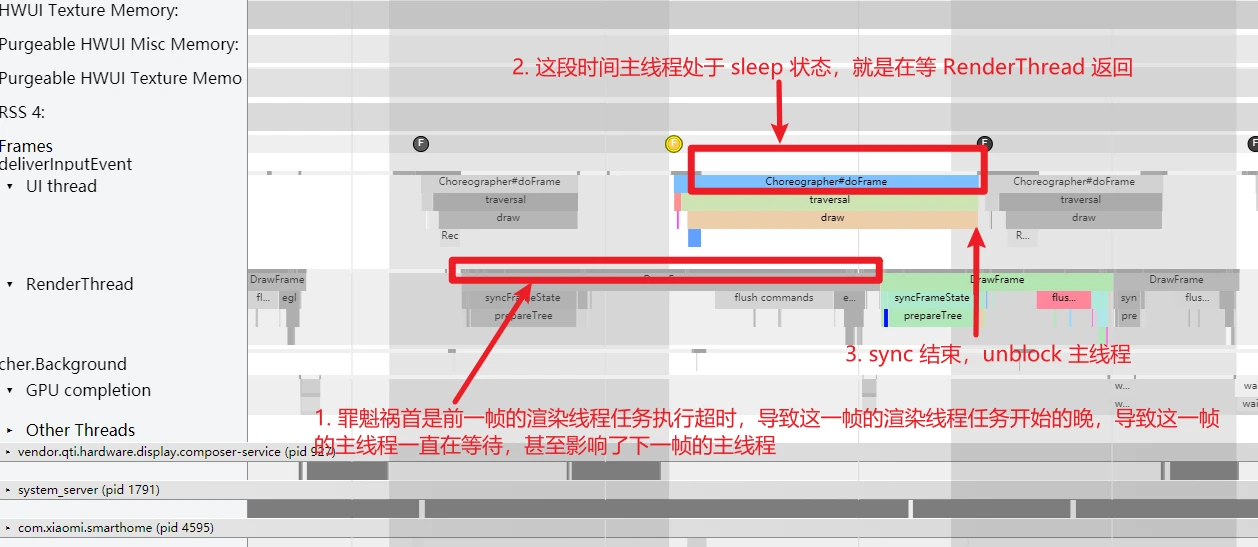
Why Does the Main Thread Wait for the Render Thread?
Looking at the two yellow frames from the Mi trace, notice the UI Thread in the second yellow frame spent a lot of time waiting. Don’t mistake this for a UI thread bottleneck; it was in a “Sleep” state.
As explained in MainThread and RenderThread Explained, the UI thread must wait for the Render thread to finish syncFrameState before it is unblocked. In this case, the previous frame’s Render thread timeout caused the current frame’s Render thread task to queue, which in turn kept the UI thread waiting.
Why Doesn’t It Jank When Swiping Without Releasing?
In the desktop swipe scenario, jank occurred only after the finger was released. Swiping while holding never janked. Why?
If you don’t release, the CPU maintains a continuous Boost state, and RenderThread tasks are scheduled on Big Cores (CPUs 4-6) rather than Small Cores. Naturally, no jank occurs.
This PerfLock Boost timeout is typically 120ms (varies by model).
If It Doesn’t Jank, How Do We Measure Performance?
If a scenario feels smooth on both devices, how do we compare performance?
Use adb shell dumpsys gfxinfo as follows:
- Identify the package and prepare the app.
- Run
adb shell dumpsys gfxinfo <package> framestats reset2-3 times to clear history. - Perform the operation (e.g., swiping).
- Run
adb shell dumpsys gfxinfo <package> framestats. - Focus on:
- Janky frames: Number of frames exceeding a cycle (not always perceived as jank).
- 95th percentile: Frame time at the 95th percentile.
- HISTOGRAM: Distribution of frame times.
- PROFILEDATA: Raw details for every frame.
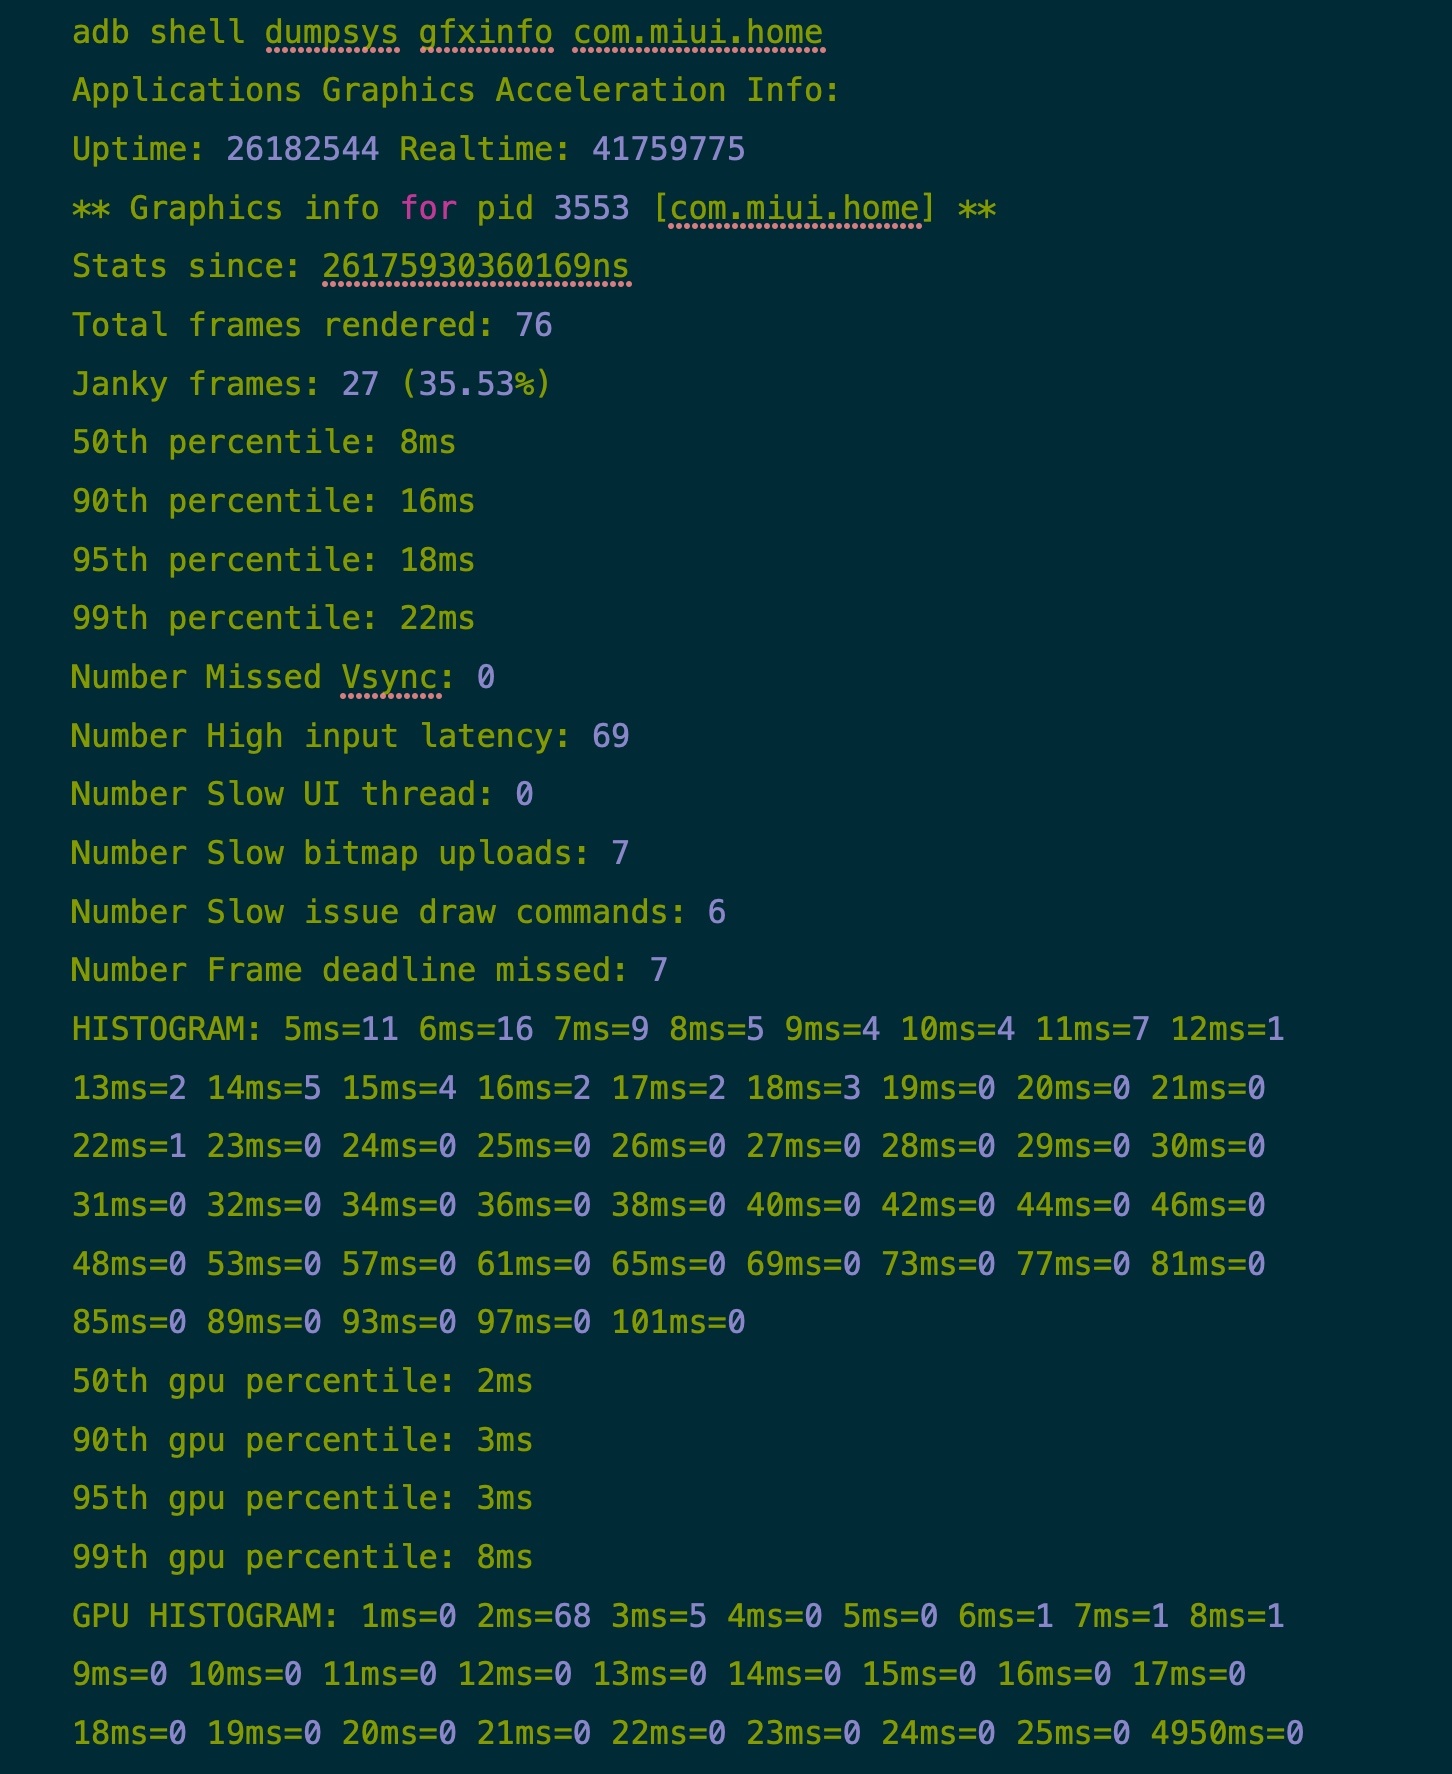
Comparing Mi 10 Pro vs. Oppo Reno 5 Pro (both at 90 fps target):
Mi 10 Pro - 90 fps
Oppo Reno 5 - 90 fps
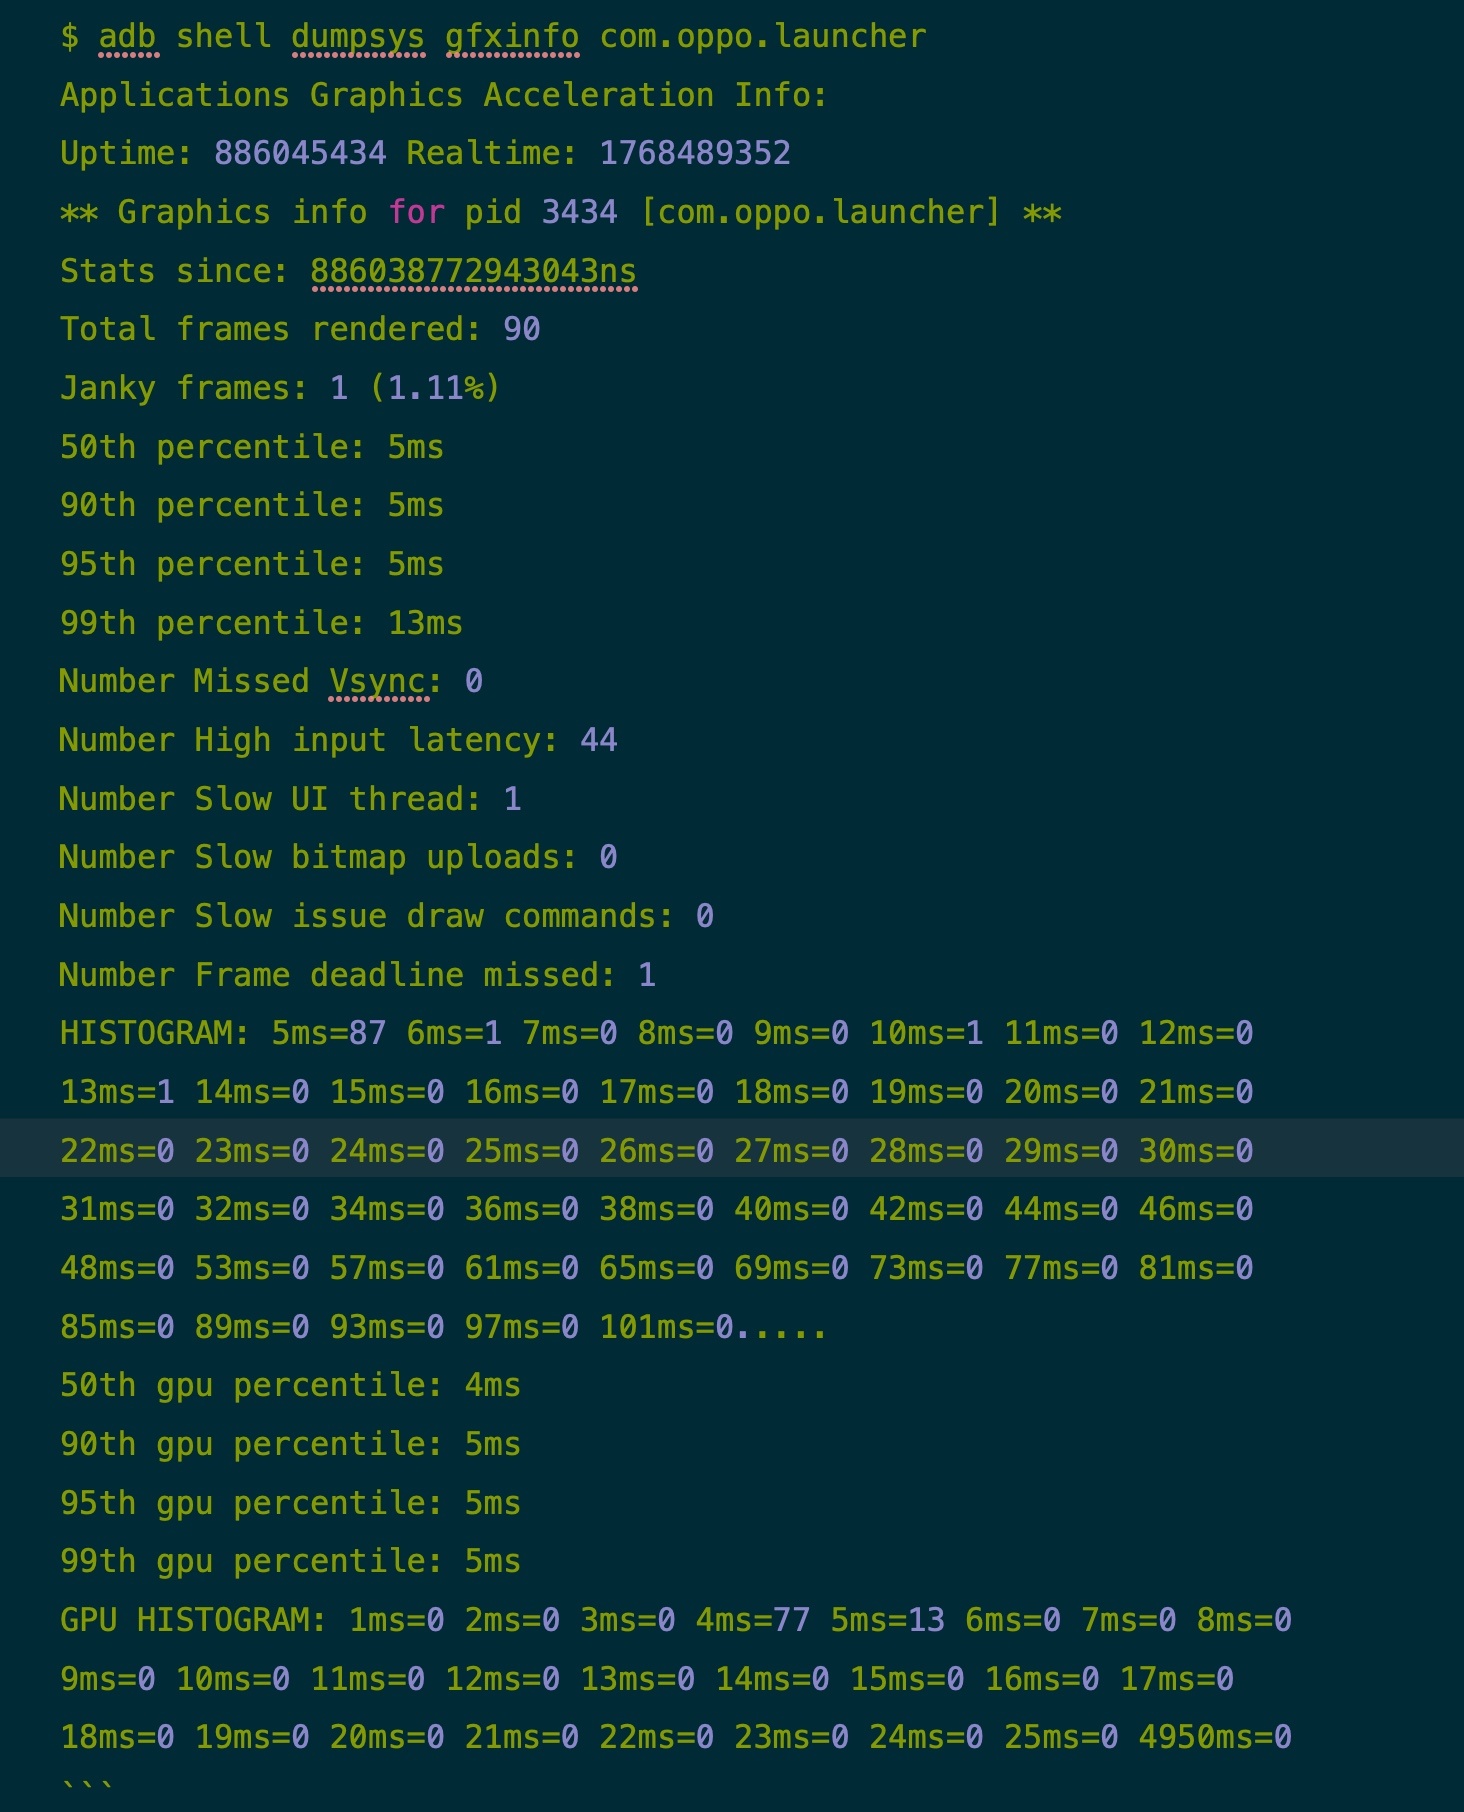
Comparisons show Mi 10 Pro performance is actually weaker in this specific scenario:
- Janky frames:
- Mi: 27 (35.53%)
- Oppo: 1 (1.11%)
- 95th percentile:
- Mi: 18ms
- Oppo: 5ms
Interestingly, while the Mi 10 Pro has a much stronger GPU (Snapdragon 865), its GPU stats are better, confirming the bottleneck in this scenario is CPU, not GPU.
Why Can’t I See Jank in Screen Recordings?
Several reasons:
- If you record a 90Hz screen at 60Hz, the recording will appear smooth even if 90Hz jank occurs (this applies to external camera recordings too).
- If you record at 90Hz but playback on a 60Hz device (e.g., viewing an Mi recording on a standard PC/phone), the player downsamples to 60Hz, hiding the jank.
Series Articles
- Systrace Smoothness in Action 1: Understanding Jank Principles
- Systrace Smoothness in Action 2: Case Analysis - MIUI Launcher Scroll Jank Analysis
- Systrace Smoothness in Action 3: FAQs During Jank Analysis
Attachments
Attachments are on GitHub: https://github.com/Gracker/SystraceForBlog/tree/master/Android_Systrace_Smooth_In_Action
xiaomi_launcher.zip: Main analysis trace.xiaomi_launcher_scroll_all_the_time.zip: Continuous scrolling trace.oppo_launcher_scroll.zip: Comparison trace.
About Me && Blog
Below is my personal intro and related links. I look forward to exchanging ideas with fellow professionals. “When three walk together, one can always be my teacher!”
- Blogger Intro: Includes personal WeChat and WeChat group links.
- Blog Content Navigation: A guide for my blog content.
- Curated Excellent Blog Articles - Android Performance Optimization Must-Knows: Welcome to recommend projects/articles.
- Android Performance Optimization Knowledge Planet: Welcome to join and thank you for your support~
One walks faster alone, but a group walks further together.