When discussing Android performance, Jank, Responsiveness, and ANR are usually grouped together because their causes are similar. They are simply categorized based on severity: Jank, Slow Response, and ANR. We can define “Broad Jank” to include all three. If a user reports that a phone or App is “stuttering,” they are likely referring to Broad Jank, and we must identify which specific issue is occurring.
If it’s stuttering during animation or list scrolling, we define it as Narrow Jank (referred to as Jank). If it’s slow app startup, slow screen wake-up, or slow scene switching, we define it as Slow Responsiveness (referred to as Slow). If it’s an ANR, it’s an Application Not Responding issue. Each situation requires different analysis and resolution methods.
Furthermore, within Apps or manufacturers, Jank, Responsiveness, and ANR have individual metrics like Frame Drop Rate, Startup Speed, and ANR Rate. Mastering the analysis and optimization of these issues is crucial for developers.
This is the first article in the Responsiveness series, focusing on theoretical knowledge, including an overview of performance engineering, key responsiveness concepts, and analysis methodologies.
Table of Contents
- Performance Engineering
- Responsiveness Overview
- Methodology for Analyzing Responsiveness Issues
- Series Articles
- References
- About Me && Blog
For articles on Jank, refer to Systrace Smoothness in Action 1: Understanding Jank Principles. ANR articles will follow. This article focuses on the basic principles of responsiveness.
If you are not familiar with the basic use of Systrace (Perfetto), please catch up on the Systrace Basics Series first. This article assumes you are already familiar with using Systrace (Perfetto).
Performance Engineering
Before introducing responsiveness principles, here is a passage from the book “Systems Performance” regarding performance. This methodology aligns perfectly with our topic and is highly recommended as a handbook for performance optimization engineers:
Performance is Challenging
Systems performance engineering is a challenging field for many reasons, including the facts that system performance is subjective, complex, and often characterized by multiple concurrent issues.
Performance is Subjective
- Technical disciplines are often objective; many in the industry view problems as black or white. In software troubleshooting, deciding whether a bug exists or is fixed is usually clear-cut. Bugs are accompanied by error messages that are often easy to interpret, leading you to understand why the error occurred.
- In contrast, performance is often subjective. When starting on a performance issue, judging whether a problem even exists can be ambiguous, and the same applies when it is fixed. What one user considers “poor” performance, another might consider “good.”
Systems are Complex
- Besides subjectivity, performance engineering is challenging because systems are complex and often lack a clear starting point for analysis. We often begin with guesses—blaming the network, for example—and performance analysis must determine if that is a correct direction.
- Performance issues can arise from complex interconnections between subsystems, even when those subsystems perform well in isolation. They can also result from cascading failures, where one failing component causes performance issues in others. To understand these, you must untangle component relationships and how they collaborate.
- Bottlenecks are often complex and interconnected in unexpected ways. Fixing one issue might simply push the bottleneck elsewhere, resulting in no overall performance gain.
- Additionally, the complexity of production workloads can cause issues that are difficult to reproduce in a lab or occur only intermittently.
- Solving complex performance problems often requires a holistic approach. The entire system—including internal and external interactions—may need investigation. This work demands a broad skill set, rarely found in one person, making performance engineering a dynamic and intellectually challenging endeavor.
Multiple Issues May Coexist
- Finding a single performance issue is often not the end; complex software usually has multiple problems.
- Another difficulty: the real task isn’t just finding problems, but identifying which ones are the most significant.
- To do this, performance analysis must quantify the importance of issues. Some problems may not apply to your workload or only to a small degree. Ideally, you should not only quantify the problem but also estimate the speedup expected after fixing it. This information is especially useful when management reviews engineering or operations resource allocation.
- One metric is particularly well-suited for quantifying performance: latency.
– Excerpts from “Systems Performance: Enterprise and the Cloud” (paraphrased)
Systrace Series Articles:
- Introduction to Systrace
- Systrace Basics - Prerequisites for Systrace
- Systrace Basics - Why 60 fps?
- Android Systrace Basics - SystemServer Explained
- Systrace Basics - SurfaceFlinger Explained
- Systrace Basics - Input Explained
- Systrace Basics - Vsync Explained
- Systrace Basics - Vsync-App: Detailed Explanation of Choreographer-Based Rendering Mechanism
- Systrace Basics - MainThread and RenderThread Explained
- Systrace Basics - Binder and Lock Contention Explained
- Systrace Basics - Triple Buffer Explained
- Systrace Basics - CPU Info Explained
- Systrace Smoothness in Action 1: Understanding Jank Principles
- Systrace Smoothness in Action 2: Case Analysis - MIUI Launcher Scroll Jank Analysis
- Systrace Smoothness in Action 3: FAQs During Jank Analysis
- Systrace Responsiveness in Action 1: Understanding Responsiveness Principles
- Systrace Responsiveness in Action 2: Responsiveness Analysis - Using App Startup as an Example
- Systrace Responsiveness in Action 3: Extended Knowledge on Responsiveness
Responsiveness Overview
Responsiveness is a critical metric for App performance. Poor responsiveness typically manifests as delayed click effects, operation wait times, or prolonged white screens. Primary scenarios include:
- App startup scenarios: Cold start, hot start, warm start, etc.
- Interface transition scenarios: Page jumps within an App, or between different Apps.
- Non-transition click scenarios: Toggles, pop-ups, long presses, control selections, single/double clicks, etc.
- Screen wake/sleep, power on/off, unlocking, facial recognition, camera, video loading, etc.
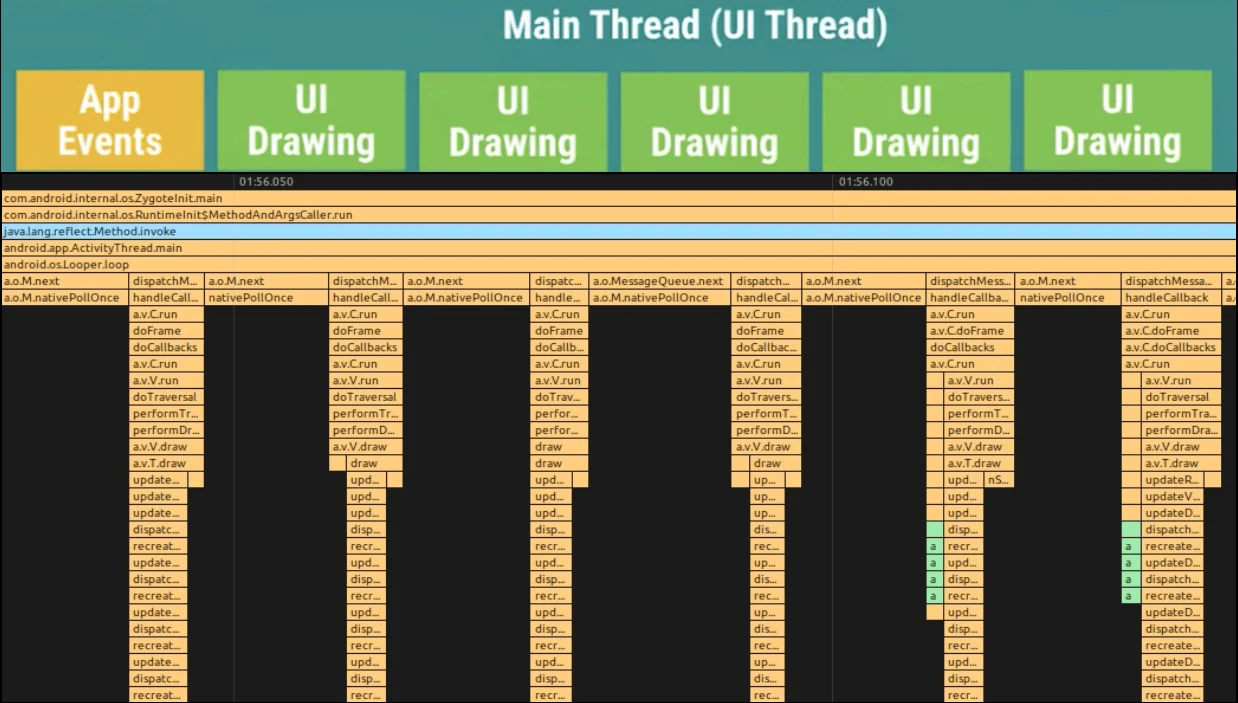
Principle-wise, responsiveness scenarios are often triggered by an input event (as a Message to the processing UI thread) and end with the completion of one or more Messages, usually involving critical UI drawing. We measure responsiveness from the trigger event to the completion of processing; this duration is called the Response Time.
As shown below, responsiveness issues occur when one or more of these Messages take longer than expected (subjective), resulting in a completion time exceeding what the user anticipates.
Since responsiveness is subjective (unlike jank, which is binary), different roles have different criteria. For example, system developers, app developers, and testers have different view on App Cold Start boundaries:
- System Developers: Observe from the input interrupt, often ending at the app’s first frame (easy to calculate) or complete loading (subjective and harder to measure without standardized tools). They focus on holistic optimization (input delivery,
SystemServer,SurfaceFlinger, Kernel, Launcher, etc.). - App Developers: Observe from Application
onCreateorattachContext, usually ending at a fully loaded or interactive state. They can add custom markers in their code and focus on improving their own app’s logic. Most “startup optimization” tutorials focus here. - Testers: Focus on the real user experience. The start is the icon highlight upon clicking the launcher; the end is complete content loading. They usually use high-speed cameras + automation with robotic arms and image recognition to standardize measurements.
Methodology for Analyzing Responsiveness Issues
Define the Start and End Points
The most important step is finding the start and end points. As noted, these vary by role and are subjective. Standardize these boundaries and metrics with all stakeholders using these methods:
- Competitor Analysis: Use a baseline competitor device or App. Under identical conditions, how long does the competitor take from click to response?
- Regression Analysis: Compare against previous system or App versions to ensure no regression.
The start point is usually easy (click or trigger event). The end point is trickier—e.g., when is a complex App like Taobao “fully loaded”? Systrace’s first frame, Displayed log, or onWindowFocusChange are often inaccurate. High-speed cameras with image recognition is the current industry standard.
Common Responsiveness Issues
Android System Issues Causing Slowness
These relate to the device’s hardware performance and system tuning. The weaker the device, the more likely these occur. Key signatures in App-side Systrace:
- Insufficient CPU Frequency
- App Signature: UI Thread is “Running,” but execution time is longer.
- CPU Core Scheduling: Critical tasks on Small Cores
- App Signature: UI Thread is “Running” in Systrace, but execution is slow.
- Busy SystemServer, affecting:
- Binder call processing latency.
- App Signature: UI Thread is “Sleep,” waiting for Binder return.
- Startup logic processing delay.
- App Signature: UI Thread is “Sleep,” waiting for Binder return.
- Binder call processing latency.
- Busy SurfaceFlinger, affecting Render Thread
dequeueBuffer/queueBuffer- App Signature: Render Thread is in a Binder wait state during buffer operations.
- Low Memory, which often triggers these issues affecting both SystemServer and Apps:
- Frequent app killing and restarting. Startup is a heavy operation that consumes CPU, delaying the foreground App.
- App Signature: UI Thread has more “Runnable” states and less “Running,” increasing total function time.
- Frequent Garbage Collection (GC).
HeapTaskDeamonandkswapd0tasks for memory reclamation are frequent.- App Signature: More “Runnable,” less “Running,” increased function time.
- Increased Disk IO. Disk IO is slow; the UI Thread may spend significant time in Uninterruptible Sleep.
- App Signature: UI Thread has more “Uninterruptible Sleep” and “Uninterruptible Sleep - IO” states.
- Frequent app killing and restarting. Startup is a heavy operation that consumes CPU, delaying the foreground App.
- Thermal Throttling: CPU max frequency capped due to heat
- App Signature: UI Thread is “Running,” but execution is slow.
- Overall System Load: Multiple heavy processes or one 100% CPU process
- App Signature: CPU zone is saturated. UI and Render threads are mostly “Runnable” or frequently switching between “Runnable” and “Running.”
App-Specific Issues
Primarily component, View, and data initialization during startup:
Application.onCreate: App logic + Third-party SDK initialization.- Activity Lifecycle:
onStart,onCreate,onResumetimeouts. - Service Lifecycle timeouts.
- Broadcast
onReceivetimeouts. - ContentProvider initialization (often abused).
- Layout initialization:
measure,layout,drawdelays. - Render Thread initialization:
setSurface,queueBuffer,dequeueBuffer,Textureupload, etc. - Activity Jump: Time from
SplashActivitytoMainActivity. - Heavy Messages posted to the UI thread.
- UI/Render thread waiting for worker thread data.
- UI/Render thread waiting for sub-process data.
- UI/Render thread waiting for network data.
- Binder call timeouts.
- WebView initialization.
- First-run JIT (Just-In-Time) compilation.
Analysis Routine (Mainly Systrace)
- Confirm prerequisites (device aging, data volume, downloads), steps, and phenomena. Reproduce locally.
- Define metrics:
- What is the start time?
- What is the end time?
- Capture logs (Systrace, standard logs, etc.).
- Use Systrace to pinpoint differences:
- Compare App bottleneck sections against a baseline device. Segment the startup phase:
- Application Creation
- Activity Creation
- First
doFrame - Subsequent Content Loading
- Custom App Messages
- Analyze specific bottlenecks:
- Function execution is slow (Running) –> App Issue
- Long “Running” periods without stacks –> App Issue; add TraceTags or use TraceView
- Long Binder wait (Sleep) –> Check Binder Server/SystemServer
- Waiting for worker thread (Sleep) –> App Issue; check “Wakeup” info for the thread
- Waiting for sub-process/provider (Sleep) –> App Issue; check “Wakeup” for the process/provider
- Excessive “Runnable” –> System Issue; CPU is saturated
- Excessive IO wait (Uninterruptible Sleep | WakeKill - Block I/O) –> System Low Memory
- RenderThread
dequeueBuffer/queueBufferdelays –> Check SurfaceFlinger
- If it’s a system issue, check relevant system zones (reference common causes above):
- Kernel Zone
- Critical tasks on Small Cores (e.g., 0-3).
- Frequencies not capped at max (e.g., 1.8GHz vs 2.8GHz).
- CPU saturation (no gaps between tasks on 8 cores).
- Low Memory Indicators: Frequent
Uninterruptible Sleep,HeapTaskDeamon, orkswapd0.
- SystemServer Zone
- Input reading/dispatch anomalies (rare).
- Binder logic timeouts.
- AM/WM lock contention (use Wakeup info to trace lockers).
- Frequent process starts/kills (check
startProcessor Event Log).
- SurfaceFlinger Zone
- Binder processing delays for buffer calls.
- Main thread busy with unrelated tasks.
- Launcher Zone (Startup scenarios)
- Input event handling delay.
onPausedelay.- Startup animation jank.
- Kernel Zone
- Compare App bottleneck sections against a baseline device. Segment the startup phase:
- Post-initial analysis:
- If it’s a system issue, can the App avoid it? If not, escalate to the system team.
- If it’s an App issue, use TraceView (Android Studio Profiler), SimplePerf, or the TraceFix Plugin for detailed function traces and comparison.
- Address multiple causes:
- Optimize the major bottlenecks first. Ignore minor ones initially.
- Some require system/App co-optimization (e.g., App vendors using phone manufacturer SDKs like those from Oppo, Huawei, Vivo).
- If minor or unsolvable, document and communicate with Test teams.
- Check if it’s a duplicate or platform-specific cross-issue in the Bug database.
This article provides a foundation for responsiveness knowledge. It involves significant system-level details; please review the Systrace Basics Series for depth.
Series Articles
- Systrace Responsiveness in Action 1: Understanding Responsiveness Principles
- Systrace Responsiveness in Action 2: Responsiveness Analysis - Using App Startup as an Example
- Systrace Responsiveness in Action 3: Extended Knowledge on Responsiveness
- Link to Systrace Basics Series
References
- Analysis of Android App Startup Flow
- Investigation: Can App Startup Really Reduce Startup Time?
- Jetpack App Startup Explained
- App Startup Official Guide
- Complete Record of Android App Startup Optimization
- Android Application Profiling
About Me && Blog
Below is my personal intro and related links. I look forward to exchanging ideas with fellow professionals. “When three walk together, one can always be my teacher!”
- Blogger Intro: Includes personal WeChat and WeChat group links.
- Blog Content Navigation: A guide for my blog content.
- Curated Excellent Blog Articles - Android Performance Optimization Must-Knows: Welcome to recommend projects/articles.
- Android Performance Optimization Knowledge Planet: Welcome to join and thank you for your support~
One walks faster alone, but a group walks further together.