When discussing Android performance, Jank, Responsiveness, and ANR are usually grouped together because their causes are similar. They are simply categorized based on severity: Jank, Slow Response, and ANR. We can define “Broad Jank” to include all three. If a user reports that a phone or App is “stuttering,” they are likely referring to Broad Jank, and we must identify which specific issue is occurring.
If it’s stuttering during animation or list scrolling, we define it as Narrow Jank (referred to as Jank). If it’s slow app startup, slow screen wake-up, or slow scene switching, we define it as Slow Responsiveness (referred to as Slow). If it’s an ANR, it’s an Application Not Responding issue. Each situation requires different analysis and resolution methods.
Furthermore, within Apps or manufacturers, Jank, Responsiveness, and ANR have individual metrics like Frame Drop Rate, Startup Speed, and ANR Rate. Mastering the analysis and optimization of these issues is crucial for developers.
This is the third article in the Responsiveness series, focusing on extended knowledge when using Systrace to analyze app responsiveness, including startup speed testing, log interpretation, state analysis, and third-party startup libraries.
Table of Contents
- 1. Interpretation of the Three Process States in Systrace
- 2. Using TraceView for Responsiveness Analysis
- 3. Using SimplePerf for Startup Speed Analysis
- 4. Locating Other Component Startups in Systrace
- 5. Can AppStartup Optimize Startup Speed?
- 6. Using IdleHandler in App Startup Scenarios
- Series Articles
- References
- About Me && Blog
If you are not familiar with the basic use of Systrace (Perfetto), please catch up on the Systrace Basics Series first. This article assumes you are already familiar with using Systrace (Perfetto).
Systrace Series Articles:
- Introduction to Systrace
- Systrace Basics - Prerequisites for Systrace
- Systrace Basics - Why 60 fps?
- Android Systrace Basics - SystemServer Explained
- Systrace Basics - SurfaceFlinger Explained
- Systrace Basics - Input Explained
- Systrace Basics - Vsync Explained
- Systrace Basics - Vsync-App: Detailed Explanation of Choreographer-Based Rendering Mechanism
- Systrace Basics - MainThread and RenderThread Explained
- Systrace Basics - Binder and Lock Contention Explained
- Systrace Basics - Triple Buffer Explained
- Systrace Basics - CPU Info Explained
- Systrace Smoothness in Action 1: Understanding Jank Principles
- Systrace Smoothness in Action 2: Case Analysis - MIUI Launcher Scroll Jank Analysis
- Systrace Smoothness in Action 3: FAQs During Jank Analysis
- Systrace Responsiveness in Action 1: Understanding Responsiveness Principles
- Systrace Responsiveness in Action 2: Responsiveness Analysis - Using App Startup as an Example
- Systrace Responsiveness in Action 3: Extended Knowledge on Responsiveness
- Systrace Thread CPU State Analysis Tips - Runnable
- Systrace Thread CPU State Analysis Tips - Running
- Systrace Thread CPU State Analysis Tips - Sleep and Uninterruptible Sleep
1. Interpretation of the Three Process States in Systrace
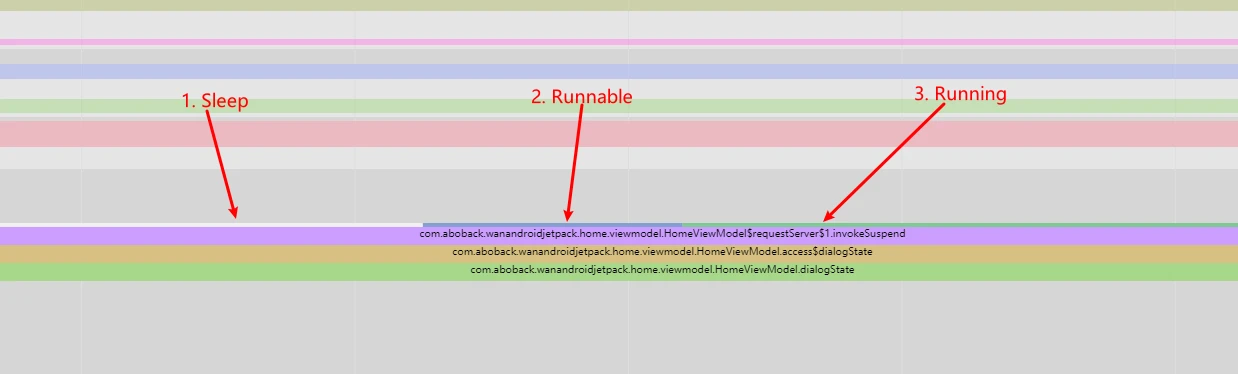
In Systrace, a process task typically exhibits three states: Sleep, Running, and Runnable. These are color-coded at the top of the task trace:
- Green: Running
- Blue: Runnable
- White: Sleep
1.1 Analyzing the Sleep State
White (Sleep) segments are either active or passive.
- Active Sleep (e.g.,
nativePoll): The app has no more messages to process and is sleeping while waiting for a new Message. This is normal and usually ignored (e.g., segments between frames). - Passive Sleep: Triggered by user code
sleep()or Binder communication with other processes. This is common and critical for performance analysis.
As shown below, long sleep periods during startup often correlate with Binder communication. Frequent Binder calls prolong response times.
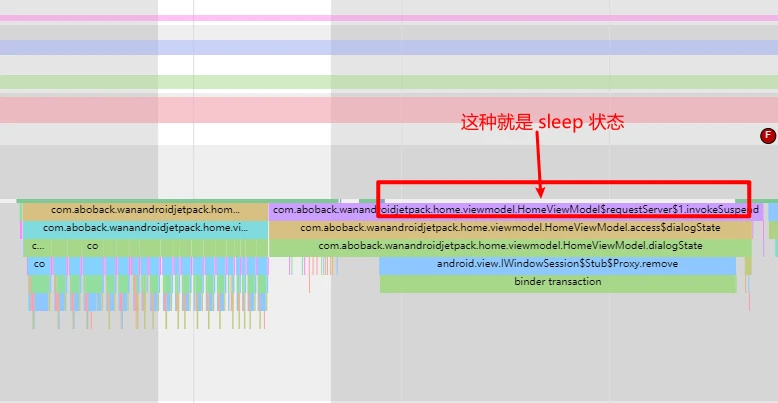
You can click the binder transaction marker at the bottom of the task to view details:
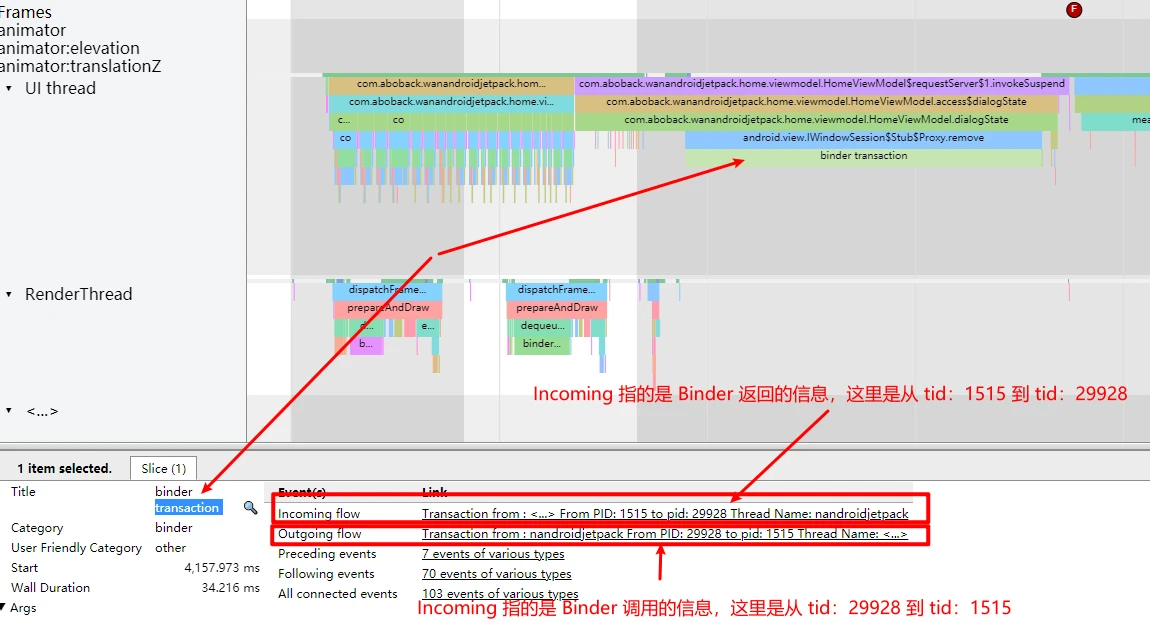
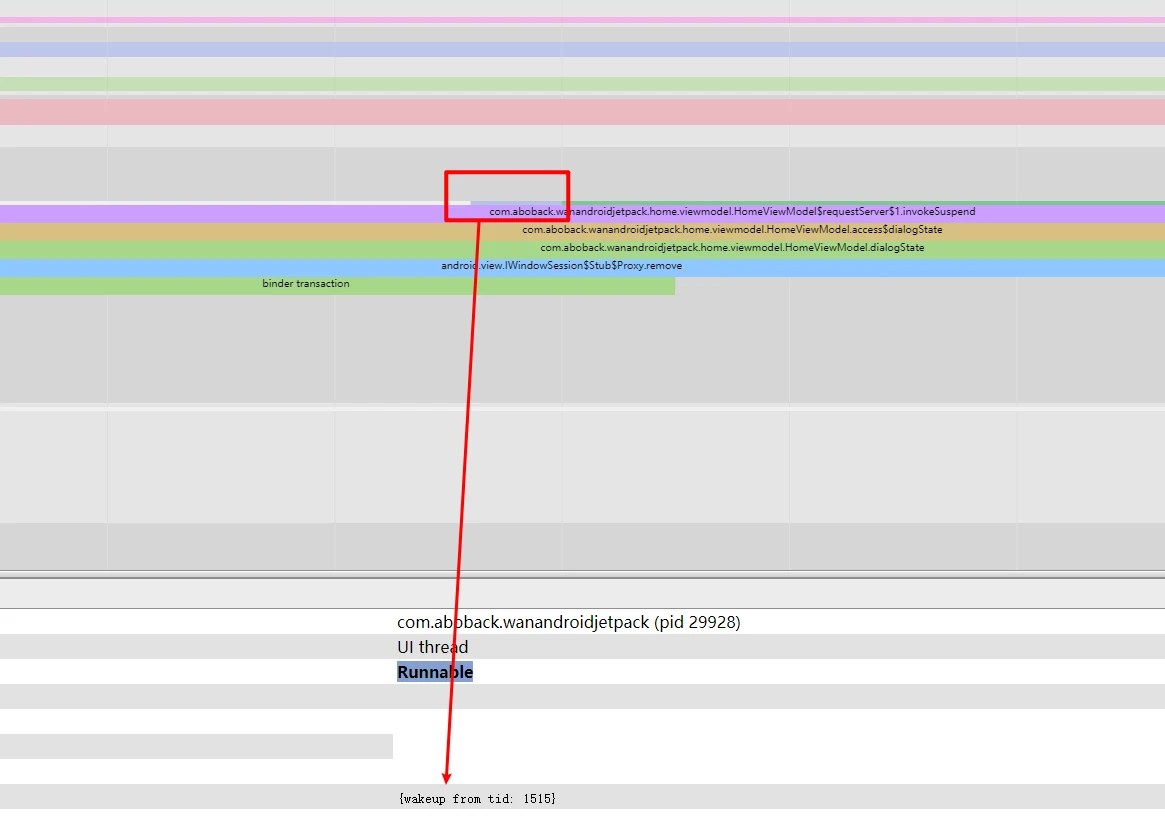
If Binder info is missing but the task is woken by another thread, check the Wakeup info to find the dependency.
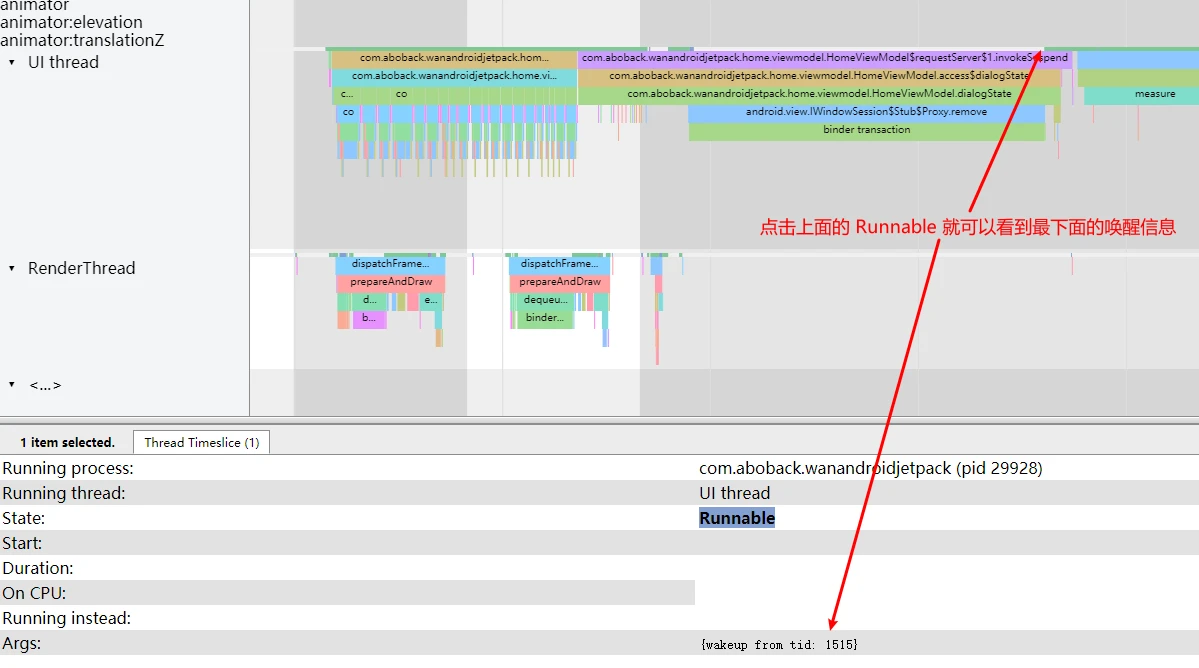
Zooming into the Runnable marker from the previous image:
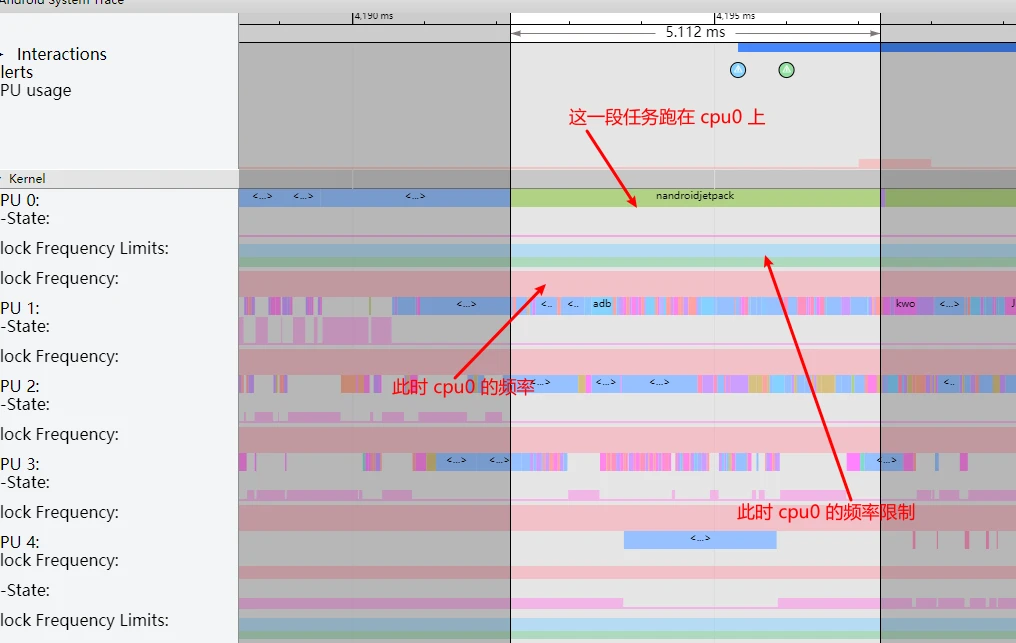
1.2 Analyzing the Running State
The Running state indicates the task is currently executing on a CPU core. If a Running segment is unexpectedly long, consider:
- Increased App logic/complexity.
- Core scheduling anomalies (e.g., running on the wrong core).
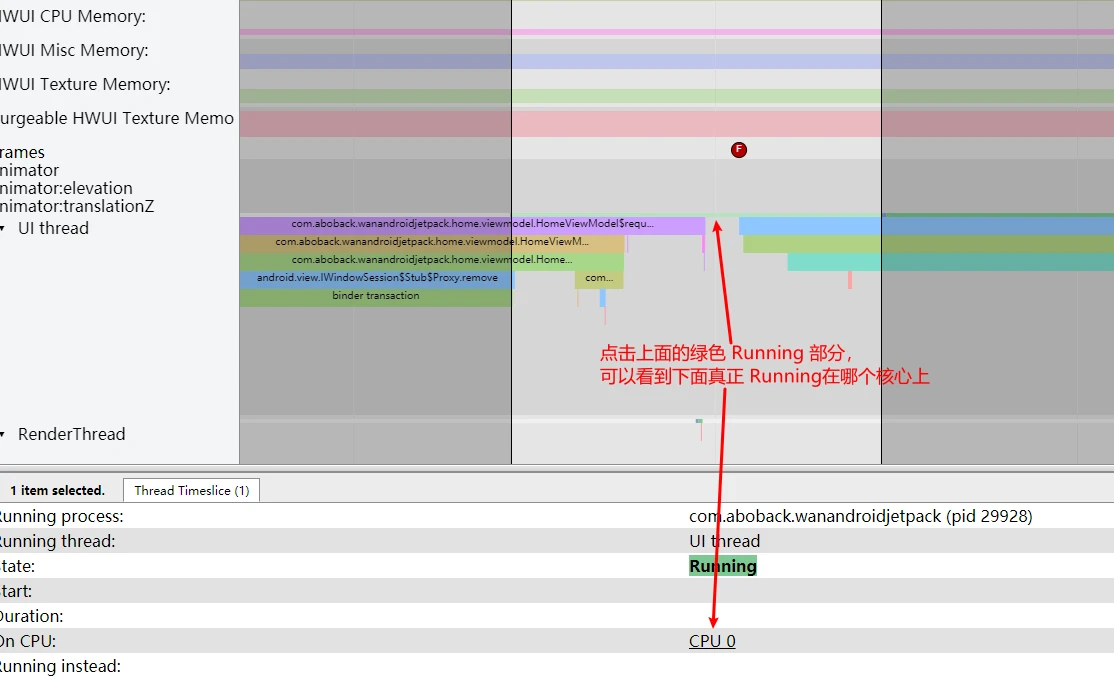
On some Android devices, UI and Render threads are prioritized for Big Cores when the app is in the foreground.
1.3 Analyzing the Runnable State
A task must transition from Sleep to Runnable before entering the Running state:
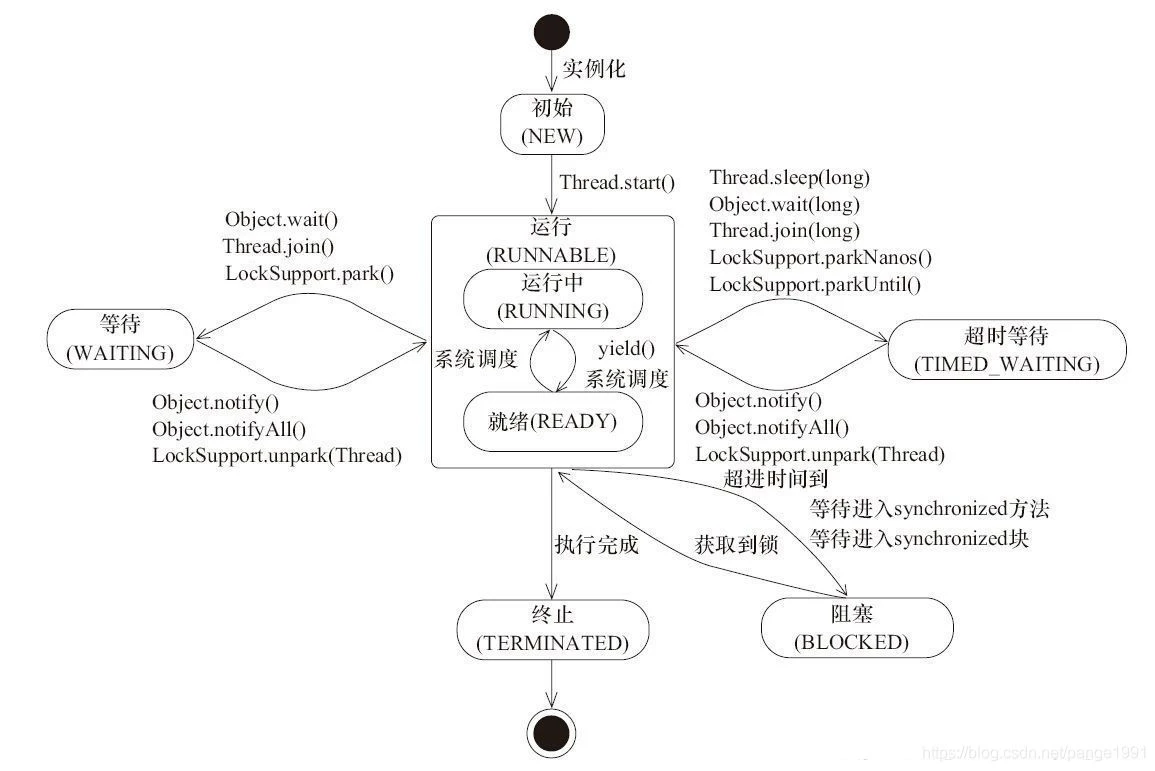
Systrace representation:
Normally, a task enters Running almost immediately after becoming Runnable. In a congested system with saturated CPUs, tasks must wait in Runnable for an available core.
If startup shows heavy Runnable segments, check the overall system load.
2. Using TraceView for Responsiveness Analysis
“TraceView” refers to the CPU profiling visualization within the Android Studio Profiler.
2.1 Capturing TraceView During Startup
Use the following command to profile a cold start (replace package/activity names with your own):
1 | adb shell am start -n com.aboback.wanandroidjetpack/.splash.SplashActivity --start-profiler /data/local/tmp/traceview.trace --sampling 1 && sleep 10 && adb shell am profile stop com.aboback.wanandroidjetpack && adb pull /data/local/tmp/traceview.trace . |
Or execute steps individually:
1 | 1. Start App with 1ms sampling |
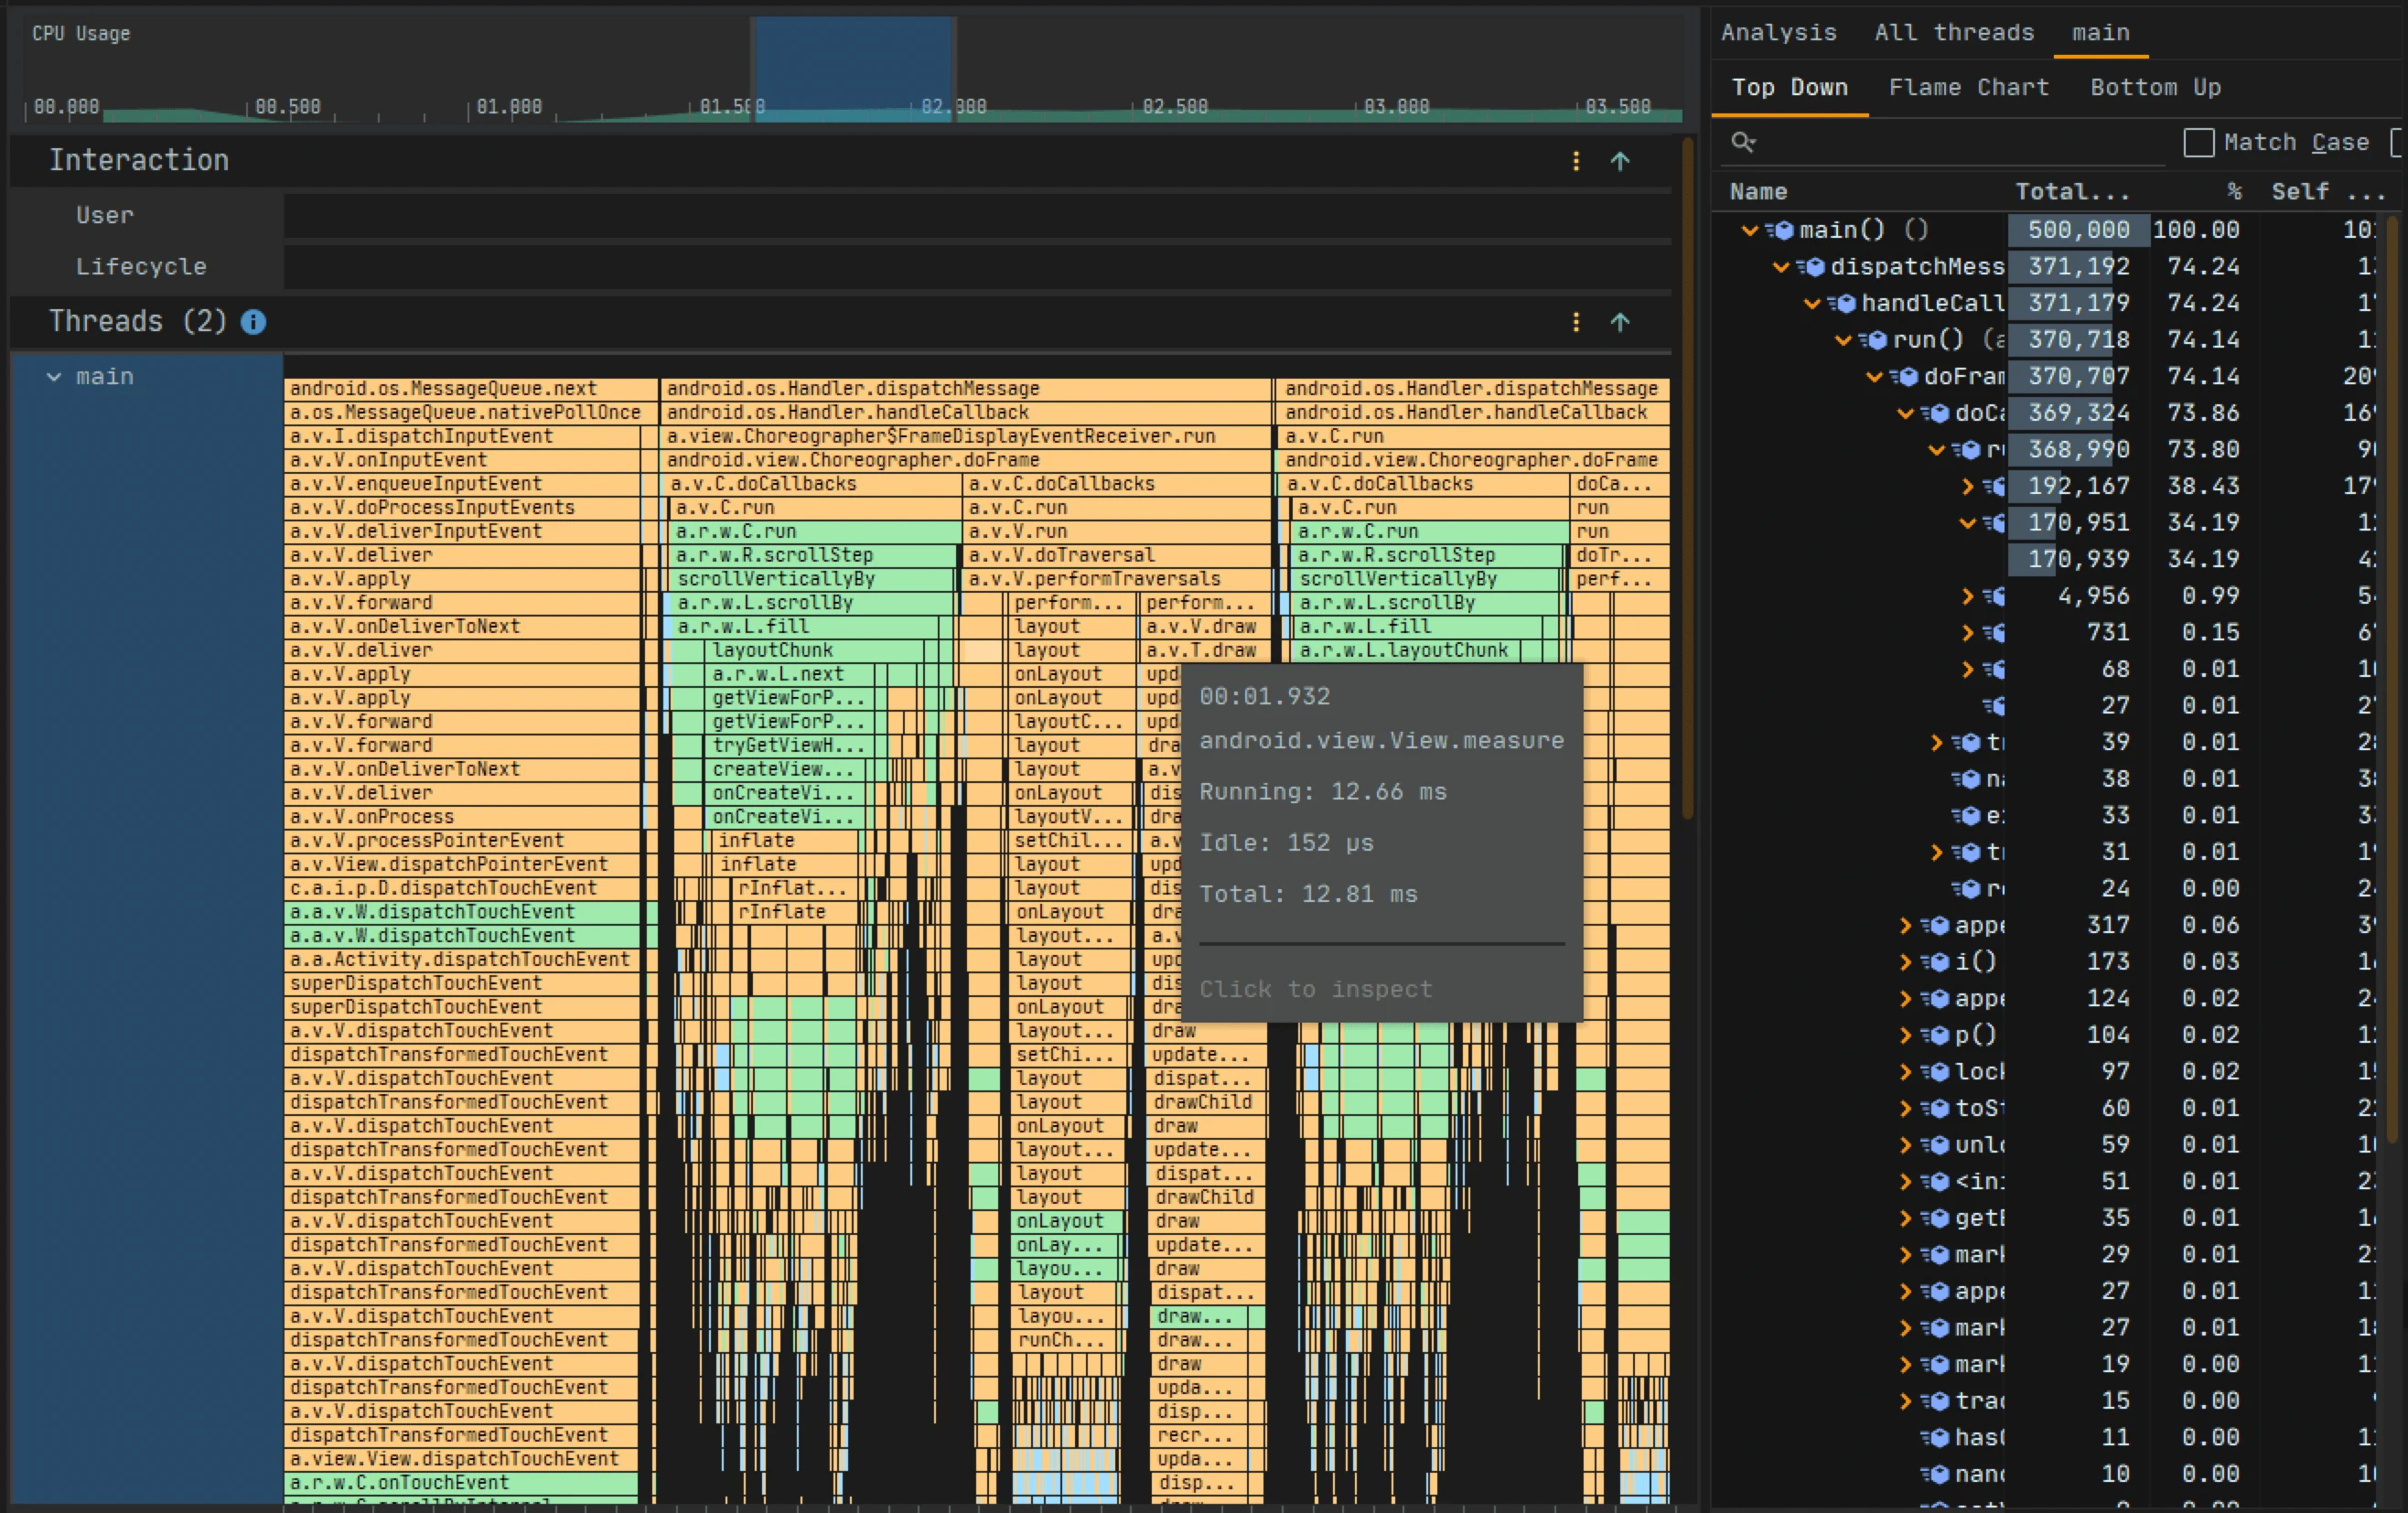
2.2 Interpreting TraceView
Green markers denote App functions; yellow markers denote System functions.
Application.onCreate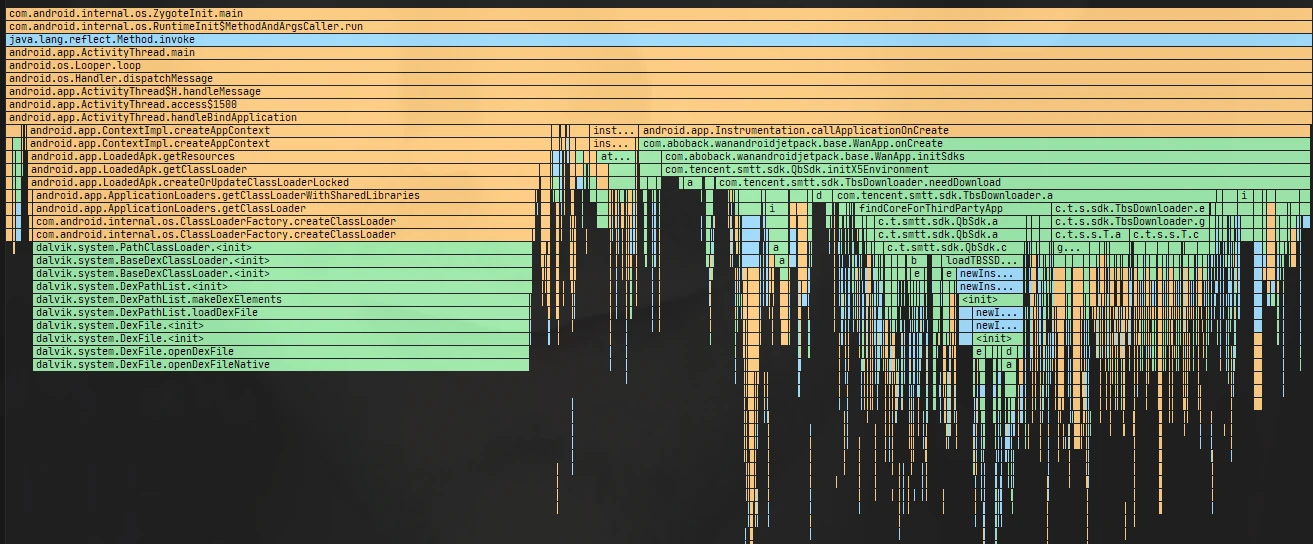
Activity.onCreate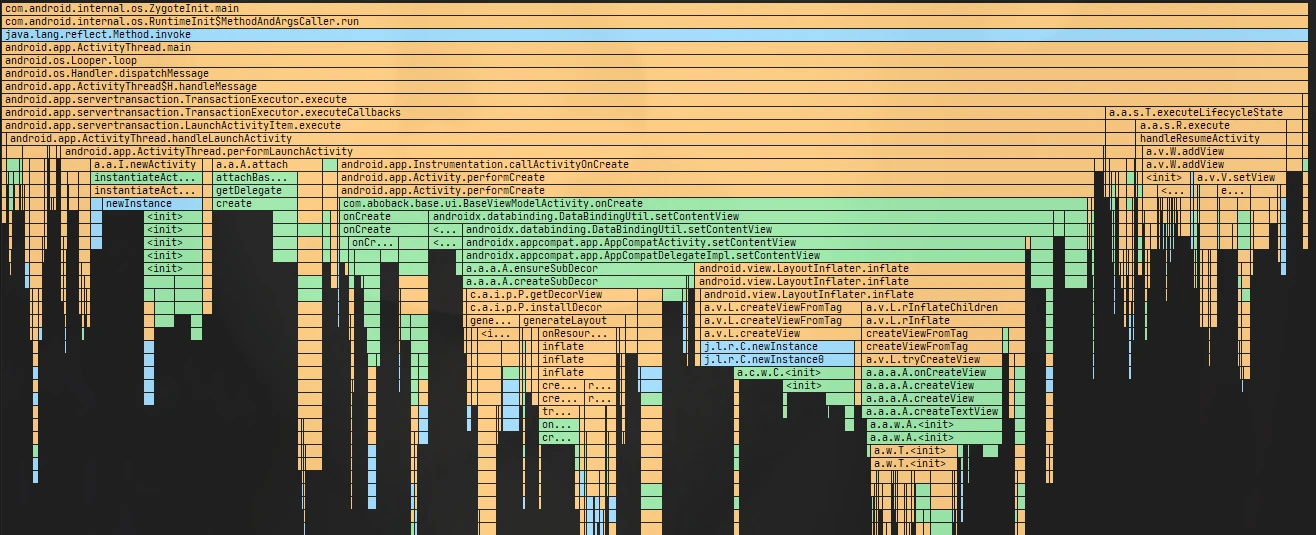
doFrame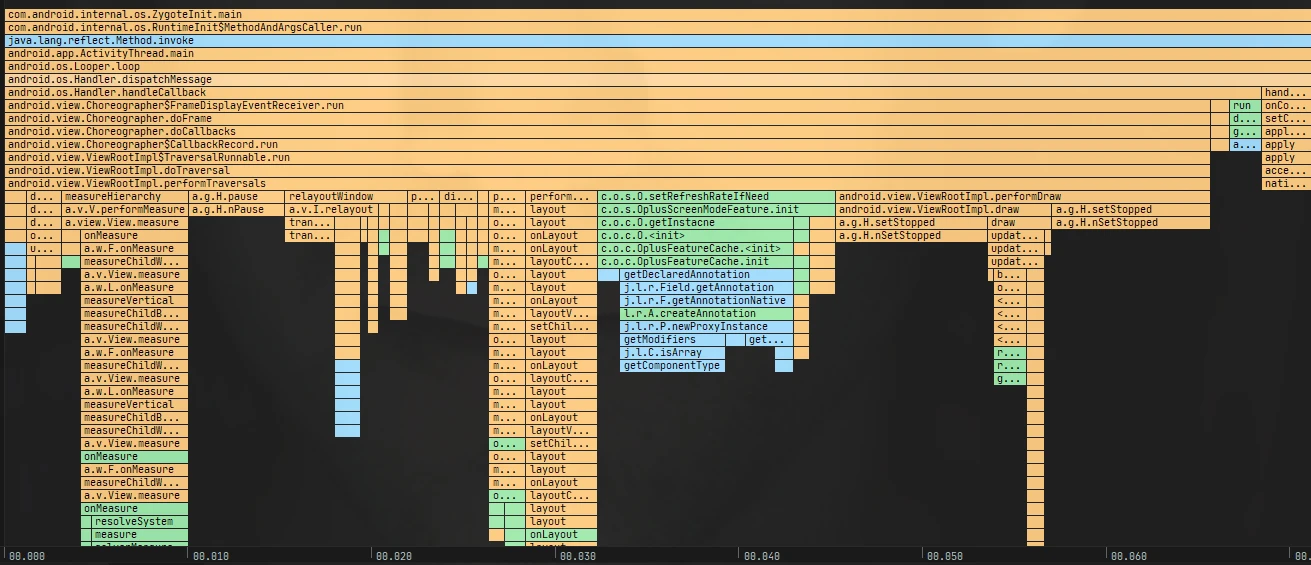
WebView Initialization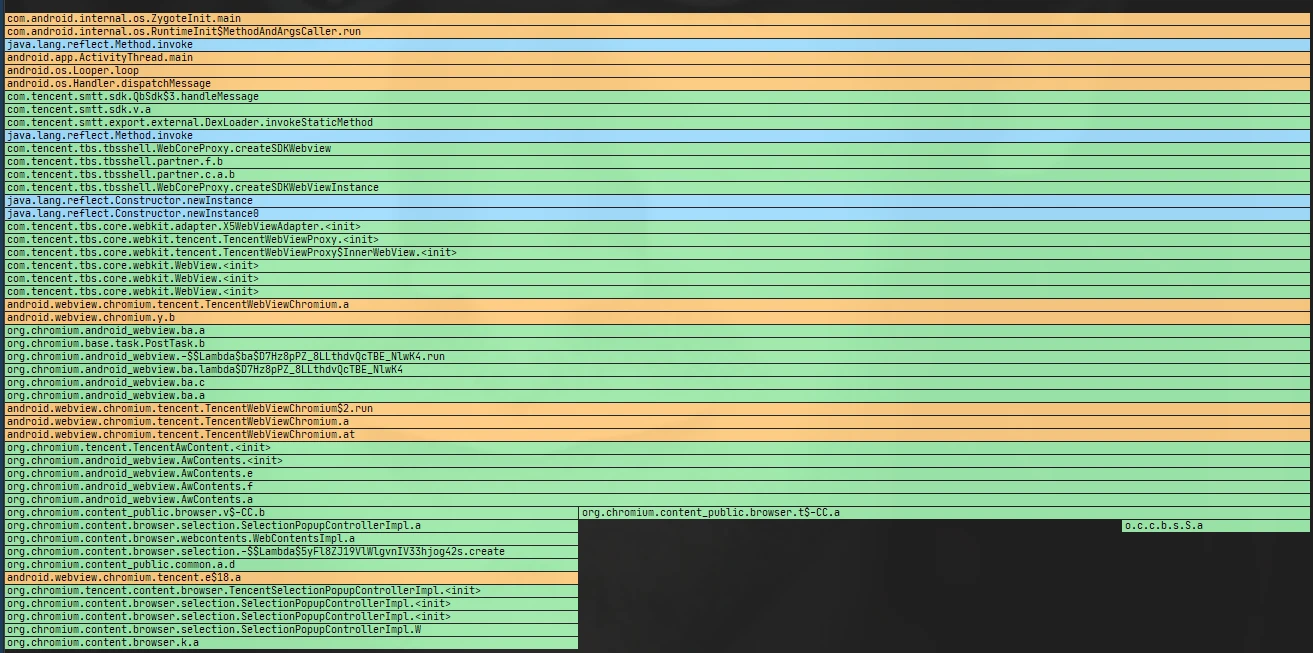
2.3 Pros and Cons
TraceView uses high-frequency sampling, introducing significant performance overhead. Consequently, the execution times of individual methods are NOT accurate and should not be used as a real-time reference. Use it exclusively to visualize call stacks and pair it with Systrace for timing data.
3. Using SimplePerf for Startup Speed Analysis
SimplePerf captures both Java and Native stack traces.
To profile com.aboback.wanandroidjetpack (refer to SimplePerf Documentation):
1 | python app_profiler.py -p com.aboback.wanandroidjetpack |
Manually launch and then terminate the app:
1 | python app_profiler.py -p com.aboback.wanandroidjetpack |
Generate the HTML report:
1 | python report_html.py |
Result: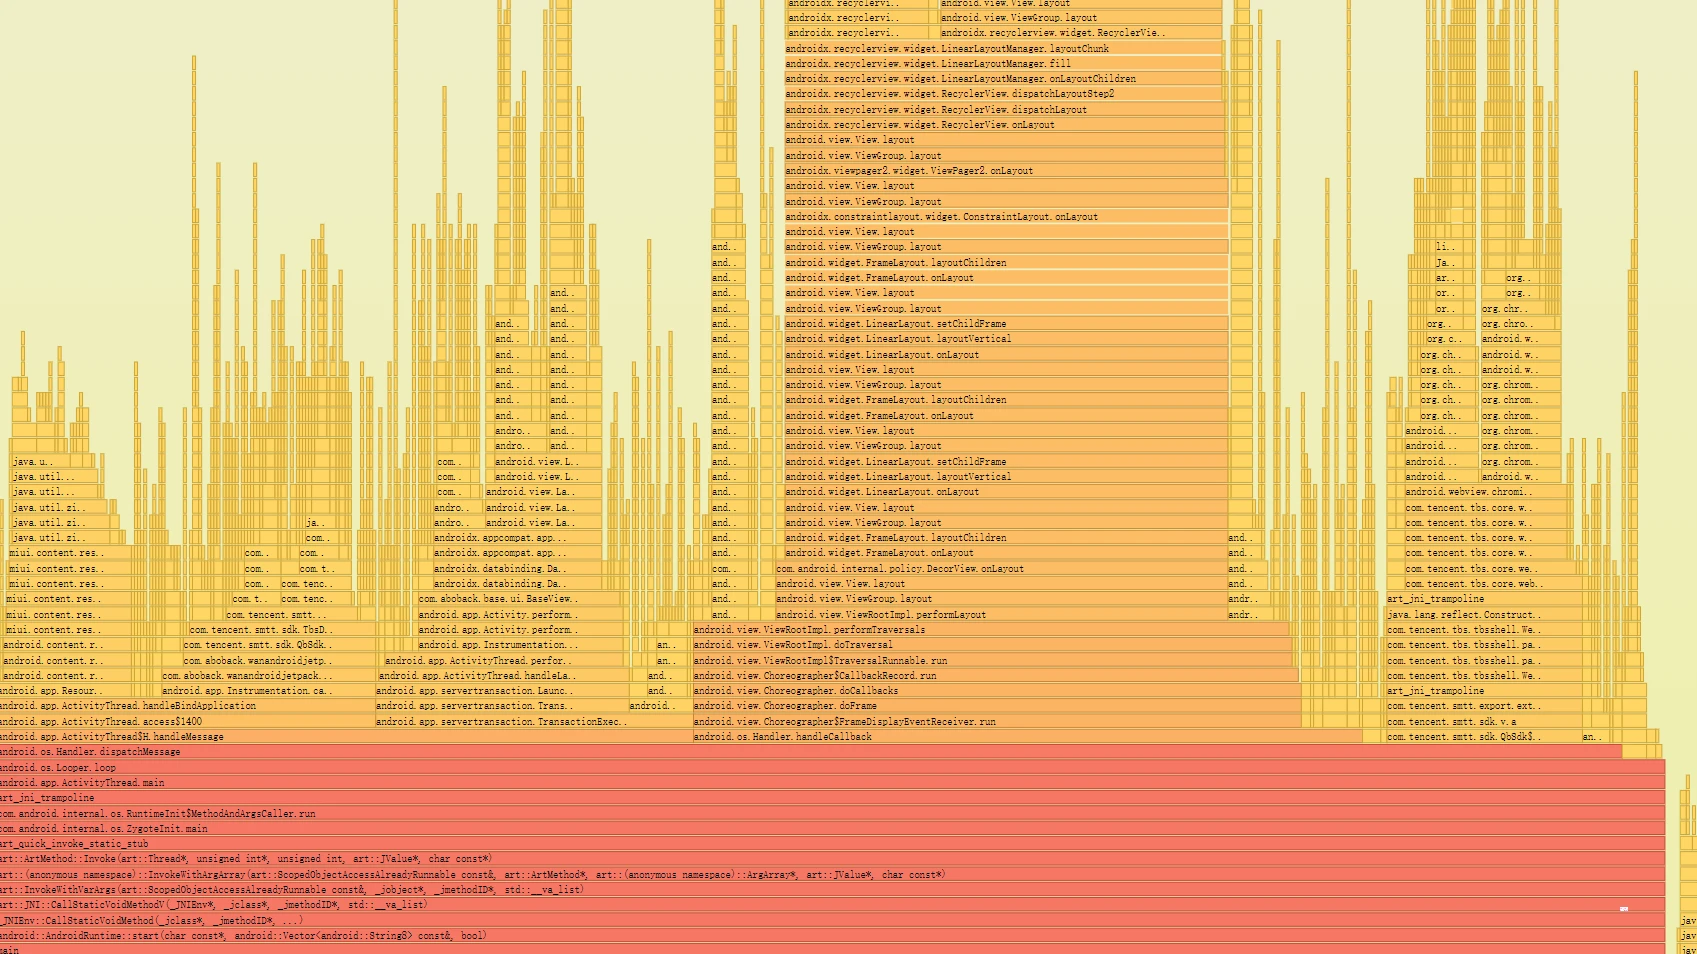
SimplePerf captures both Java and Native stacks. For advanced usage, see:
4. Locating Other Component Startups in Systrace
4.1 Service Startup
1 | public final void scheduleCreateService(...) { |
Service operations are sent as Messages to the H Handler. They don’t execute immediately but are processed in the order defined by the MessageQueue.
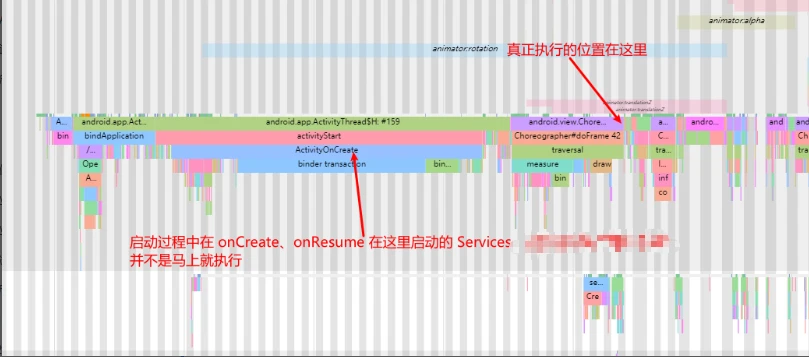
Execution typically follows the first frame (after the queue catches up). Subsequent messages represent custom App logic, Service starts, and BroadcastReceivers.
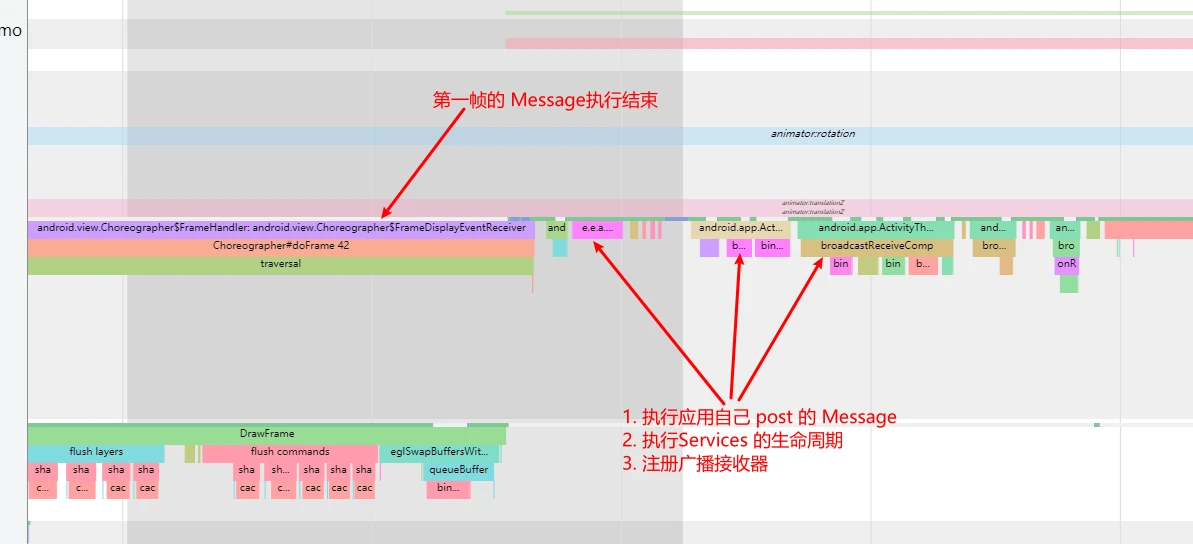
4.2 Custom Messages
Custom App Messages in Systrace:
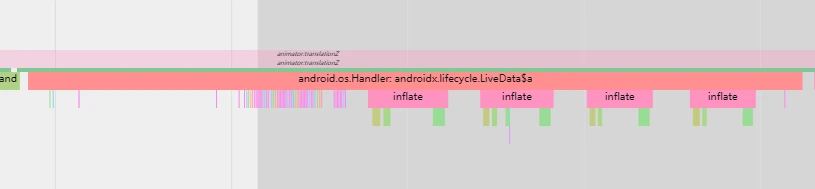
4.3 Service Startup Visualized
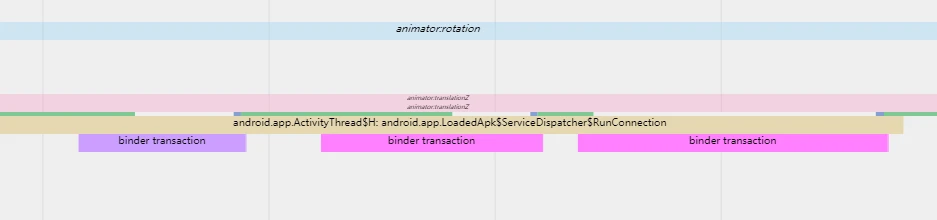
4.4 BroadcastReceiver Execution
Receiver execution in Systrace:
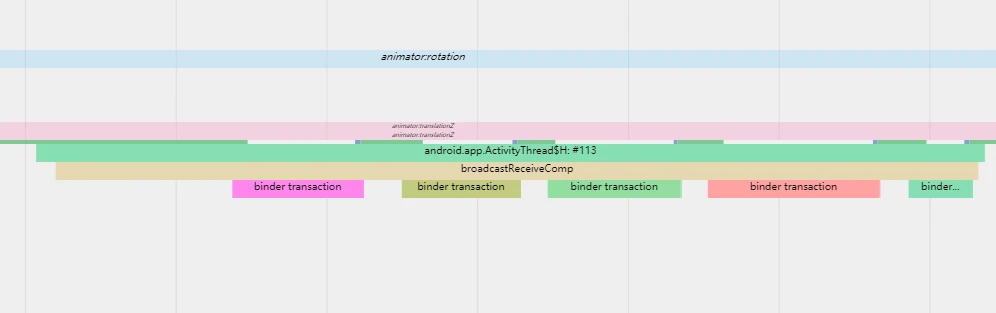
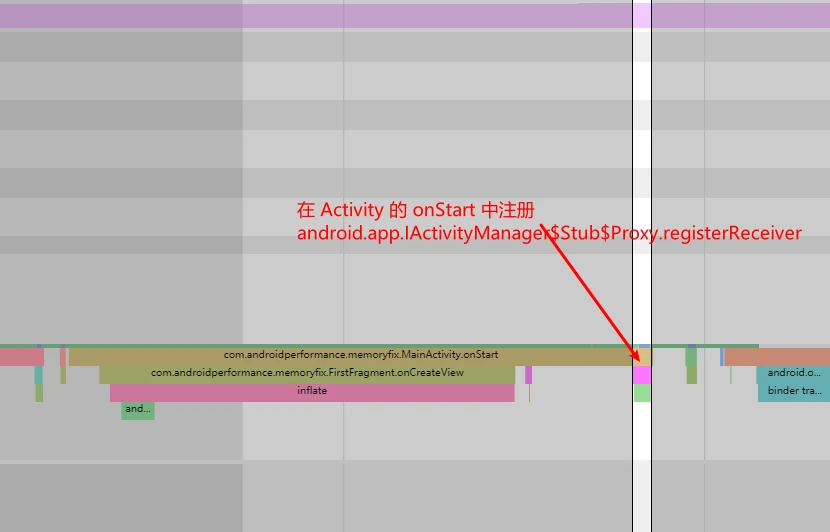
Dynamic registration (usually in lifecycle functions) executes where registered.
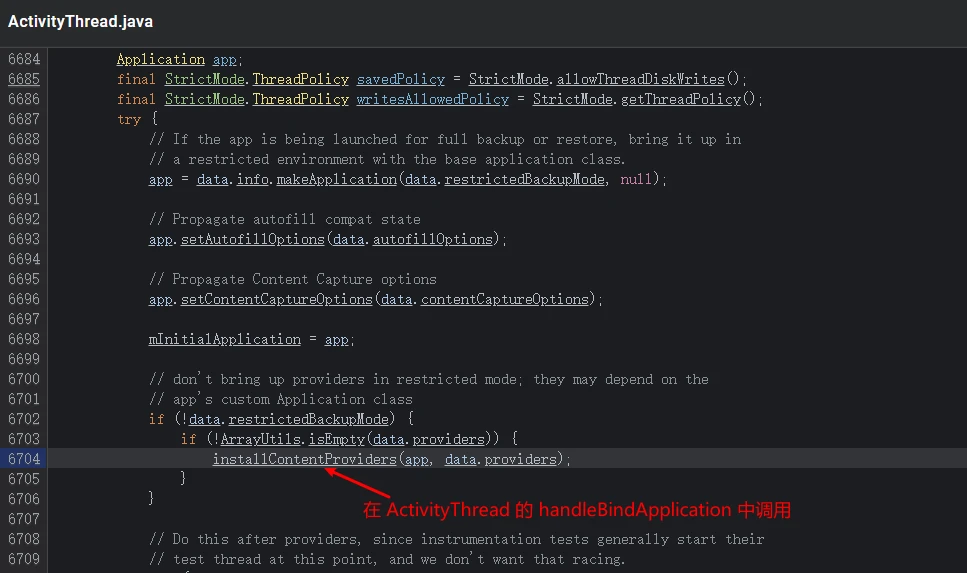
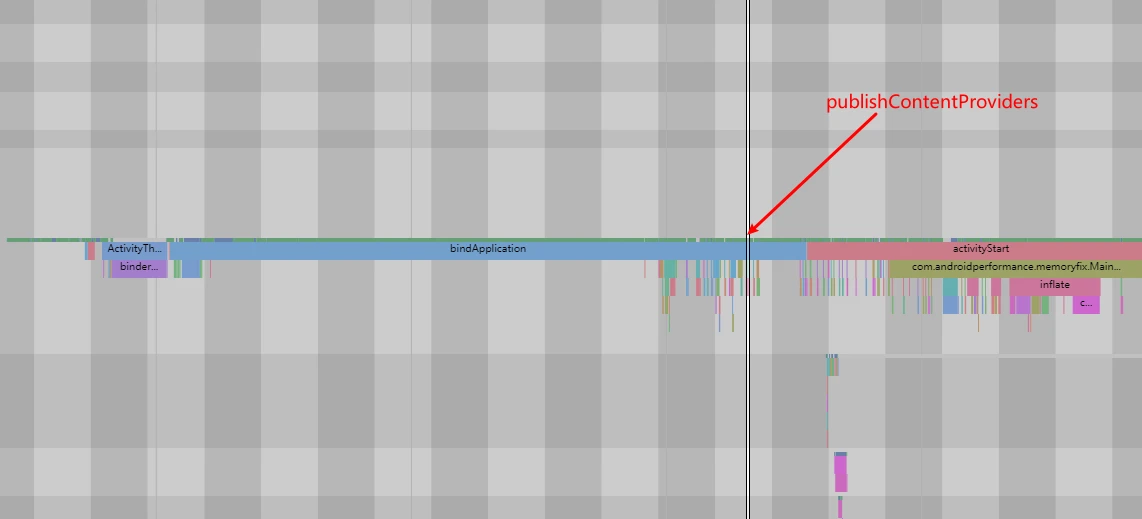
4.5 ContentProvider Startup Timing
5. Can AppStartup Optimize Startup Speed?
Third-Party Library Initialization
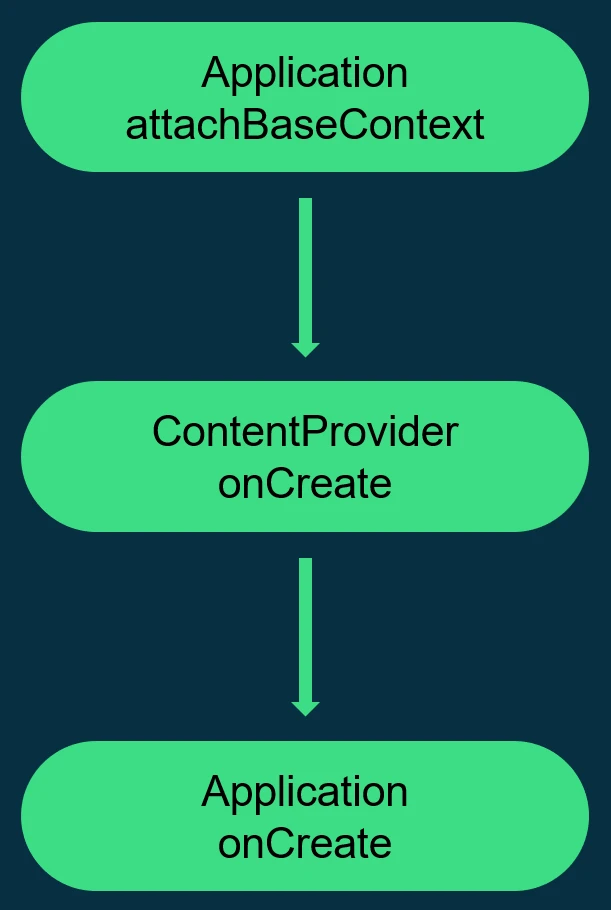
Many libraries require Application context for initialization. Some libraries initialize “stealthily” using a ContentProvider. By defining a provider and calling initialization in its onCreate, the library ensures it’s ready without explicit developer action, as the system calls onCreate for all registered providers during App startup.
Facebook, Firebase, and WorkManager commonly use this trick.
Provider initialization timing:
However, this leads to:
- Too many ContentProviders during startup.
- Loss of control over initialization timing for developers.
- Inability to manage library dependencies.
AppStartup Library
Google introduced AppStartup to address this:
- Shared ContentProvider: Consolidates initialization into a single provider.
- Explicit Sequence: Defines exact initialization order.
- Lazy Loading: Optionally removes automatic initialization to manually trigger it later, optimizing startup speed.
Measurements show AppStartup doesn’t significantly speed up startup unless you have many (e.g., 50+) ContentProviders.
If an SDK’s provider slows you down, consider removing it from the merge and manually initializing it:
1 | <provider |
Summary
- Purpose: Solves “ContentProvider Bloat” from multiple libraries.
- Benefit: Minor. Usually $< 20$ms even with 20-30 libraries.
- Best Use Scenarios:
- APK has excessive ContentProviders.
- Individual Providers are heavy but not critical for startup (can be lazy-loaded).
- Deep control over initialization order is required.
Action Items for App Developers:
- Check the merged manifest for ContentProvider count ( AS ->
src\main\AndroidManifest.xml-> Merged Manifest tab). - Measure initialization time for each.
- Identify lazy-loading candidates.
- Integrate AppStartup if needed.
6. Using IdleHandler in App Startup Scenarios
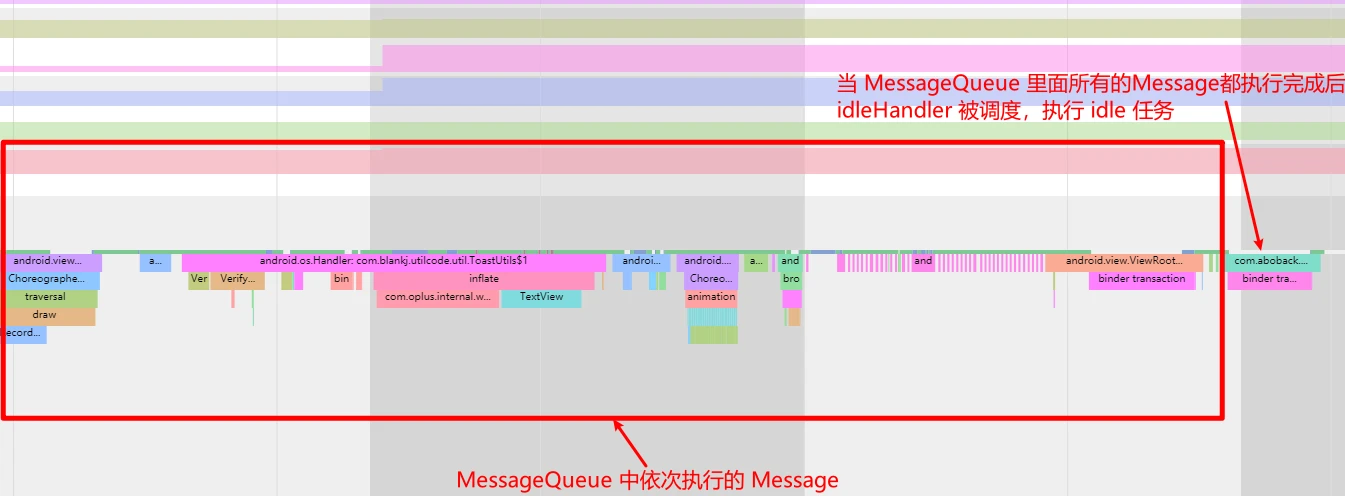
IdleHandler executes tasks when the MessageQueue is idle.
Usage scenarios:
Lazy Loading: Add an
IdleHandlerinActivity.onCreateto run non-critical tasks once the queue is clear.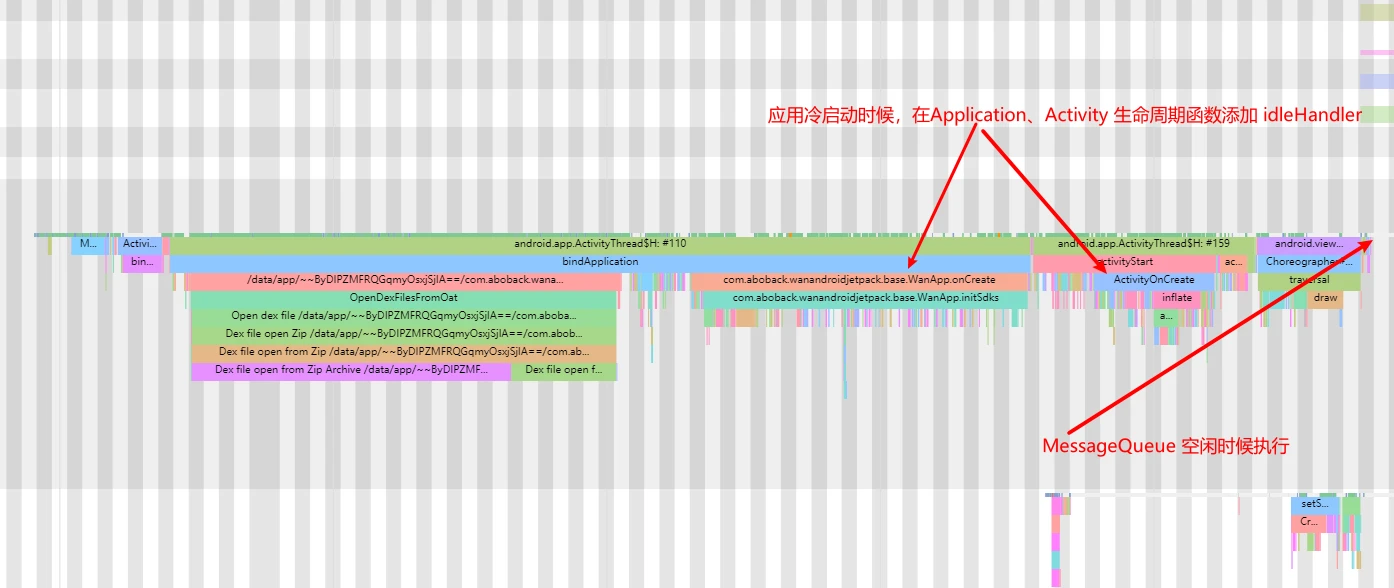
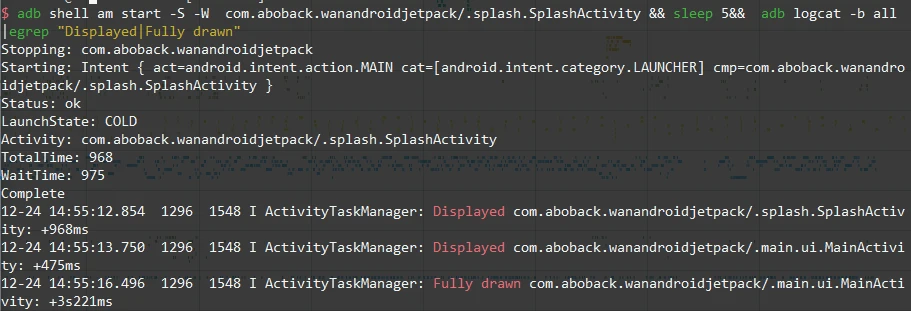
Accurate Startup Metrics: Call
activity.reportFullyDrawn()once the first page list/content is stable.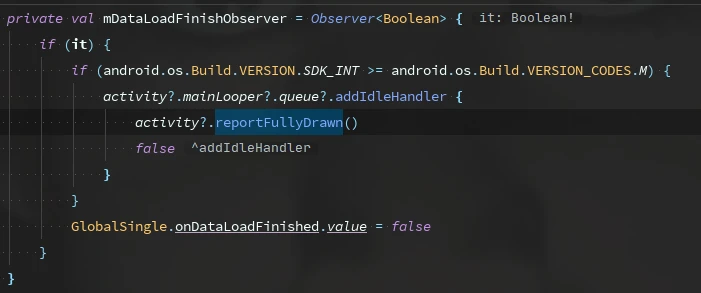
Systrace reflects this:
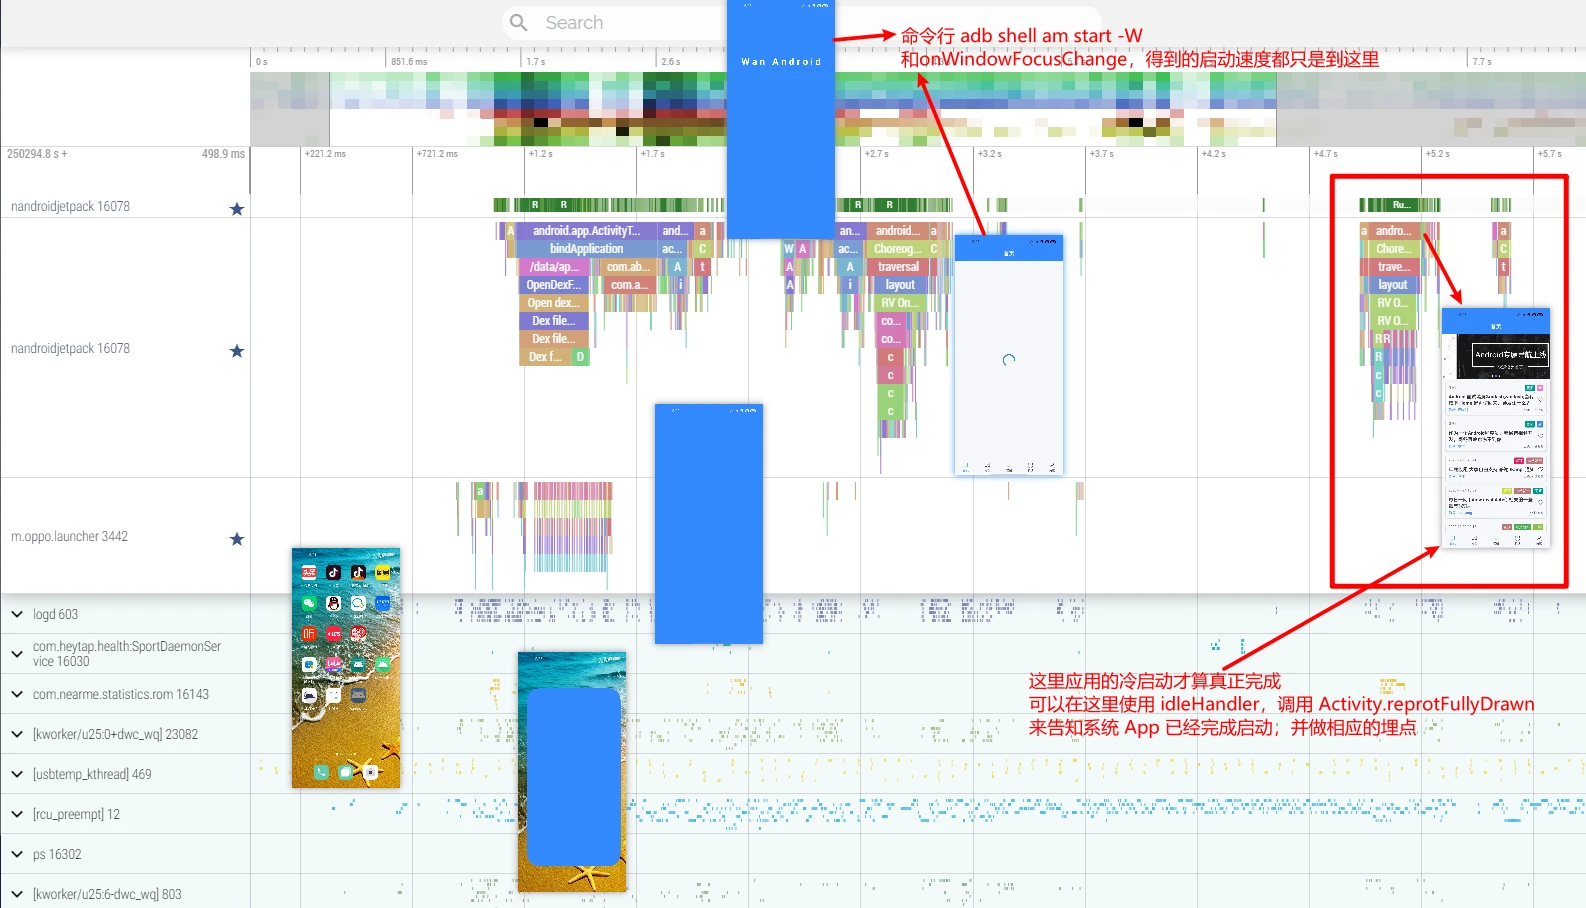
This records a meaningful cold start time:
Some system features also rely on FullyDrawn reports; they are highly recommended.
Series Articles
- Systrace Responsiveness in Action 1: Understanding Responsiveness Principles
- Systrace Responsiveness in Action 2: Responsiveness Analysis - Using App Startup as an Example
- Systrace Responsiveness in Action 3: Extended Knowledge on Responsiveness
- Link to Systrace Basics Series
References
- Analysis of Android App Startup Flow
- Investigation: Can App Startup Really Reduce Startup Time?
- Jetpack App Startup Explained
- App Startup Official Guide
- Complete Record of Android App Startup Optimization
- Android Application Profiling
About Me && Blog
Below is my personal intro and related links. I look forward to exchanging ideas with fellow professionals. “When three walk together, one can always be my teacher!”
- Blogger Intro: Includes personal WeChat and WeChat group links.
- Blog Content Navigation: A guide for my blog content.
- Curated Excellent Blog Articles - Android Performance Optimization Must-Knows: Welcome to recommend projects/articles.
- Android Performance Optimization Knowledge Planet: Welcome to join and thank you for your support~
One walks faster alone, but a group walks further together.