In his book
, Paul Graham states: “The execution efficiency gap between different programming languages is becoming increasingly large, so profilers are becoming more important. Currently, performance profiling is not receiving enough attention. Many people still believe that the key to improving program running speed is developing compilers that can generate faster code. The gap between code efficiency and machine performance is continuously increasing, and we will increasingly clearly see that the key to improving application software running speed is having a good performance profiler to guide program development.”
By Paul Graham — Hackers and Painters
If you Google search “Android optimization tools,” you’ll find many related contents. Their problem is that content is highly repetitive, or they directly explain usage methods. They rarely introduce overall architecture, which can easily make you form the erroneous cognition of “one tool handles everything.” Based on my team’s years of experience, in the performance profiling field, such a silver bullet-level tool does not exist. Tools are evolving, old problems will appear in new forms. If you don’t master the core logic, you’ll always float on the surface of technology.
This article will systematically organize observable technologies in performance profiling, covering three parts of content: data types, capture methods, and analysis methods. After that, we’ll introduce Google’s “Big Three” analysis tools. The goal is to let you understand immutable theoretical knowledge and corresponding tools available in the Android environment, so you can take fewer detours and directly reuse predecessors’ experience.
It’s important to note that for performance optimization, there are certainly more than just these three tools available, but these three are the “first-tier tools” we usually use. Before conducting further analysis, you’ll need to rely on these three tools for bottleneck positioning, and then choose corresponding tools for deep-dive analysis based on different domain characteristics.
1 Observable Technologies in Performance Profiling
- Was this operation actually executed? How long did execution take?
- Why is there such a huge difference between two versions?
- What operations is the system executing when CPU usage becomes high?
- Why did startup speed become slower?
- Why does this page always stutter for a moment?
I believe everyone has been asked similar questions by colleagues or bosses. The most primitive thought should be to first get relevant logs and analyze them line by line. Based on past experience, find clues by searching for keywords. If you can’t find the information you want, then add logs and try to reproduce locally. This is time-consuming to say the least, and also consumes R&D resources. But have you ever thought whether there’s a more efficient method in the industry? One that can improve your efficiency by a magnitude, letting you spend your time on problem-solving rather than boring repetitive physical labor?
The answer of course is yes (otherwise there wouldn’t be this article). We call it Observable Technologies.
Computer industry development to date, predecessors of the field have捣鼓 out what are called “observable technologies.” It studies how to use tools to observe detailed execution of complex systems. The more detailed the content, the better. Before mobile operating systems, there were embedded systems. Current high-end Android phones’ computational power can catch up to the computational power of a main computer from twenty years ago. On this computational foundation, the software complexity brought by mobile phones is also very huge.
If your program deploys a well-designed and good-performing observable technology, it can greatly accelerate R&D software efficiency. Because even if we use various upfront static code checking and manual code reviews, we can’t 100% intercept software problems. Only after running in real environment do you know whether problems actually occurred. Even if this environment might be an automated test case of yours. Even so, you still need to read through your logs and reread code to find problems. For these reasons, every engineering team needs to have a functionally complete observable technology as one of their infrastructure.
Observable technology is a systematic engineering project that allows you to more deeply understand what’s happening inside the software system. It can be used to understand the internal execution process of software systems (especially for business logic or systems with complex interaction relationships), troubleshoot problems or even find bottleneck points to optimize the program itself. For complex systems, understanding the entire execution process through reading code is actually quite difficult. A more efficient method is to use such tools to obtain the software system’s running state in the most intuitive way.
The following will help you understand observable technologies from three themes: data types, data acquisition methods, and analysis methods.
1.1 Data Types
Log forms might be key-value pairs (key=Value), JSON, CSV, relational databases, or any other format. Secondly, we restore the system’s entire running state at that time through logs, with the goal being to solve a certain problem, observe the running mode of a certain module, or even characterize system user behavior patterns. In observable technology, we classify log types into Log types, Metric types, and Trace types.

Log Type
Log is the most primitive data recording method. It generally records what module did what thing at what time, and whether log level is warning or error. The vast majority of systems, whether embedded devices or computers in cars, the log form they use is almost always of this type. This is the simplest, most direct, and also best-implemented method. Almost all Log types are stored through string type. Data presentation format is a single text data line. Log is the most basic type. Therefore, through transformation, Log type can be converted to Metric or Trace types. Of course, the cost is the transformation process. When data volume is very large, this might become a bottleneck.
To identify different log type levels, error, warning, and debug levels are commonly used to categorize log levels. Obviously, error-type is the primary log level you need to focus on. However, in practice, people won’t strictly categorize according to this method. This might be related to their engineering development environments not doing good categorized analysis on different log levels. In summary, you can categorize Log types by level based on your purpose. It’s like an index, which can further improve the efficiency of analyzing problems and locating target information.
Metric Type
Metric type is more focused in purpose compared to Log type. It records the numerical changes of a certain dimension. The knowledge point is “dimension” vs. “numerical value.” A dimension might be CPU usage rate, CPU Cluster scheduling frequency, or context switch count. Numerical value changes can be instantaneous values at sampling time (becoming snapshot-type), or difference from previous sampling (increment or decrement), or statistical aggregated values over a certain time period. In practice, aggregated values are often used, for example, if I want to see the average CPU usage in the 5 minutes before a problem occurred. At this time, I need to calculate a simple average or weighted average of all values within these five minutes (for example, samples closer to the occurrence point get higher weight). Log type can of course achieve Metric type effects, but the operation is quite troublesome and its performance loss might not be small.
Aggregation is a very useful tool because it’s impossible for humans to analyze all Metric values one by one. Therefore, using aggregation to determine whether there’s a problem before conducting detailed analysis is a more cost-effective method.
Another benefit of Metric type is that its content format is relatively fixed, so it can use pre-encoding for data storage. Space utilization is more compact, and thus disk space occupied is also less. The simplest application is storing in data format. If you use Log type, it’s generally ASCII encoding. While Metric type uses integers or floating point and other fixed byte array data. When storing larger numerical values, obviously ASCII encoding requires more byte count than numerical-type data. And during data processing, you can directly use Metric data without needing to convert Log’s ASCII to numerical format before conversion.
Besides specific numerical values, it can also store enumeration values (essentially, their essence is also numerical). Different enumeration values represent different meanings. It could be on and off, or different event types.
Trace Type
Trace type identifies the time, name, and duration of event occurrences. Multiple events identify whether it’s parent-child or sibling relationships through relationships. When analyzing complex calling relationships between multiple threads, Trace type is the most convenient data analysis method.
Trace type is particularly suitable for Android application and system-level analysis scenarios because it can diagnose:
- Function call chains
- Binder invocation chains
- Cross-process event flow tracking
In the design of Android application runtime environments, an application cannot complete all functions independently. It needs to interact extensively with SystemServer to complete many of its functions. Communication with SystemServer is completed through Binder. Its communication method will be introduced in detail in later articles. For now, you just need to know that its communication relationship is cross-process calls. This requires combining client-side and server-side data to accurately restore the calling relationship. Trace type is the best way to complete this kind of information recording.
Trace type can be added with manually set start and end points. Within one function, you can add multiple such intervals. Through pre-compilation technology or programming language features, you can automatically insert Trace intervals at function’s header and end. Ideally, the latter is the best solution because you can know which functions in the system are which, their execution situations, and what the calling relationships are. You can use this information to count which functions have the most call counts (hottest points), and which functions are the most time-consuming. It’s imaginable that this approach brings huge performance loss because the frequency and magnitude of function calls are very large. The more complex the system magnitude, the larger it is.
Therefore, there’s a workaround method: that’s using sampling to obtain call stack to approximately fit the above effect. The shorter the sampling interval, the better it can fit the real calling relationships and duration. But the interval also shouldn’t be too small because the operation of taking stack itself becomes very high because the number of times increases. This method is called Profiler in the industry. The vast majority of profilers for programming languages you’ve seen are implemented based on this principle.
1.2 Data Acquisition Methods

Static Instrumentation and Dynamic Tracing
Static code acquisition methods are the most primitive approach. The advantage is simple implementation, but the disadvantage is that you need to recompile and install programs every time you add new content. When you encounter a problem later, if the information you want to see happens to not have been logged in advance, there’s no way to further locate problems. You can only start over the entire process again.
A more progressive approach is to pre-add data acquisition points at all possible places you might need, and choose whether to output through dynamic judgment of switches. This can both control performance impact and be able to dynamically turn on logs when needed. However, the cost of this method is very high.
Dynamic tracing technology has actually always existed, but its learning cost is relatively high. It’s hailed as the dragon-slaying sword in the debugging field. It requires you to understand relatively deep technical knowledge, especially compilation, ELF format, kernels, and being familiar with predefined probes and dynamic language-対応 programming languages in code. To you, if you’re wrong, this kind of technology even has its own set of programming languages for “dynamic” implementation developer requirements. This approach combines performance and flexibility. You can even dynamically view the information you want when encountering exceptions in online versions. It兼具 performance and flexibility, and you can even see what’s happening in your code in a very short time after exceptions occur. It’s very powerful for online troubleshooting and problem reproduction.
Unconditional and Conditional Capture
Unconditional capture is relatively easy to understand. After triggering capture, no matter what happens, it will continuously capture data. The disadvantage is that when the data volume generated by observed object is very large, it might cause relatively large impact on the system. In such cases, you can only mitigate by reducing the data volume. You need to achieve meeting requirements while performance loss isn’t too large.
Conditional capture is often used for scenarios where identifiable anomalies can be detected. For example, when a certain observed value of the system exceeds a preset threshold, at this point, capture is triggered and continues for a period or reaches another threshold before ending capture. This is slightly more progressive than the previous method because it only impacts the system when problems occur, and has no impact points at other times. But it requires you to be able to identify anomalies, and such anomalies shouldn’t require pre-occurrence historical data. Of course, you can make it easier to reach trigger points by lowering the threshold, which can increase the probability of triggering data capture. At this time, you’ll encounter the same problems encountered by unconditional capture above, requiring you to balance performance loss.
Dumping Strategy
Continuous dumping is storing all data generated during the entire data capture process. The cost is storage pressure. If you can identify the trigger point, for example, being able to detect anomalies, you can then choose to dump selectively. To ensure historical data’s effectiveness, you therefore first temporarily store logs to a RingBuffer, and only proceed to persistent storage after accepting a dump command. This approach balances performance and storage pressure, but the cost is runtime memory loss and trigger’s accuracy.
From the above discussion, you can know that from the most primitive to the most progressive, there are different advantages and costs. As your program gets more mature, you first need to have probes. Fortunately, in Linux kernels and other frameworks, corresponding probe points are already laid out. But in the Android application layer, there aren’t ready-made ones. So currently, dynamic frameworks available on Android, such as eBPF-based frameworks, are all used by kernel developers. Therefore, you can use dynamic frameworks such as eBPF on Android apps. Only professional and full-time performance analysis personnel might use such tools. It has two key points: probes and dynamic language. During program execution, corresponding probe points need to hand over program execution permissions to dynamic tracing frameworks. Framework execution logic is what developers write using dynamic languages.
So your program should first have probes. Fortunately, Linux kernel and other frameworks have laid out corresponding probe points. But in the Android application layer, there aren’t ready-made ones. So currently, frameworks you can use on Android, such as eBPF frameworks, are all used by kernel developers. Therefore, you can use dynamic frameworks on Android apps, but only professional and full-time performance analysis personnel might use this category of tools. It has two key points: probes and dynamic language. During program execution, corresponding probe points need to hand over program execution permissions to dynamic tracing frameworks. Framework execution logic is what developers write using dynamic languages.
1.3 Analysis Methods

Data Visualization Analysis
With increasing complexity of problem analysis, there’s a need to address performance issues involving multiple module interactions. In the industry, data visualization analysis methods have emerged that take time as the horizontal axis and put corresponding events in their respective lanes. This can conveniently see when events of concern occur, interaction information with other systems, etc. In Android, we commonly use Systrace/Perfetto, as well as earlier KernelShark and other tools—essentially all are tools of this category. The “Trace type” mentioned in “Data Types” often employs this visualization analysis method.
Systrace’s visualization framework is built based on Catapult, a sub-project of Chrome. Trace Event Format describes the data formats supported by Catapult. If you have Trace-type data, you can use this framework to display visualized data. AOSP compilation system, Android application compilation process, also has corresponding Trace file outputs. They all implemented visualization effects based on Catapult.
Database Analysis
When facing massive data analysis needs, by formatting data and converting them into two-dimensional tables, using SQL language can achieve efficient query operations. In the server field, ELK and similar technology stacks can achieve more flexible formatted search and statistical functions. With the help of databases and Python, you can even implement an automated data diagnosis toolchain.
From the above discussion, we can know that from text analysis to database analysis, the analysis purposes they face are different. Text analysis is sufficient for just looking at a module’s time consumption with log analysis. For interactions between multiple systems, we need to use visualization tools. For complex database analysis, we need to use SQL tools. Regardless of which analysis method, they’re all essentially data analysis. In practice, we frequently use other tools to transform data to support different analysis methods, for example, converting from text analysis to database analysis.
Choose the appropriate analysis method according to your purpose, and it will make your work twice as effective.
For Android developers, Google has provided several very important performance analysis tools to help system and application developers optimize their programs.
2 Google-Provided Android Performance Analysis Tools
Based on practical experience, the most commonly used tools are Systrace, Perfetto, and Profiler tools in Android Studio. After positioning main bottlenecks through them, you only need to use other domain-related tools. Therefore, we’ll focus on introduction of these three tools’ application scenarios, their advantages, and basic usage methods. For lateral comparison between tools, please refer to the “Comprehensive Comparison” section content in the next chapter.
2.1 First-Generation System Performance Analysis Tool — Systrace
Systrace is a Trace-type visualized analysis tool, a first-generation system-level performance analysis tool. All features supported by Trace type are supported by it. Before Perfetto appeared, it was basically the only performance analysis tool. It displays Android system and app’s running information in a graphical way. Compared to logs, Systrace’s image-based presentation is more intuitive. Compared to TraceView, its performance overhead when capturing Systrace is basically negligible, minimizing the impact on observers to the greatest extent.
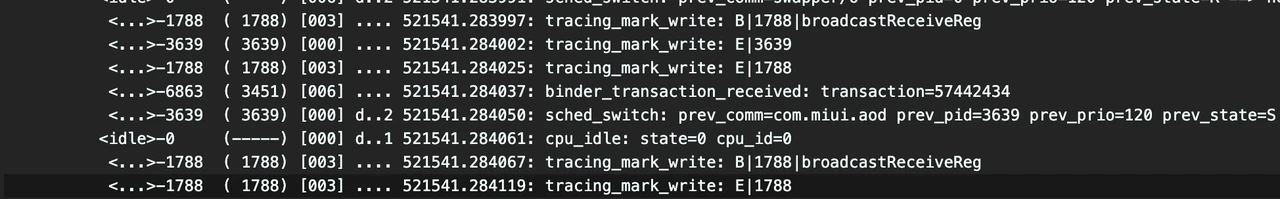
Systrace’s Design Philosophy
At critical system operations (such as Touch operations, Power button presses, swipe operations, etc.), system mechanisms (input distribution, View hierarchy, inter-process communication, process management mechanisms, etc.), and hardware/software information (CPU frequency information, CPU scheduler information, disk information, memory information, etc.), we insert log-like information at key processes, which we call TracePoint (essentially ftrace information), and use these TracePoints to display execution time of a core operation process, certain variable values, etc. The Android system then collects these TracePoints scattered in various processes, writes them to a file. After exporting this file, Systrace parses these TracePoints’ information to obtain the entire system’s running information over a period.
In the Android system, some important modules have already inserted some TracePoints by default, classified through TraceTags. The information sources are as follows:
- Framework Java layer’s TracePoints are completed through the android.os.Trace class
- Framework Native layer’s TracePoints are completed through the ATrace class
- App developers can customize TracePoints through the android.os.Trace class
In this way, Systrace can collect and centrally display all information of the Android upper layer, turning the entire Android system’s running state from a black box to a white box for Android developers and system developers. Global and visualization make Systrace the first choice for Android developers and system developers when analyzing complex performance problems.
Practical Application Scenarios
The parsed Systrace, having massive system information, is naturally suitable for analyzing Android App and Android system performance problems. Android’s app developers, system developers, and kernel developers can all use Systrace to analyze performance problems.
From a technical perspective, Systrace can cover the response speed, stuttering and dropped frames, and ANR these major categories.
From a user perspective, Systrace can analyze user-encountered performance problems, including but not limited to:
- Application startup speed issues, including cold startup, hot startup, warm startup
- Screen transition speed slow, screen-to-screen animation stuttering
- Other non-transition click operations slow (toggles, popups, long presses, selections, etc.)
- Screen lock/unlock speed slow, phone unlock slow
- Face recognition slow
- List scrolling stuttering
- Screen animation stuttering
- Screen loading stuttering
- Overall stuttering
- App click unresponsive, stuck, crashes
After encountering the above problems, you can use various methods to capture Systrace, open the parsed file in Chrome for analysis.
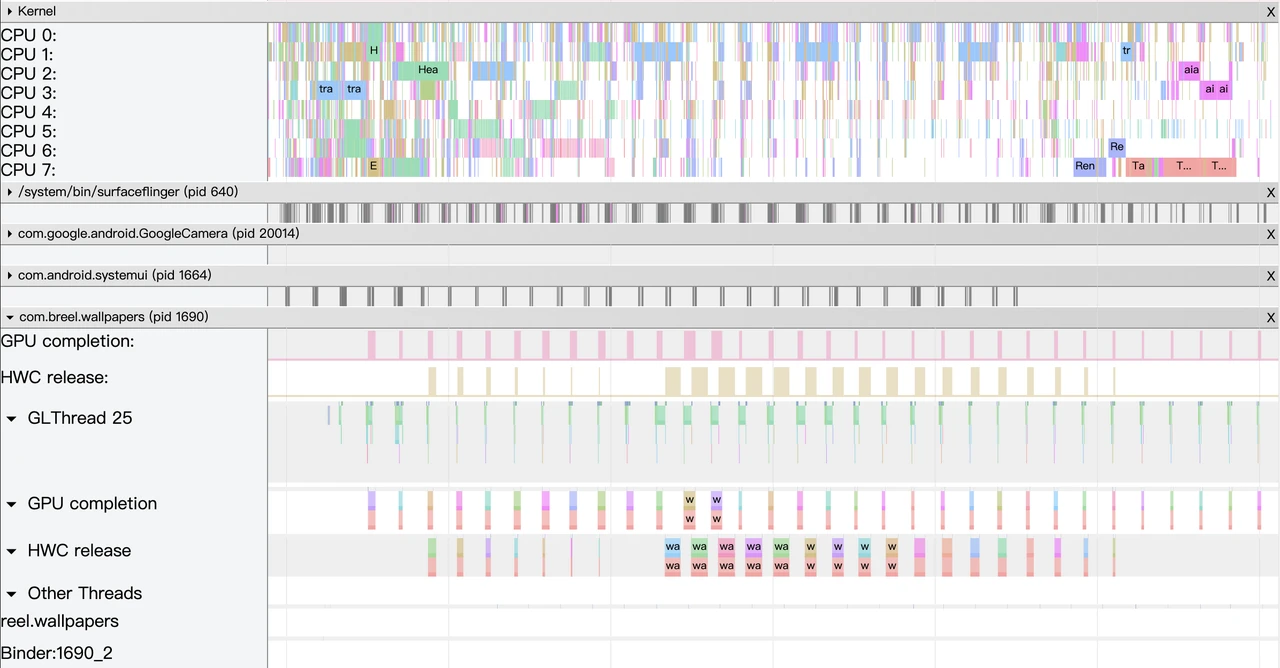
2.2 New-Generation Performance Analysis Tool Stack — Perfetto
Google made its first commit in 2017, and in the subsequent 4 years (up to December 2021), there were over 100 developers submitting nearly 3.7W commits, almost with PR and Merge operations every day, which is a quite active project. Besides powerful functionality, its ambition is also very large. Officially, it claims to be the next-generation cross-platform Trace/Metric data capture and analysis tool. Application is quite widespread. Besides Perfetto website, Windows Performance Tool and Android Studio, as well as Huawei’s GraphicProfiler also support Perfetto data’s visualization and analysis. We believe Google will continue investing resources into the Perfetto project, so it should be the next-generation performance analysis tool and will completely replace Systrace.
Highlighted Features
The biggest improvement of Perfetto compared to Systrace is support for long-duration data capture. This is thanks to having a service that can run in the background, implementing protobuf encoding and storage for incoming data. In terms of data sources, core principle is consistent with Systrace, also based on Linux kernel’s ftrace mechanism implementing user-space and kernel-space key event recording (ATRACE, CPU scheduler, etc.). All features supported by Systrace are also supported by Perfetto. That’s why it’s said Systrace will ultimately be replaced by Perfetto.
Perfetto supports the data types, acquisition methods, and analysis methods provided by it—unprecedentedly comprehensive. It almost supports all types and methods. In terms of data types, it implements Trace-type support through ATRACE, implements Metric-type support through a configurable node reading mechanism, and implements Log-type support through obtaining logcat data in UserDebug builds.
You can manually trigger capture and end through the perfetto.dev website, command-line tools, or even dynamically trigger capture through Developer Options in settings. It basically covers all scenarios you can encounter on your projects.
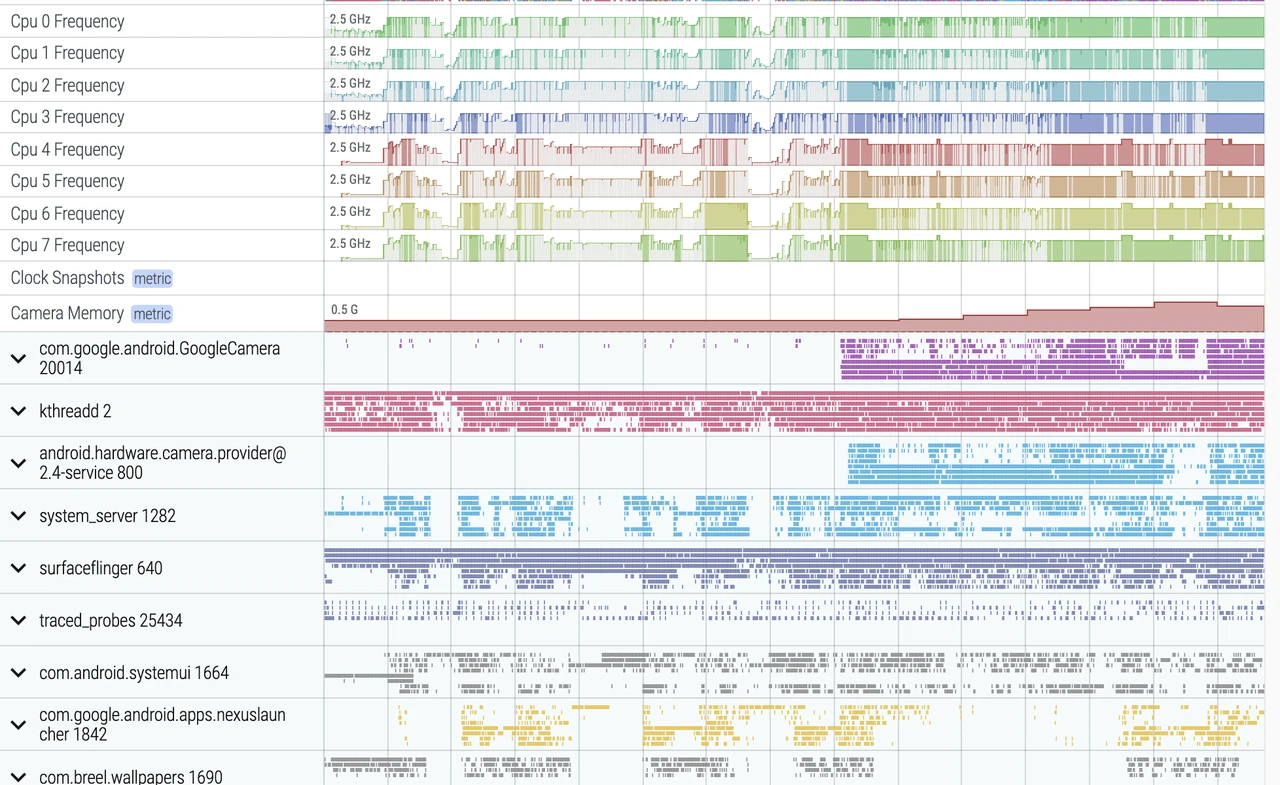
In terms of data analysis, Perfetto provides data visualization analysis webpages similar to Systrace operations, but the underlying implementation mechanism is completely different. The biggest benefit is it can support rendering of super-large files (exceeding 300M), which is what Systrace can’t do (it might crash when over 300M, or become very sluggish). In this visualization webpage, you can see various secondary processing data, can execute SQL queries, and even see logcat contents. Perfetto trace files can be converted into SQLite-based database files, which can both be executed on-site by writing SQL or execute pre-written SQL files. You can even import them into Jupyter and other data science tool stacks, sharing your analysis ideas with other partners.
For example, if you want to calculate the total CPU time consumption of SurfaceFlinger thread, or which threads are running in the kernel, etc., you can collaborate with domain experts to translate their experience into SQL commands. If this still doesn’t meet your needs, Perfetto also provides Python APIs to export data in nearly DataFrame format, almost achieving any data analysis effect you want.
This entire suite of developer-mineable points is quite extensive. From my team’s practical experience, it can cover function development, function testing, CI/CD, online monitoring, and expert system aspects and more. The subsequent articles in this star series will also focus on Perfetto’s powerful features and expert systems developed based on it, helping you “one-click answer” performance bottlenecks.
Practical Application Scenarios
The first tool used in performance analysis should be Perfetto, and scenarios using Systrace are becoming fewer. Therefore, the tool you should primarily master should be Perfetto, learn its usage and the indicators it provides.
However, Perfetto also has some limitations. First, although it provides relatively high flexibility, it’s essentially still a static data collector, not a dynamic tracing tool. There’s still a fundamental difference from eBPF. Secondly, runtime cost is relatively high because it involves converting Ftrace data to Perfetto data on the phone. Finally, it doesn’t provide text analysis methods, can only conduct additional analysis through webpage visualization or operating SQLite. In summary, Perfetto is functionally powerful, covering almost all aspects of observable technology, but the usage barrier is also relatively high. There are quite a few knowledge points worth digging and learning. Our subsequent articles will also focus on Perfetto’s powerful features and what can be developed based on it.
2.3 Android Studio Profiler Tools
Android’s application development integration environment (officially recommended) is Android Studio (previously Eclipse, but it’s been淘汰). It naturally also needs to integrate development and performance tuning together. Very fortunately, with the iteration and evolution of Android Studio, it now has its own performance analysis tool Android Profiler, which is a collection integrating multiple performance analysis tools into one, letting developers complete performance tuning work within Android Studio without needing to download other tools.
Currently, Android Studio Profiler has integrated 4 types of performance analysis tools: CPU, Memory, Network, Battery, of which CPU-related performance analysis tools are CPU Profiler, also the protagonist of this chapter. It integrates all CPU-related performance analysis tools together, and developers can choose which one to use based on their needs. Many people probably know that Google has already developed some independent CPU performance analysis tools, such as Perfetto, Simpleperf, Java Method Trace, etc. Now there’s another CPU Profiler, it’s obviously impossible to reinvent the wheel. CPU Profiler’s current approach is: obtain data from these known tools, then parse the data into the style you want, and display it through a unified interface.
Highlighted Features
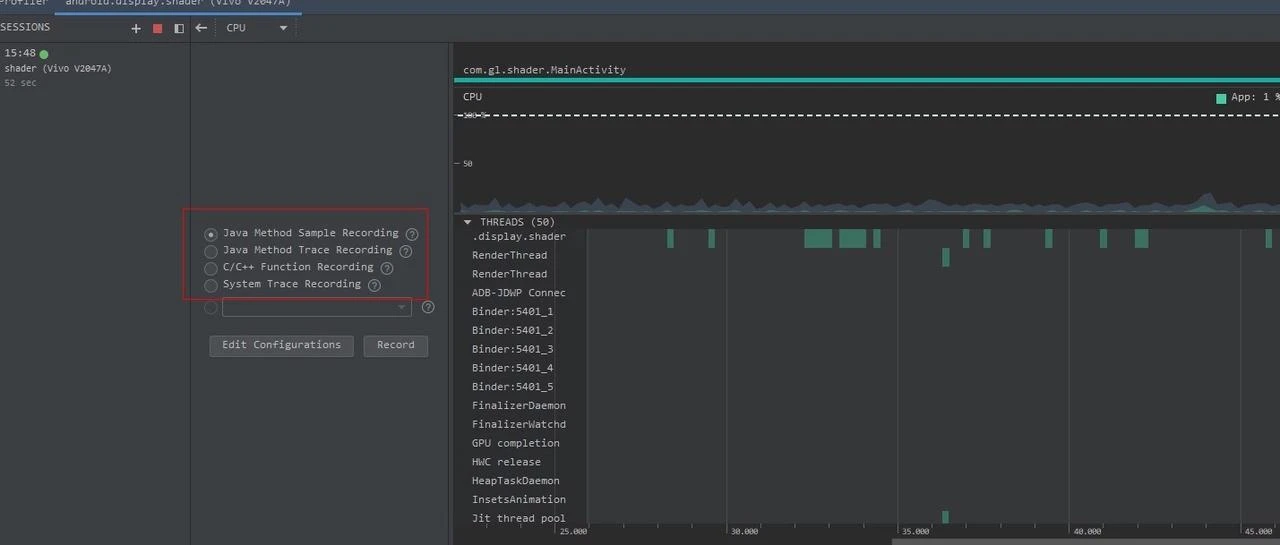
CPU Profiler integrates performance analysis tools: Perfetto, Simpleperf, Java Method Trace, naturally possessing all or some of these tools’ functions, as follows:
System Trace Recording, which uses Perfetto-captured information and can be used to analyze process function duration, scheduling, rendering, etc., but it’s a streamlined version, can only display process-related information and filters out short-duration events. It’s recommended to export Trace to file and analyze it on https://ui.perfetto.dev/.
Java Method Trace Recording, which obtains function call stack information from the virtual machine for analyzing Java function calls and duration.
C/C++ Function Trace, which uses Simpleperf-captured information. Simpleperf is a CPU performance monitoring component of the PMU hardware module obtaining data. C/C++ Function Trace only has partial features of Simpleperf, used for analyzing C/C++ function calls and duration.
Practical Application Scenarios
Application performance problems are mainly divided into two categories: slow response and non-smooth.
- Slow response problems often include: slow application startup, slow page transitions, slow list loading, slow button response, etc.
- Non-smooth problems often include: non-smooth list scrolling, non-following finger swipes, animation stuttering, etc.
How should CPU Profiler be used in these scenarios? The basic approach is: first capture a System Trace, analyze with System Trace first, position the problem. If you can’t position the problem, then further analyze using Java Method Trace or C/C++ Function Trace.
Take a very poor performance application as an example, we inserted a Systrace TracePoint at a key location in the system. If you’re not familiar with the code, how do you find the performance bottleneck? First, let’s run the application, record a System Trace through CPU Profiler (later articles will introduce tool usage methods), as follows:
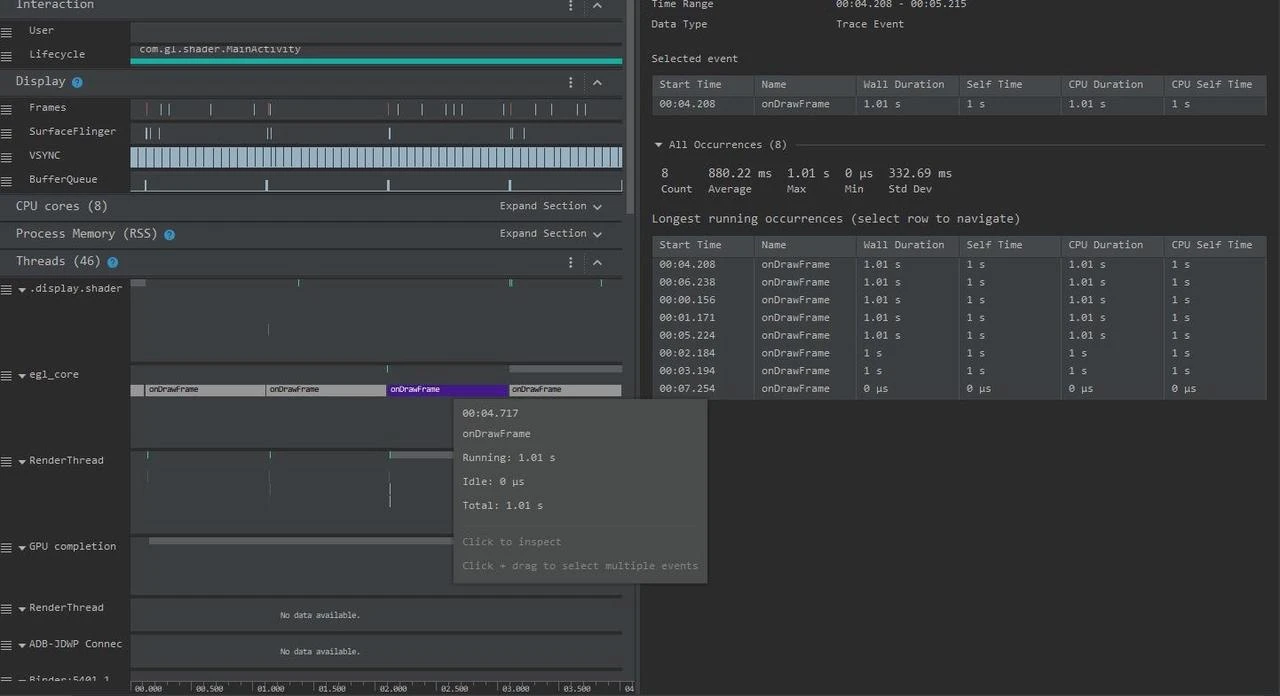
From the above Trace, you can know that it’s the onDrawFrame operation in the egl_core thread that’s time-consuming. If you don’t find a problem, it’s recommended to export to https://ui.perfetto.dev/ for further analysis. You can look up source code to see what onDrawFrame is. We found through searching that onDrawFrame is a Java function’s onDrawFrame, and we need to analyze Java function time consumption. we need to record a Java Method Trace, as follows:
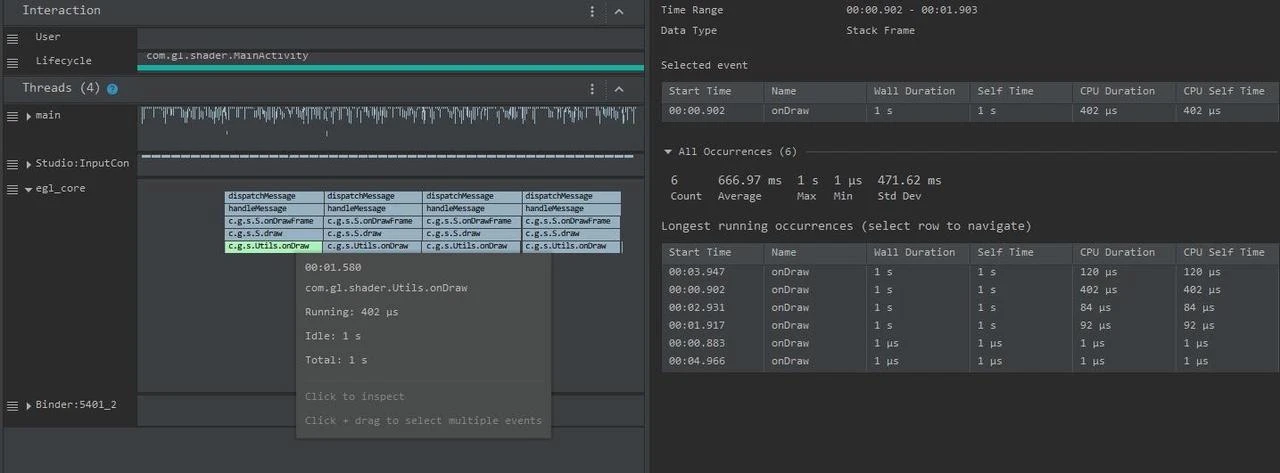
Through the above Trace, it’s easy to discover it’s a native function called Utils.onDraw that’s time-consuming. Since it involves C/C++ code, we need to record a C/C++ Function Trace to further analyze, as follows:
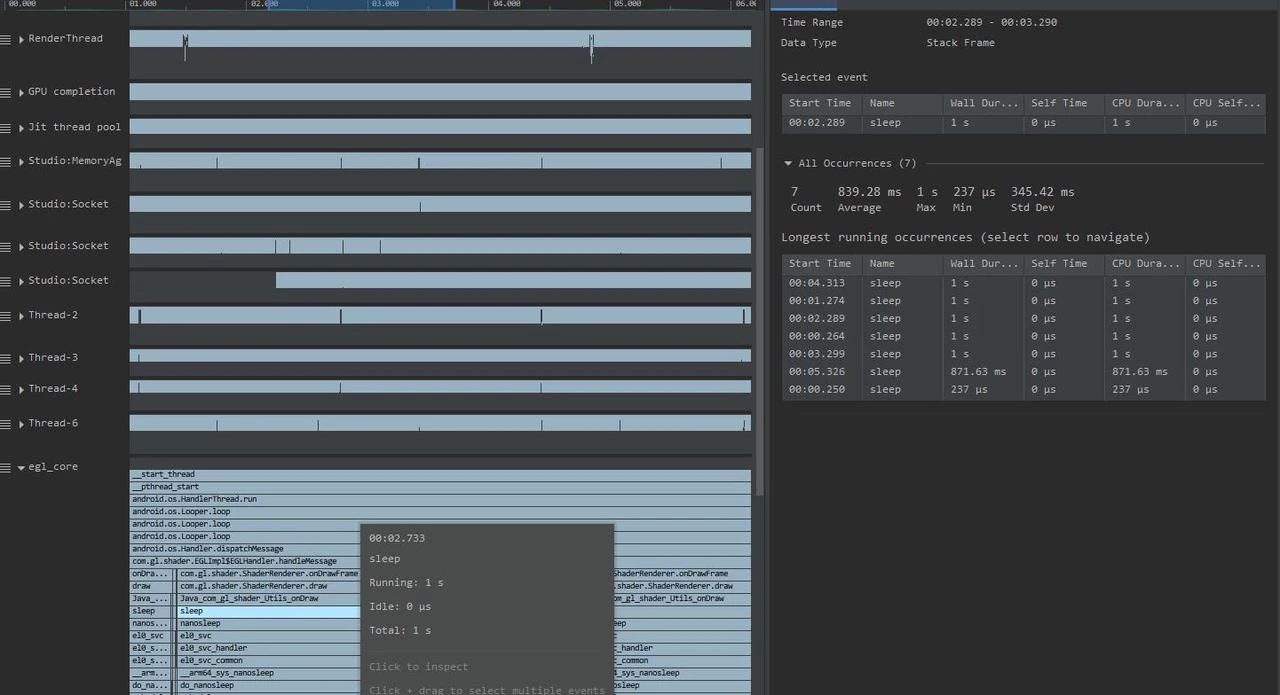
You can discover now that the native function’s java_com_gl_shader_Utils_onDraw executes sleep, which is the culprit causing performance low!
The biggest advantage of CPU Profiler in AS is integrating various sub-tools. In one place, you can operate everything, which is very convenient for application developers. However, it might not be that lucky for system developers.
2.4 Comprehensive Comparison
| Tool Name | Application Scenarios | Data Type | Acquisition Method | Analysis Method |
|---|---|---|---|---|
| Systrace | Android system and app performance analysis | Trace type | Unconditional capture continuous dumping | Visualized analysis |
| Perfetto | Android system and app performance analysis | Metric type Trace type | Unconditional capture continuous dumping | Visualized analysis Database analysis |
| AS Profiler | Android system and app performance analysis | Trace type | Unconditional capture continuous dumping | Visualized analysis |
| SimplePerf | Java/C++ function execution duration analysis PMU counters | Trace type | Unconditional capture continuous dumping | Visualized analysis Text analysis |
| Snapdragon Profiler Tools & Resources | Mainly Qualcomm GPU performance analyzer | Trace type Metric type | Unconditional capture continuous dumping | Visualized analysis |
| Mali Graphics Debugger | ARM GPU analyzer (MediaTek, Kirin chips) | Trace type Metric type | Unconditional capture continuous dumping | Visualized analysis |
| Android Log/dumpsys | Comprehensive analysis | Log type | Conditional capture Continuous capture without dumping | Text analysis |
| AGI(Android GPU Inspector) | Android GPU analyzer | Trace type Metric type | Unconditional capture continuous dumping | Visualized analysis |
| eBPF | Linux kernel behavior dynamic tracking | Metric type | Dynamic tracing with conditional capture continuous capture without dumping | Text analysis |
| Ftrace | Linux kernel instrumentation | Log type | Static code with conditional capture continuous capture without dumping | Text analysis |
3 About “Techniques, Methods, and Tools”
Technical changes and improvements are more embodied at the “Tool” level. The development trajectory of Linux communities and Google’s tools development direction is moving toward improving tool integration, making it convenient to find needed information in one place, or toward obtaining more information. In summary, their development trajectory is traceable and development patterns can be summarized. We need to accurately recognize their capabilities and application scenarios during rapid tool iteration. Their purpose is to improve problem-solving efficiency, not to spend time learning new tools.
The “Methods” level depends on specific business knowledge. Knowing how a frame is rendered, how CPU chooses process scheduling, how IO is dispatched, etc. Only by understanding business knowledge can you correctly choose tools and correctly interpret information provided by tools. As experience enriches, sometimes you don’t even need to see detailed information provided by tools, and you can find clues. This is a kind of ability that forms complex associative information in your brain after your business knowledge becomes rich to a certain extent. Then you navigate above tools—a capability formed when your business knowledge is rich to a certain level.
The “Tao” (Way) level considers what problem to solve, what’s the essence of the problem? What degree to achieve and what cost to invest to achieve what effect. To solve a problem, what path has the highest “input-output ratio”? What’s the overall strategy? To complete one thing, what do you do first, what do you do next, and what’s the dependency logic between front and back?
In subsequent articles, we will explain a technique, a feature according to the “Techniques, Methods, and Tools” approach. We don’t just want you to learn a knowledge point, but more want to spark your ability to think comprehensively by three aspects. When encountering similar tools or similar problems, even if they’re completely different systems, you can cope calmly. Firmly grasp the essence, evaluate the “input-output ratio” to choose appropriate tools or information, efficiently solve problems.
4 About “The Performance Knowledge Planet”
To better communicate and output high-quality articles, we created a knowledge planet named “The Performance”, mainly maintained by three first-tier developers from domestic phone manufacturers in the performance optimization field, with many years of work experience in performance-related domains. It provides Android performance-related one-stop knowledge services, covering basics, methodology, tool usage, and most valuable case analyses.
Currently, the planet’s content planning is as follows (## between different sections are tags, and related topics will all have corresponding tags, making it convenient for everyone to click interested tags to view corresponding knowledge)
#ThePerformance# — You can read ahead the electronic book “Android Performance Optimization - Systematic Course” which will be releasing written chapters every week. “Android Performance Optimization - Systematic Course” is an Android performance optimization electronic book we’re planning. Currently, there are quite a few high-quality performance optimization theoretical knowledge articles and practice articles and open source libraries in the developer community, but currently there’s a lack of a complete, systematic book covering performance optimization principles, tools, and practices, oriented toward beginner and intermediate developers, app developers and system developers, and continuously updated. The book’s outline (tentative) is basically ready, and it’s expected to take about a year to complete. In the planet, written chapters will be released, letting everyone see them in advance.
Part 1: → Performance Engineering
Part 2: → Analyzing Android Interaction and Core Systems from a Performance Perspective
Part 3: → Analyzing Linux Kernel Core Subsystem Design and Implementation
Part 4: → Problem Scenario Analysis Approach
Part 5: → Analysis and Debugging Tools
Part 6: → Quality Guardianship — Performance Monitoring Methods and Tools
#PerformanceTools# — Sharing performance analysis tools used in Android development and their usage methods, also providing 1v1 video guidance for Systrace, Perfetto, and other performance tools. Tool usage is better demonstrated through video—it’s more intuitive. Articles are static and many places are hard to explain clearly. 1v1 video conference guidance is also a learning method.
#CaseAnalysis# — Classic case analysis approach summaries, planet friend-provided case analyses and discussions. Case analysis is a very important learning approach. Reading many actual performance cases is very helpful for your own analysis and performance problem solving later. At the same time, everyone is welcome to provide cases and solutions. If you’re worried about leaking information, we’ll mask key information.
#ClassicReinterpretation# — Classic solutions, course re-readings. For example, in-depth analysis of third-party library analysis, Android expert masterclass re-readings, etc. We can conduct in-depth analysis of solutions, lateral comparisons, etc.; for Android expert masterclass re-readings and leak fixing.
#KnowledgeShare# — Excellent articles, blogs, tool sharing. There are many excellent blogs in the industry, source solutions that have stood actual business tests, various performance tools, etc. We’ll look for these excellent contents and share them with everyone.
#KnowledgeDeposition# — WeChat group chat精华, WeChat Q&A, blog comment answers, etc.
#PerformanceInterview# — Collection and answers to Android performance-related interview questions. It’s considered a necessity, right?
#ProgrammingLanguage# — Programming language usage technique sharing.
#EfficiencyImprovement# — Efficiency improvement sharing, including developer efficiency, work efficiency improvement methods, engineering efficiency, tool recommendations, etc. Not misusing a sword to chop firewood.
#IndustryDynamics# — First-time interpretation reports of new performance-related technologies, including but not limited to the following content:
- Industry summits, academic summit new concept interpretation reports
- Papers, industry, books, video introductions
- Android large version performance-related content introduction
- Android new hardware performance-related content introduction
- Android performance-related open source project interpretations
#BigNameSharing# — Monthly invitations to industry experts for experience sharing, case analyses

Note: iOS phone users should not directly pay in the planet. Long-press the image in WeChat interface to join via QR code scan. Otherwise, Apple will charge expensive subscription fees.
5 Appendix
Perfetto Project Address
- Official usage documentation: https://perfetto.dev/docs/
- Github code library: https://github.com/google/perfetto, where you can report bugs or feature requests, and of course can submit PR contributions to contribute your strength.
Android GPU Inspector
- Official usage documentation: https://developer.android.com/agi
Other Major Manufacturers’ Performance Analysis Tools
About Me && Blog
Below is a personal introduction and related links. I look forward to communicating with colleagues in the same field. When three walk together, there must be my teacher!
- Blogger Personal Introduction: Inside are personal WeChat and WeChat group links.
- Blog Content Navigation: A navigation of personal blog content.
- Personally Organized and Collected Excellent Blog Articles - Essential Skills and Tools for Android Performance Optimization: Everyone is welcome to self-recommend and recommend (private WeChat chat is fine).
- Android Performance Optimization Knowledge Planet: Welcome to join, thank you for your support~
“An individual can move faster, a group can go further.”