The previous article Android Perfetto Series 1: Introduction to Perfetto introduced what Perfetto is. This article provides a brief introduction to Perfetto capture.
With Google announcing the deprecation of the Systrace tool and the release of Perfetto, Perfetto has basically replaced Systrace in my daily work. At the same time, major manufacturers like OPPO and Vivo have also switched from Systrace to Perfetto. Many friends who are new to Android performance optimization feel a headache when facing the dazzling interface and complex functions of Perfetto. They hope that I can present those previous Systrace articles using Perfetto.
Table of Contents
- Perfetto Series Catalog
- Main Content
- 1. Using Command Line to Capture Perfetto (Recommended)
- 2. Using Official Script to Capture
- 3. Using On-Device Developer Tools to Capture
- 4. Using Web Interface to Capture
- Reference Documents
- About Me && Blog
Paul Graham said: “Either give a lot of people something they kind of want, or give a small number of people something they really want.“ Perfetto is actually something that a small number of people really want, so let’s start writing. I welcome everyone to exchange and communicate. If you find errors or inaccurate descriptions, please inform me in time, and I will modify them in time to avoid misleading others.
This series aims to examine the overall operation of the Android system from a new perspective through the tool Perfetto. In addition, it also aims to provide a different angle to learn key modules such as App, Framework, and Linux. Although you may have read many articles about Android Framework, App, and performance optimization, you may still feel confused because it is difficult to remember the code or understand its running process. Through the graphical tool Perfetto, you may gain a deeper understanding.
Perfetto Series Catalog
- Android Perfetto Series Catalog
- Android Perfetto Series 1: Introduction to Perfetto
- Android Perfetto Series 2: Capturing Perfetto Traces
- Android Perfetto Series 3: Familiarizing with the Perfetto View
- Android Perfetto Series 4: Opening Large Traces via Command Line
- Android Perfetto Series 5: Choreographer-based Rendering Flow
- Android Perfetto Series 6: Why 120Hz? Advantages and Challenges
- Android Perfetto Series 7: MainThread and RenderThread Deep Dive
- Android Perfetto Series 8: Understanding Vsync and Performance Analysis
- Android Perfetto Series 9: Interpreting CPU Information
- Android Perfetto Series 10: Binder Scheduling and Lock Contention
- Video (Bilibili) - Android Perfetto Basics and Case Studies
- Video (Bilibili) - Android Perfetto: Trace Graph Types - AOSP, WebView, Flutter + OEM System Optimization
If you haven’t seen the Systrace series yet, here is the portal:
- Systrace Series Catalog: Systematically introduced the use of Systrace, the predecessor of Perfetto, and used Systrace to learn and understand the basic rules of Android performance optimization and Android system operation.
- Personal Blog: Personal blog, mainly content related to Android, and also put some content related to life and work.
Welcome everyone to join the WeChat group or Planet on the About Me page to discuss your problems, the parts about Perfetto you most want to see, and discuss all Android development related content with group friends.
Main Content
The steps for using Perfetto to analyze problems are the same as using Systrace:
- First you need to capture the Perfetto file
- Open the Trace file in ui.perfetto.dev for analysis or use the command line for analysis
This article simply introduces the method of using Perfetto to capture Trace files. Personally, I recommend using the command line to capture. Whether it is a command line configured by yourself or an official command line tool, it is very practical.
1. Using Command Line to Capture Perfetto (Recommended)
Basic Command - adb shell perfetto
For friends who have always used the Systrace tool, capturing Trace via command line is very convenient. Similarly, Perfetto also provides a simple command line to capture, and the simplest usage method is basically consistent with Systrace. You can directly connect to your Android device and use the /system/bin/perfetto command to start tracing. For example:
1 | // 1. First execute the command |
This command will start a 20-second trace, collect user-specified data source information, and save the trace file to /data/misc/perfetto-traces/trace_file.perfetto-trace.
Execute the adb pull command to pull the trace out, and you can open it directly on ui.perfetto.dev.
Advanced Command - adb shell perfetto with config file
This is where Perfetto differs from Systrace. Perfetto can capture a lot of information, and its data sources are also very diverse. It is very inconvenient to add a lot of configurations with the command line every time. At this time, we can use a separate Configuration File (Config) to store this information. Each time we capture, we can just specify this configuration file.
For passing Perfetto configuration files on versions before and after Android 12, here are detailed guides and corresponding command line examples.
On Android 12 and later devices
Starting from Android 12, you can directly use the /data/misc/perfetto-configs directory to store configuration files, so you don’t need to pass the configuration file through stdin. The specific command is as follows:
1 | adb push config.pbtx /data/misc/perfetto-configs/config.pbtx |
In this example, first push the configuration file config.pbtx to the /data/misc/perfetto-configs directory. Then, start tracing directly in the Perfetto command by specifying the path of the configuration file via the -c option.
On devices before Android 12
Due to strict SELinux rules, passing the configuration file directly through the file path will fail on non-root devices. Therefore, you need to use standard input (stdin) to pass the configuration file. This can be achieved by cating the contents of the configuration file to the Perfetto command. The specific command is as follows:
1 | adb push config.pbtx /data/local/tmp/config.pbtx |
Here, config.pbtx is your Perfetto configuration file. First use the adb push command to push it to the temporary directory of the device. Then, use the cat command to pass the contents of the configuration file to the Perfetto command.
Source of Config
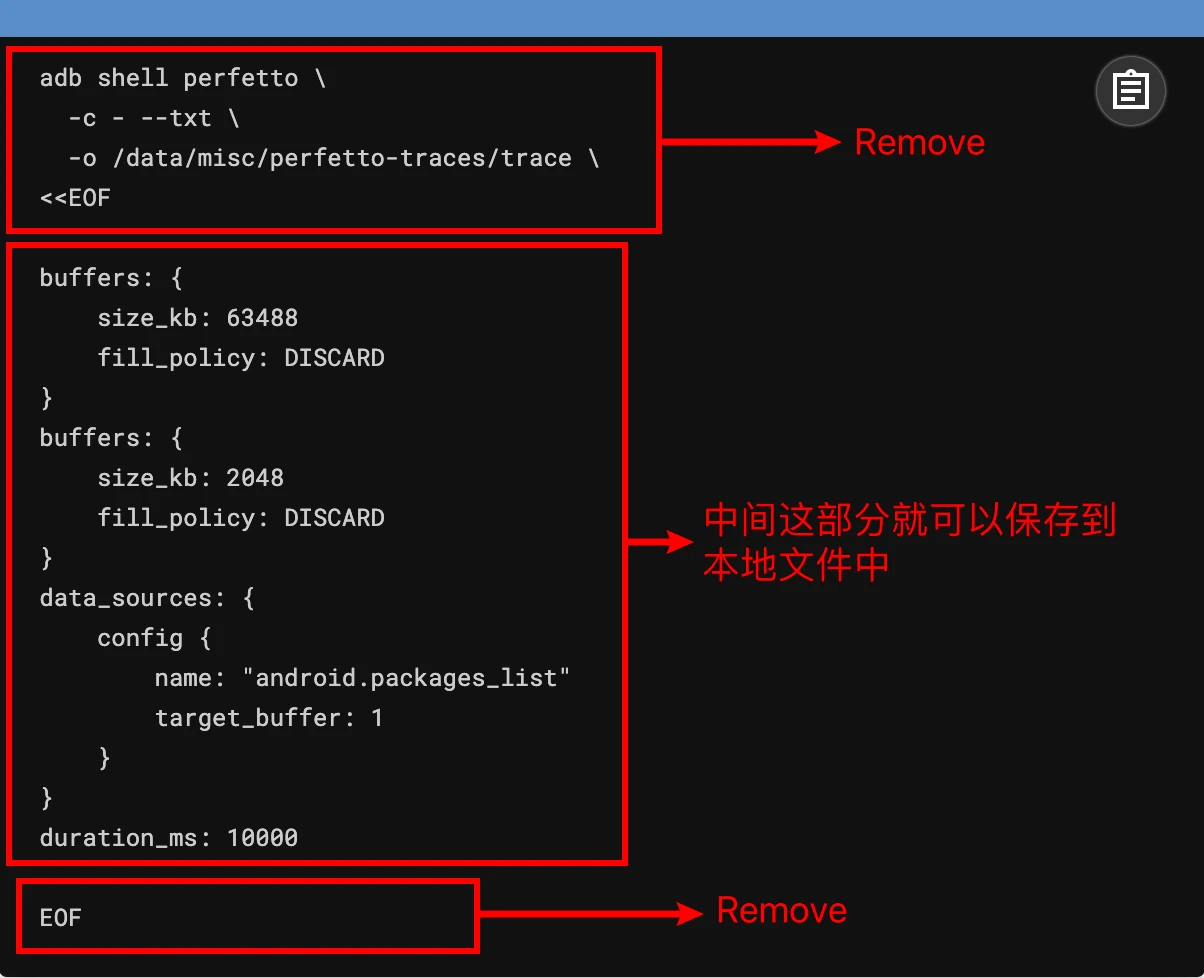
For Config, I suggest using Record new trace on ui.perfetto.dev to select and customize, and then save it to a local file. Different scenarios just load different Configs. The last part of the article talks about this in detail, you can take a look if you are interested.
The official also provides a share button. You can share your own config with others, which is very convenient. At the same time, I will also create a Github library for everyone to share (in progress).
The official code repository also has some configured ones, you can download and use them yourself: https://cs.android.com/android/platform/superproject/main/+/main:external/perfetto/test/configs/
Precautions
- Ensure adb is normal: Before using these commands, please make sure your device has USB debugging enabled and has been correctly connected via the
adb devicescommand. - Ctrl+C Interrupt: When using the
adb shell perfettocommand, if you try to use Ctrl+C to end the trace early, this signal will not be propagated through ADB. If you need to end tracking early, it is recommended to use an interactive PTY-based session to runadb shell. - SELinux Restrictions: On non-root devices before Android 12, due to strict SELinux rules, configuration files can only be passed via
cat config | adb shell perfetto -c -(where-c -means read configuration from standard input). Starting from Android 12, the/data/misc/perfetto-configspath can be used to store configuration files. - On versions before Android 10, adb cannot directly pull
/data/misc/perfetto-tracesout. You can useadb shell cat /data/misc/perfetto-traces/trace > traceinstead.
2. Using Perfetto Official Script to Capture (Strongly Recommended)
The Perfetto team also provides a convenient script tools/record_android_trace that simplifies the process of recording traces from the command line. This script automatically handles path issues, pulls the trace file automatically after tracking is completed, and opens it in the browser. Essentially, this script still uses the adb shell perfetto command, but the official helped you encapsulate it. Usage example:
On Linux and Mac:
1 | curl -O https://raw.githubusercontent.com/google/perfetto/master/tools/record_android_trace |
On Windows:
1 | curl -O https://raw.githubusercontent.com/google/perfetto/master/tools/record_android_trace |
Similarly, you can also specify the configuration file via -c here, for example:
1 | curl -O https://raw.githubusercontent.com/google/perfetto/master/tools/record_android_trace |
This will record a 10-second trace and save the output file as trace_file.perfetto-trace.
After execution, it will automatically capture the Trace and automatically open it in the browser, which is very convenient.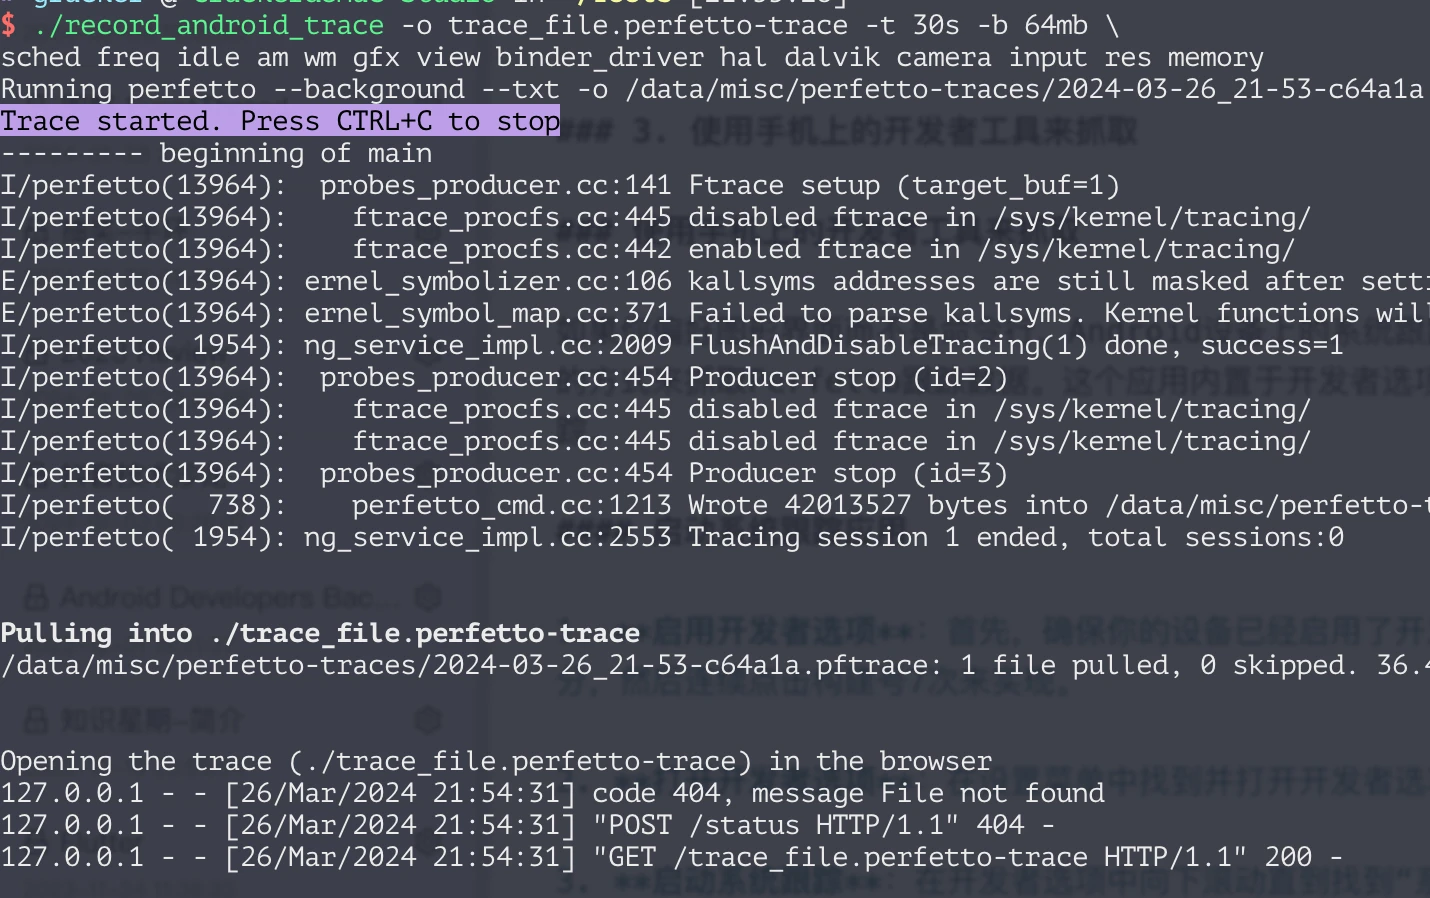
The script content can be viewed directly by visiting: https://raw.githubusercontent.com/google/perfetto/master/tools/record_android_trace
3. Using On-Device Developer Tools to Capture
Of course, sometimes there is no way to connect to a computer, or the test content cannot correct USB. At this time, you can use the built-in system tracing application (System Tracing App) on Android to capture Trace. This application is built into the developer options and allows you to configure and start performance tracking in a few simple steps.
Start System Tracing Application
Enable Developer Options: First, make sure your device has enabled developer options. If there is no developer option in your settings, you need to find the compilation number in About Phone, and then click 7 times continuously to open the developer options.
Open Developer Options: Find and open developer options in the Settings menu.
Start System Tracing: Scroll down in the developer options until you find “System Trace” or similar options. Click it and the system tracking application will open.
It looks roughly like this (each phone may have differences in interface or text, but the function is the same)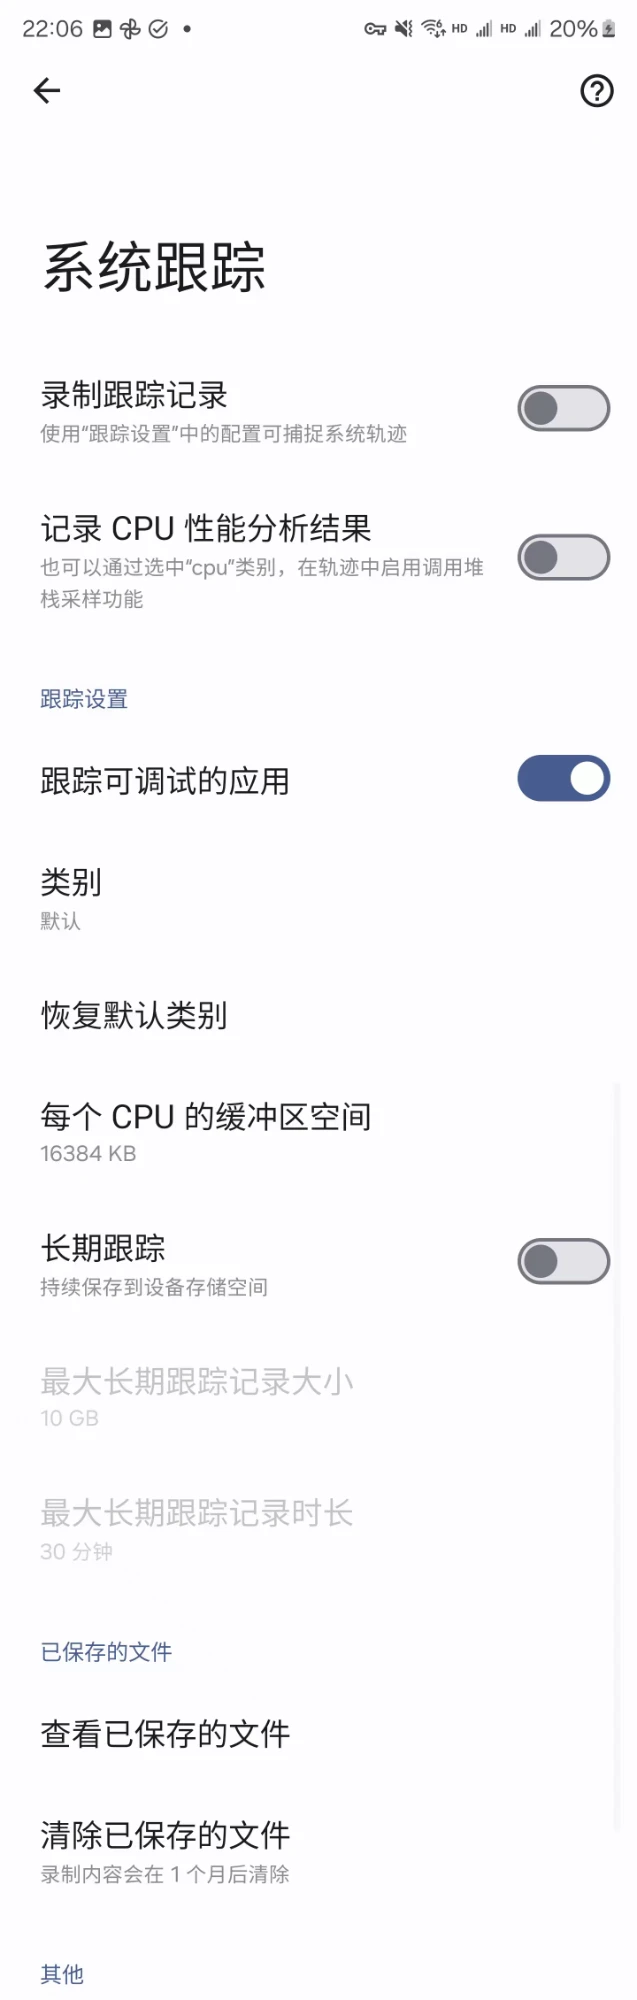
The system trace application provides a series of configuration options, including but not limited to:
- Trace Duration: You can specify the duration of the trace, such as 10 seconds or longer.
- Data Source: Select the source from which you want to collect data. This may include multiple different data sources such as CPU, memory, network, etc.
- Output File Location: Specify the location where the trace file is saved.
Start and Stop Tracing
After configuring all the required parameters, you can start tracking by clicking the “Record trace” button. Click the “Record trace” button again to end the capture. After the capture is completed, there will usually be a prompt telling you that the capture has been completed and providing options to view or share the trace file. You can export the trace file to a computer and use the Perfetto web UI for deeper analysis.
4. Using Web Interface to Capture
The capture function on the web side is relatively confusing. Many times you will fail to capture, for example, adb cannot be connected, or it says you need to execute kill after connecting. So I recommend everyone to use the configured command line to capture. The web side is more suitable for Config configuration.
Perfetto also provides a powerful Web Tool (ui.perfetto.dev), allowing developers to configure and start tracking through the browser. You just need to visit the website, click “Record new trace”, and then select data sources and configuration parameters as needed. Make sure your device is connected to the computer via ADB, and select “Add ADB device” on the web page. After that, click “Start Recording” to start collecting tracking data.
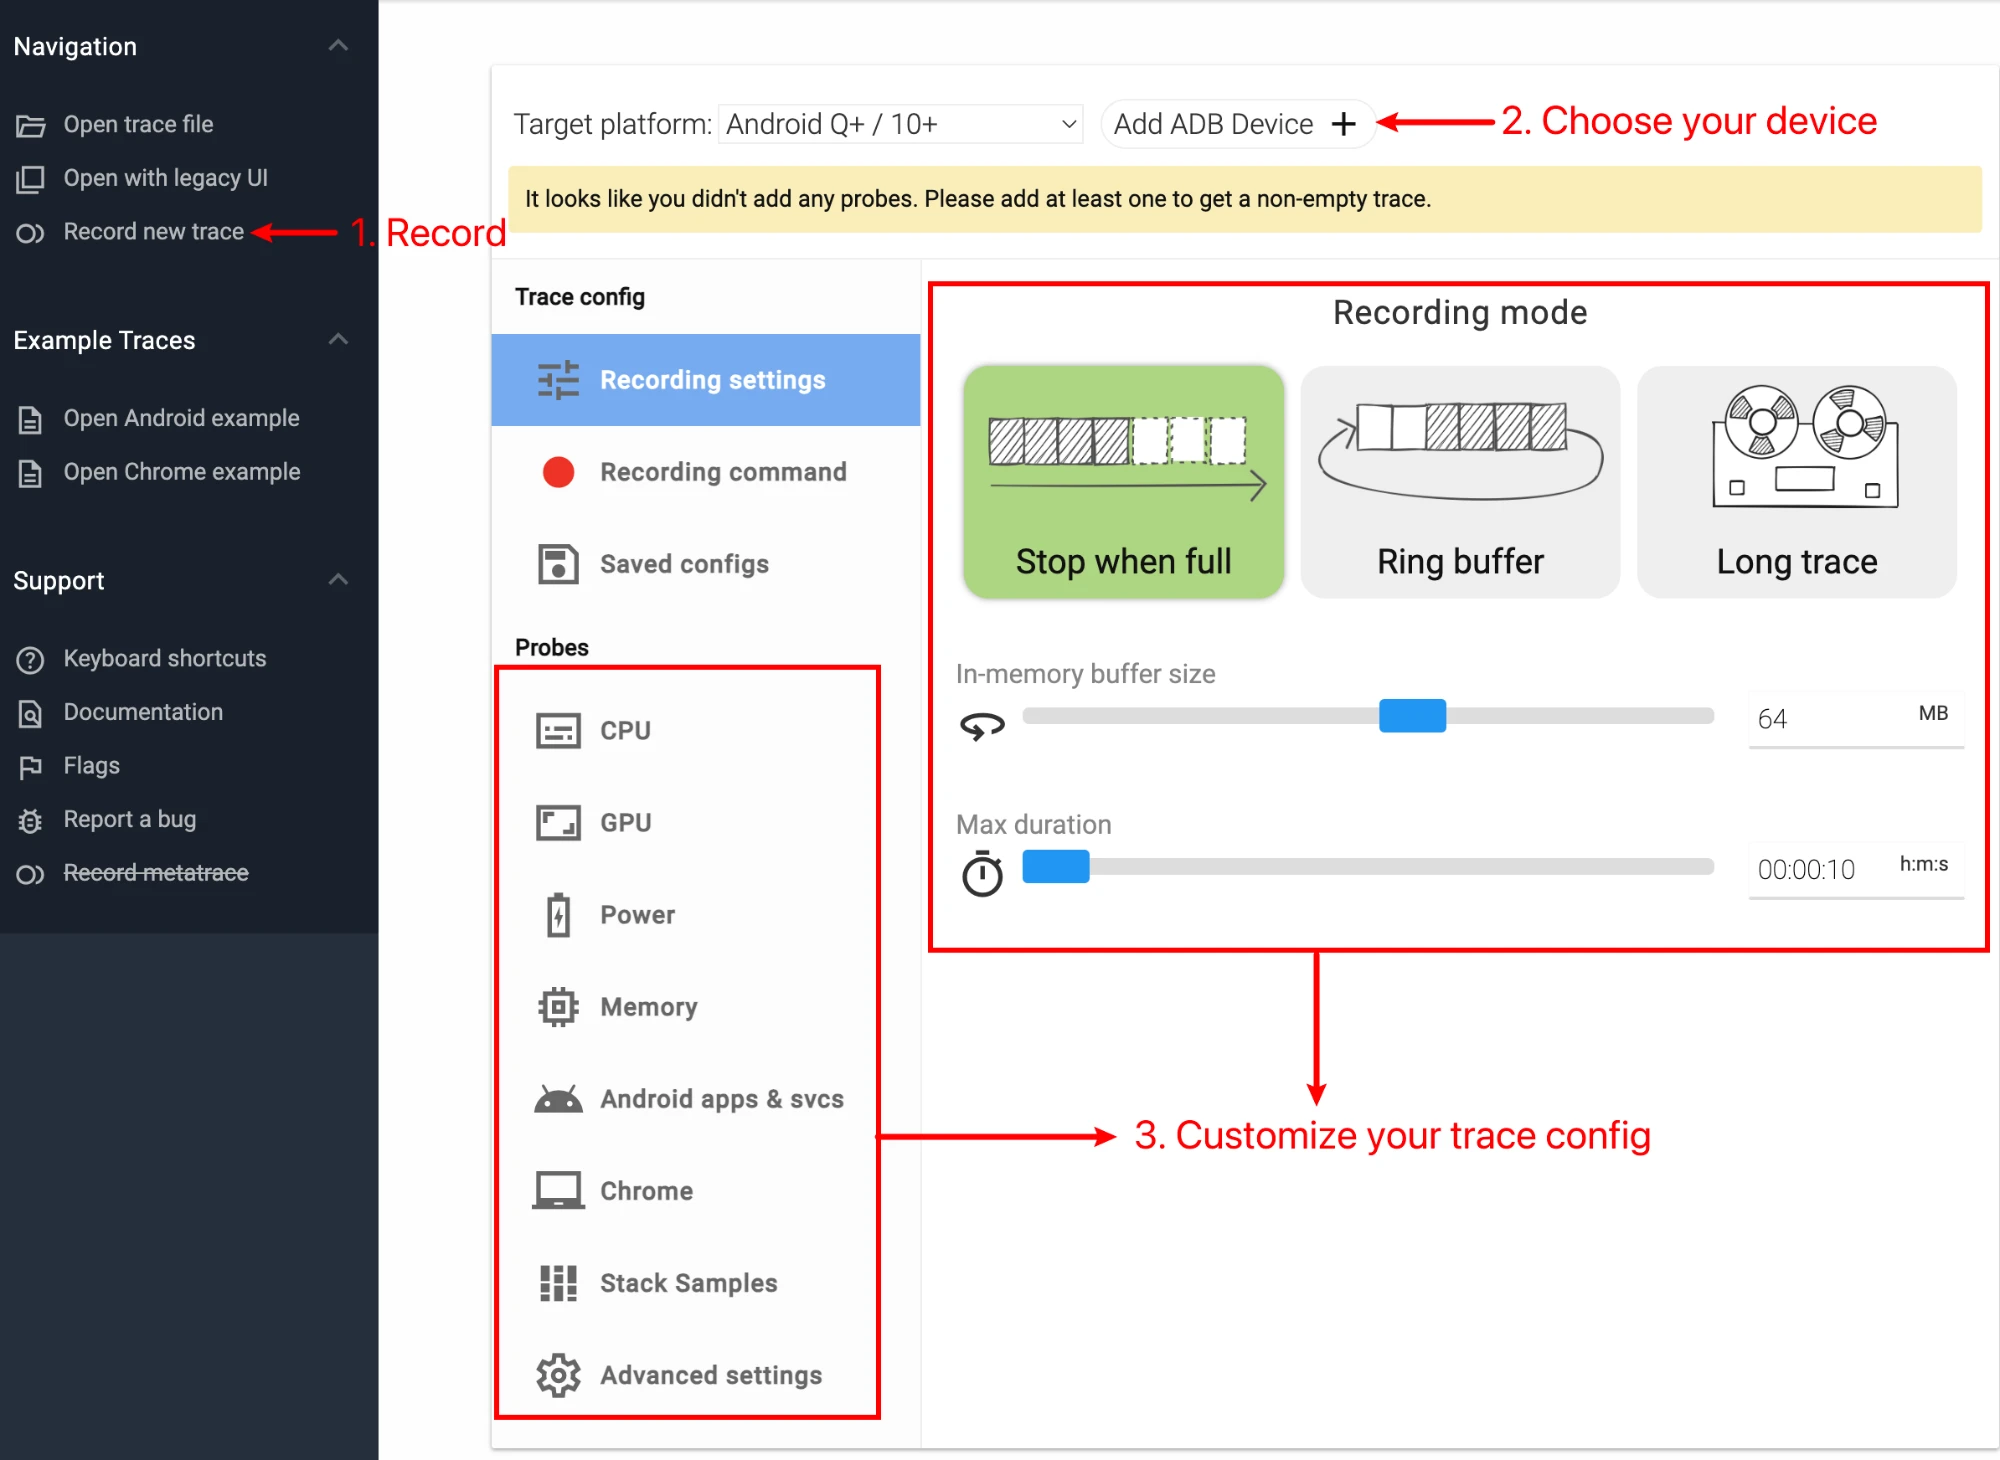
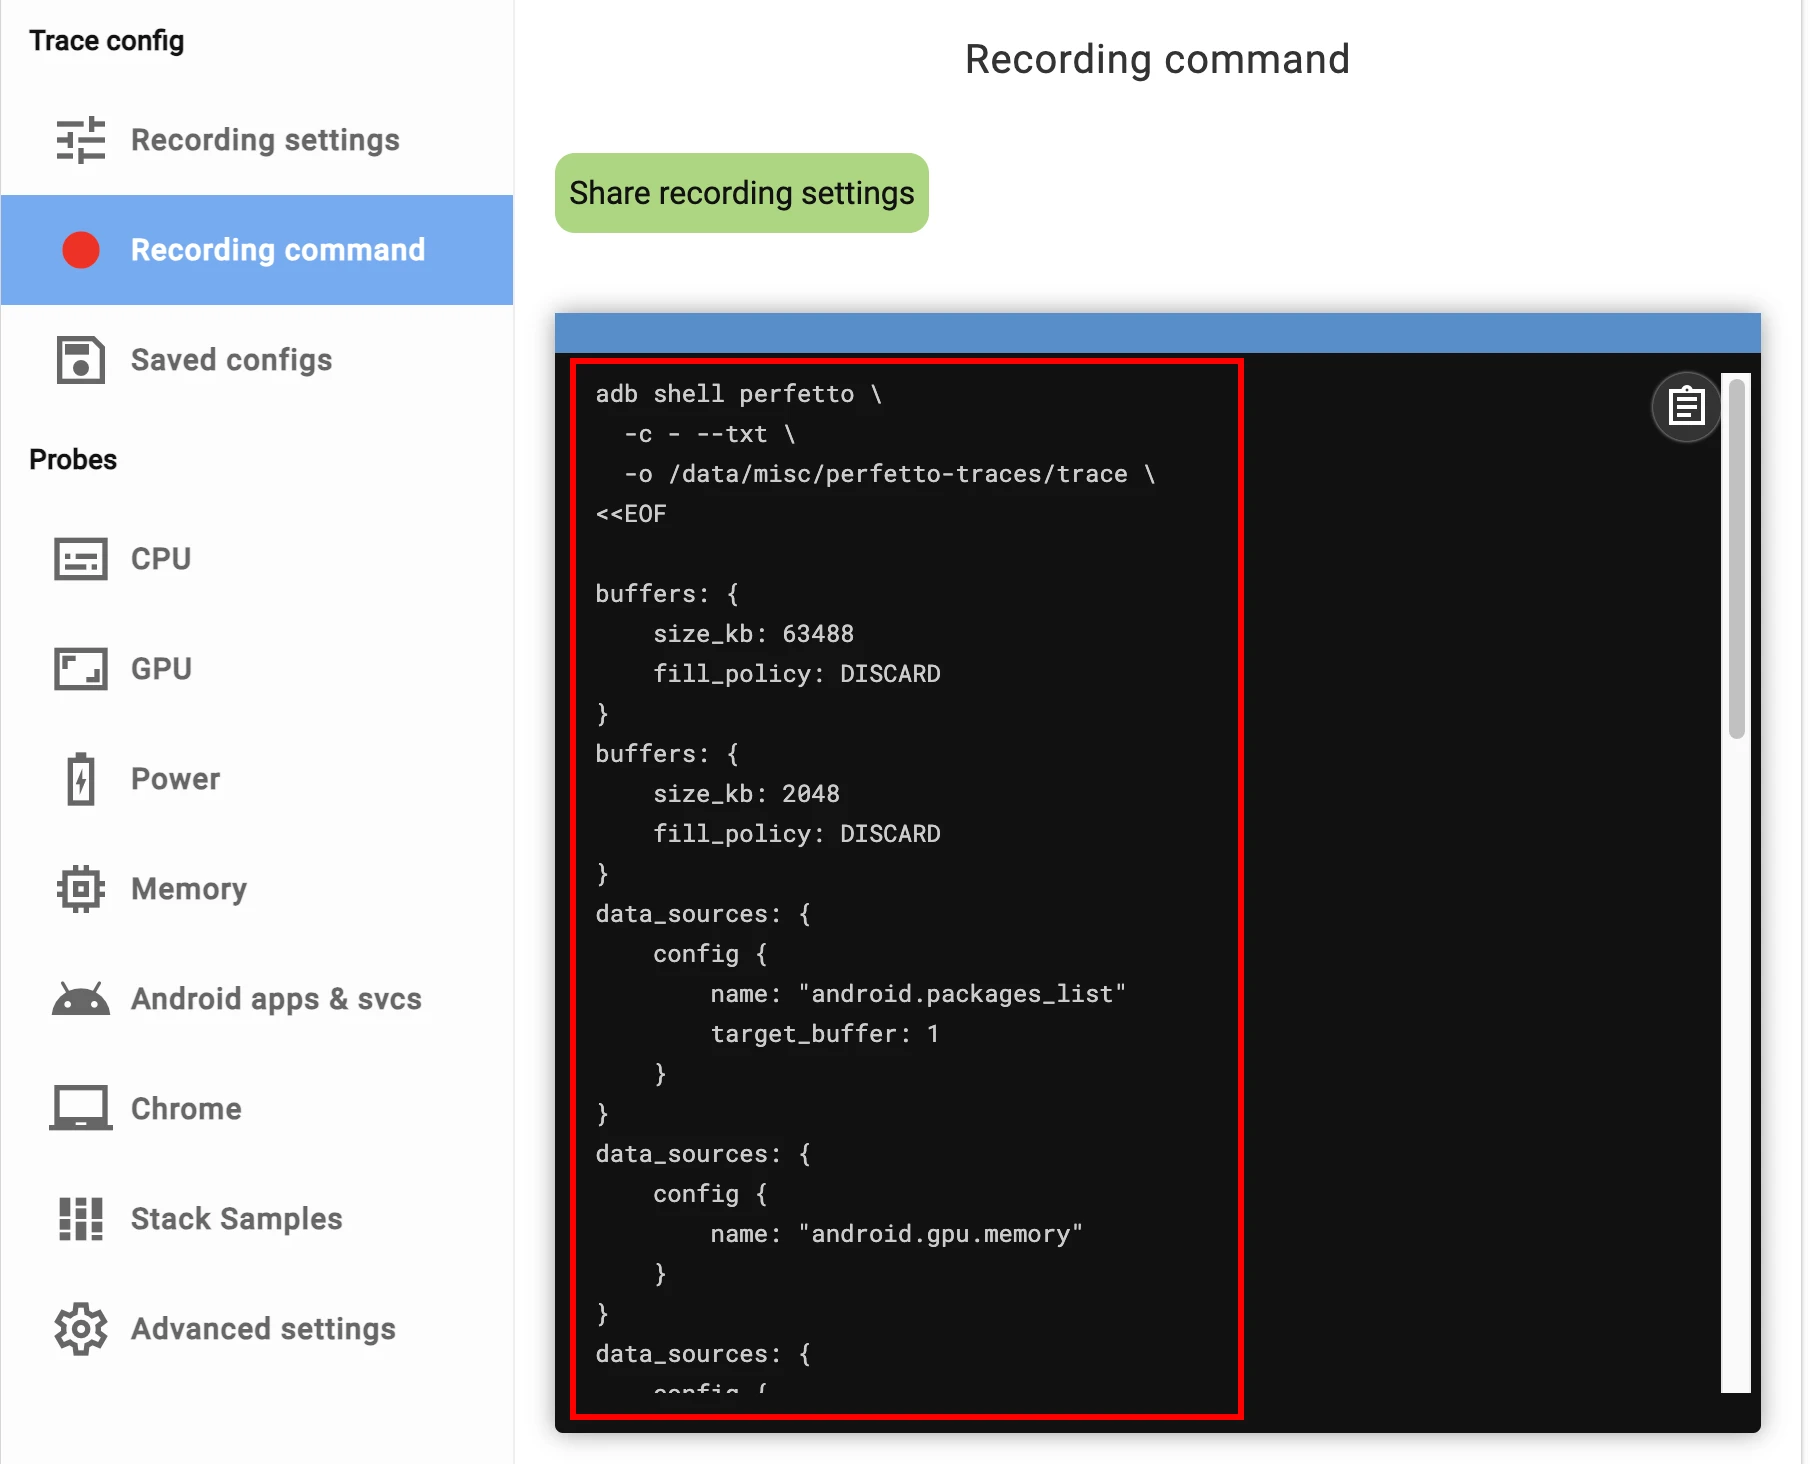
After selecting the information source you want to capture here, you can click Recording command to view it. Here you can see the specific content of the Config you selected. You can share it or save it to a local file for use when capturing with the command line.
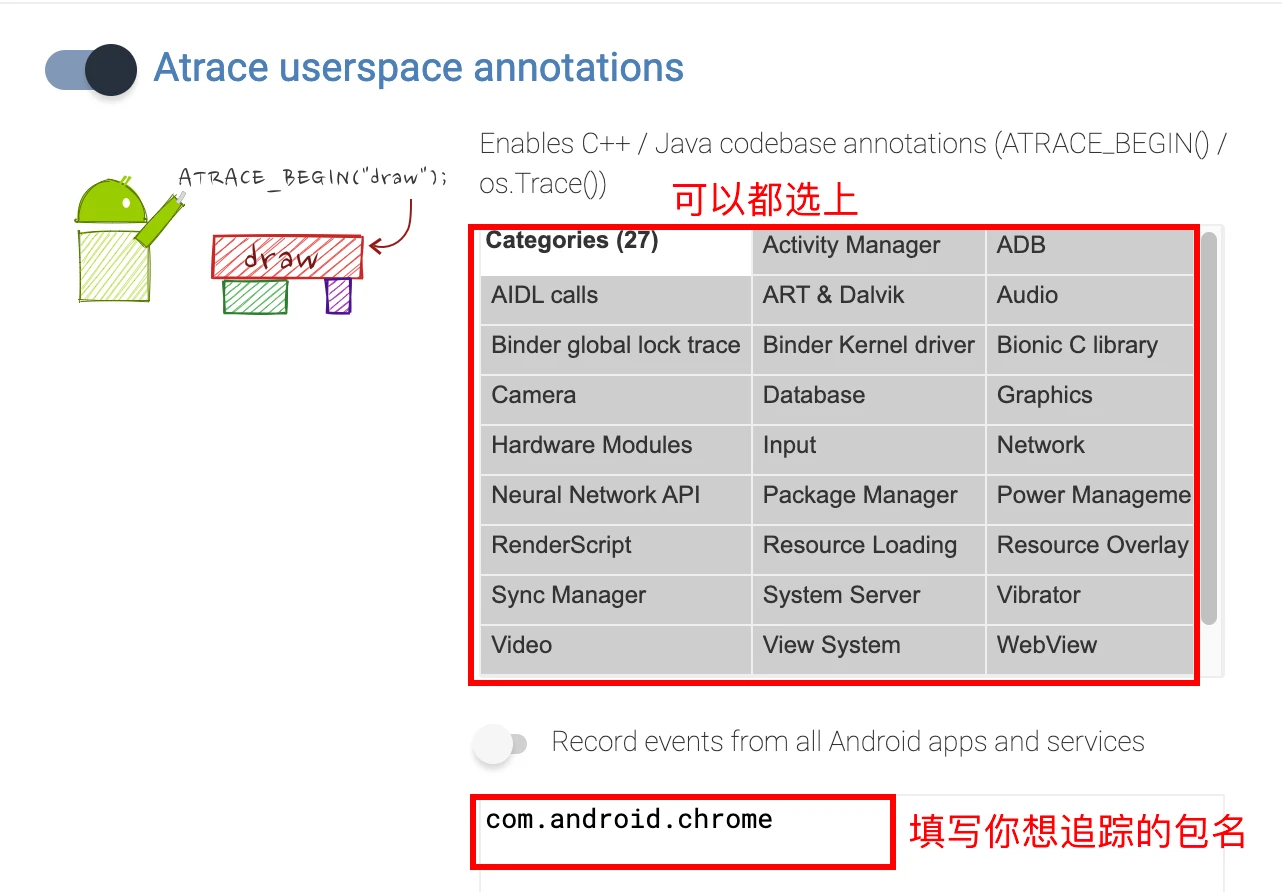
When selecting Config, it is recommended to check Atrace userspace annotations, Event log (logcat), and Frame timeline in the Android apps column (command + a)
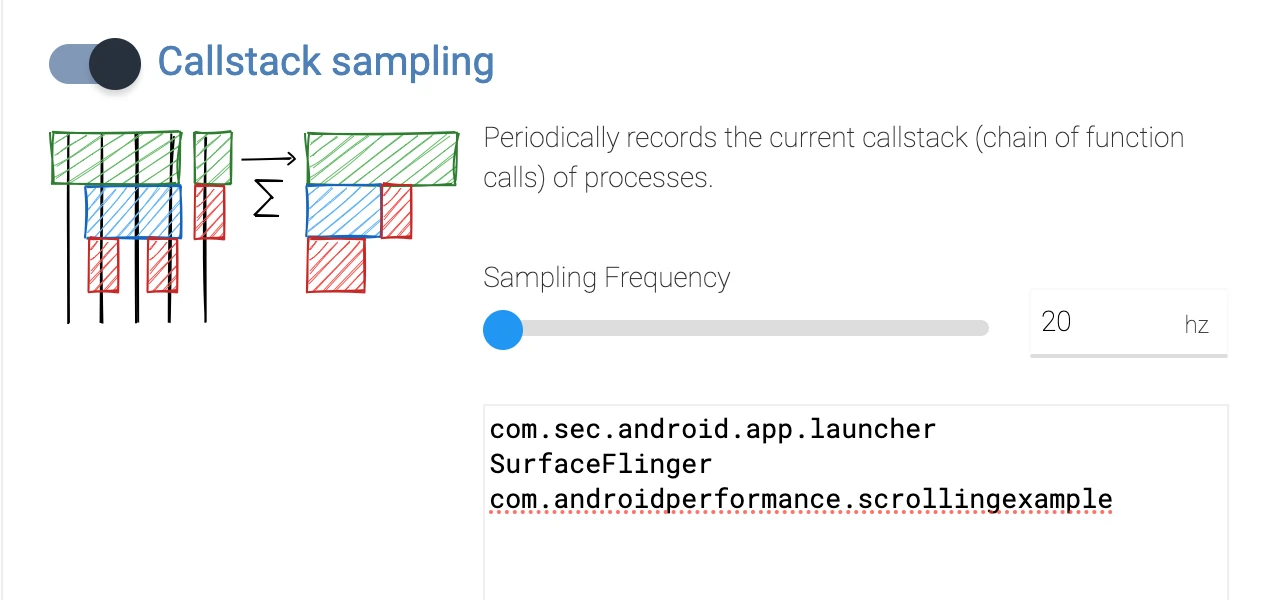
In addition, if you want to see the call stack, you can check Callstack sampling in Stack Samples (note that the latest version of Android is required, and the debugged process must be debuggable)
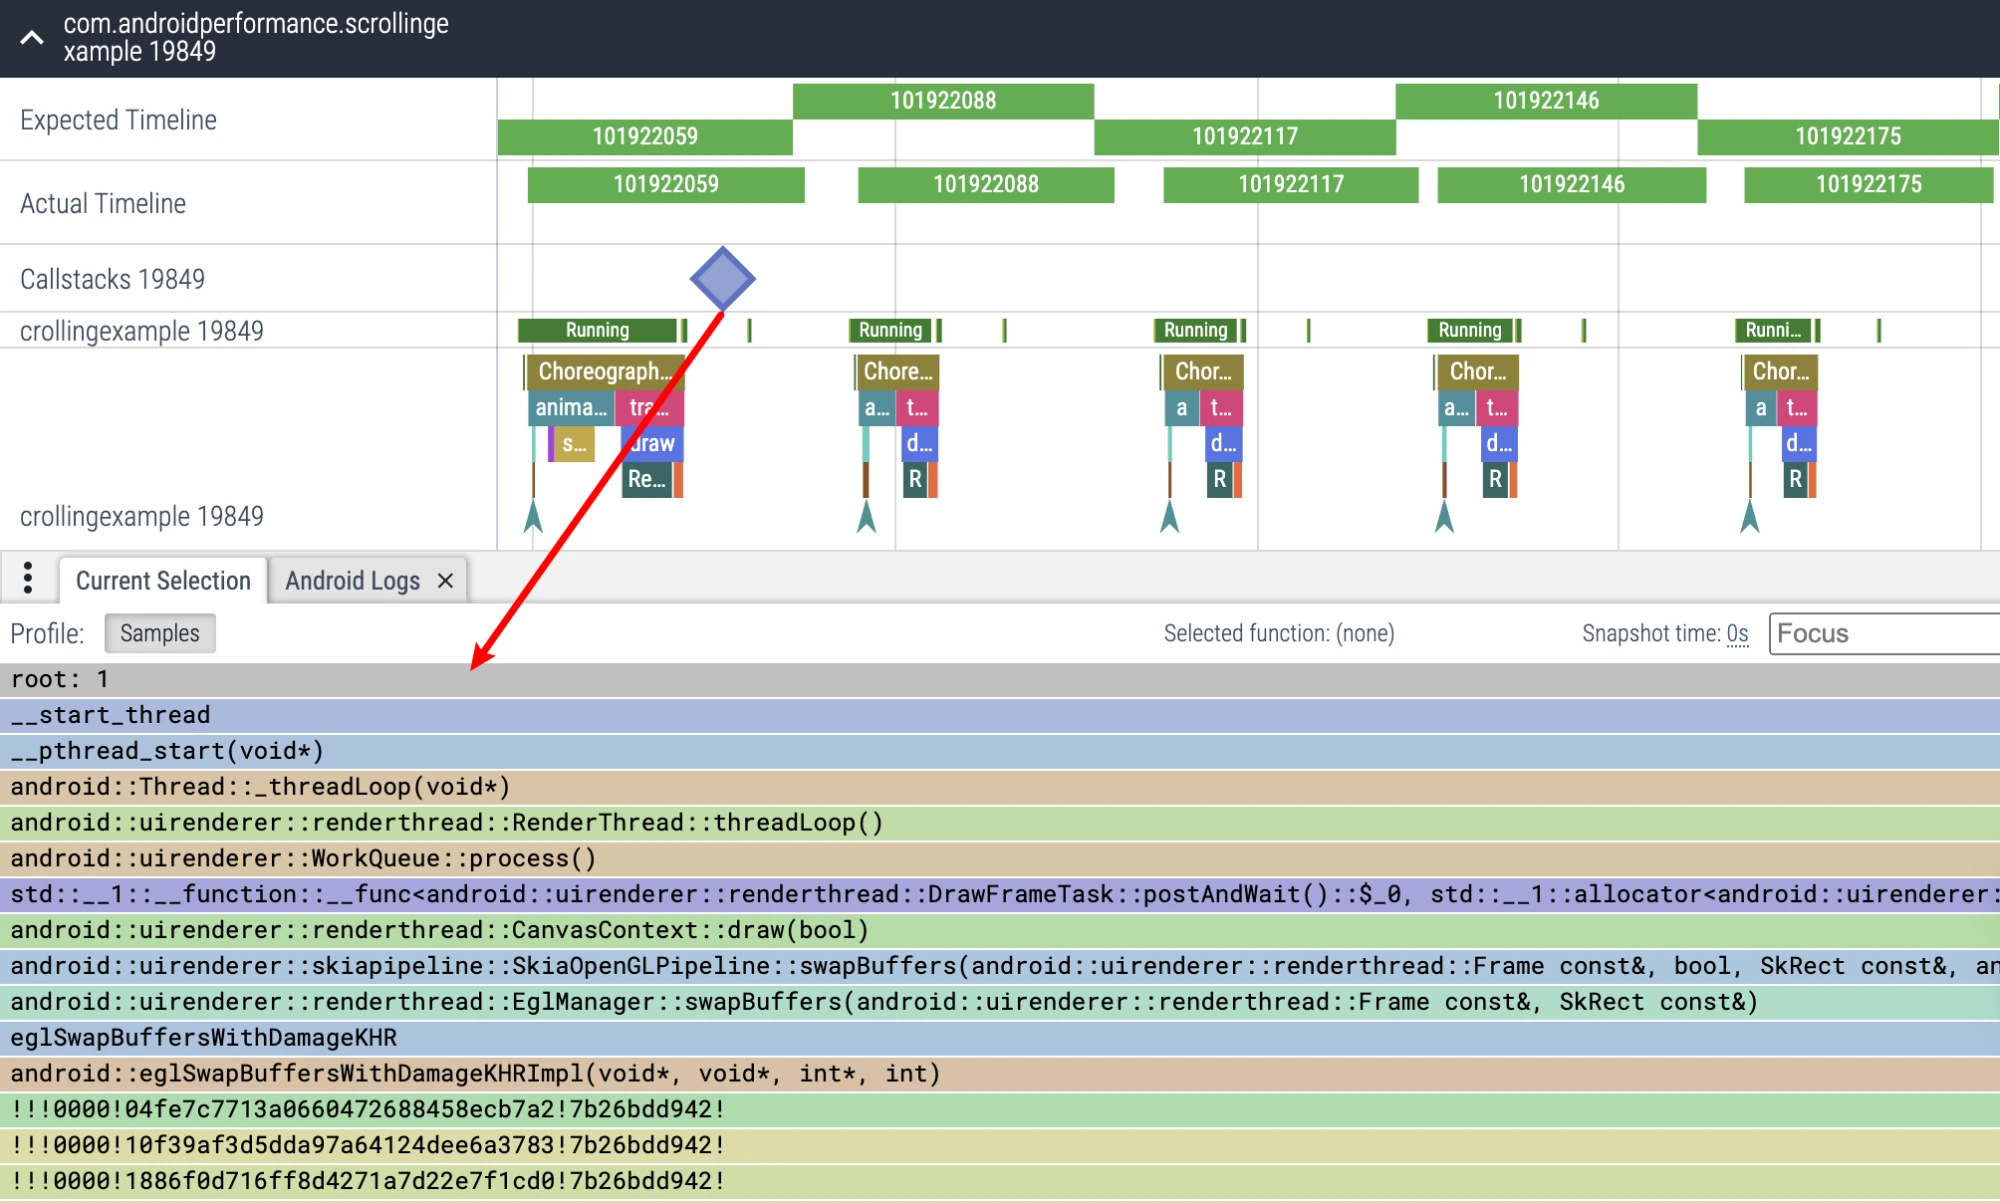
As for the use of others, you can explore it yourself. Subsequent Perfetto articles will also introduce each part and its presentation on Trace to help everyone get started with Perfetto faster.
Extracting Parameters from Web Interface
As mentioned earlier, the graphical selection of Config on the web side is very convenient. After selection, click Recording command, and you can see the selected Config. When saving, remember to remove the following lines:
Reference Documents
- https://perfetto.dev/docs/quickstart/android-tracing
- https://perfetto.dev/docs/concepts/config
- https://developer.android.com/tools/releases/platform-tools?hl=zh-cn
- https://mp.weixin.qq.com/s/nsqc51L5T4mrTUVsPgkj6A
- https://juejin.cn/post/7344983784549400613
- https://cs.android.com/android/platform/superproject/main/+/main:external/perfetto/test/configs/
About Me && Blog
Here is a personal introduction and related links. I hope to communicate more with my peers. When three people walk together, there must be one who can be my teacher!
- Blogger Personal Introduction: Contains personal WeChat and WeChat group links.
- This Blog Content Navigation: A navigation of personal blog content.
- Personal Collection of Excellent Blog Articles - Android Performance Optimization Must-Know: Welcome everyone to recommend themselves and others (WeChat private chat is fine)
- Android Performance Optimization Knowledge Planet: Welcome to join, thank you for your support~
One person can go faster, a group of people can go further