The tenth article in the Perfetto series focuses on Binder, Android’s core Inter-Process Communication (IPC) mechanism. Binder carries most interactions between system services and apps, and is often where latency and jank originate. This article uses signals from linux.ftrace (binder tracepoints + sched), thread_state, and ART Java monitor contention (via atrace dalvik) to provide a practical workflow for diagnosing transaction latency, thread-pool pressure, and lock contention.
Table of Contents
- Perfetto Series Catalog
- Binder Basics
- Perfetto Setup and Data Sources
- Binder Analysis Workflow
- Case Studies
- Platform Features and Best Practices
- Summary
- References
- Attachments
- About the Author & Blog
Perfetto Series Catalog
- Android Perfetto Series Catalog
- Android Perfetto Series 1: Introduction to Perfetto
- Android Perfetto Series 2: Capturing Perfetto Traces
- Android Perfetto Series 3: Familiarizing with the Perfetto View
- Android Perfetto Series 4: Opening Large Traces via Command Line
- Android Perfetto Series 5: Choreographer-based Rendering Flow
- Android Perfetto Series 6: Why 120Hz? Advantages and Challenges
- Android Perfetto Series 7: MainThread and RenderThread Deep Dive
- Android Perfetto Series 8: Understanding Vsync and Performance Analysis
- Android Perfetto Series 9: Interpreting CPU Information
- Android Perfetto Series 10: Binder Scheduling and Lock Contention (this article)
- Video (Bilibili) - Android Perfetto Basics and Case Studies
- Video (Bilibili) - Android Perfetto: Trace Graph Types - AOSP, WebView, Flutter + OEM System Optimization
Binder Basics
For readers encountering Binder for the first time, understanding its role and participants is crucial. You can roughly understand Binder as “cross-process function calls”: you write code in one process that looks like calling a local interface, while Binder handles the actual call and data transfer. Overall, it is Android’s primary Inter-Process Communication (IPC) mechanism, consisting of four core components:
- Client: Application threads initiate calls through
IBinder.transact(), writingParcel-serialized data to the kernel. - Service (Server): Usually runs in SystemServer or other processes, reading
Parceland executing business logic throughBinder.onTransact(). - Binder Driver: The kernel module
/dev/binderresponsible for thread pool scheduling, buffer management, priority inheritance, etc., serving as the “messenger” connecting both parties. - Thread Pool: The server typically maintains a set of Binder threads. Note that the thread pool is not created full from the start, but is created on demand. The Java layer defaults to approximately 15 Binder worker threads (excluding the main thread), and the Native layer can also configure the maximum thread count via
ProcessState(default value is usually also 15). When all Binder threads are busy, new requests will queue in the driver layer waiting for idle threads.
Why is Binder needed?
Android adopts a multi-process architecture to isolate applications, improve security, and stability. Each APK runs in an independent user space. When it needs to access system capabilities (camera, location, notifications, etc.), it must cross-process call the Framework or SystemServer.
Limitations of traditional IPC solutions:
| IPC Method | Problem |
|---|---|
| Socket | High overhead, lacks identity verification |
| Pipe | Only supports parent-child processes, one-way communication |
| Shared Memory | Needs additional synchronization mechanisms, lacks access control |
Binder solves these problems at the kernel layer, providing three key capabilities: first, identity and permission (based on UID/PID verification to ensure the caller is legitimate); second, synchronous and asynchronous calls (in synchronous mode, the Client waits for the Server to return, which is the most common mode, while in asynchronous mode, the Client returns immediately after sending, suitable for scenarios like notifications and status reporting); third, priority inheritance (when a high-priority Client calls a low-priority Server, the Server temporarily elevates its priority to avoid priority inversion problems).
Therefore, when an app process calls IActivityManager#attachApplication() during startup, Binder is the channel that safely and reliably delivers that request to system_server.
Case from App Developer’s Perspective
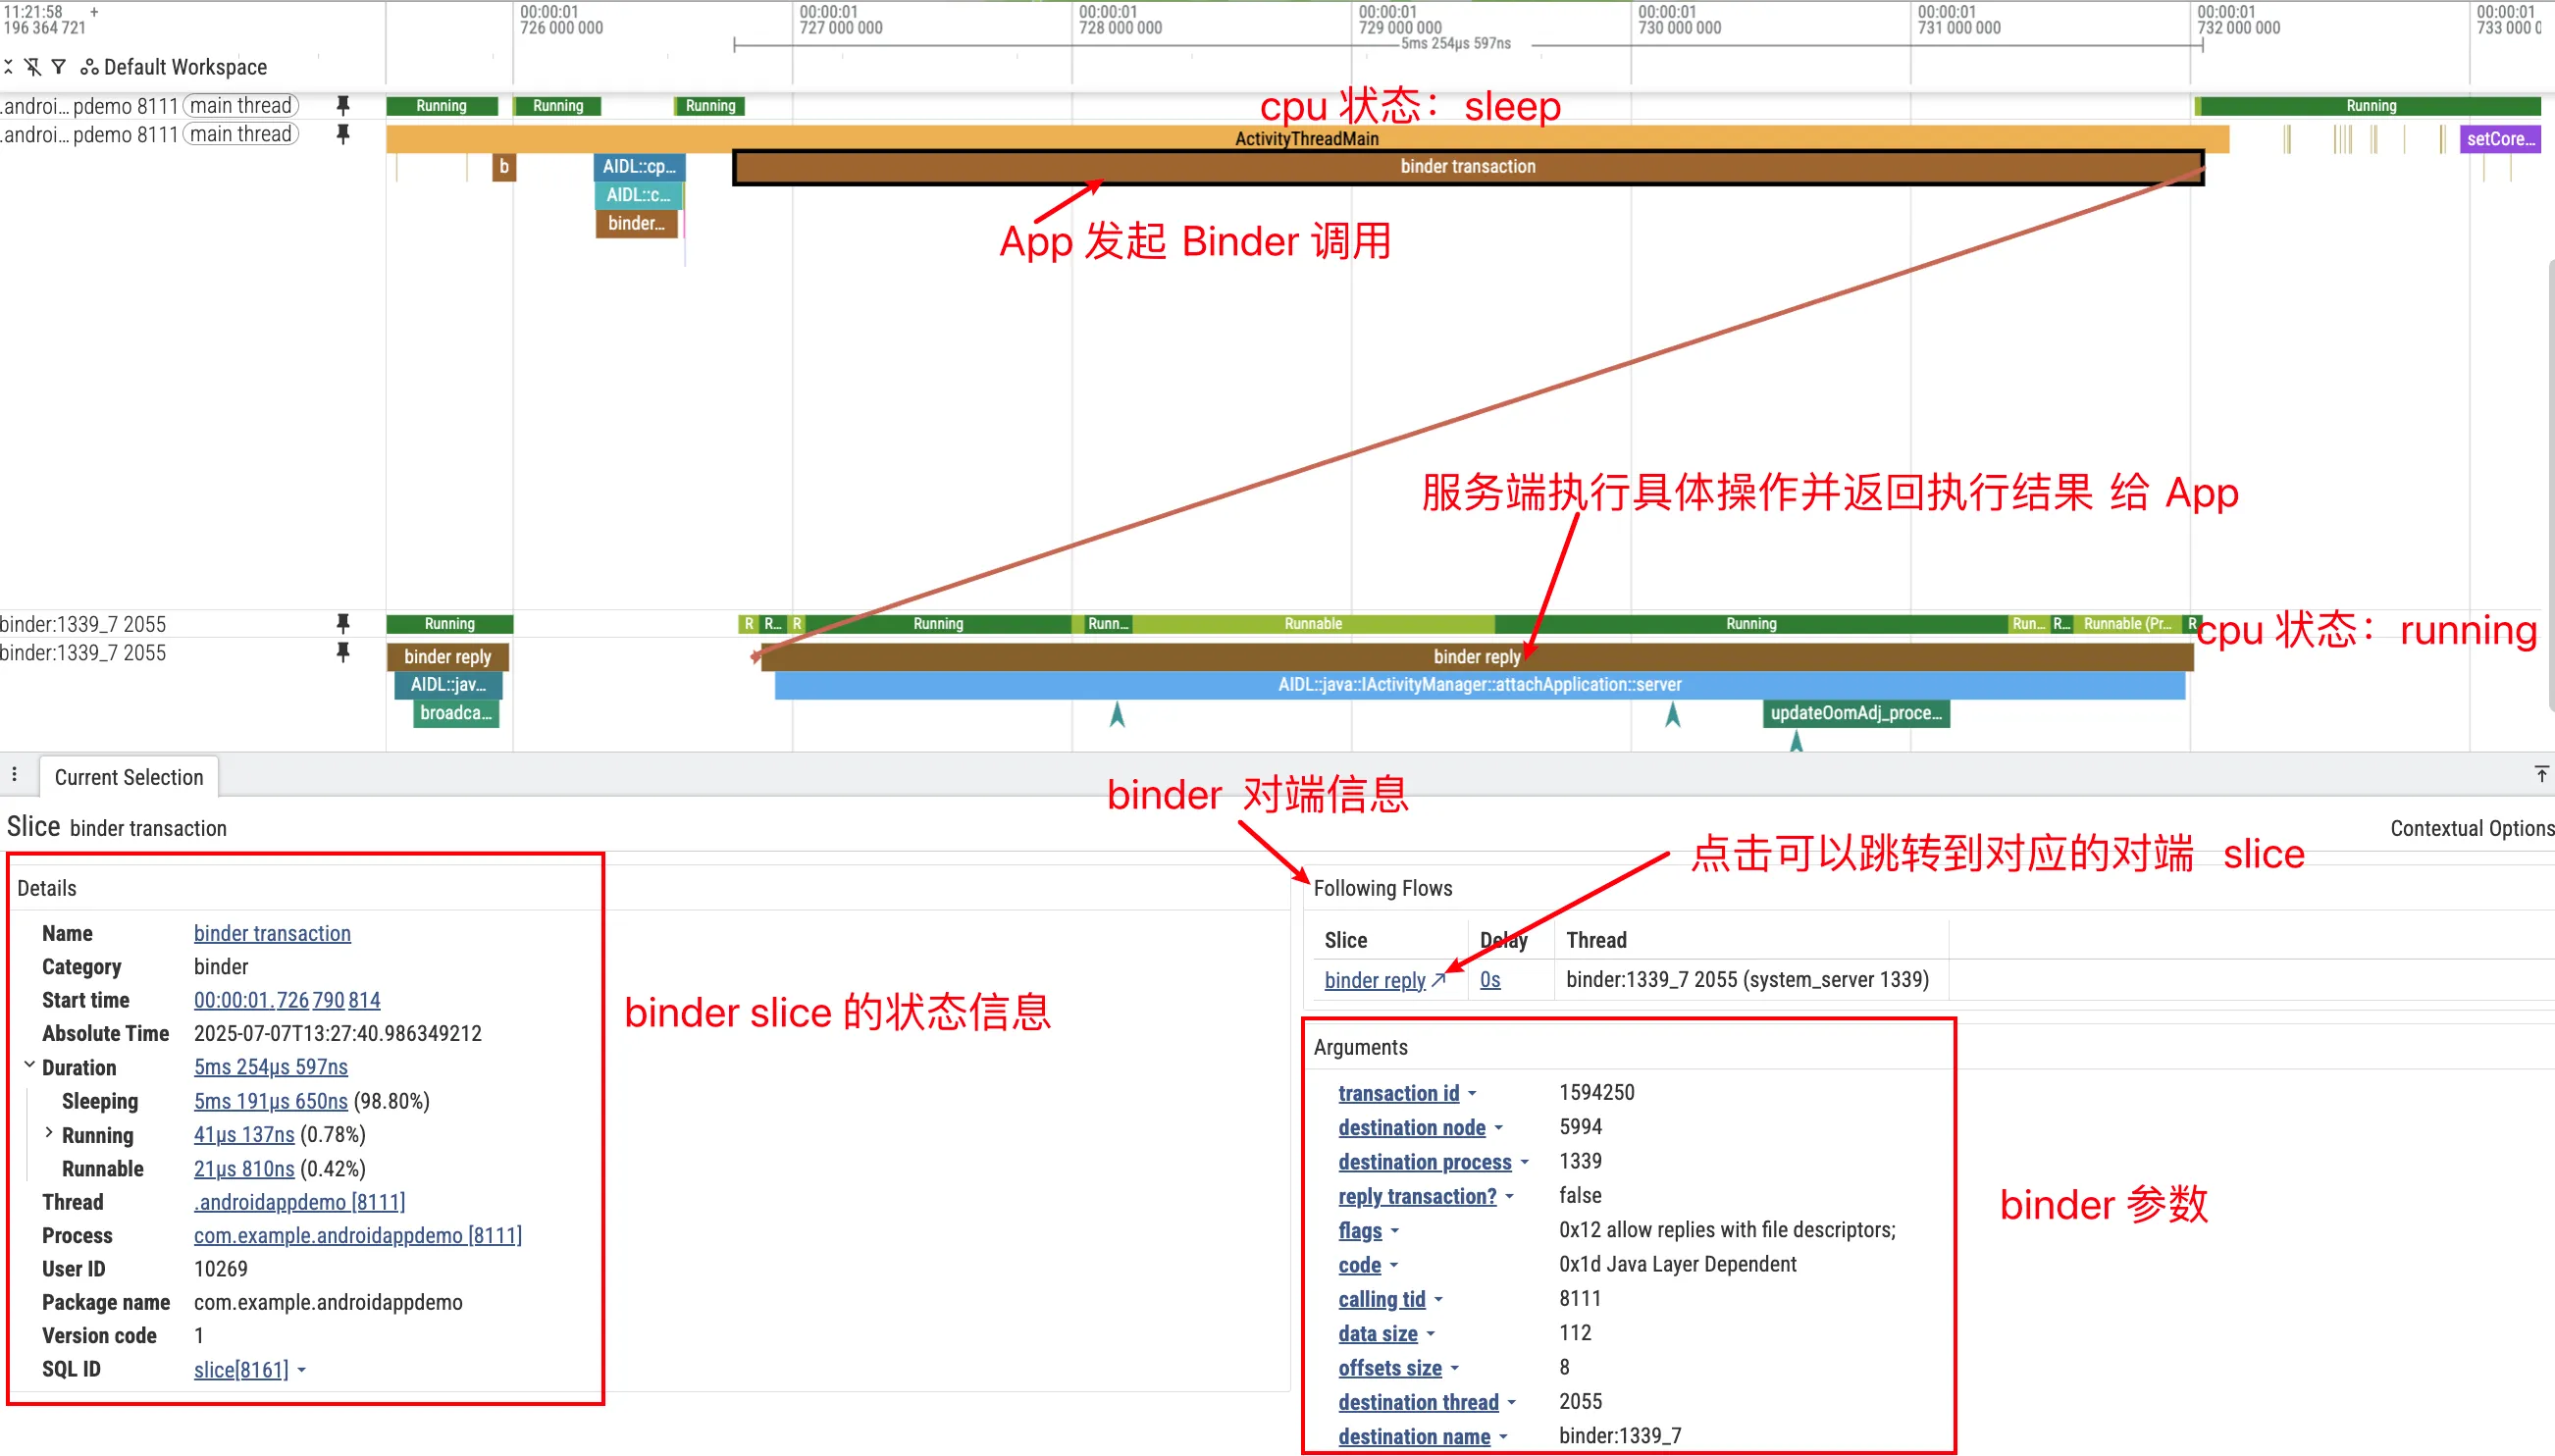
Suppose the trace contains AIDL::java::IActivityManager::attachApplication::server. This corresponds to a synchronous Binder call to IActivityManager#attachApplication(...), handled by ActivityManagerService in system_server. The path is: on the Proxy side, app code gets IActivityManager via ActivityManager.getService(); the proxy serializes arguments into a Parcel and calls transact(); the Binder driver queues the transaction and wakes an idle system_server Binder thread (for example Binder:1460_5); on the Stub side, ActivityManagerService processes attachApplication; finally, the reply is marshaled back and the app thread resumes from waitForResponse().
In Perfetto, this appears as one transaction on Android Binder / Transactions (if AIDL info is decoded, the slice name is often AIDL::java::IActivityManager::attachApplication::client/server, or SQL shows aidl_name=IActivityManager, method_name=attachApplication); the app thread stays in S (Sleeping) with blocked_function often at binder_thread_read / epoll_wait / ioctl(BINDER_WRITE_READ); a system_server Binder thread runs; and Flow arrows connect client and server work.
Perfetto Setup and Data Sources
To diagnose Binder in Perfetto, you need to prepare the data sources and Trace configuration in advance.
Data Sources and Track Overview
Binder analysis needs to connect transaction events with scheduling, blocking, and lock signals. In practice, recording is mainly based on linux.ftrace (binder tracepoints + sched + optional atrace categories), plus lightweight process/thread metadata.
linux.ftrace (kernel + atrace) is the baseline and works across Android versions. It captures kernel events like binder_transaction (transaction start), binder_transaction_received (server receives transaction), and binder_transaction_alloc_buf (buffer allocation, useful for TransactionTooLarge diagnostics). Combined with sched_switch / sched_waking, it reconstructs the full chain: client call → server wakeup → server handling → reply.
You can also enable atrace categories inside linux.ftrace: binder_driver / am / wm for framework context, and dalvik for ART monitor contention (synchronized lock waits), which powers Thread / Lock contention tracks in UI.
linux.process_stats (metadata) maps PID/TID to process/thread names for easier filtering in UI/SQL, with negligible overhead.
Note: Perfetto UI tracks such as Android Binder / Transactions, Android Binder / Oneway Calls, and SQL stdlib modules like
android.binder/android.monitor_contentionare parser-side derived views over raw trace events; they are not separate recording data sources.
Recommended Trace Config
The following configuration balances compatibility with new features and is recommended as a standard Binder analysis template. Save the configuration as binder_config.pbtx for use:
1 | # ============================================================ |
Configuration Item Description
| Data Source | Purpose | Android Version Requirement | Overhead |
|---|---|---|---|
linux.ftrace (binder/*) |
Kernel-layer Binder events | All versions | Low |
linux.ftrace (sched/*) |
Scheduling events, connecting thread wakeups | All versions | Medium |
linux.ftrace (atrace: dalvik/…) |
Framework slices + Java Monitor Contention | All versions (fields evolve by release) | Low-Medium |
linux.process_stats |
Process name and PID mapping | All versions | Very low |
Tip: This workflow only depends on
linux.ftrace(binder tracepoints + sched + dalvik), so the approach is largely consistent on Android 12/13/14+. UI field names can vary by version; use SQL stdlib for normalization when needed.
Quick Start: 3 Steps to Capture and View Binder Trace
Capture Trace:
1
2
3
4
5
6
7
8
9
10
11
# Push configuration
adb push binder_config.pbtx /data/local/tmp/
# Start capture
adb shell perfetto --txt -c /data/local/tmp/binder_config.pbtx \
-o /data/misc/perfetto-traces/trace.pftrace
# ... operate phone to reproduce lag ...
# Pull file out
adb pull /data/misc/perfetto-traces/trace.pftrace .Open Trace: Visit ui.perfetto.dev, drag in the trace file.
Add Key Tracks:
- Left side click Tracks → Add new track
- Search “Binder”, add Android Binder / Transactions and Android Binder / Oneway Calls
- Search “Lock”, add Thread / Lock contention (if data available)
Other Binder Analysis Tools
Besides Perfetto, two tools are often useful: am trace-ipc (built in) and binder-trace (open source, stronger content inspection but higher setup cost).
am trace-ipc: Java Layer Binder Call Tracking
am trace-ipc tracks Java-layer Binder call stacks. It enables Binder stack tracking in target processes (BinderProxy.transact() path) and exports aggregated stacks on stop. It is zero-config and does not require root.
Basic usage is very simple, just three steps: “start → operate → stop and export”:
1 | # 1. Start tracking (records Binder calls for eligible processes, usually debuggable ones) |
The output is plain text, for example:
1 | Traces for process: com.example.app |
It groups stacks by process and counts occurrences, which quickly answers: “which services were called, and how often”.
Using with Perfetto: Perfetto provides timing, scheduling, and flow context; trace-ipc tells you exactly which Java call sites initiated Binder traffic.
Best for: validating frequent IPC as ANR/jank cause, and pinpointing Java-origin call sites.
binder-trace: Real-time Binder Message Parsing
binder-trace can intercept and parse Binder messages in real time, often described as “Wireshark for Binder”.
It relies on Frida dynamic instrumentation, so you typically need root (or emulator), frida-server on device, and Python 3.9+ locally. Example:
1 | # Track Binder communication for a specific app (-d specifies device, -n specifies process name, -a specifies Android version) |
It supports filtering by interface/method/transaction type and is best for security and reverse-engineering workflows where payload semantics matter. For routine performance triage, Perfetto + am trace-ipc is usually enough.
Binder Analysis Workflow
After getting the Trace, don’t just fish in the ocean. It’s recommended to proceed in the order of “find target → look at latency → check threads → find locks”.
Step 1: Identify Transaction Latency
The first step is finding the transaction you care about. In Perfetto, common entry points are: find your app as Client on the Transactions track; search with / by interface/method (for example IActivityManager / attachApplication) or full slice name (for example AIDL::java::IActivityManager::attachApplication::server); or start from long S segments on UI-thread thread_state when diagnosing jank.
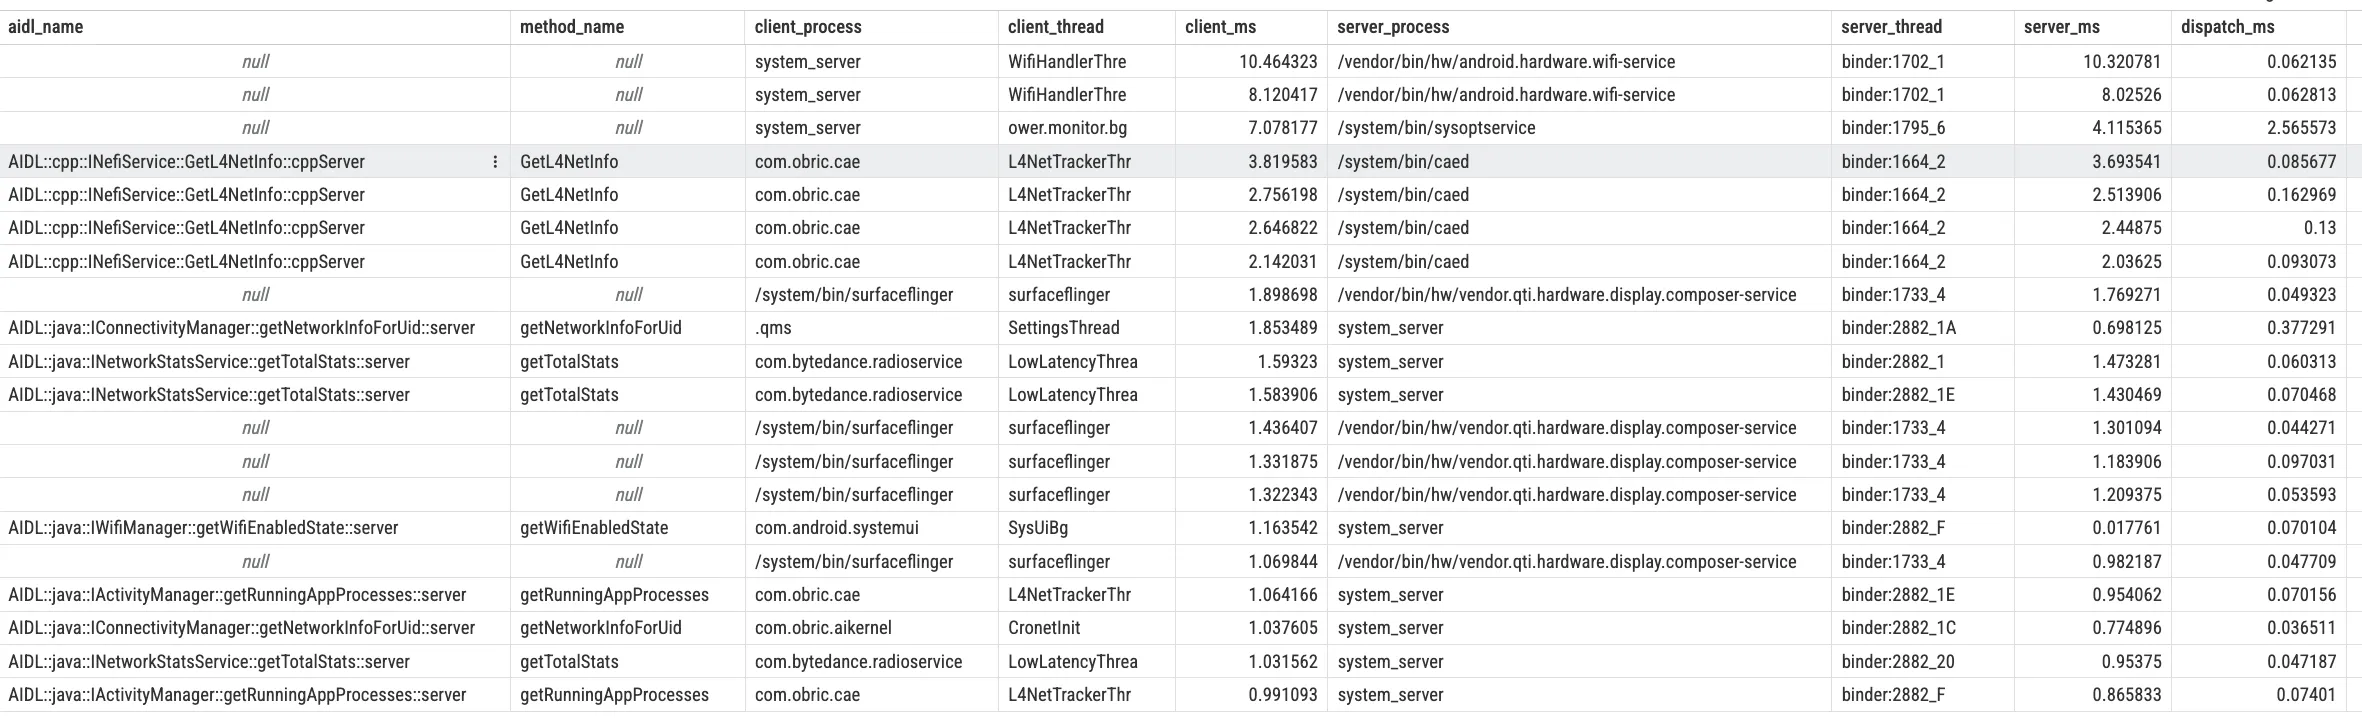
After selecting a Transaction slice, the Details panel shows client/server threads, timestamps, and durations. UI fields vary by version, so use SQL android_binder_txns as the stable baseline:
client_dur: end-to-end client duration (for sync calls, roughly “time waiting for Binder return”)server_dur: server wall-clock duration from handling start to replydispatch_dur = server_ts - client_ts: delay before server actually starts handling (often queueing/scheduling pressure)
Run this in Perfetto SQL to list slow synchronous transactions:
1 | INCLUDE PERFETTO MODULE android.binder; |
These relationships determine next steps: if client_dur is long but server_dur is short, the bottleneck is likely dispatch/queueing; if server_dur itself is long, inspect what the server Binder thread is doing (business logic, lock wait, or I/O).
Step 2: Evaluate Thread Pool and Oneway Queue
If Step 1 analysis finds that latency is mainly not in server-side processing, but in “queuing”, then you need to further check the status of the Binder thread pool. Before deep analysis, first answer a frequently asked question: “approximately how many Binder threads does each process have? What’s the scale of system_server’s Binder thread pool? Under what circumstances will it be ‘exhausted’?”
SystemServer’s Binder Thread Pool Scale
In upstream AOSP (Android 14/15), the Binder thread pool design philosophy is: grow on demand, configurable, no single fixed number.
- Thread pool grows on demand: Each server process maintains a thread pool in the Binder driver, where the actual number of threads increases or decreases according to load on demand, with the upper limit jointly determined by the
max_threadsfield in the kernel and user-space configurations likeProcessState#setThreadPoolMaxThreadCount(). - Typical upper limit depends on process role: app processes are usually around 15 Binder workers (libbinder default), while
system_serverraises the cap explicitly at boot; current AOSP sets it to 31.
Some vendor ROMs or custom kernels will adjust the upper limit up or down based on their own load models (for example, adjusting to dozens of threads), so when you see specific numbers throughps -T system_server,top -H, or countingBinder:threads in Perfetto on different devices, there may be differences. - Take actual observation as standard, not memorizing a number: In Perfetto, a more recommended approach is to directly expand a process and see how many
Binder:xxx_ythread tracks there are, and their activity level during the Trace capture, to evaluate the thread pool’s “scale” and “busyness”.
Binder Thread Count, Buffer, and “Binder Exhaustion”
In performance analysis, when people mention “Binder count”, they often confuse three different types of resource limits:
Binder thread-pool exhaustion means all Binder workers in a process are busy (Running / D / S), with no idle thread available for new transactions. You’ll often see client threads stuck in S at ioctl(BINDER_WRITE_READ) / epoll_wait, and many transactions with large dispatch_dur (server_ts - client_ts) in SQL. In system_server, this can quickly amplify into global jank or ANR.
Binder transaction buffer exhaustion involves a shared buffer of limited size (typical value about 1MB magnitude) that each process has in the Binder driver, used to carry Parcel data being transmitted. Typical scenarios include one transaction transmitting an object that’s too large (like a large Bitmap, extra long string, large array, etc.), and a large number of concurrent transactions not yet consumed, causing too many unreleased Parcels to pile up in the buffer. Possible results include kernel logs showing binder_transaction_alloc_buf failures, Java layer throwing TransactionTooLargeException, and subsequent transactions queuing for a long time or even failing in the driver layer (looks like “Binder is used up”). The solution to such problems is not to “open more threads”, but to control the data amount per transmission (split packets, paging, streaming protocols), and prioritize using SharedMemory / files / ParcelFileDescriptor and other mechanisms for large block data.
Binder reference table / object count: The Binder driver maintains reference tables and node objects for each process, and these also have upper limits, but in most actual scenarios, they rarely hit this first. Common risk is holding a large number of Binder references for a long time without releasing, more manifesting as memory/stability issues, not UI lag.
When analyzing in Perfetto, you can carry a judgment framework:
“Is the current slowness because the thread pool is full, or because transactions are too large/buffer is used up?”
The former mainly looks at Binder thread count and thread_state, plus dispatch_dur; the latter focuses on transaction size, concurrency, and TransactionTooLargeException / binder_transaction_alloc_buf signs.
Now return to the analysis scenario:
Thread-pool pressure directly limits service-side concurrency. For sync transactions, if server Binder threads stay busy (Running / D) for long periods, new requests queue and clients block at ioctl(BINDER_WRITE_READ) / epoll_wait; on UI, this is often visible as long S segments.
In Perfetto, prioritize two signals: whether Binder threads are persistently saturated, and whether dispatch_dur is consistently larger than server_dur (same criterion as Step 1).
Identifying Oneway calls in Perfetto: sync calls block client threads (thread_state shows S) and typically show transaction → reply flow; oneway calls return immediately, have one-way flow only, and can be filtered with android_binder_txns.is_sync = 0 in SQL.
When analyzing Oneway-related issues, focus on two things: first, the server-side queue depth (if Oneway requests on the same IBinder object pile up, the actual execution timing of subsequent requests will be continuously delayed); second, whether there’s a batch sending pattern (a large number of Oneway calls in a short time will form “spikes”, appearing as densely arranged short Slices on server-side Binder threads in Perfetto).
It’s worth mentioning that SystemServer’s Binder threads not only need to handle requests from various Apps, but also handle system internal calls (like AMS calling WMS, WMS calling SurfaceFlinger, etc.). If a “misbehaving” App frantically sends Oneway requests in a short time, it might fill up a certain system service’s Oneway queue, further affecting other Apps’ asynchronous callback latency, causing a global lag feeling.
Step 3: Investigate Lock Contention
If you jump to the server-side Binder thread and find it stays in S (Sleeping) or D (Disk Sleep / Uninterruptible Sleep) state for a long time while processing your request, it usually means it’s waiting for some resource – either waiting for a lock or waiting for IO. Lock contention is a very common source of performance bottlenecks in SystemServer, because SystemServer runs a large number of services that share a lot of global state, and this state is often protected by synchronized locks.
Java locks (Monitor Contention) is the most common situation. There are quite a few global locks in SystemServer, like WindowManagerService’s mGlobalLock, some internal locks of ActivityManagerService, etc. When multiple threads simultaneously need to access resources protected by these locks, contention occurs. In Perfetto, if you see a Binder thread state as S, and the blocked_function field contains symbols related to futex (like futex_wait), you can basically be sure it’s waiting for a Java lock. To further confirm which lock it’s waiting for and who’s holding it, you can check the Lock contention track. Perfetto will visualize the lock contention relationship: marking the Owner (thread holding the lock, like the android.display thread) and Waiter (thread waiting for the lock, like the Binder:123_1 processing your request) with connection lines. Clicking the Contention Slice, you can also see the lock object’s class name (like com.android.server.wm.WindowManagerGlobalLock) in the Details panel, which is very helpful for understanding the root cause of the problem.
Native locks (Mutex / RwLock) situations are relatively rarer, but can be encountered in some scenarios. Manifestations are similar: thread state is D or S, but the call stack shows symbols from the Native layer like __mutex_lock, pthread_mutex_lock, rwsem, not Java’s futex_wait. Analyzing such problems usually needs to combine sched_blocked_reason events to see what the thread is specifically waiting for, belonging to relatively advanced content, so we won’t expand on it here.
SQL for Java Monitor Contention in system_server (Optional)
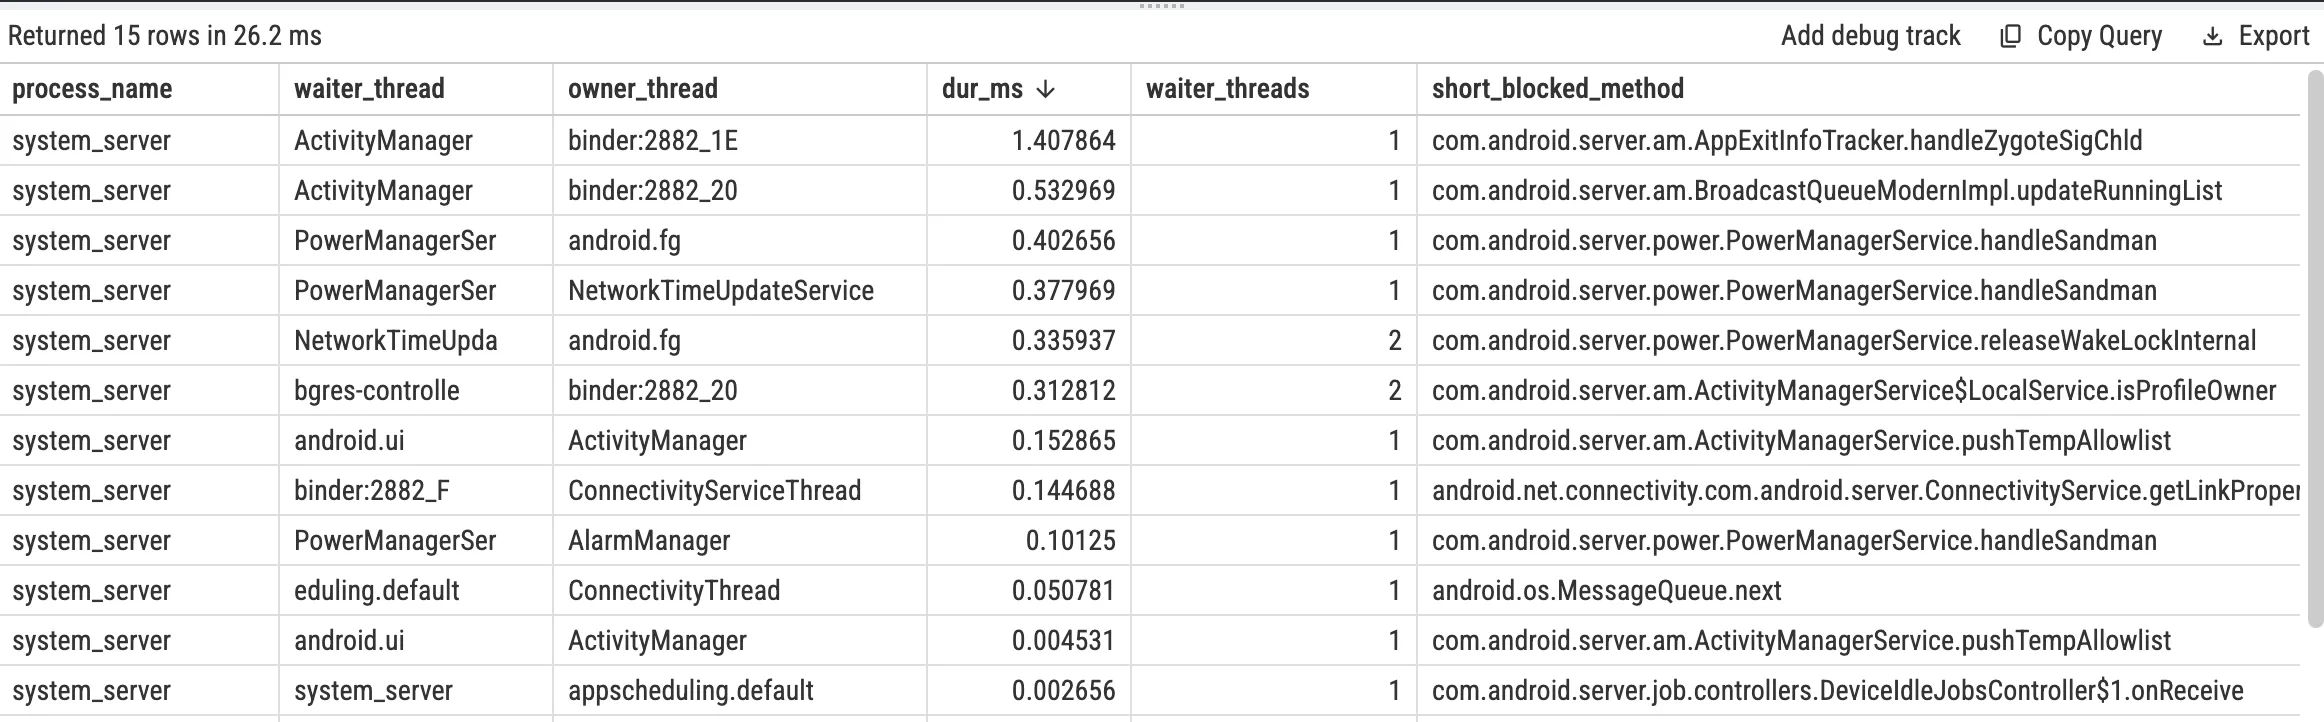
Perfetto stdlib provides parsed android_monitor_contention; use it directly instead of manually parsing slice names:
1 | INCLUDE PERFETTO MODULE android.monitor_contention; |
Tip: if this returns nothing, make sure
atrace_categoriesincludesdalvikand contention actually occurred during capture.
Case Study: Window Management Delay
A real case to demonstrate the workflow: startup animation stutter.
1. Discover Anomaly
On the app UI Thread, one doFrame takes 30ms (vs. 16.6ms budget at 60Hz). The corresponding thread_state shows the main thread in S for 18ms, meaning it is mostly waiting.
2. Track Binder Call
The 18ms S segment shows a call to IActivityTaskManager.startActivity. Flow points to system_server thread Binder:1605_2, which handles the request.
3. Server-side Analysis
On Binder:1605_2, execution lasts about 15ms and Lock contention shows a clear wait segment.
4. Pin Down the Culprit
Details show the thread waits on com.android.server.wm.WindowManagerGlobalLock, owned by android.anim, for about 12ms.
Conclusion: startActivity is blocked by WindowManagerGlobalLock on the server side, which expands into a user-visible jank frame.
Optimization direction: hard to fully fix from app side, but you can reduce startup IPC and avoid complex window operations during animation-heavy windows.
Case Study: Binder Thread Pool Saturation
Another case: multiple apps start simultaneously and the whole system feels sluggish.
1. Discover Anomaly
Multiple app main threads stay in S during the same interval and are all waiting for Binder returns, matching user-reported global responsiveness drops.
2. Check SystemServer’s Thread Pool Status
In system_server, almost all Binder: threads remain busy with little idle gap, indicating thread-pool saturation.
3. Analyze Queuing
Reuse the Step-1 criterion: if many transactions show dispatch_dur much larger than server_dur, latency is mainly queueing, not per-call server work.
4. Locate Root Cause
Transaction breakdown shows one background app issuing hundreds of IPackageManager queries in a short burst. Each call is short (~5ms), but the volume is enough to saturate the pool.
Conclusion: bursty batch Binder calls can crowd out system_server capacity and amplify into system-wide lag.
Optimization direction: avoid looped IPC; prefer batch APIs (for example getPackagesForUid) plus throttling/batching. System-side options include service rate-limits and hotspot optimization.
Platform Features and Best Practices
As Android evolves, Binder keeps improving in performance and stability. These features help explain Perfetto behavior and guide practical tuning.
Binder Freeze (Android 12+): a frozen cached process gets almost no CPU. Synchronous (non-oneway) Binder calls to it are rejected and may lead to target-process kill; asynchronous (oneway) transactions are typically buffered until thaw.
Frozen-callee callback policy (common on Android 14+): use RemoteCallbackList frozen-callee policies (DROP, ENQUEUE_MOST_RECENT, ENQUEUE_ALL) to control callback buildup while the target process is frozen.
Binder Heavy Hitter Watcher: identifies Binder hotspots with unusually high short-window call share. Enablement, thresholds, and outputs depend on build/version/device configuration.
Some suggestions for developers:
About Oneway: use it only when no return value or completion timing is required (for example logging, fire-and-forget signals). Replacing sync calls with oneway just to “unblock UI” often shifts backlog to server queues and introduces ordering issues.
About large payloads: avoid sending large objects (especially Bitmaps) over Binder. Per-process Binder buffer is ~1MB and can trigger TransactionTooLargeException; use SharedMemory, files, or ParcelFileDescriptor instead.
About main-thread Binder calls: avoid calling services with unpredictable latency on UI thread; if unavoidable, offload to background threads and post results back.
Summary
Perfetto is one of the most effective tools for Binder diagnostics. The practical method is: capture binder/sched/dalvik signals with linux.ftrace, follow Flow links from client to server, and use client_dur / server_dur / dispatch_dur + thread states + lock contention to separate “queueing slow”, “server processing slow”, and “lock wait”.
For unexplained jank/ANR, use the sequence: “is UI waiting on Binder?” → “is server queued, slow, or lock-blocked?”. Combined with CPU/scheduling/rendering signals, this usually leads to root cause quickly.
References
- Understanding Android Binder Mechanism 1/3: Driver Part
- PerfettoSQL stdlib - android.binder
- Perfetto Documentation - Ftrace
- Android Source - Binder
- Android Developers - Parcel and Bundle
- binder-trace - Wireshark for Binder
- am trace-ipc Source Analysis
Attachments
- Download Perfetto Trace (SystemServer Binder Case)
(Trace data contains sensitive information, please keep it confidential after downloading.)
About the Author & Blog
“If you want to go fast, go alone. If you want to go far, go together.”