

From Trace to Insight: Harness Engineering in SmartPerfetto AI Agent
This article documents the key technical decisions made while building SmartPerfetto from scratch – why certain approaches were chosen over others, where pitfalls were encountered, and how the design was adjusted afterward.
Why Build This Tool
I have spent years working on Android performance optimization. A significant portion of my daily work involves analyzing Perfetto traces – Perfetto is Google’s open-source system-level tracing tool that captures frame rendering, thread scheduling, CPU frequency, Binder IPC, and other data, making it essentially the standard tool for Android performance analysis. Its trace_processor engine loads traces into an embedded SQLite database, enabling SQL-based queries.
The trace analysis process is highly repetitive: locate the problem interval, inspect frame data, examine thread states, trace the blocking chain, and correlate system metrics. The steps are similar each time, but the details differ for every trace. This pattern of “fixed workflow, varying details” is well-suited for an AI Agent – automate the data collection and initial attribution within the fixed workflow, while humans make the final judgments and confirmations.
SmartPerfetto is the product of this experiment. It adds an AI analysis panel on top of the Perfetto UI, where users ask questions in natural language (e.g., “analyze scrolling performance”), and a Claude Agent uses MCP (Model Context Protocol, Anthropic’s tool-calling protocol) behind the scenes to execute SQL queries via trace_processor, autonomously completing multiple rounds of data collection and analysis.
The purpose of this article is to document the engineering decisions and lessons learned during the construction process. From the initial “just call the API directly” approach to the current system with up to 20 MCP tools (9 always-on + 11 conditionally injected) + 164 YAML Skills + a three-layer verification system, every design choice was driven by concrete counterexamples – approaches that were tried and failed before being replaced. These hard-won lessons can be directly applied by engineers building AI Agent applications or Android performance tools.
Opening: Two Analysis Paths for the Same Trace
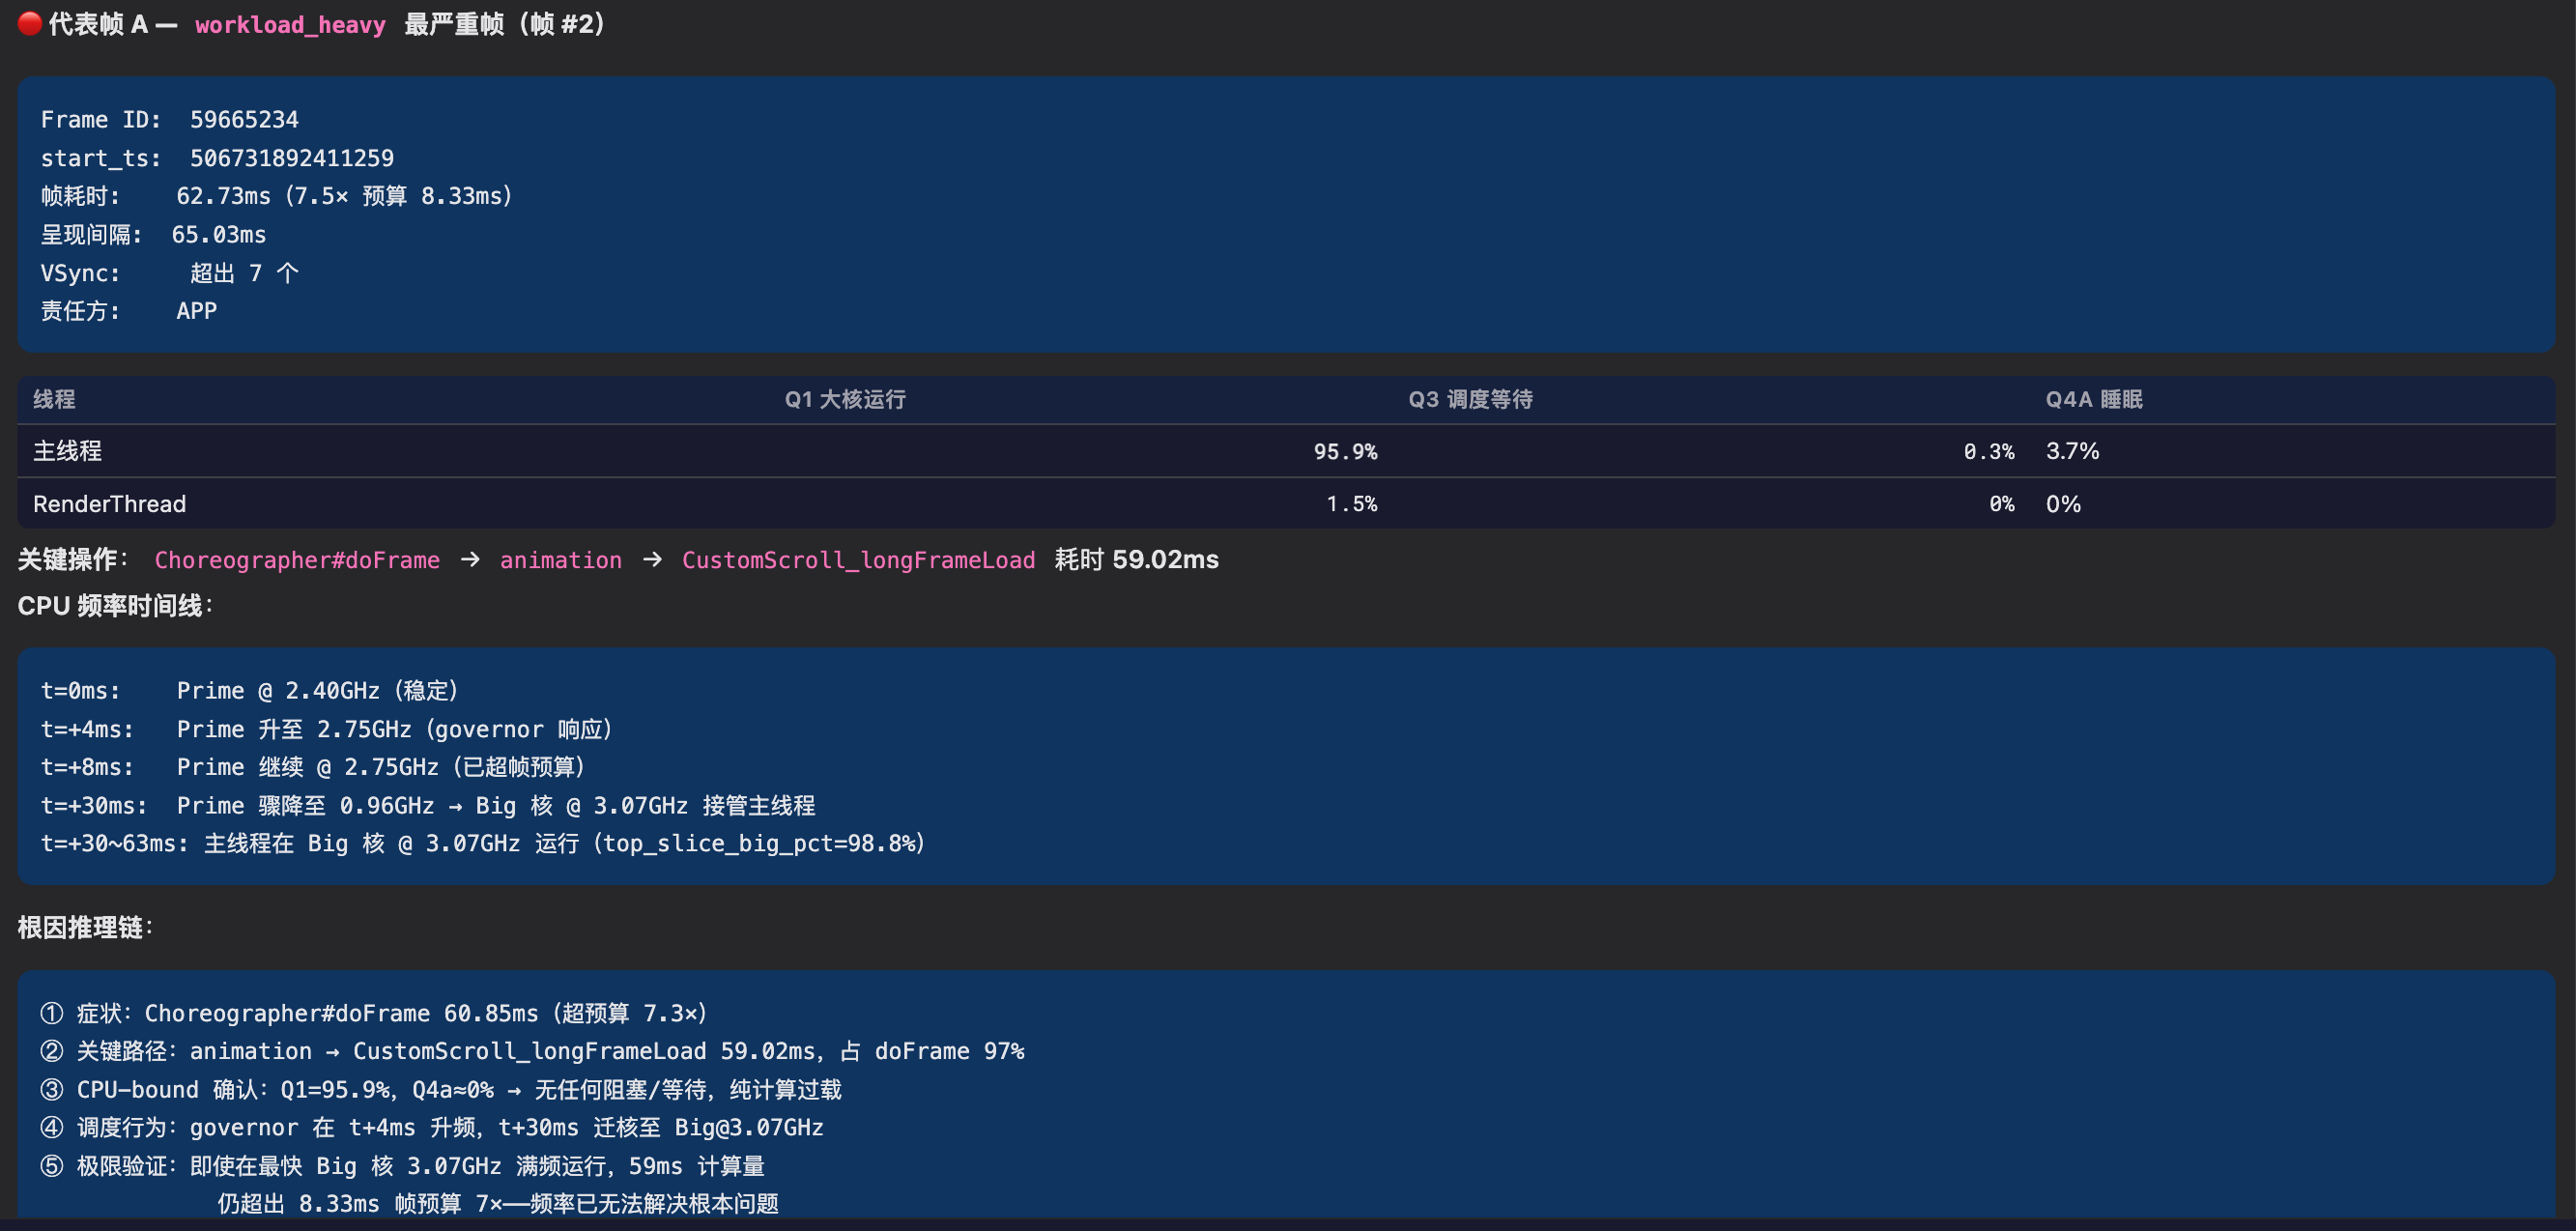
A scrolling trace from a 120Hz device, where the user reports occasional stuttering during list scrolling. Opening it in Perfetto reveals 18 dropped frames during the inertial scrolling phase, with 3 Full-severity frames (~60ms, where the per-frame budget on a 120Hz device is 8.33ms).
Jank (Dropped Frames): Perfetto’s frame_timeline track records the rendering duration of each frame. Exceeding the VSync period (8.33ms at 120Hz) results in user-perceptible stuttering. The
jank_typefield distinguishes jank types: App-side timeouts, SurfaceFlinger composition delays, Buffer Stuffing (BufferQueue backpressure), etc.
Path A: Manual Analysis
1 | 1. Open Perfetto UI, drag the timeline to locate the scrolling interval |
thread_state records a thread’s scheduling state (Running / Runnable / Sleeping / Uninterruptible Sleep, etc.). Different states point to different investigation directions – Runnable typically indicates CPU scheduling issues, while Sleeping typically indicates waiting/blocking issues. The
waker_utidfield records the source thread ID that woke up the thread, helping trace cross-process blocking chains.
Steps 3-4 represent the bulk of the work – 18 dropped frames, each requiring expanding thread_state, tracing the blocking cause, and correlating CPU scheduling. The analysis process is serial, frame by frame: the drill-down path may differ for each frame (Binder? Lock? GC? IO?), and all must be examined before drawing conclusions.
Path B: SmartPerfetto Agent
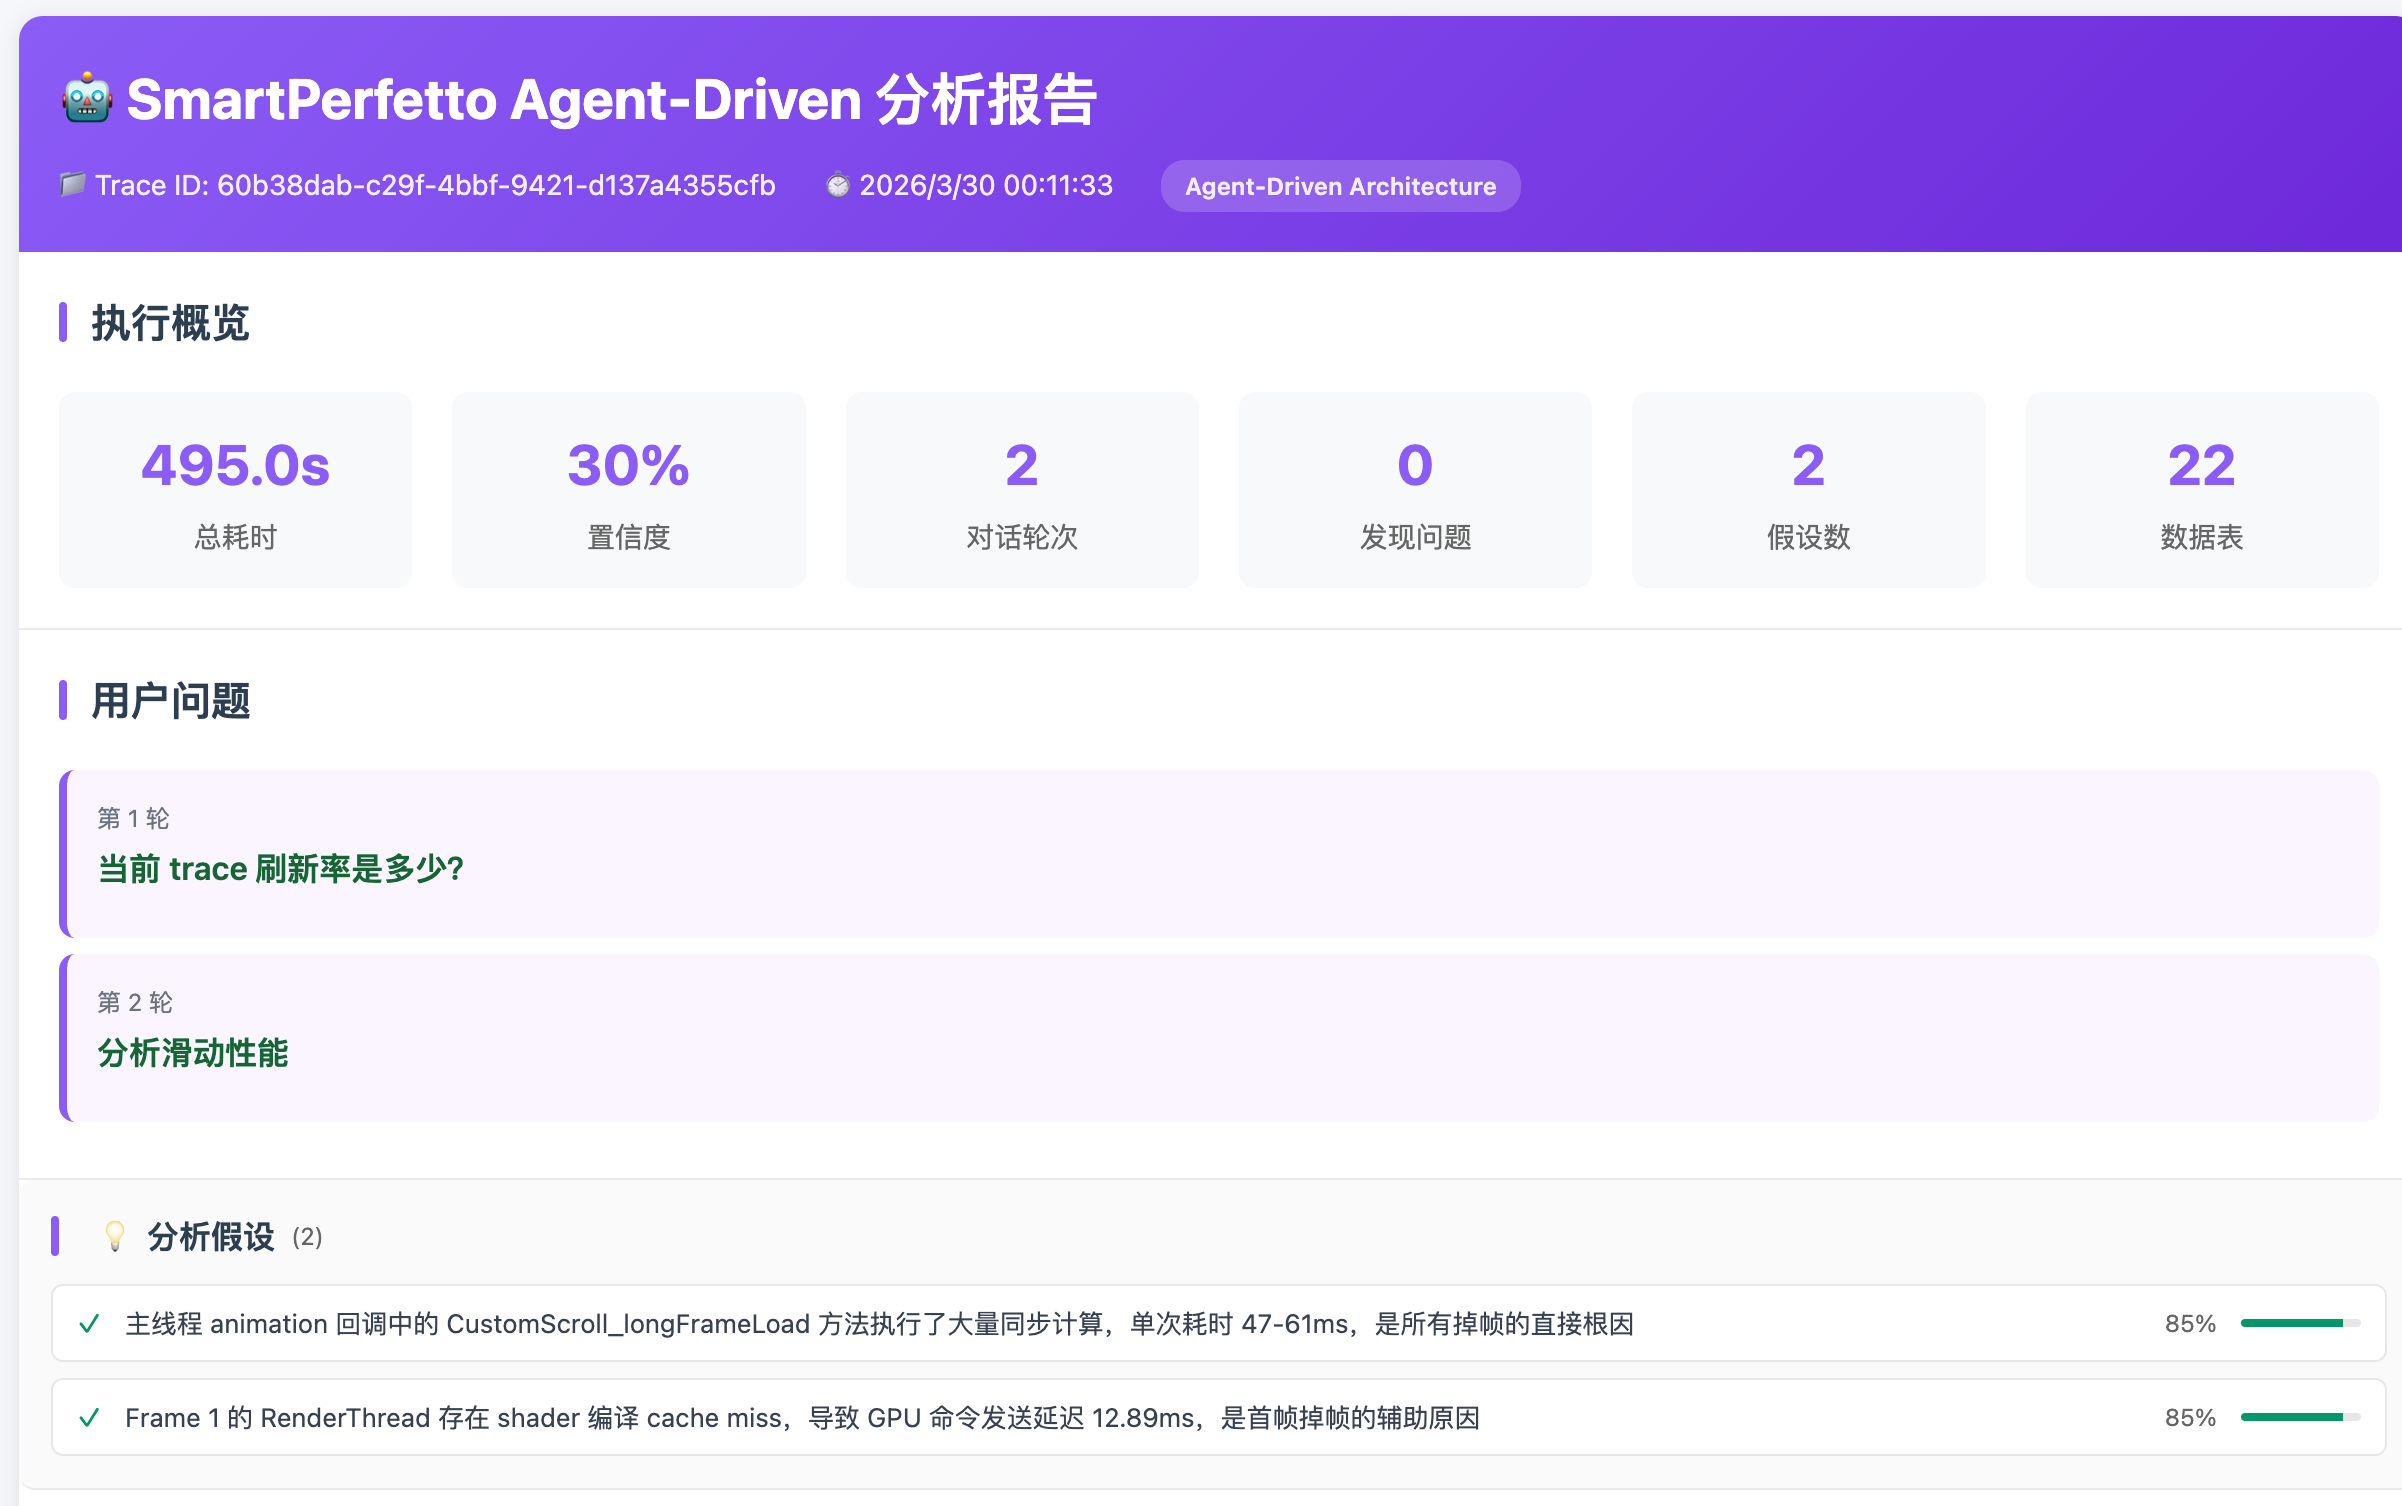
The user inputs "analyze scrolling performance", and the following shows the Agent’s actual operations (from session log session_agent-1774679540422):
1 | classifyScene("analyze scrolling performance") -> scrolling (<1ms, keyword matching) |
Metrics snapshot (from logs/metrics/): 16 tool calls, 0 failures, SQL average 652ms.
The following diagram shows the request lifecycle of a complete analysis – every step from user input to final conclusion:
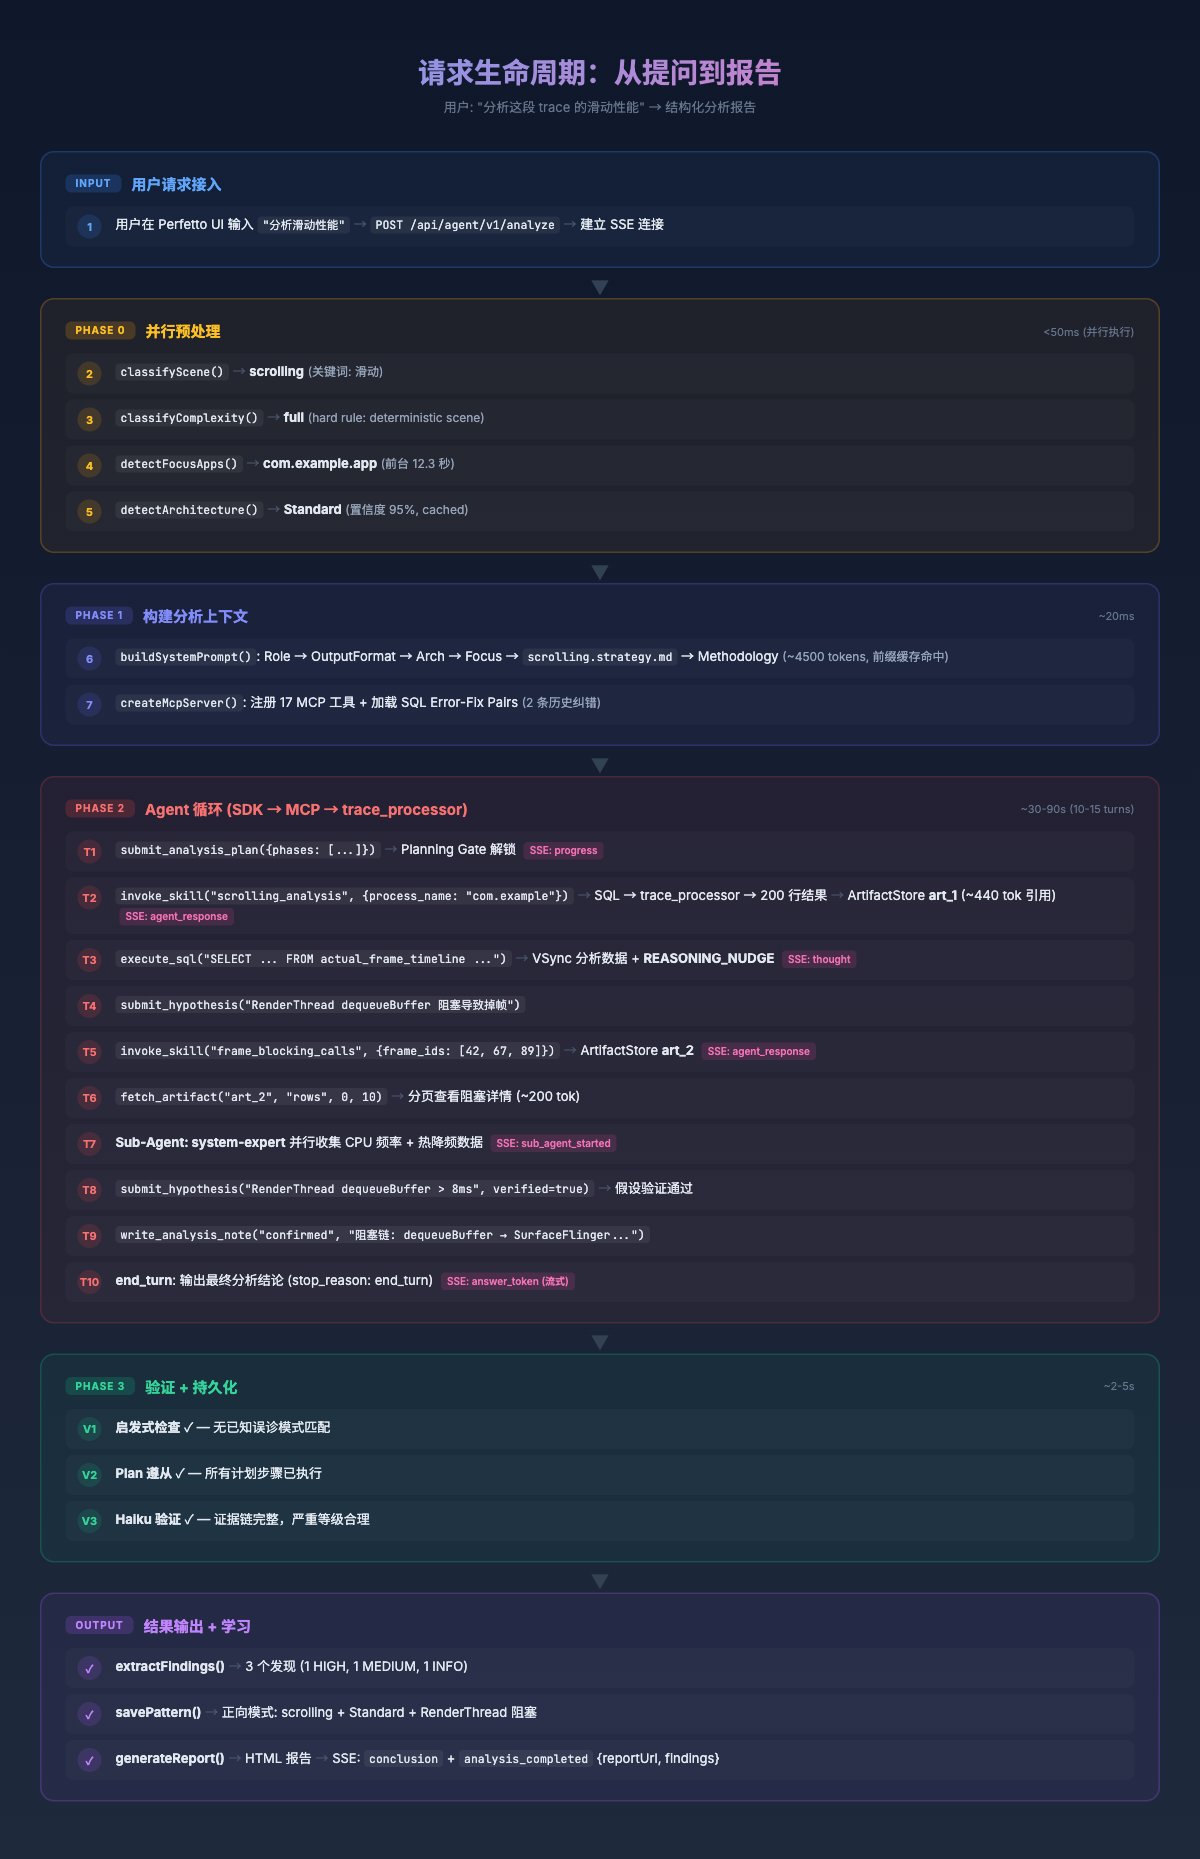
Both paths follow the same analysis steps – query frame data -> locate jank -> trace blocking chains -> correlate system state -> synthesize conclusions.
The difference is: manual analysis processes frames serially, with each frame requiring manual expansion and tracing; the Agent uses the scrolling_analysis Skill to batch-retrieve structured data for all 18 frames via a single SQL query, then selects representative frames for deep-drill blocking chain analysis.
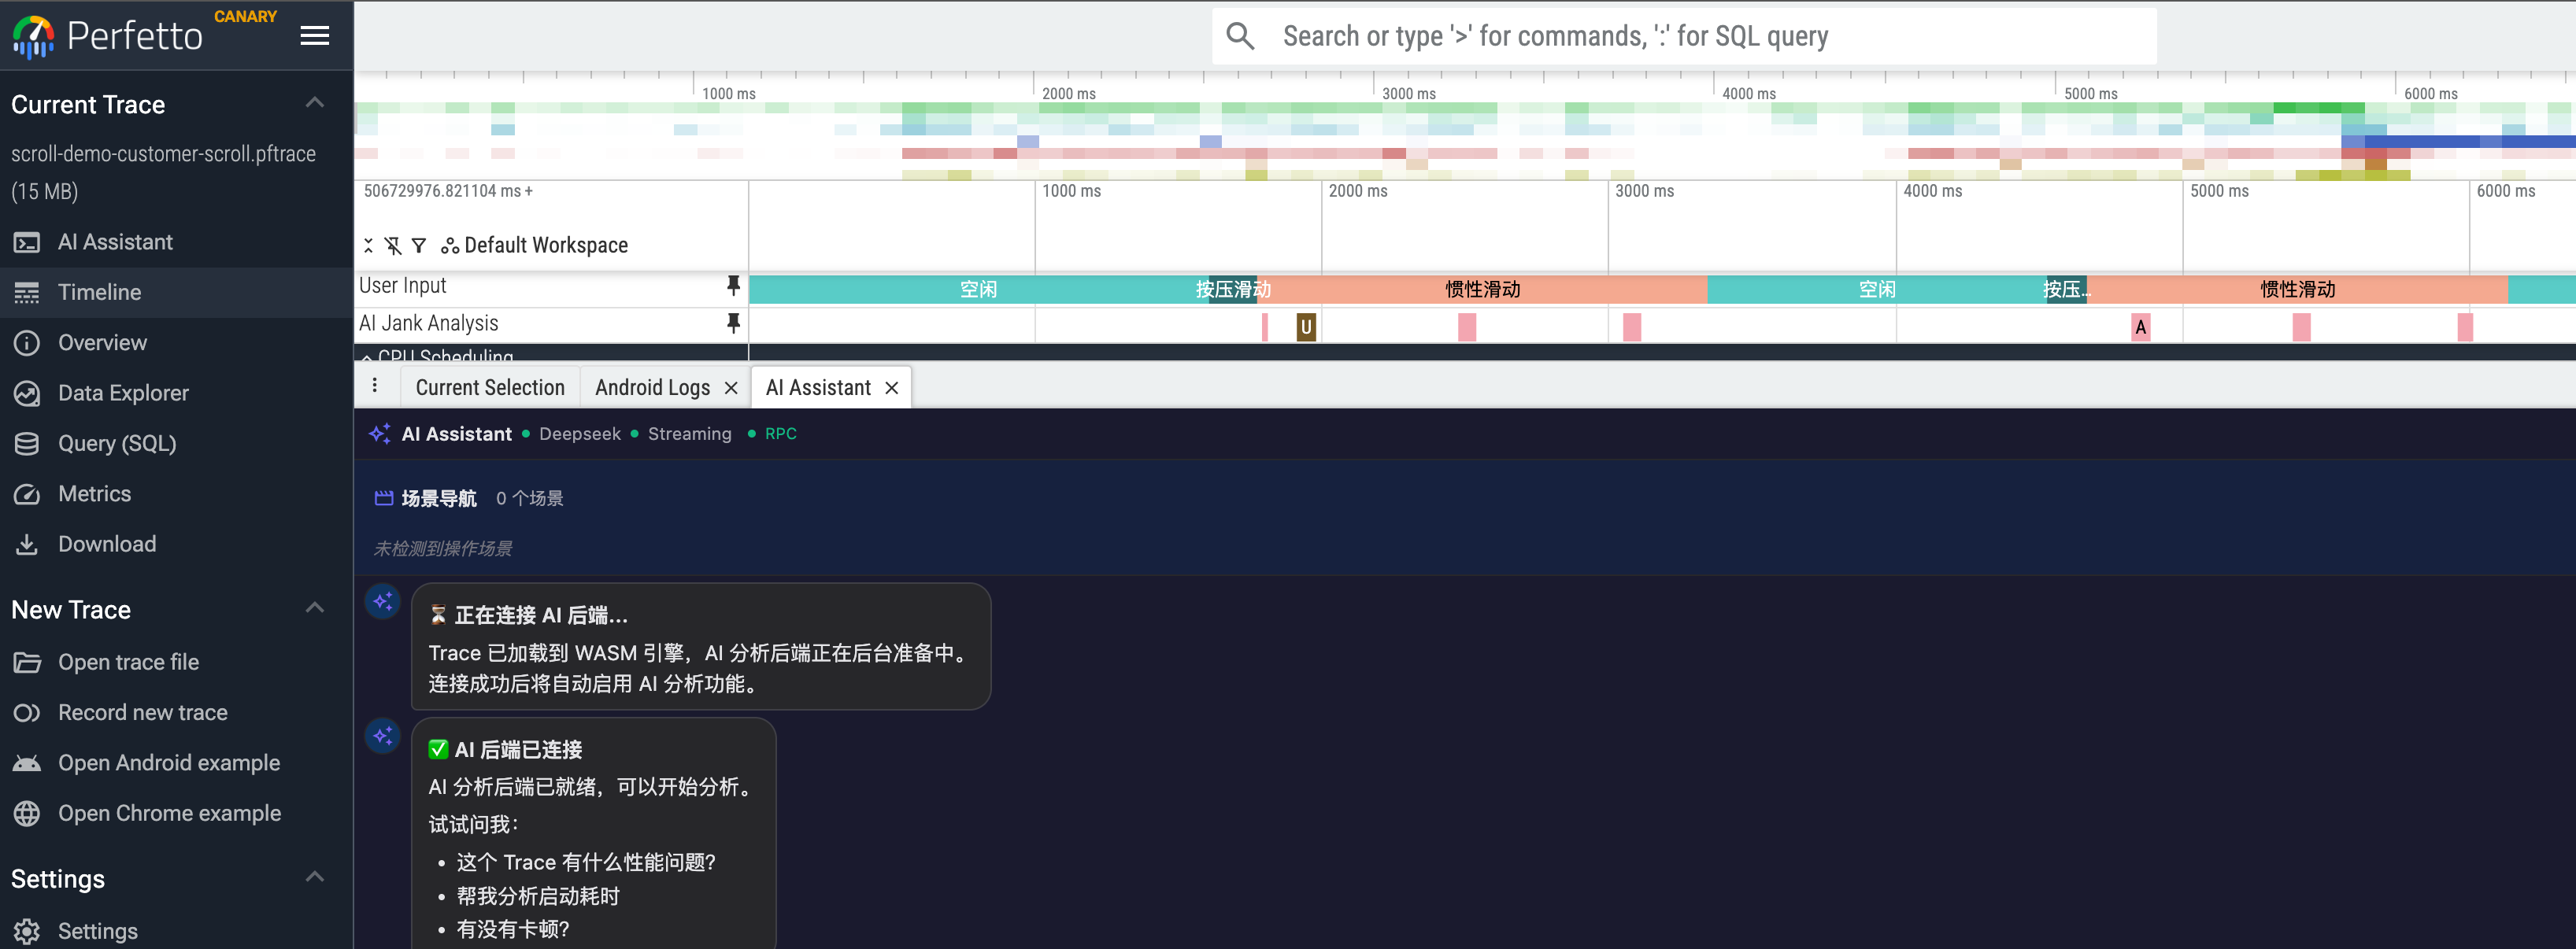
The Agent’s analysis results are also rendered directly in the Perfetto UI:
- Auto-Pin: Key frames and slices mentioned by the Agent are automatically marked on the timeline
- Click-to-Navigate: Timestamps and frame IDs in conclusions support click-to-navigate to the corresponding position in Perfetto
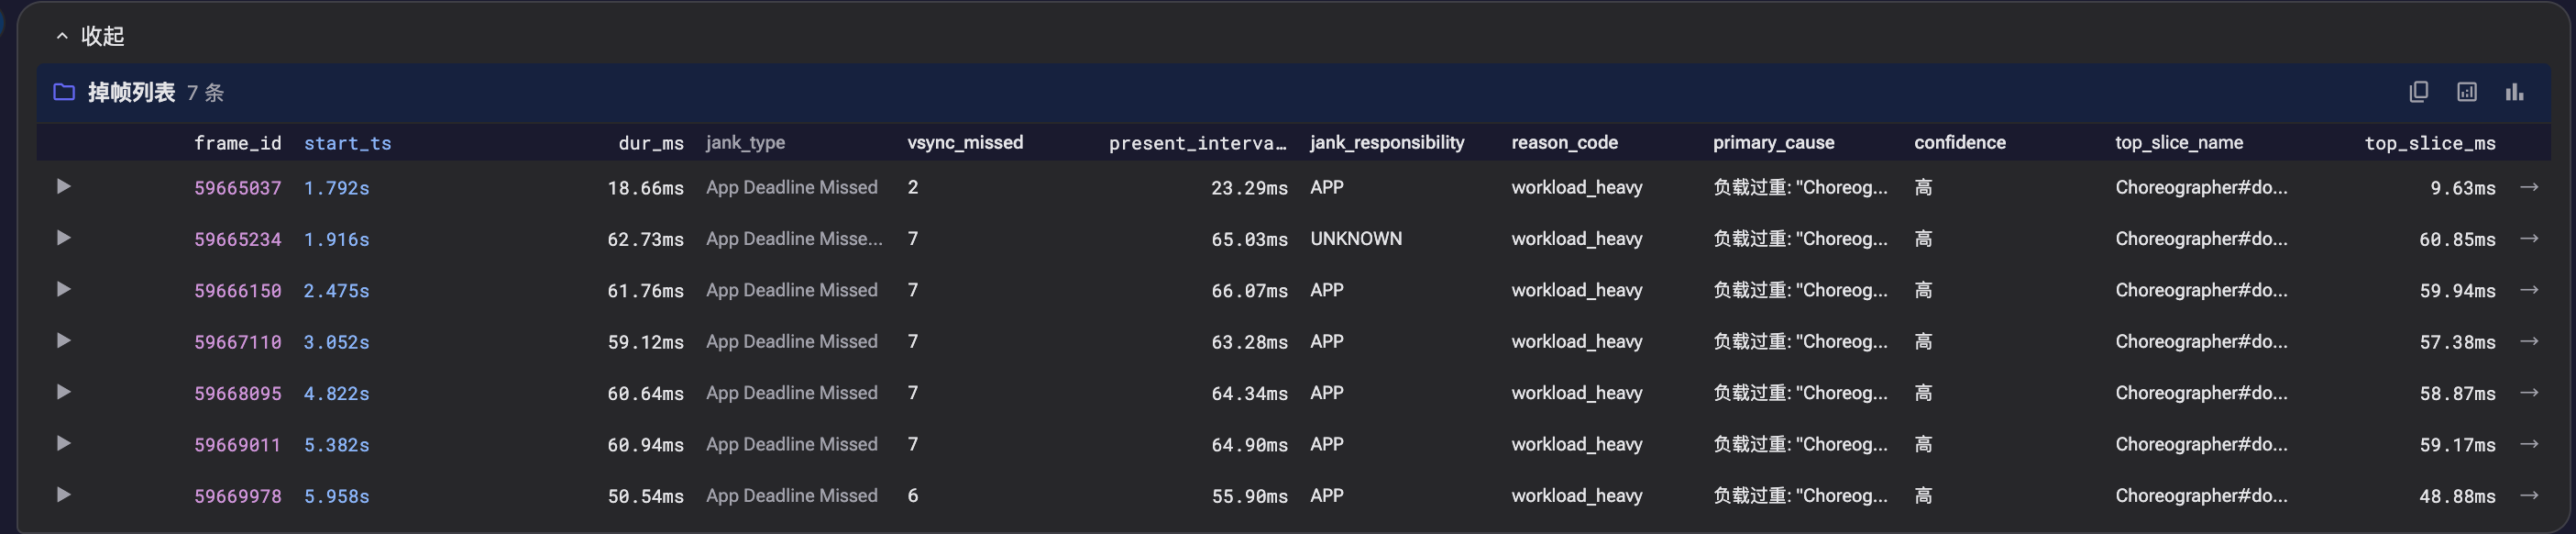
- Data Tables: Complete performance data for all 18 frames is rendered as sortable, filterable structured tables
Screenshot: SmartPerfetto frontend exists as a Perfetto plugin
Screenshot: During scrolling analysis, each dropped frame is analyzed in detail – click the arrow on the left to expand
Screenshot: Scrolling analysis conclusion
Screenshot: Scrolling analysis conclusion, representative frame analysis
Screenshot: Scrolling analysis conclusion, representative frame analysis
Screenshot: Each analysis round has its own analysis report, with content consistent with (and more detailed than) the frontend display
Analysis conclusions, data tables, and the Perfetto timeline are all on the same interface. After the Agent completes batch data collection and initial attribution, engineers confirm key findings directly in the Perfetto UI.
It should be noted that the current Agent still requires human judgment in complex edge cases (misdiagnosis issues are discussed in detail later). This article documents the engineering decision-making process behind building this Agent.
Part 1: Why Can’t an LLM Directly Analyze a Trace?
Before discussing the architecture, a fundamental question must be answered first: why can’t we simply send trace data to an LLM and let it analyze? The answer to this question determines the starting point of SmartPerfetto’s entire architecture.
Data Scale: Traces Don’t Fit in Context
The data scale of a real Perfetto trace looks like this:
| Dimension | Typical Value |
|---|---|
| Trace file size | 50MB - 500MB |
| Event count | Millions to tens of millions |
| Serialized as text | Several GB |
| Claude’s maximum context | ~200K tokens (approximately 150KB of text) |
The gap is several orders of magnitude. Even a relatively small 50MB trace, with its slices (function call records), counters (CPU frequency sample points), thread_state (thread scheduling states) and other data, far exceeds the LLM’s context capacity when serialized.
This means the LLM cannot possibly “see” the trace data directly. It must query on demand through tools – first use SQL to find the needed data subset (e.g., the state distribution of a specific thread within a certain time range), then analyze the query results. This constraint fundamentally dictates that SmartPerfetto must be a tool-driven Agent architecture, rather than a simple approach of feeding data into the prompt.
Precise Computation: LLMs Are Poor at Numerical Processing
The daily work of performance analysis revolves around precise numerical values: P50/P90/P99 percentiles of frame durations, VSync period detection (requiring median calculation of VSYNC-sf intervals and snapping to standard refresh rates), CPU utilization percentages, and time proportions of various thread states.
LLMs frequently make errors with these numerical computations. A real example: during early testing, Claude judged a 16.7ms frame duration as “normal, not exceeding VSync period” – it was using the 60Hz (16.67ms) frame budget. But this trace was captured from a 120Hz device, where the per-frame budget should be 8.33ms, making 16.7ms actually twice over budget. Such errors may seem small, but in performance analysis they lead to completely opposite conclusions.
Numerical computation must be handled by tools – SQL’s AVG(), PERCENTILE() and the predefined statistical logic in YAML Skills ensure consistent and precise results every time.
Domain Knowledge: LLMs Know It but Can’t Apply It
The complexity of Android’s rendering pipeline exceeds many developers’ expectations. The three most common rendering paths are: the standard HWUI pipeline (HWUI is Android’s default hardware-accelerated rendering engine, where View drawing instructions are generated on the main thread, submitted to the GPU by RenderThread, and finally composited to the screen by SurfaceFlinger), Flutter’s dual-thread model (1.ui -> 1.raster, bypassing RenderThread), and WebView’s Chromium pipeline (CrRendererMain thread handles rendering). Beyond these, there are also Jetpack Compose, game engines, camera pipelines, and more. SmartPerfetto’s architecture detection system currently identifies 24+ rendering pipelines, and jank analysis for different pipelines requires examining different threads and metrics – which is why architecture detection is the first step of analysis.
The root cause of stuttering may span threads (main thread blocked -> cause is in RenderThread), span processes (App waiting -> system_server’s WindowManagerService responds slowly), or even span hardware layers (CPU scheduled to a little core -> insufficient compute power -> frame timeout).
The LLM’s training data includes these concepts – it “knows” what RenderThread is, what Binder is, what SurfaceFlinger is. But when facing a specific trace, it lacks the ability to apply this knowledge in a phased, scene-specific manner. For example, when analyzing scrolling jank, one needs to first check frame-level data (which frames dropped, what type of jank), then choose different deep-drill paths based on the predominant root cause type (App-side blocking goes to blocking_chain_analysis, compositor-side delays go to SurfaceFlinger analysis). This kind of step-by-step, conditional-branching analysis workflow requires strategy injection for guidance.
Reliability: Error Rates Are High in Practice
Even with the data access problem solved, having an LLM directly produce performance analysis conclusions still faces reliability issues. In SmartPerfetto’s actual operation, I observed several typical output problems:
- Hallucinations: Generating data or metrics that don’t exist in the trace
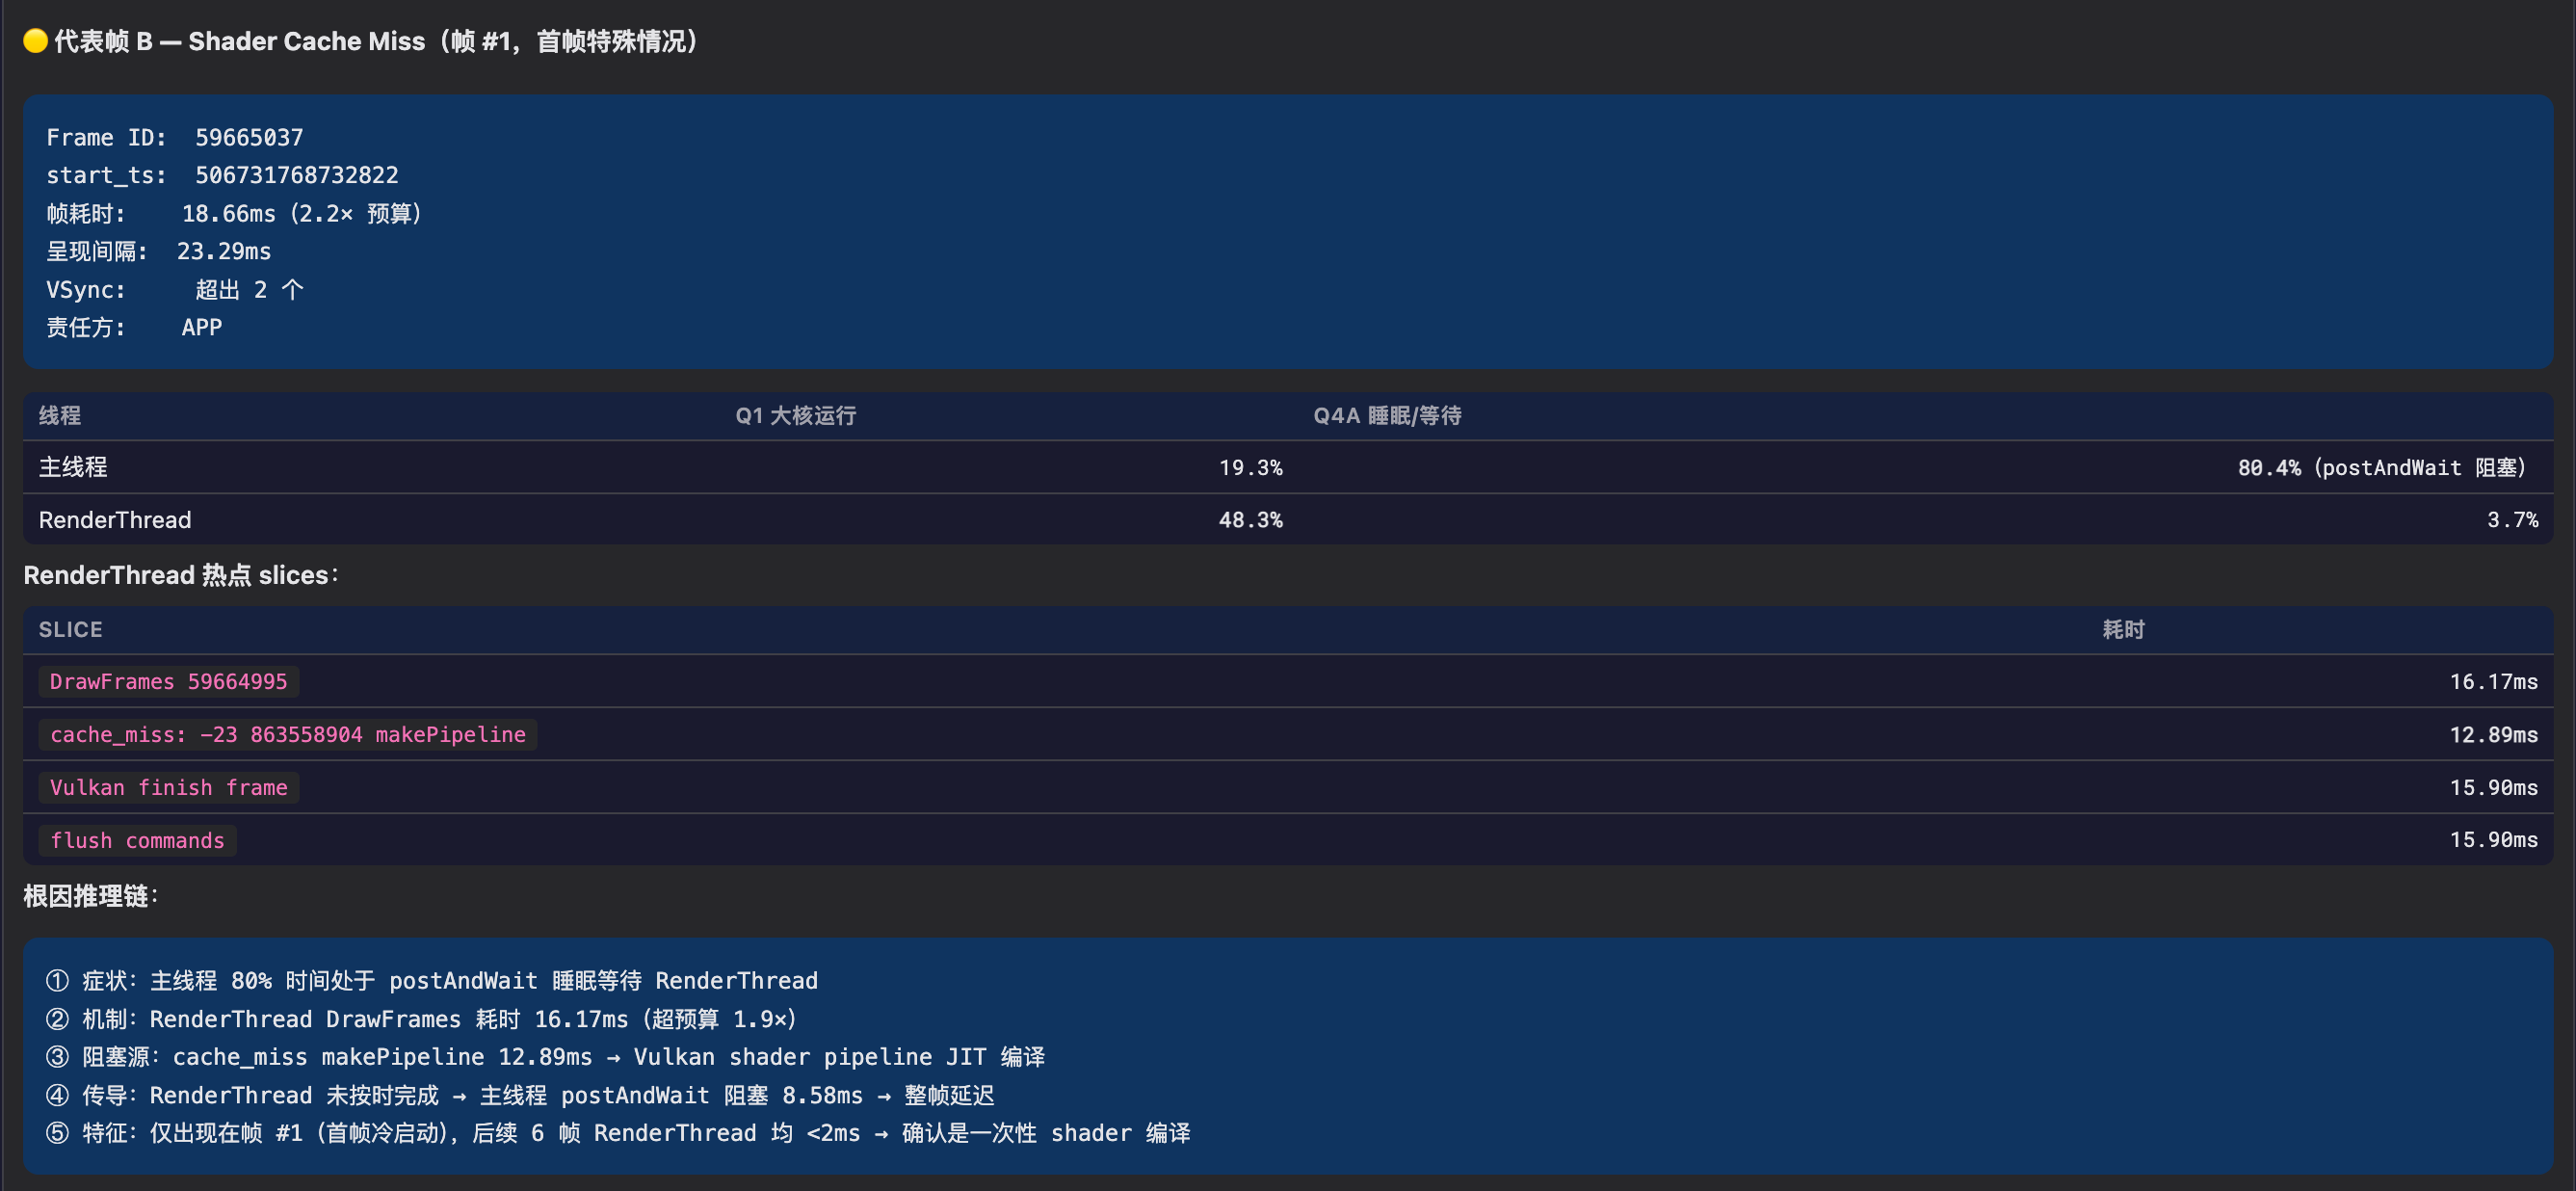
- Omissions: Missing critical checks (e.g., not checking the impact of JIT compilation and class loading when analyzing startup performance)
- Shallow attribution: Stopping at “main thread busy” without further tracing whether it’s busy with futex (lock contention), binder_wait (cross-process waiting), or GC pause
- Inconsistent conclusions: Analyzing the same trace twice and getting different severity assessments
Part 2 later in the article discusses this issue in detail – a quality audit 18 days after agentv3 went live showed that approximately 30% of Agent conclusions contained varying degrees of misjudgment.
SmartPerfetto’s Division of Labor
Based on these four problems, SmartPerfetto’s architecture divides responsibilities as follows:
1 | LLM (Claude) is responsible for: Tool system is responsible for: |
The LLM handles reasoning and expression; the tools handle querying and computation. Connecting the two is MCP (Model Context Protocol, Anthropic’s tool-calling protocol) – Claude calls trace_processor to execute SQL, invokes YAML Skills for structured analysis, and queries Perfetto stdlib modules through standard MCP interfaces. Analysis results are streamed to the Perfetto UI frontend in real-time via SSE (Server-Sent Events).
The engineering infrastructure supporting this division of labor includes: scene routing (injecting different analysis strategies based on the user’s question), data compression (controlling the volume of data returned to the LLM), and quality verification (intercepting the LLM’s domain misjudgments). The following sections discuss each of these in detail.
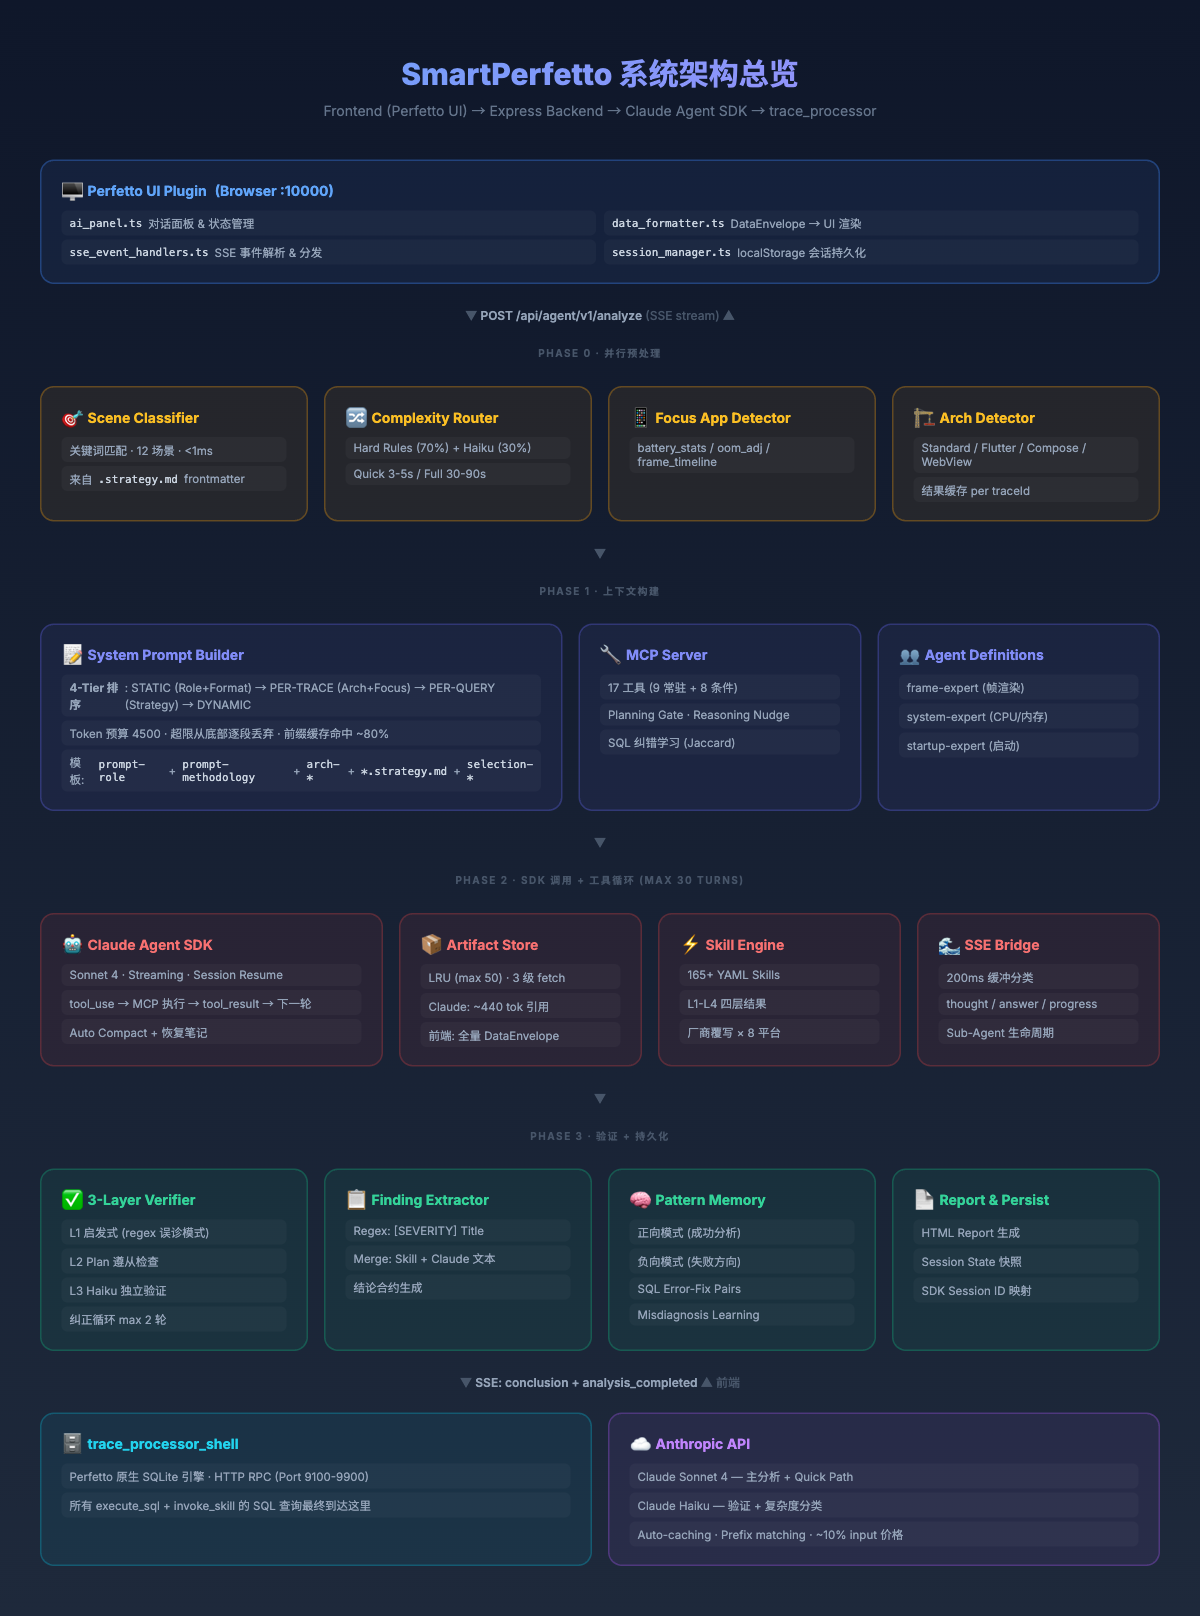
The diagram below shows the complete system architecture, illustrating the 4 stages from user request to analysis conclusion:
Part 2: From Workflow to Agent
The Difference Between Workflow and Agent
In their December 2024 publication Building Effective Agents (authors Erik Schluntz, Barry Zhang), Anthropic classified AI systems into two categories:
- Workflow: LLM and tools are orchestrated through predefined code paths. What each step does and where the next step goes are all defined by the developer in advance.
- Agent: The LLM dynamically drives its own process and tool usage, autonomously deciding how to complete the task.
The practical significance of this distinction lies in the trade-off between flexibility and controllability. Workflows provide predictability, suitable for tasks with fixed steps; Agents provide flexibility, suitable for open-ended problems that require adjusting direction based on intermediate data. Andrew Ng’s description is apt: rather than making a binary judgment about whether a system is an Agent, think of it as varying degrees of Agent-ness. SmartPerfetto’s agentv2 and agentv3 correspond to opposite ends of this spectrum.
Why Performance Analysis Needs an Agent, Not a Pipeline
Performance analysis is not a fixed “input-in, output-out” process – it’s an exploratory reasoning process. Take a real scrolling analysis as an example:
1 | 1. Start with the overview -> find 47 jank frames, P90 = 23.5ms |
Each step’s decision depends on the previous step’s results – all steps cannot be determined before the analysis begins. A pipeline cannot handle requirements like “this trace’s problem might be in GPU or GC, and the drill-down direction needs to be dynamically chosen based on intermediate data.”
SmartPerfetto’s design is a hybrid of determinism and flexibility: known scenes (scrolling, startup, ANR, etc.) use Strategy files to constrain mandatory checks, ensuring nothing is missed; but the specific queries and drill-down directions within each phase are autonomously decided by Claude. Unmatched scenes are entirely handed over to Claude for autonomous exploration.
agentv2: A Typical Workflow
agentv2 used DeepSeek as the backend, employing a Governance Pipeline architecture – orchestrated through planner / executor / synthesizer three-phase pipeline, essentially a predefined multi-step workflow (historical commit 6d80aefb: “Replace the 13-step agentv2 governance pipeline with Claude-as-orchestrator”).
This architecture worked well for scrolling analysis of standard Android applications, but encountered problems with non-standard scenarios. For example, Flutter application traces don’t have standard frame_timeline data, and the pipeline would get empty results but continue executing subsequent steps, ultimately outputting conclusions based on empty data.
agentv3: Migration to Agent Architecture
On March 2, 2026 (commit 6d80aefb), I switched to the Claude Agent SDK. After receiving tool definitions and strategies, Claude autonomously decides which tools to call, in what order, and what data to query.
An AI Agent typically possesses the following characteristics, with agentv3’s implementation mapped as follows:
| Characteristic | Implementation in SmartPerfetto | Code Location |
|---|---|---|
| Autonomy | Agent autonomously decides which tools to call and in what order | claudeRuntime.ts |
| Reasoning | REASONING_NUDGE appended after each tool call to trigger explicit reflection | claudeMcpServer.ts:84 |
| Tool Use | Up to 20 MCP tool calls to trace_processor | 9 always-on + 11 conditional |
| Planning | submit_plan + requirePlan() gating | Disabled in lightweight mode |
| Reflection | 3-layer Verifier + Correction Prompt (max 2 rounds) | claudeVerifier.ts |
| Error Recovery | SQL error-correction learning + cross-session misdiagnosis pattern learning | Cross-file |
| Memory | Short-term: Analysis Notes / Artifact Store; Long-term: Pattern Memory / SQL Fix Pairs | 7 layers of memory |
1 | agentv2 (Workflow): Fixed pipeline -> each step predefined -> unexpected data = wrong conclusion |
9 Rounds of Review After Migration
From March 2 to March 20, 9 rounds of architecture review were conducted. The most impactful rounds:
| Round | Date | Key Findings |
|---|---|---|
| Round 1 | 3/2 | 12 fixes after initial SDK integration – SQL knowledge base not wired into System Prompt, CPU core count hardcoded to 4 in jank_frame_detail |
| Round 3 | 3/12 | Architecture wiring audit – 12 instances of “implemented but not connected,” e.g., verification pipeline skipped when 0 findings |
| Round 7 | 3/15 | Perfetto Stdlib integration – preloaded modules 4->22, Schema Index 708->761 |
| Round 9 | 3/20 | Production quality audit after 18 days of real traces – 3 P0 + 4 P1 + 5 P2, which catalyzed the three-layer verification system |
Cold Start 4-Layer Cascading Bug
On March 19, 2026 (commit d5a1d7b3), cold starts were found to be incorrectly classified as warm starts. Tracing revealed this was a cascading issue across 4 layers:
1 | Layer A (Perfetto Stdlib): bindApplication's ts is ~98ms earlier than launchingActivity -> excluded by filter |
Fix scope: rewrote 10 downstream Skills, added 4 new startup analysis Skills. This issue demonstrates that in a Skill dependency chain, a semantic error in a single upstream field amplifies through each layer.
Ghost MCP Query – Async Lifecycle Mismatch
Another cross-layer bug caught on April 7, 2026 (commit a0ad63ba): after an analysis timed out, the session had already been cleaned up and the SSE stream closed, but trace_processor’s stderr continued to emit errors like no such table: cpu_frequency_counters / no such column: ts 90 seconds later – orphan logs with no owner attributable to any session. The two error-correction pairs from Error 4 mentioned earlier were traced back from this pile of stderr output.
The root cause was in the SDK Query’s async lifecycle:
1 | Layer A (Claude Agent SDK): SDK's internal AsyncIterator still producing messages |
AsyncGenerator.return() and break only take effect on the consumer side and do not notify the producer-side external resources (SDK subprocess + MCP tool execution queue). The fix was to change the return type of sdkQueryWithRetry from a single AsyncIterable to a { stream, close } tuple, with close() explicitly called on all three paths – timeout / exception / finally – allowing the SDK to actively abort the subprocess:
1 | // claudeRuntime.ts |
This bug was particularly insidious because the surface symptom (orphan SQL error logs) and the true root cause (async resource lifecycle mismatch) were far apart – the error messages looked like “Agent wrote bad SQL,” but the reality was “the Agent had long since stopped; it was the SDK subprocess that hadn’t.” In Agent applications, “breaking out of a loop” is often not as clean as one might imagine; any long-lived async resource needs an explicit close channel rather than relying on for-await‘s automatic cleanup.
Part 3: Three Key Engineering Decisions
Decision 1: Scene Classification – From Full Injection to On-Demand Loading
Initially, I stuffed the analysis strategies for all 12 scenes (scrolling / startup / ANR / interaction / pipeline / game / memory, etc.) into the System Prompt, totaling 15000+ tokens. The logic was: Claude should know all scene analysis methods so it can handle whatever the user asks.
After running in practice, Claude was found to confuse terminology across scenes – when analyzing scrolling, it referenced startup-phase metrics, mixing up VSync intervals (inter-frame timing) with bindApplication (process initialization). The root cause was that different scenes have heavily overlapping terminology: “frame” in the scrolling context means a rendering frame, while in the startup context it means the first frame display. When all 12 strategy sets are present simultaneously, the LLM cannot distinguish the context.
The solution was to implement scene classification, injecting only one strategy set at a time:
1 | // sceneClassifier.ts -- 12 scenes, <1ms execution |
Keywords and priorities are declared in each .strategy.md‘s YAML frontmatter, not hardcoded in the source:
1 | # scrolling.strategy.md |
Adding a new scene only requires creating a new .strategy.md file. DEV mode supports hot reloading – changes take effect upon browser refresh.
After the adjustment, the System Prompt dropped from ~15000 tokens to ~4500 tokens, and the strategy confusion issue did not recur. Adding new scenes went from modifying code to simply creating a new .md file.
When multi-turn conversations accumulate substantial context (analysis notes, historical plans, pattern memory, etc.), the System Prompt may again exceed the 4500-token budget. At that point, lower-value paragraphs are progressively dropped by priority: SQL knowledge base references (Claude can query on demand via the lookup_sql_schema tool) -> historical analysis experience -> historical lessons learned -> SQL error-correction pairs -> sub-agent collaboration guidelines -> historical analysis plans. Core paragraphs (role, methodology, scene strategy, output format) are never dropped.
Decision 2: Artifact Store – Controlling Data Volume Returned to the LLM
Decision 1 solved the System Prompt bloat problem. But even with only one strategy set injected, each Skill call during Agent execution still produces large amounts of data (200+ rows of frame data), and putting all of it into context creates new problems.
Early versions returned complete Skill execution results (e.g., 200 rows of frame data, 487 rows of blocking analysis) to Claude. Each Skill result was approximately 3000 tokens, and with 5-8 Skill calls per analysis, Skill data alone consumed 15000-24000 tokens.
Token cost was one concern, but a more surprising discovery was: the more data Claude received, the worse its output quality became. When faced with 200 rows of frame data, it tended toward line-by-line description (“Frame 1 took 12.3ms, Frame 2 took 15.7ms…”) rather than pattern-level summarization. I suspect the reason is that when the context is flooded with large amounts of numbers, the LLM’s attention becomes scattered.
The solution was to store Skill results in the ArtifactStore, returning only compact references (~440 tokens) to Claude – row count, column names, and summary information. When details are needed, Claude retrieves them on demand via fetch_artifact with pagination. Complete data is sent to the frontend for rendering through an independent SSE (Server-Sent Events) channel, bypassing the LLM entirely.
1 | invoke_skill("scrolling_analysis") execution result: |
Three granularity levels for fetch_artifact:
| Level | Returns | Approx. Tokens |
|---|---|---|
summary |
Row count + column names + first row sample | ~50 |
rows |
Paginated data (offset/limit) | ~200-500 |
full |
Complete raw data | ~3000 |
After the adjustment, each Skill’s token cost dropped from ~3000 to ~440, and 8 Skills went from ~24000 to ~3520 tokens. Claude’s output shifted from line-by-line description to pattern-level summarization, while the frontend still received complete data for table rendering.
Decision 3: Three-Layer Verification – Lessons from Real Misjudgments
18 days after agentv3 went live, I conducted a systematic quality audit (March 20, 2026, commit da63eaf9). The statistics were surprising: approximately 30% of Agent conclusions contained varying degrees of misjudgment.
The following are actual misjudgment cases encountered:
1 | [Case 1] Agent marked VSync alignment offset as CRITICAL |
These misjudgments share a common characteristic: they are not logic errors, but gaps in domain expertise. VSync micro-offsets on high-refresh-rate devices being normal, Buffer Stuffing delays occurring at the pipeline queue level rather than in App logic, single-frame anomalies not constituting a pattern – these judgments depend on deep understanding of Android’s graphics stack, which Claude’s training data covers insufficiently.
Recognizing this, I established a three-layer progressive verification system:
1 | Layer 1: Heuristic checks (no LLM calls) |
When verification finds severe issues, a Correction Prompt is generated for Claude to revise its conclusion (up to 2 rounds).
Cross-session learning: Confirmed misdiagnosis patterns are persisted to logs/learned_misdiagnosis_patterns.json and automatically injected into the System Prompt for subsequent analyses. For example, the system learned:
1 | { |
Note: Learned misdiagnosis patterns do not take effect immediately. The code requires
occurrences >= 2before entering the active pattern set – the first recording is just a marker, and the same pattern is only injected into subsequent analyses’ System Prompt when it appears a second time, preventing isolated events from causing over-correction.
Part 4: Why Not Use a Standard Skill System?
The Design Choice from SOP to YAML Skills
Performance analysis teams typically have their own SOPs (Standard Operating Procedures): how to investigate scrolling jank, how to analyze slow startups, how to diagnose ANR. SOPs are usually documents or checklists – experienced engineers follow them, new team members learn from them.
Anthropic’s Claude Code has a Skills system, essentially parameterized Prompt templates – inject context and submit to the Agent for execution. A natural idea is to write performance analysis SOPs as such Prompt templates and have Claude execute them according to the SOP.
I initially went down this path. The Prompt given to Claude was: “Query the frame_timeline table, find jank frames, analyze the main thread’s state distribution during jank frames.”
Claude understood the intent without issue, but the SQL it generated was different each time. Sometimes the JOIN path was correct (slice -> thread_track -> thread), other times it wrote slice.utid directly – a column that doesn’t exist. The result format was also inconsistent, sometimes 3 columns, sometimes 5, making frontend rendering impossible.
The reason is simple: SOPs are written for humans. An engineer seeing “query frame_timeline” knows exactly what SQL to write. The LLM’s understanding of Perfetto’s SQL schema is incomplete (these schemas have limited coverage in training data), and each translation from SOP text to SQL introduces variance.
SmartPerfetto’s YAML Skills took a different approach – not Prompt templates, but declarative SQL execution units:
1 | # YAML Skill: SQL predefined, result format fixed |
The core difference between the two approaches is “who writes the SQL.” Prompt templates have the LLM dynamically generate SQL each time, producing unpredictable result formats that can’t be regression-tested; YAML Skills predefine SQL and output schema, execute after parameter substitution, with fixed result formats that enable stable regression testing and frontend rendering.
| Dimension | Prompt Template (SOP-style) | YAML Skill (Declarative Execution) |
|---|---|---|
| SQL source | LLM generates dynamically each time | Predefined in YAML, parameter substitution |
| Result format | May differ each time | Fixed column names and types |
| Regression testable | Not supported | All 6 trace regression tests pass |
| Frontend rendering | Requires parsing free text | Schema-driven tables/charts |
| Composable | Not supported | Composite skills call atomic skills |
| Vendor adaptation | Requires different Prompts | .override.yaml overrides SQL |
The final division of labor: Claude is responsible for understanding intent, selecting Skills, and reasoning about attribution; YAML Skills are responsible for precise SQL queries and structured output. Claude invokes Skills via invoke_skill, Skills return structured data, and Claude makes judgments based on the data.
Why Not Expose Each Skill as an Independent MCP Tool?
A natural question: why not directly register all 87 atomic analysis capabilities as 87 MCP Tools and let Claude call them directly?
Trying this in practice reveals a problem: the MCP tool list grows linearly with the number of tools. 87 tools means every API call must include descriptions (name, parameter schema, usage instructions) for all 87 tools in the request, and this fixed overhead consumes significant tokens. More importantly, when Claude faces 87 tools, its selection accuracy degrades – with too many tools, it doesn’t know which one to use.
SmartPerfetto’s design gives Claude only 2 Skill-related MCP Tools:
invoke_skill(skillId, params)– Execute a specified Skilllist_skills(category?)– Query available Skills by scene category
Capabilities are discovered on demand via list_skills(category="scrolling"), then invoked with invoke_skill. 2 MCP Tools encapsulate 160+ analysis capabilities, and the tool list’s token overhead is fixed.
Another benefit is that the YAML format lowers the contribution barrier. If a performance analysis expert has experience with a particular analysis scenario, they can directly write a YAML Skill defining SQL queries and output formats, without needing to know TypeScript or modify backend code. Changes take effect in development mode upon browser refresh (hot reloading), with iteration cycles measured in seconds.
Skill System Structure
The Skill count grew from a dozen in the early project to 164 now. The growth was not driven by “as many as possible,” but by continuously encountering new scenarios that needed coverage in analysis practice – initially there was only frame analysis for standard HWUI, then Flutter applications required specialized Skills, then vendor differences required overrides, then startup analysis needed independent detection logic for JIT, class loading, and Binder pool respectively.
The current Skill distribution by type:
| Type | Count | Location | Description |
|---|---|---|---|
| Atomic | 87 | skills/atomic/ |
Single detection capabilities (VSync period, CPU topology, GPU frequency, GC events, etc.) |
| Composite | 29 | skills/composite/ |
Multi-step combined analyses (e.g., scrolling_analysis orchestrates multiple atomic Skills) |
| Pipeline | 28 | skills/pipelines/ |
Rendering pipeline detection + teaching (24+ Android rendering architecture identification) |
| Module | 18 | skills/modules/ |
Module-categorized analyses (app / framework / hardware / kernel) |
| Deep | 2 | skills/deep/ |
Deep analysis (CPU profiling, callstack analysis) |
Additionally, skills/vendors/ contains .override.yaml for 8 vendors (Pixel / Samsung / Xiaomi / Honor / OPPO / Vivo / Qualcomm / MTK), overriding vendor-specific SQL in generic Skills.
Layered Results
Early Skill output was flat – a Skill returned one large table, with 200 rows of frame data mixed together. Users would see all the data at once upon opening, with no sense of hierarchy. In practice, engineers’ reading habits follow a pattern: first look at the summary (what’s the jank rate, what’s P90), then decide whether to expand the details, then deep-drill into specific frames.
Now Skill output is organized by layer, with progressive frontend rendering:
1 | summary -- "47 jank frames, P90=23.5ms, SEVERE accounts for 12%" |
Each Skill step declares its display layer via display.level (the most frequently used in practice are detail – 240 occurrences, key – 170 occurrences, summary – 81 occurrences). The frontend automatically renders tables and charts based on column types (timestamp, duration, percentage, bytes, etc.) and interaction actions (navigate_timeline to jump to the trace position, navigate_range to select a time range, copy to copy data) from the DataEnvelope – adding a new Skill requires no additional frontend code. This is key to how 164 Skills coexist while frontend code volume remains manageable.
Step Types
Initially, all Skills had only one step type: execute a single SQL query. Later, scenarios requiring composition of multiple Skills arose (e.g., scrolling_analysis needs to first query frame data, then perform blocking analysis on each jank frame), as well as scenarios requiring iteration over data rows (per-frame diagnosis), leading to gradual expansion of step types:
| Step Type | Description | Usage Frequency |
|---|---|---|
atomic |
Single SQL query, the most basic step type | Most common |
skill |
References another Skill’s result, for reusing existing capabilities in composite analysis | 56 occurrences |
iterator |
Iterates over data rows, executing sub-queries for each row | Used in 5 composite Skills |
diagnostic |
Diagnostic step, generating structured diagnostic conclusions | 38 occurrences |
parallel |
Execute multiple steps in parallel (code supports it, not yet used in Skills) | 0 |
conditional |
Branch selection based on conditions (code supports it, not yet used in Skills) | 0 |
iterator is the core of per-frame analysis – for example, for the 8 most severe out of 18 jank frames, execute blocking_chain_analysis on each one individually, analyzing the blocking cause for each frame independently. parallel and conditional are defined in the type system but not yet used by any Skill – this is because current analysis scenarios are already covered by skill references + iterator traversal. When more complex scenarios are introduced (such as multi-path parallel data collection), these will come into play.
Domain Skill Examples
The following examples illustrate why so many specialized Skills are needed – each Skill addresses a specific problem that a generic approach can’t handle.
Consumer Jank Detection – Framework Labels != User Perception
The framework’s jank_type label does not equal user-perceived frame drops. Hidden Jank exists – the framework marks jank_type='None' but the user perceives stuttering. The reason is a discrepancy between the framework’s judgment criteria and the user’s actual perception.
SmartPerfetto uses an independent consumer_jank_detection Skill for jank determination: it estimates the actual VSync period via the median of VSYNC-sf intervals, then uses 1.5x the VSync period as the threshold, judging whether jank occurred based on the present_ts difference between adjacent frames (the timestamp when a frame is actually displayed on screen). It does not rely on framework labels.
Blocking Chain Analysis – Cross-Thread, Cross-Process Root Cause Tracing
The root cause of a single dropped frame may involve a multi-layer causal chain:
1 | Frame 42 took 62ms (budget 8.33ms) |
The blocking_chain_analysis Skill provides key evidence for this chain via 3 SQL steps: main thread state distribution (Running / Sleeping / IO proportions) -> waker tracing (finding who woke the main thread via waker_utid) -> blocking function aggregation (cumulative time for futex / binder_wait / io_schedule). This kind of cross-layer analysis is very difficult to implement stably by having Claude write SQL on its own with generic prompts.
Flutter Architecture Branching – Different Rendering Modes Require Different Analysis Logic
Flutter’s two rendering modes involve different threads, requiring examination of different targets during analysis:
| Mode | Jank Analysis Target Threads | Goes Through Host RenderThread |
|---|---|---|
| TextureView (dual pipeline) | 1.ui + 1.raster + RenderThread | Yes |
| SurfaceView (single pipeline) | 1.ui + 1.raster | No |
If standard HWUI analysis logic is used to analyze a Flutter SurfaceView application, 1.raster thread’s duration would be incorrectly attributed to RenderThread. SmartPerfetto automatically identifies Flutter applications through architecture detection (24+ rendering pipelines) and switches to the dedicated flutter_scrolling_analysis Skill.
But “automatically identifying Flutter” itself also hit a snag (commit 355df8ee, 4/6). The early pipeline detector scored each architecture independently, with the highest score winning – as a result, Flutter TextureView traces were frequently misclassified as STANDARD. The reason was that Flutter TextureView’s host side still goes through the HWUI pipeline (Choreographer#doFrame / DrawFrame / RenderThread), and these signals were absorbed by both the STANDARD and TEXTUREVIEW classifiers. STANDARD had broader signal coverage (traces almost always contain Choreographer frames), so its total score often exceeded the specialized TEXTUREVIEW, misclassifying Flutter apps as STANDARD. The same problem occurred with WeChat Skyline (absorbed by WEBVIEW) and game engines (absorbed by STANDARD/MIXED).
The fix was not to adjust weights, but to add exclude_if to specialized pipelines: once TEXTUREVIEW detects Flutter 1.ui / 1.raster signals, it directly blocks the STANDARD classification; STANDARD_LEGACY/MIXED/SURFACEVIEW_BLAST block each other upon detecting Game Engine signals; OPENGL_ES blocks upon detecting WebView/Game signals. 24+ pipelines cannot score independently – they need a “specialized -> generic” priority chain. This is a classic example of “once you have many pipelines, you must implement mutual exclusion” – and it’s why, after the Skill count grew to 160+, simply “routing to the correct Skill” itself became an independent engineering problem.
Vendor Overrides – Same Metric Has Different Field Names on Different Platforms
In traces from Qualcomm, MediaTek, and Google Tensor, the same metric has different field names (e.g., GPU frequency is called gpufreq on Qualcomm but might be gpu_freq_khz on MediaTek). .override.yaml lets the same Skill automatically adapt its SQL across different platforms, without needing to write independent Skills for each vendor.
Part 5: SQL Engineering
The Skill system discussed above ultimately comes down to SQL queries – each Skill step executes predefined SQL. SQL is SmartPerfetto’s core – all performance data retrieval ultimately goes through SQL queries to trace_processor. This section expands on several engineering aspects at the SQL level: query pattern design, official stdlib reuse, Schema indexing, result compression, and error-correction learning.
SQL Query Patterns: Time Interval JOINs and Recursive Bucketing
Perfetto trace data is essentially a stream of events with timestamps and durations. The most common operation in performance analysis is determining whether two events overlap in time – for example, whether the main thread was blocked by a Binder call during a frame’s rendering.
The core SQL pattern heavily used in YAML Skills is the time interval JOIN – determining whether two events overlap in time. The following SQL’s business meaning is: for each jank frame, find the blocking calls (such as GC, Binder, locks) that occurred simultaneously during the frame’s rendering, and calculate how many milliseconds they overlapped:
1 | -- Business meaning: Time overlap analysis between jank frames and blocking calls |
The
MIN(end1, end2) - MAX(start1, start2)here is the standard formula for calculating overlap length between two intervals. In Perfetto traces, timestamps are nanosecond-precise, and this interval JOIN achieves 0.001ms granularity.
Another common pattern is recursive CTE for time bucketing. For example, analyzing the distribution of big-core vs. little-core CPU usage during the startup process:
1 | -- Recursively generate time buckets (max 30, preventing runaway recursion) |
_cpu_topologyis a view provided by the Perfetto stdlib that classifies CPU cores as prime / big / medium / little. The recursive CTE limits to a maximum of 30 buckets to prevent runaway recursion on extremely long traces.
These SQL patterns are encapsulated in YAML Skills, accepting parameters via ${param|default} syntax. Claude doesn’t need to write these complex time interval JOINs itself – it calls invoke_skill with the time range and process name, and the Skill handles executing the predefined SQL and returning structured results.
Perfetto Stdlib Reuse
Perfetto officially maintains a SQL standard library (stdlib) that provides numerous predefined views and functions. For example, the android_frames view encapsulates multi-table join logic for frame rendering data, and the _android_critical_blocking_calls internal table aggregates critical blocking calls. Using these official abstractions directly is far more stable than hand-writing SQL from base tables.
SmartPerfetto’s stdlib integration went through several iterations – one rollback even completely reversed the “direction of optimization”:
Initial phase: Only 4 stdlib modules were preloaded (android.frames.timeline, android.binder, android.startup.startups, android.input), with most Skills’ SQL querying base tables directly. The advantage was fast startup; the downside was Skills everywhere hand-writing multi-table JOINs.
Round 7 (3/15): Expanded the preload set to 22 modules, including
linux.cpu.utilization,android.garbage_collection,android.oom_adjuster,slices.with_context, covering CPU/GC/OOM/slice and other commonly used dimensions. The logic at the time was: batchINCLUDEall commonly used stdlib modules at trace load time, zero overhead for subsequent Skill queries.Rollback to lazy loading (4/1, commit
0afeb60f): The eager preload of 22 modules failed in production – on 200MB+ large traces, concurrentINCLUDEof 22 modules at startup simultaneously occupied trace_processor_shell’s RPC connection, triggeringsocket hang up. The root cause is that trace_processor_shell is a single-threaded SQLite engine, least suited for concurrent INCLUDE – a “batch schema mutation” workload. The final fix was to pull back eager preload, keeping only 3 Tier-0 modules, and switching to lazy + serial loading on first query + max 3 retries:1
2
3
4
5
6
7// workingTraceProcessor.ts
// Tier 0: absolute minimum stdlib modules needed for any analysis to start.
const CRITICAL_STDLIB_MODULES = [
'android.frames.timeline', // 19 skills reference -- frame/jank foundation
'android.startup.startups', // 16 skills reference -- startup foundation
'android.binder', // 22 skills reference -- IPC/blocking foundation
];These 3 were selected by “skill reference count” as the highest-frequency dependencies. Other stdlib modules are now declared on-demand via Skill YAML’s
prerequisitessection or explicitINCLUDE PERFETTO MODULEin SQL when first used.On-demand discovery:
perfettoStdlibScanner.tsscans the Perfetto source directory to automatically discover all available modules, exposed through thelist_stdlib_modulesMCP tool for Claude toINCLUDEnon-preloaded modules on demand.
1 | // perfettoStdlibScanner.ts -- scans perfetto/src/trace_processor/perfetto_sql/stdlib/ |
The lesson from this rollback is the same type as the earlier “more data makes Claude’s output worse” – “preparing all potentially needed resources at system startup” is the intuitively optimal but practically worst strategy. Whether it’s context for the LLM or stdlib for trace_processor, start lazy + load on demand, and only consider prewarming when a real performance bottleneck appears – this is almost always the more stable choice.
A separate lesson: using the stdlib’s android_garbage_collection_events view is far more stable than manually JOINing slice + thread + process tables to query GC events – because GC event slice names vary across Android versions (concurrent mark sweep vs young concurrent copying vs HeapTaskDaemon), and the stdlib has already handled these compatibility issues. But stdlib views have their own pitfalls (column name prefixes, modules not auto-loaded), which are expanded upon in the SQL error-correction section below.
SQL Schema Index: Letting Claude Know What Tables Are Available
Perfetto trace_processor contains hundreds of tables and views, plus stdlib modules – Claude cannot possibly remember them all. The lookup_sql_schema MCP tool provides a search interface for Claude to look up relevant tables, views, and function definitions by keyword.
Under the hood is an index file automatically generated from the Perfetto source code (perfettoSqlIndex.light.json), containing 761 templates, each recording the name, category, type (table/view/function), column definitions, and parameters.
Queries use tokenized matching + score-based ranking:
- Name/category/description containing the full search term -> high score
- Multi-word queries match by token separately -> >= 50% token match required to count as relevant
- Underscore-separated table name segments support prefix matching (“frame_time” matches “frame_timeline_slice”)
- Returns top 30 results
Combined with sqlKnowledgeBase.ts‘s intent mapping, bilingual queries are also supported: user input of “jank” maps to search terms like ['jank', 'frame', 'dropped'], and input of “startup” maps to ['android_startups', 'launch', 'time_to_display']. When multiple intents match simultaneously, scores are additive – for example, querying “startup frame jank” triggers both the startup and jank intents simultaneously, giving the highest scores to templates matching their intersection.
SQL Result Compression
When Claude queries directly via execute_sql, it can pass a summary=true parameter to trigger result compression. The compression logic is implemented in sqlSummarizer.ts:
Numeric columns: Compute min, max, avg, and percentiles (P50 / P90 / P95 / P99), letting Claude understand the data distribution without seeing raw rows.
String columns: Count the top 5 values and their occurrence frequencies, providing the data’s category distribution.
Sample row selection: Select 10 representative sample rows from the complete result. The selection strategy is: if the data contains performance-related columns like dur, latency, jank, count, sort descending by that column and take the top 10 (the most severe data is usually most analytically valuable); if there’s no clear performance metric column, use evenly-spaced sampling.
1 | -- 200 raw result rows (~3000 tokens) compressed to: |
This works in conjunction with the Artifact Store mentioned earlier – the Artifact Store compresses Skill results (data returned by invoke_skill), while the SQL Summarizer compresses results when Claude executes SQL directly. Together, two layers of compression cover both paths through which the Agent obtains data.
SQL Error-Correction Learning
Claude is not fully familiar with Perfetto’s SQL schema and writes incorrect queries. The following are typical errors actually recorded (from logs/sql_learning/error_fix_pairs.json):
Error 1: JOINed on a non-existent column
Perfetto’s slice table has no direct utid column. To associate slice with thread, the intermediate table thread_track is needed: slice.track_id -> thread_track.id -> thread_track.utid -> thread.utid.
1 | -- Error: no such column: s.utid |
Error 2: Ambiguous column names
1 | -- Error: ambiguous column name: name (both slice and process have a name column) |
Error 3: Incorrect understanding of the counter table’s data model
Perfetto’s counter table stores sample points (timestamp + value), not interval data, and has no dur column.
1 | -- Error: no such column: c.dur |
Error 4: stdlib table name / column name pitfalls
Both of these were added in commit 05922e67 – the discovery source was “orphan stderr with no owner”: the analysis had long since ended, but trace_processor was still spewing error logs. Tracing back revealed that the Agent was repeatedly hitting the same pitfalls in dynamic SQL.
1 | -- Error 4a: no such table: cpu_frequency_counters |
Stdlib view authors often use domain-prefixed column names to avoid ambiguous column issues during multi-table JOINs, but Claude defaults to assuming conventional names like ts/dur. This “stdlib’s own naming conventions vs. general SQL conventions” conflict can’t be fully solved automatically through schema introspection – the lookup_sql_schema tool can tell Claude the table exists and what columns it has, but it can’t predict “this time Claude will definitely assume ts.” The only fallback is accumulating error-correction pairs.
The detection and learning mechanism for these errors works as follows: when SQL execution fails, the error message and SQL are temporarily stored; when a subsequent SQL execution succeeds, the system uses Jaccard similarity matching (excluding SQL structural keywords like SELECT/FROM/WHERE, and Perfetto common tokens like utid/dur/slice) to determine whether it’s a corrected version of the same query. The matching threshold is >30%, with a 60-second time window. A successful match generates an error->fix pair that is persisted to disk.
When a new analysis begins, the 10 most recent error-correction pairs are loaded into the System Prompt, so Claude can see these known pitfalls before writing SQL. Error-correction pairs have a 30-day TTL and are automatically cleaned up upon expiration – Perfetto’s SQL schema changes with version updates.
Part 6: The Evolution of the Development Process Itself
This final section steps slightly outside the product itself to discuss the development process. SmartPerfetto was built with AI-assisted development – from the first line of code to now, Claude Code has been the primary programming tool. Looking back over these three months, the way I use AI-assisted development has itself gone through several iterations, with logic similar to SmartPerfetto’s evolution from agentv2 to agentv3.
Stages of AI-Assisted Development
First, a brief explanation of the tools and concepts involved:
- Claude Code: Anthropic’s CLI tool that enables terminal conversations with Claude, where Claude can directly read/write files and execute commands. Throughout development, I ran with
--dangerously-skip-permissions(dangerous mode) and bypass permissions enabled, allowing Claude to autonomously execute file edits, command runs, Git operations, etc. without per-action confirmation. This dramatically improved iteration speed – Claude can continuously execute complete “modify code -> run tests -> check results -> fix -> re-run” cycles without being interrupted by permission dialogs, at the cost of requiring the developer to have sufficient trust in Claude’s operations and perform after-the-fact review. - Claude Agent SDK: Anthropic’s Agent development framework, on which SmartPerfetto’s agentv3 backend is built. The SDK encapsulates multi-turn conversation management, MCP tool-calling loops, automatic context compression (auto-compact), and other capabilities. Developers define the tool set and System Prompt, and the SDK drives Claude to autonomously complete multi-round analysis.
- Plan Mode: Claude Code’s planning mode, where the AI first outputs a structured implementation plan (which files to modify, what to change, order and dependencies), the human reviews and confirms, then the AI executes the code changes.
- SuperPower: The third-party plugin ecosystem for Claude Code, which injects additional capabilities into Claude Code through MCP Servers. In SmartPerfetto development, I used the Chrome DevTools Protocol plugin (directly controlling the browser for screenshots, debugging frontend) and Playwright plugin (automated UI testing and screenshots), among others. These plugins extended Claude Code’s capabilities from code editing to browser interaction and visual verification.
- Codex + Codex MCP: Codex is OpenAI’s code reasoning model. After being integrated into Claude Code via the Codex MCP Server, Claude can directly call Codex for independent review during conversations – send the implementation plan to Codex, which accesses the codebase in read-only mode and provides feedback from three angles: architectural soundness, edge cases, and missed risks. The entire process stays within the Claude Code workflow.
- Agent Team: Claude Code supports launching multiple sub-Agents working in parallel, each with independent tool sets and role definitions.
- Skills / Hooks: Claude Code’s extension mechanisms. Skills are reusable task templates (e.g.,
/commit,/simplify), and Hooks are scripts that automatically execute on specific events (e.g., before/after tool calls).
My Actual Evolution
Stage 1: Direct Conversation
The earliest development approach was describing requirements directly in Claude Code and letting the AI modify code. Similar to pair programming where one person talks and the other writes. At this stage, every change needed line-by-line human review because the AI’s understanding of project context was limited, frequently making local modifications that didn’t align with the overall architecture.
Stage 2: Plan Mode (SuperPower)
After adopting Plan Mode, the workflow became: I describe the requirement -> AI outputs a structured implementation plan (which files to modify, what to change in each, modification order and dependencies) -> I review the plan -> AI executes after confirmation. This shifted the review focus from “examining code line by line” to “reviewing the architecture plan,” noticeably improving efficiency.
Stage 3: Plan Mode (SuperPower) + Peer Review (Codex)
Relying on a single AI to generate plans is prone to blind spots. I began sending the plan to Codex for independent review after the Plan Mode plan was finalized. Codex accesses the codebase in read-only mode and provides feedback from three angles: architectural soundness, edge cases, and missed risks. This effectively introduces a code review step into the AI development workflow.
Most of the 9 rounds of architecture review mentioned earlier in the article went through this process. Taking the Perfetto Stdlib integration as an example (Round 7, March 15), Codex reviewed 3 rounds, raising a cumulative 36 feedback points, including issues I had missed in the plan such as the stdlib module preloading strategy and the Schema Index cache invalidation mechanism.
Stage 4: Harness-ified Engineering Pipeline
By the later stages, the development workflow had become:
1 | 1. I determine requirements and architectural direction |
In this workflow, human involvement is concentrated at Step 1 (requirements and architectural decisions) and Step 4 (evaluating review feedback). Code details, test execution, and formatting cleanup are handled by the engineering pipeline.
Correspondence with SmartPerfetto’s Architecture
Looking back, my AI-assisted development workflow and SmartPerfetto’s Agent analysis workflow are structurally similar:
| Dimension | SmartPerfetto Agent Analysis | My AI-Assisted Development |
|---|---|---|
| Intent Understanding | Scene Classifier identifies the scene | I determine the requirement direction |
| Strategy Injection | .strategy.md injects analysis methodology | Plan Mode outputs implementation plan |
| Execution | MCP tool calls for SQL/Skills | Claude Code executes code changes |
| Quality Verification | 3-layer Verifier (heuristic + Plan + Haiku) | Regression tests + Codex review |
| Correction Loop | Correction Prompt has Claude revise | Test failure -> analyze -> fix -> re-run |
| Cross-session Learning | Pattern Memory + SQL error-correction | CLAUDE.md rule accumulation + memory system |
Both systems evolved in the same direction: human involvement shifted from the execution layer up to the decision layer. SmartPerfetto went from a fixed pipeline (humans define every step) to autonomous reasoning (humans define goals and constraints); my development approach went from line-by-line review to reviewing architecture plans.
This is not coincidental – the core of Harness Engineering is building sufficient engineering infrastructure (tests, verification, review) so that humans can trust the AI’s execution results and focus their attention on higher-level decisions.
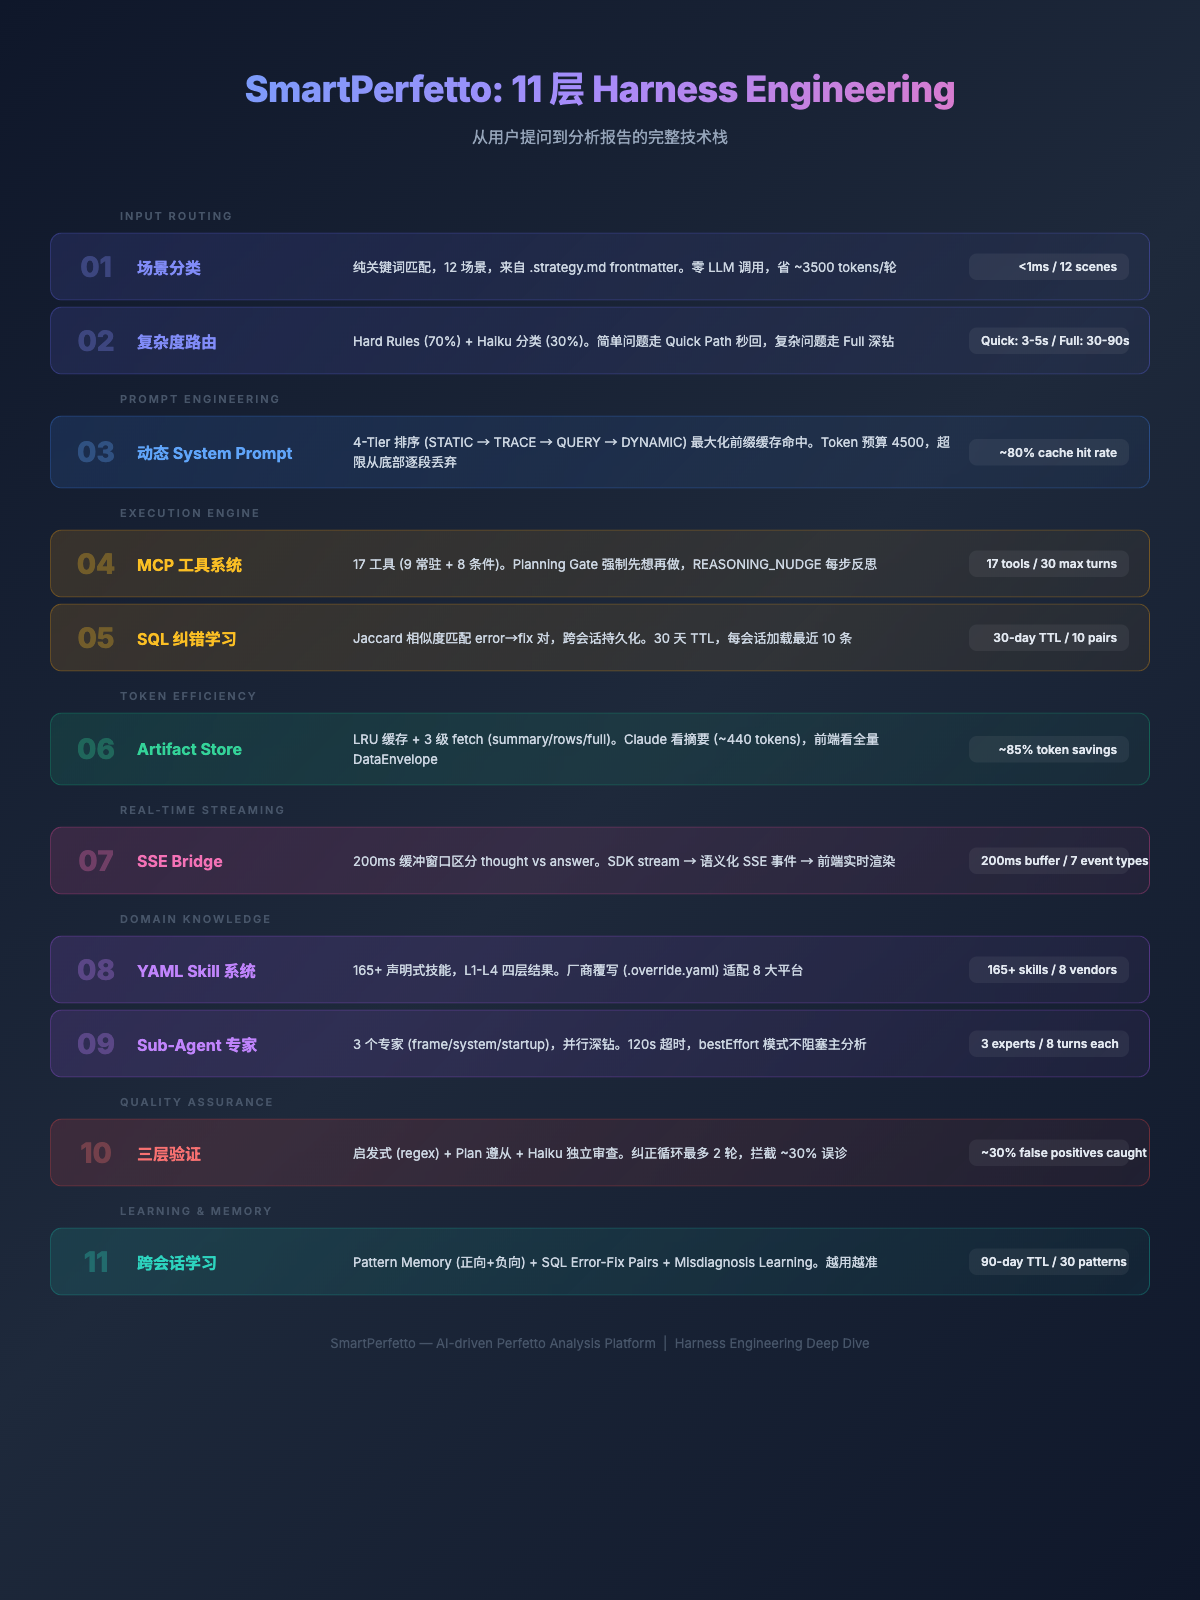
The diagram below summarizes SmartPerfetto’s complete Harness Engineering landscape – from input routing to cross-session learning:
Conclusion
Looking back over three months of iteration, from agentv2’s 13-step fixed pipeline to agentv3’s autonomous reasoning, from ~30% misjudgment rate to three-layer verification, from a 15000-token System Prompt to 4500-token on-demand loading – every change was driven by a concrete failure experience.
After completing this project, I have two takeaways about AI Agent application development.
The first is: the bulk of the work is not in the LLM API calls themselves, but in the engineering infrastructure surrounding the LLM:
- How should the System Prompt be organized so the LLM doesn’t confuse context? -> Scene classification + on-demand loading + token budget
- How do you control the LLM’s execution order so it thinks before acting? -> Planning Gate + hypothesis submission
- How much data should be returned to the LLM? -> Artifact Store: give summaries, not full data
- How do you detect and intercept the LLM’s domain misjudgments? -> Three-layer verification + correction loop
- How do you ensure data query precision? -> YAML Skills (declarative SQL) + SQL error-correction learning
- How do you adapt to different rendering architectures and chip platforms? -> Architecture detection + vendor overrides
The second takeaway is: the Agent’s “environment” matters far more than prompt wording. In agentv3’s early days, I spent considerable time adjusting System Prompt wording and formatting. I later discovered that what truly affects Agent output quality is not how the prompt is written, but what tools it’s given, what data is returned, and what constraints are imposed. Three concrete examples:
- After adding
submit_plangating, Claude stopped making directionless SQL queries (previously it would make purposeless queries likeSELECT * FROM slice->SELECT * FROM thread), and analysis paths became organized - After adding ArtifactStore, the data Claude received dropped from 200 rows to summary references, and reasoning focus noticeably improved
- After adding the
lookup_knowledgetool, root cause analysis depth progressed from “main thread blocked” to “Binder counterpart system_server had delayed response due to CPU being scheduled to a little core”
None of these improvements were achieved through adjusting prompt text – they were achieved by changing the Agent’s tool set and data environment. If I had one piece of advice for engineers building AI Agent applications, it would be: invest your effort in tool design and data control, not prompt engineering.
Future Directions
The current SmartPerfetto is an interactive analysis tool that is far from ready for release, so it remains closed-source for now, developed solely by me. Future engineering directions include:
- Deep vendor integration – The current 8 vendors’
.override.yamlonly covers core Skills. More vendor-specific metrics (Qualcomm Snapdragon Profiler data, MediaTek MAGT signals, Samsung GameOptimizing service) need to be integrated one by one. - CI integration + batch processing – Moving from interactive analysis to automatically analyzing performance regressions for each build in CI pipelines. Including unattended mode, result comparison against baselines, and automatic regression tagging.
- E2E verification framework – The current 6-trace regression test verifies the correctness of Skill data output, but does not verify the quality of Agent conclusions. An E2E verification system is needed: given a trace + known root cause -> check whether the Agent correctly identified it.
- Codebase integration – Mapping slices/functions in the trace back to source code locations, combined with git blame to locate the change that introduced the issue.
This tool will be open-sourced at the appropriate time (since major companies are all building their own internally, open-sourcing it would allow everyone to share ideas and develop together). Those interested in progress updates are welcome to add me on WeChat to join the group chat or direct message.