Series Catalog:
- Overview of Android Performance Patterns
- Android Performance Patterns: Render Performance
- Android Performance Patterns: Understanding Overdraw
- Android Performance Patterns: Understanding VSYNC
- Android Performance Patterns: Profile GPU Rendering
On January 6, 2015, Google officially released a series of short videos about Android performance optimization titled Android Performance Patterns. This series is available on YouTube.
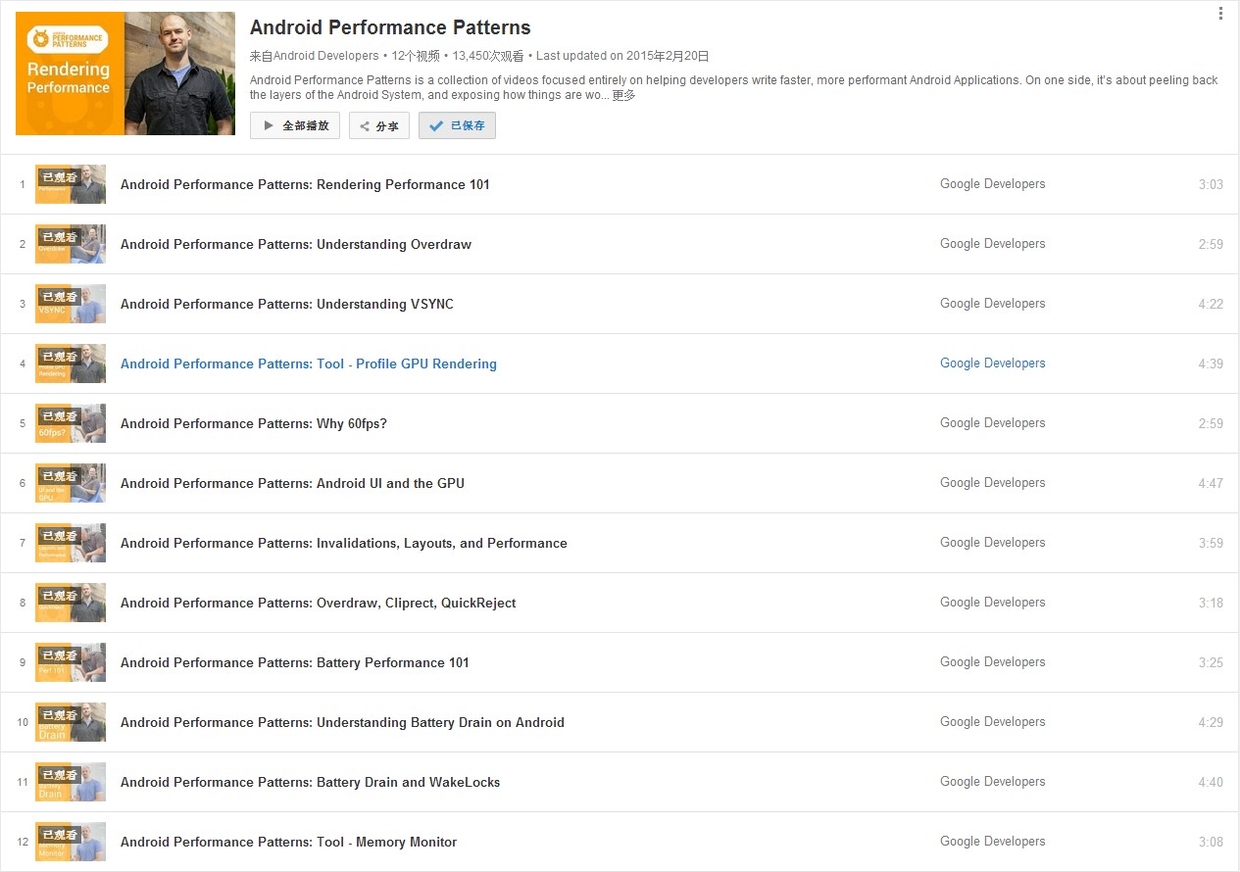
Official Introduction:
Android Performance Patterns is a collection of videos focused entirely on helping developers write faster, more performant Android Applications. On one side, it’s about peeling back the layers of the Android System, and exposing how things are working under the hood. On the other side, it’s about teaching you how the tools work, and what to look for in order to extract the right perf out of your app.
But at the end of the day, Android Performance Patterns is all about giving you the right resources at the right time to help make the fastest, smoothest, most awesome experience for your users. And that’s the whole point, right?
In short, it’s a series of videos explaining Android performance. These videos are very short, typically between 3 to 5 minutes. The speakers talk very fast, which was quite a challenge for non-native listeners before subtitles were available. The good news is that these videos now have full subtitles.
While the videos are short, they are packed with information. A single sentence mentioned by the speaker might require hours of research to understand the underlying principle or how to use a specific debugging tool. This means the series doesn’t directly teach you “how to optimize your app” step-by-step; rather, it tells you what you need to know about Android performance so that you know which tools to use, what steps to take, and what goals to aim for.