

This is the first article in the series on using the MAT tool. This series consists of three articles, detailing how to use MAT to analyze memory issues, whether they are Java application memory issues or Android application memory issues:
- Android Memory Optimization (1) - Getting Started with MAT
- Android Memory Optimization (2) - Advanced MAT Usage
- Android Memory Optimization (3) - Opening Original Bitmap Images in MAT
Introduction to MAT
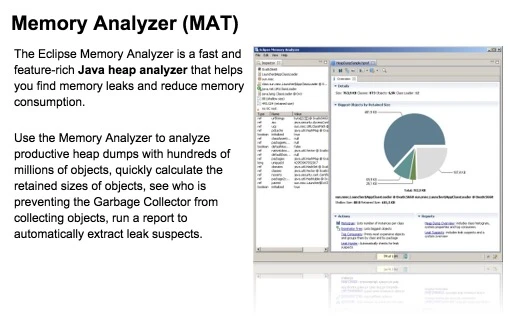
What is MAT?
MAT (Memory Analyzer Tool), a memory analysis tool based on Eclipse, is a fast and feature-rich JAVA heap analysis tool. It helps us find memory leaks and reduce memory consumption. Using the memory analysis tool to analyze numerous objects, quickly calculate the size occupied by objects in memory, see who is preventing the garbage collector from reclaiming, and visually view the objects that may cause this result through reports.
Of course, MAT also has an independent version that doesn’t rely on Eclipse, but this version requires converting the file generated by DDMS before it can be opened in the standalone version of MAT when debugging Android memory. However, the Android SDK already provides this Tool, so it is also very convenient to use.