
The tenth article in the Perfetto series focuses on Binder, Android’s core Inter-Process Communication (IPC) mechanism. Binder carries most interactions between system services and apps, and is often where latency and jank originate. This article uses signals from linux.ftrace (binder tracepoints + sched), thread_state, and ART Java monitor contention (via atrace dalvik) to provide a practical workflow for diagnosing transaction latency, thread-pool pressure, and lock contention.
This is the ninth article in the Perfetto series, focusing on CPU information analysis in Perfetto. Perfetto provides far superior data visualization and analysis capabilities compared to Systrace. Understanding CPU-related information is the foundation for locating performance bottlenecks and analyzing power consumption issues.
The goal of this series is to examine the overall operation of the Android system from a brand new graphical perspective through the Perfetto tool, while also providing a new way to learn the Framework. Perhaps you’ve read many source code analysis articles but always feel confused by the complex call chains or can’t remember specific execution flows. Through Perfetto, by visualizing these processes, you may gain a deeper and more intuitive understanding of the system.
This is the eighth article in the Perfetto series, providing an in-depth introduction to the Vsync mechanism in Android and its representation in Perfetto. The article will analyze how the Android system performs frame rendering and composition based on Vsync signals from Perfetto’s perspective, covering core concepts such as Vsync, Vsync-app, Vsync-sf, and VsyncWorkDuration.
With the popularization of high refresh rate screens, understanding the Vsync mechanism has become increasingly important. This article uses 120Hz refresh rate as the main narrative thread to help developers understand the working principles of Vsync in modern Android devices, and how to observe and analyze Vsync-related performance issues in Perfetto.
Note: This article is based on the public evolution from Android 13 to Android 16. Code snippets are aligned to AOSP main signatures, with
...used in a few places to omit non-critical branches. Always verify against your target branch.
This is the seventh article in the Perfetto series, focusing on MainThread (UI Thread) and RenderThread, the two most critical threads in any Android application. This article will examine the workflow of MainThread and RenderThread from Perfetto’s perspective, covering topics such as jank, software rendering, and frame drop calculations.
As Google officially promotes Perfetto as the replacement for Systrace, Perfetto has become the mainstream choice in performance analysis. This article combines specific Perfetto trace information to help readers understand the complete workflow of MainThread and RenderThread, enabling you to:
- Accurately identify key trace tags: Understand the roles of critical threads like UI Thread and RenderThread
- Understand the complete frame rendering process: Every step from Vsync signal to screen display
- Locate performance bottlenecks: Quickly find the root cause of jank and performance issues through trace information
This is the sixth article in the Android Perfetto series, mainly introducing knowledge related to 120Hz refresh rate on Android devices. Nowadays, 120Hz has become standard configuration for flagship Android phones. This article will discuss the advantages and challenges brought by high refresh rates, and analyze the working principle of 120Hz from a system perspective.
Over the past few years, the refresh rate of mobile device screens has evolved from 60Hz to 90Hz, and then to the now common 120Hz. This improvement not only brings smoother visual experience, but also puts forward new requirements for system architecture and application development. Through the Perfetto tool, we can more intuitively understand the process and performance of frame rendering on high refresh rate devices.
This article introduces Choreographer, a class that App developers may not frequently encounter but is critically important in the Android Framework rendering pipeline. We will cover the background of its introduction, a brief overview, partial source code analysis, its interaction with MessageQueue, its application in APM (Application Performance Monitoring), and some optimization ideas for Choreographer by mobile phone manufacturers.
The introduction of Choreographer is mainly to cooperate with Vsync to provide a stable Message processing timing for upper-layer application rendering. When the Vsync signal arrives, the system controls the timing of each frame’s drawing operation by adjusting the Vsync signal cycle. Currently, the screen refresh rate of mainstream mobile phones has reached 120Hz, which means refreshing once every 8.3ms. The system adjusts the Vsync cycle accordingly to match the screen refresh frequency. When each Vsync cycle arrives, the Vsync signal wakes up the Choreographer to execute the application’s drawing operation. This is the main purpose of introducing Choreographer. Understanding Choreographer can also help application developers deeply understand the operating principle of each frame, and at the same time deepen their understanding of core components such as Message, Handler, Looper, MessageQueue, Input, Animation, Measure, Layout, and Draw. Many APM (Application Performance Monitoring) tools also utilize the combination mechanisms of Choreographer (via FrameCallback), FrameMetrics/gfxinfo framestats (internally backed by FrameInfo), MessageQueue (via IdleHandler), and Looper (via custom MessageLogging) for performance monitoring. After deeply understanding these mechanisms, developers can conduct performance optimization more specifically and form systematic optimization ideas.
This is the fourth article in the Perfetto series, explaining how to use trace_processor_shell to open large files exceeding 2GB locally. In actual problem analysis, we often encounter very large Trace files (greater than 2GB) that cannot be opened by directly dragging them into ui.perfetto.dev due to browser memory limitations. In this case, we need to use the trace_processor_shell tool provided by the official to open large files locally.
With Google announcing the deprecation of the Systrace tool and the release of Perfetto, Perfetto has basically replaced Systrace in my daily work. At the same time, major manufacturers like OPPO and Vivo have also switched from Systrace to Perfetto. Many friends who are new to Android performance optimization feel a headache when facing the dazzling interface and complex functions of Perfetto. They hope that I can present those previous Systrace articles using Perfetto.
This is the third article in the Android App ANR series, focusing on real-world ANR cases. The series includes:
This is the second article in the Android App ANR series, focusing on ANR analysis methodology and key logs. The series includes:
This is the first article in the Android App ANR series, mainly analyzing the design philosophy of Android ANR from a system perspective. The series directory is as follows:
This is the third article in the Perfetto series. The first two articles introduced what Perfetto is and how to capture Perfetto Trace. This article simply introduces how to look at the complex Perfetto information after opening Perfetto Trace on the web side.
With Google announcing the deprecation of the Systrace tool and the release of Perfetto, Perfetto has basically replaced Systrace in my daily work. At the same time, major manufacturers like OPPO and Vivo have also switched from Systrace to Perfetto. Many friends who are new to Android performance optimization feel a headache when facing the dazzling interface and complex functions of Perfetto. They hope that I can present those previous Systrace articles using Perfetto.
The previous article Android Perfetto Series 1: Introduction to Perfetto introduced what Perfetto is. This article provides a brief introduction to Perfetto capture.
With Google announcing the deprecation of the Systrace tool and the release of Perfetto, Perfetto has basically replaced Systrace in my daily work. At the same time, major manufacturers like OPPO and Vivo have also switched from Systrace to Perfetto. Many friends who are new to Android performance optimization feel a headache when facing the dazzling interface and complex functions of Perfetto. They hope that I can present those previous Systrace articles using Perfetto.
This is the first article in the Perfetto series. It mainly provides a brief introduction to the Perfetto tool, including its history, development, and what Perfetto can do.
With Google announcing the deprecation of the Systrace tool and the release of Perfetto, Perfetto has basically replaced Systrace in my daily work. At the same time, major manufacturers like OPPO and Vivo have also switched from Systrace to Perfetto. Many friends who are new to Android performance optimization feel a headache when facing the dazzling interface and complex functions of Perfetto. They hope that I can present those previous Systrace articles using Perfetto.
With Google announcing the deprecation of Systrace in favor of Perfetto, Perfetto has essentially replaced Systrace in my daily workflow. Major manufacturers like OPPO and vivo have also transitioned to Perfetto. Many developers new to Android performance optimization find Perfetto’s complex interface and features overwhelming, which is why I’ve decided to re-present my previous Systrace articles using Perfetto.
Currently, the “Knowledge Planet” (ZSXQ) is a paid community. The income mainly goes towards blog server costs and buying cat food for my cat, Douzi. It also serves as my motivation to keep updating the blog. If you find the content helpful, consider joining to support the work! Thank you very much!
The community is named The Performance, a circle for sharing Android performance optimization. I am the host—an Android performance developer at a top-tier smartphone manufacturer in China with years of experience in performance, power consumption analysis, and case studies. This community provides a one-stop-shop for performance knowledge, covering fundamentals, methodologies, tools, and valuable real-world case analyses.
[!NOTE]
This article was originally written by Yingyun for my Knowledge Planet. Since the Planet has closed, I am publishing this series on OS performance design here.Yingyun is a veteran performance optimization expert with deep insights into system-level tuning, having worked at several major smartphone manufacturers. He is currently active in our community. If you have any questions or feedback, feel free to join our WeChat group.
1. The Genesis
This starts a new series exploring the various considerations in OS architectural design. In reality, these principles apply to the design of any large-scale software.
These views are my own and carry a subjective perspective. I welcome different viewpoints and hope that through their collision, we can all reach a deeper understanding of the field.
A while ago, a certain App became very popular because it exploited Android system vulnerabilities to gain system permissions and did a lot of things. I wanted to see what these Apps did after gaining system permissions by exploiting system vulnerabilities, hence this article. Due to hasty preparation, some Code was not looked at carefully. Interested students can research it themselves and discuss more. The corresponding articles and Code links are below:
- Deep Blue Insight: The Most “Unpardonable” Vulnerabilities of 2022
- XXX apk embedded privilege escalation code and dynamic delivery dex analysis
- History of Android Deserialization Vulnerability Attack and Defense
Regarding how this App obtained these system permissions, History of Android Deserialization Vulnerability Attack and Defense explains it very clearly, so I won’t repeat it here. I am not a security expert either, but I suggest everyone read this article a few times.
On Friday, March 25, 2022, at 9 PM, “The Performance” Knowledge Planet held its first online “Tea Talk.” We were joined by 3 planet hosts, 5 guest experts, and over 50 members. Thank you all for coming!
While we expected to wrap up in an hour, we ended up chatting for over two and a half hours—our introductions alone took an hour! Our community spans the entire Android ecosystem: from App-tier experts to System-level gurus at major smartphone manufacturers, silicon companies, and EV startups. Each introduction naturally evolved into deep dives into industry trends and company-specific insights.
We plan to hold these regularly with clearer themes and more guests. To protect the privacy of our members, we did not record the session. The following text is a reconstructed summary of our discussion.
This is the third article in the “Systrace Thread CPU State Analysis Tips” series. It focuses on the Sleep and Uninterruptible Sleep states in Systrace—their causes, troubleshooting, and optimization. These states are major performance inhibitors and are often difficult to diagnose without a systematic approach.
The goal of this series is to use Systrace to view the Android system from a different perspective and to learn the Framework through visualization. While reading Framework source code can be difficult to remember, seeing the flow in Systrace can lead to deeper understanding. You can find the complete Systrace Basics and Action Series here.
This is the second article in the “Systrace Thread CPU State Analysis Tips” series. It analyzes the causes of the “Running” state in Systrace and provides optimization strategies for when Running segments are excessively long.
The goal of this series is to use Systrace to view the Android system from a different perspective and to learn the Framework through visualization. While reading Framework source code can be difficult to remember, seeing the flow in Systrace can lead to deeper understanding. You can find the complete Systrace Basics and Action Series here.
This is the first article in the “Systrace Thread CPU State Analysis Tips” series. It analyzes the causes of the “Runnable” state in Systrace and provides optimization strategies for when Runnable segments are excessively long.
The goal of this series is to use Systrace to view the Android system from a different perspective and to learn the Framework through visualization. While reading Framework source code can be difficult to remember, seeing the flow in Systrace can lead to deeper understanding. You can find the complete Systrace Basics and Action Series here.

In his book Hackers & Painters, Paul Graham asserted, “The disparity in the efficiency of languages is becoming more pronounced, hence the rising importance of profilers. Currently, performance analysis isn’t given the attention it deserves. Many still seem to hold onto the belief that the key to accelerating program execution lies in developing compilers that generate faster code. As the gap between code efficiency and machine performance widens, it will become increasingly apparent that enhancing the execution speed of application software hinges on having a good profiler to guide program development.” by Paul Graham, Hackers & Painters
A Google search for “Android optimization tools” yields an abundance of related content. The issue with these results is that they either contain highly repetitive content or directly explain usage methods. Rarely do they introduce a holistic architecture, inadvertently instilling a misguided belief of “one tool fixes all”. Drawing from the extensive experience of my team, I can assert that in the realm of performance analysis, no such magic bullet tool exists. Tools evolve, old problems re-emerge in new forms, and without mastering core logic, one remains on the technological surface.
This article first systematically untangles the observability technology in performance analysis, encompassing data types, capture methods, and analysis techniques. Subsequently, we introduce the “big three” analysis tools provided by Google. The aim is to impart immutable theoretical knowledge and corresponding tools available in the Android environment to the reader. This wealth of information can facilitate a more direct application of predecessors’ experiences, circumventing unnecessary detours.

In his book
, Paul Graham states: “The execution efficiency gap between different programming languages is becoming increasingly large, so profilers are becoming more important. Currently, performance profiling is not receiving enough attention. Many people still believe that the key to improving program running speed is developing compilers that can generate faster code. The gap between code efficiency and machine performance is continuously increasing, and we will increasingly clearly see that the key to improving application software running speed is having a good performance profiler to guide program development.”
By Paul Graham — Hackers and Painters
If you Google search “Android optimization tools,” you’ll find many related contents. Their problem is that content is highly repetitive, or they directly explain usage methods. They rarely introduce overall architecture, which can easily make you form the erroneous cognition of “one tool handles everything.” Based on my team’s years of experience, in the performance profiling field, such a silver bullet-level tool does not exist. Tools are evolving, old problems will appear in new forms. If you don’t master the core logic, you’ll always float on the surface of technology.
This article will systematically organize observable technologies in performance profiling, covering three parts of content: data types, capture methods, and analysis methods. After that, we’ll introduce Google’s “Big Three” analysis tools. The goal is to let you understand immutable theoretical knowledge and corresponding tools available in the Android environment, so you can take fewer detours and directly reuse predecessors’ experience.
2021 has passed. Taking advantage of the New Year holiday, I’d like to look back at the year. This will be a casual review—writing whatever comes to mind. 2021 for me was marked by becoming a father, changing jobs (including a boring period of working from home), and making new friends. Overall, it was a pretty good year.
However, in terms of personal growth, I feel like I might have stagnated or even regressed, which is a bit alarming. Learning is like rowing upstream; if you don’t move forward, you fall back. 2022 needs to be a year of deep cultivation. I hope to progress together with everyone reading this.
I’ve also tallied some data related to my technical sharing, shared my income from these platforms, and listed some hardware and software I recommend. Feel free to take a look.
Recently, I read a new book: Building Smooth Android Apps (JD link: https://item.jd.com/10035215362170.html). I bought it because of the title, and after reading it, I felt it was necessary to write an article so that colleagues who haven’t bought it yet can understand what it’s about.
My personal suggestion is: if you are an experienced developer, I don’t recommend buying it. This book doesn’t go into much depth on principles and doesn’t offer a comprehensive overview of Android smoothness. If you are a beginner, it’s decent for broadening your horizons and identifying gaps in your knowledge, but it’s still a bit lacking for a deep understanding of Android smoothness.
I say this because the book doesn’t focus much on performance or smoothness. It lacks deep theoretical parts. Instead, a large portion is dedicated to static code analysis, using Android Studio Profiler, App architecture, app stay-alive techniques, network performance optimization, APK size optimization, app power consumption, etc. These topics are covered briefly and at a shallow level.
Android 12 has been officially released, and the source code is now available on the AOSP website. This article will guide you through the process of downloading and compiling the latest Android 12 code.
Compiling the code locally offers several advantages:
- Direct Debugging: You can flash the build onto a physical device for local debugging and import the code into Android Studio.
- Userdebug Builds: You can compile a
userdebugversion, which allows forrootandremountaccess. This is invaluable for debugging both the system and apps, as it reveals information hidden in standarduserbuilds—useful for competitive analysis and behavioral studies. - Deep Learning: It facilitates a deeper understanding of Android source code by allowing you to enable system-level debug logs, add your own logs, or even modify system workflows.
When discussing Android performance, Jank, Responsiveness, and ANR are usually grouped together because their causes are similar. They are simply categorized based on severity: Jank, Slow Response, and ANR. We can define “Broad Jank” to include all three. If a user reports that a phone or App is “stuttering,” they are likely referring to Broad Jank, and we must identify which specific issue is occurring.
If it’s stuttering during animation or list scrolling, we define it as Narrow Jank (referred to as Jank). If it’s slow app startup, slow screen wake-up, or slow scene switching, we define it as Slow Responsiveness (referred to as Slow). If it’s an ANR, it’s an Application Not Responding issue. Each situation requires different analysis and resolution methods.
Furthermore, within Apps or manufacturers, Jank, Responsiveness, and ANR have individual metrics like Frame Drop Rate, Startup Speed, and ANR Rate. Mastering the analysis and optimization of these issues is crucial for developers.
This is the third article in the Responsiveness series, focusing on extended knowledge when using Systrace to analyze app responsiveness, including startup speed testing, log interpretation, state analysis, and third-party startup libraries.
When discussing Android performance, Jank, Responsiveness, and ANR are usually grouped together because their causes are similar. They are simply categorized based on severity: Jank, Slow Response, and ANR. We can define “Broad Jank” to include all three. If a user reports that a phone or App is “stuttering,” they are likely referring to Broad Jank, and we must identify which specific issue is occurring.
If it’s stuttering during animation or list scrolling, we define it as Narrow Jank (referred to as Jank). If it’s slow app startup, slow screen wake-up, or slow scene switching, we define it as Slow Responsiveness (referred to as Slow). If it’s an ANR, it’s an Application Not Responding issue. Each situation requires different analysis and resolution methods.
Furthermore, within Apps or manufacturers, Jank, Responsiveness, and ANR have individual metrics like Frame Drop Rate, Startup Speed, and ANR Rate. Mastering the analysis and optimization of these issues is crucial for developers.
This is the second article in the Responsiveness series, using Android App Cold Start as an example to explain how to use Systrace for analysis.
When discussing Android performance, Jank, Responsiveness, and ANR are usually grouped together because their causes are similar. They are simply categorized based on severity: Jank, Slow Response, and ANR. We can define “Broad Jank” to include all three. If a user reports that a phone or App is “stuttering,” they are likely referring to Broad Jank, and we must identify which specific issue is occurring.
If it’s stuttering during animation or list scrolling, we define it as Narrow Jank (referred to as Jank). If it’s slow app startup, slow screen wake-up, or slow scene switching, we define it as Slow Responsiveness (referred to as Slow). If it’s an ANR, it’s an Application Not Responding issue. Each situation requires different analysis and resolution methods.
Furthermore, within Apps or manufacturers, Jank, Responsiveness, and ANR have individual metrics like Frame Drop Rate, Startup Speed, and ANR Rate. Mastering the analysis and optimization of these issues is crucial for developers.
This is the first article in the Responsiveness series, focusing on theoretical knowledge, including an overview of performance engineering, key responsiveness concepts, and analysis methodologies.
Different people have different understandings of smoothness (jank/dropped frames) and different perceptions of jitter thresholds. Therefore, before starting this series, it is necessary to clarify the content to avoid misunderstandings. Here are some basic explanations:
- For mobile users, jank encompasses many scenarios: dropped frames when scrolling lists, excessive white screen during app startup, slow screen wake-up when pressing the power button, unresponsive interface followed by a crash, no response when clicking an icon, incoherent window animations, lagging touch response, or stuttering when entering the desktop after a reboot. These scenarios differ slightly from what developers understand as “jank.” Developers categorize these more finely, which is a cognitive gap between developers and users that must be noted when handling feedback from users or testers.
- For developers, the above scenarios fall into three major categories: Smoothness (dropped frames in lists, incoherent animations, stuttering desktop entry), Responsiveness (long startup white screens, slow screen wake-up, lagging touch), and Stability (unresponsive interface/crashes, no response to icon clicks). This classification is used because each category requires different analysis methods and steps. Quickly identifying the category is crucial.
- Technically, Smoothness, Responsiveness, and Stability (ANR) all feel like “jank” to users because their underlying principles are identical: the main thread’s Message exceeds its processing deadline. They are simply categorized by different timeout thresholds. Understanding these problems requires knowledge of basic system operation mechanisms, which this article will introduce.
- This series primarily analyzes smoothness-related issues. Responsiveness and stability will be covered in dedicated articles. Understanding smoothness first will make analyzing responsiveness and stability much easier.
- This series focuses on using Systrace (Perfetto) for analysis. Systrace is our entry point because many factors affect smoothness—some within the app itself and others within the system. Systrace (Perfetto) provides a holistic view of the system’s operation during the problem, helping us initially pinpoint the root cause.
Different people have different understandings of smoothness (jank/dropped frames) and different perceptions of jitter thresholds. Therefore, before starting this series, it is necessary to clarify the content to avoid misunderstandings and help everyone approach these articles with the right questions. Here are some basic explanations:
- For mobile users, jank encompasses many scenarios: dropped frames when scrolling lists, excessive white screen during app startup, slow screen wake-up when pressing the power button, unresponsive interface followed by a crash, no response when clicking an icon, incoherent window animations, lagging touch response, or stuttering when entering the desktop after a reboot. These scenarios differ slightly from what developers understand as “jank.” Developers categorize these more finely, which is a cognitive gap between developers and users that must be noted when handling feedback from users or testers.
- For developers, the above scenarios fall into three major categories: Smoothness (dropped frames in lists, incoherent animations, stuttering desktop entry), Responsiveness (long startup white screens, slow screen wake-up, lagging touch), and Stability (unresponsive interface/crashes, no response to icon clicks). This classification is used because each category requires different analysis methods and steps. Quickly identifying the category is crucial.
- Technically, Smoothness, Responsiveness, and Stability (ANR) all feel like “jank” to users because their underlying principles are identical: the main thread’s Message exceeds its processing deadline. They are simply categorized by different timeout thresholds. Understanding these problems requires knowledge of basic system operation mechanisms, which this article will introduce.
- This series primarily analyzes smoothness-related issues. Responsiveness and stability will be covered in dedicated articles. Understanding smoothness first will make analyzing responsiveness and stability much easier.
- This series focuses on using Systrace (Perfetto) for analysis. Systrace is our entry point because many factors affect smoothness—some within the app itself and others within the system. Systrace (Perfetto) provides a holistic view of the system’s operation during the problem, helping us initially pinpoint the root cause.
A fellow developer shared a Weibo post (https://weibo.com/1808884742/IApbpEVQr) where blogger @王波粒 noticed a peculiar phenomenon on the Mate 30 Pro. I highly recommend watching the video first.
The video’s description and some of the comments aren’t quite technically accurate. Here’s a summary of what’s actually happening: On Huawei phones, the Weibo app continues to load images smoothly while scrolling the main feed. However, the exact same version of the Weibo client on other phones waits until scrolling completely stops before it begins loading images.
This post looks at this phenomenon from a technical perspective, explores why it happens, and discusses what we can learn from it.
Around 1:30 AM on May 23, 2020, a large number of Samsung phone users in China experienced severe issues including freezes, infinite reboots, and forced entries into Recovery Mode. Improper handling by users led to data loss, and the incident quickly became a trending topic on social media platforms like Zhihu, with service centers overwhelmed.
Social media responses ranged from frustration to anger, with some comparing the incident to the Note 7 battery disaster, “charging-gate,” or “green-screen-gate.” Some predicted Samsung would be forced out of the Chinese market. People lost job offers due to missed calls, others lost valuable data, and some even resorted to smashing their devices in frustration.
As an Android developer, I am not here to pile on Samsung. My goal is to uncover the root cause of this incident and see what we can learn from it. Since it’s a technical failure in the Android system, it’s essential to analyze it from a technical perspective.
The release of MIUI 12 brought a long-standing battle between App developers and ROM developers into the public eye, revealing the intricate details of this technical tug-of-war. As the saying goes, “While the demon rises a foot, the path rises ten feet.” ROM developers, with their higher system-level permissions, generally hold the upper hand. App developers, however, are not easily deterred, employing various “black technologies” for background persistence and cross-app wakeups. Even Google has stepped in to mediate, establishing rules to regulate behavior for both parties. This competition is arguably healthy; a total victory by either side would inevitably lead to stagnation or the loss of useful functionality.
However, the victims of this struggle are undoubtedly the consumers. If App developers succeed, phones become cluttered with persistent background processes that hog CPU and memory. Conversely, if ROM developers are too aggressive, the app experience suffer—a pain well-known to many Android developers.
As discussed later in this article, most smartphone manufacturers have developed their own strategies to handle auto-starts and associated starts. Beyond the technical struggle, there’s the issue of privacy. Baidu’s Robin Li once remarked that “Chinese people are more open about privacy and relatively less sensitive. If they can trade privacy for convenience, safety, or efficiency, they are willing to do so in many cases.” Consider the convenience of copying a phrase in WeChat and having Taobao automatically open to the corresponding item. It’s helpful, isn’t it? But do we really want every app peering into our clipboards?
This is the fifth article in the Systrace series, primarily providing a brief introduction to the workflow of SurfaceFlinger. It covers several important threads within SurfaceFlinger, including Vsync signal interpretation, app buffer display, and jank detection. Since Vsync has already been covered in Systrace Basics - Vsync Explained and Detailed Explanation of Android Rendering Mechanism Based on Choreographer, it won’t be discussed in detail here.
The purpose of this series is to view the overall operation of the Android system from a different perspective using Systrace, while also providing an alternative angle for learning the Framework. Perhaps you’ve read many articles about the Framework but can never remember the code, or you’re unclear about the execution flow. Maybe from Systrace’s graphical perspective, you can gain a deeper understanding.
On Medium, @MindOrks published a 2020 Android Developer Learning Path. Given that some readers may have difficulty accessing the original content, I am sharing it here combined with my own 2020 learning plan for your reference.
The original article is quite simple, mostly listing knowledge points without much explanation. I have added brief introductions for each point and included some additional topics based on my own understanding. This is for your reference only.
This article is primarily for Android developers. If you are a beginner, it will help you find a learning path. If you are an experienced developer, it can help you identify gaps in your knowledge. If you have any other suggestions, feel free to leave a message.
Below is my 2020 reading list. Everything recorded here has been finished - technical books are not included since it’s hard to define when they’re “finished.”
I prefer reading history-related books. Among them, The Siege of Kaifeng was very uncomfortable to read - the weak have no diplomacy, it’s truly realistic; Bad Kids lives up to its name, personally I feel it’s much better than the TV series; Rework 2 and Rework 3 are work-related, covering remote work and work methods, consistent with the 2020 trend of working from home - recommended for white-collar programmers; My Last Diet Book systematically and professionally discusses weight loss knowledge, very useful for someone like me who’s trying to lose weight; finally, Blades of the Guardians is already a classic in Chinese comics - I’ll definitely buy a physical set for collection once it’s complete (same for Attack on Titan).
Didn’t read much in 2020. Need to invest more in this area in 2021. Read + Record + Summarize - reading notes will be added later.
This is the twelfth article in the Systrace series, primarily providing a brief introduction to the CPU information area (Kernel) in Systrace. It covers how to view CPU-related information output by the Kernel module, including CPU frequency, scheduling, frequency locking, and core locking.
The purpose of this series is to view the overall operation of the Android system from a different perspective using Systrace, while also providing an alternative angle for learning the Framework. Perhaps you’ve read many articles about the Framework but can never remember the code, or you’re unclear about the execution flow. Maybe from Systrace’s graphical perspective, you can gain a deeper understanding.
This is the eleventh article in the Systrace series, providing a brief introduction to Triple Buffer within Systrace. It covers how to identify jank in Systrace, perform preliminary localization and analysis, and explains the impact of Triple Buffer on performance.
The purpose of this series is to view the overall operation of the Android system from a different perspective using Systrace, while also providing an alternative angle for learning the Framework. Perhaps you’ve read many articles about the Framework but can never remember the code, or you’re unclear about the execution flow. Maybe from Systrace’s graphical perspective, you can gain a deeper understanding.
This is the tenth article in the Systrace series, primarily providing a brief introduction to Binder and lock information in Systrace. It covers the basic situation of Binder, the representation of Binder communication in Systrace, how to view Binder information, and analysis of lock contention in SystemServer.
The purpose of this series is to view the overall operation of the Android system from a different perspective using Systrace, while also providing an alternative angle for learning the Framework. Perhaps you’ve read many articles about the Framework but can never remember the code, or you’re unclear about the execution flow. Maybe from Systrace’s graphical perspective, you can gain a deeper understanding.
The content of this blog mainly focuses on Android development and optimization-related topics, including the use of performance tools, Android App optimization knowledge, Android Framework explanations, and performance theory. Here is an organized directory for your reference. You can choose the parts you are interested in. This directory includes not only blog content but also some of my answers on Zhihu or the Knowledge Planet - The Performance. This directory lists my original blog posts. Additionally, I have collected some excellent articles in Must-Knows for Android Performance Optimization, which I update periodically.
This is the seventh article in the Systrace series, primarily introducing the Vsync mechanism in Android. This article examines the display of each frame in the Android system from the perspective of Systrace. Vsync is a critical mechanism in Systrace. Although invisible and intangible when operating a phone, we can see in Systrace how the Android system, guided by Vsync signals, orderly performs rendering and composition for each frame, ensuring stable frame rates.
The purpose of this series is to view the overall operation of the Android system from a different perspective using Systrace, while also providing an alternative angle for learning the Framework. Perhaps you’ve read many articles about the Framework but can never remember the code, or you’re unclear about the execution flow. Maybe from Systrace’s graphical perspective, you can gain a deeper understanding.
This article compiles most current Android app startup optimization solutions. If you need optimization guidance, simply reference this article to review others’ approaches and identify gaps. Many solutions require business-specific adjustments, so this article doesn’t detail every method—when you need a particular solution, search online for its specific implementation. This serves as a comprehensive reference.
I’ve also included some system manufacturer optimizations related to startup, though I’ve only listed those I’m aware of. Some manufacturers have proprietary technologies not discussed here. Understanding manufacturer practices may help you—for example, contacting manufacturers for whitelisting or integrating their SDKs.
This article summarizes major Android app startup optimization strategies available today. If you need to optimize your app’s launch performance, use this as a checklist to identify gaps in your current implementation. Since many solutions depend on specific business requirements, I focus on presenting the options rather than deep-diving into every implementation detail. You can easily find specific technical guides for each method online.
I’ve also included some optimizations performed by system manufacturers. Understanding what happens at the OS level can help you make better decisions, such as requesting whitelisting or integrating manufacturer SDKs.
This is the ninth article in the Systrace series, primarily introducing the MainThread and RenderThread in Android Apps—commonly known as the Main Thread and Rendering Thread. This article examines their workflows from the perspective of Systrace and covers related topics: jank, software rendering, and dropped frame calculation.
The purpose of this series is to view the overall operation of the Android system from a different perspective using Systrace, while also providing an alternative angle for learning the Framework. Perhaps you’ve read many articles about the Framework but can never remember the code, or you’re unclear about the execution flow. Maybe from Systrace’s graphical perspective, you can gain a deeper understanding.
This is the sixth article in the Systrace series, primarily providing a brief introduction to Input in Systrace. It covers the Input workflow, how Input information is represented in Systrace, and how to combine Input info to analyze related performance issues.
The purpose of this series is to view the overall operation of the Android system from a different perspective using Systrace, while also providing an alternative angle for learning the Framework. Perhaps you’ve read many articles about the Framework but can never remember the code, or you’re unclear about the execution flow. Maybe from Systrace’s graphical perspective, you can gain a deeper understanding.
When an Android app moves to the background, it’s not unusual for it to keep performing work as long as the process isn’t killed—that’s just the nature of Android. However, some apps continue to run “zombie animations”—animations that are completely invisible to the user yet consume precious CPU cycles and battery. When users discover this, the result is often a manual kill, an OS-level background restriction, or an outright uninstallation.
Most developers never notice this issue. However, if you use Systrace regularly, you can easily spot it. If you open several apps, return to the home screen, and capture a trace while swiping between launcher pages, you’ll often see background apps still firing animation callbacks.
“Zombie animations” occur when an app, despite being invisible, continues to push CALLBACK_ANIMATION requests to the Choreographer. Every app is different, but the root cause is usually a missing pause or stop call.
This article introduces Choreographer, a class that app developers rarely encounter but is crucial in the Android Framework rendering pipeline. It covers the background of Choreographer‘s introduction, an overview, source code analysis, its relationship with MessageQueue, its use in APM, and optimization ideas from mobile manufacturers.
Choreographer was introduced to coordinate with Vsync, providing a stable timing for handling Messages in app rendering. When Vsync arrives, the system adjusts the Vsync signal period to control the timing of drawing operations for each frame. Most phones currently have a 60Hz refresh rate (16.6ms). To match this, the system sets the Vsync period to 16.6ms, waking Choreographer every period to perform app drawing—this is its primary role. Understanding Choreographer also helps developers grasp the principles of frame execution and deepens knowledge of Message, Handler, Looper, MessageQueue, Measure, Layout, and Draw.
In the Overview of Jank and Frame Drops in Android - System Layer article, we touched upon jank cases caused by low system memory. Since low memory has a significant impact on overall device performance, I’m dedicating this article to exploring those effects in depth.
As Android versions evolve and apps become more feature-heavy, their memory requirements increase. However, many devices with 4GB of RAM or less are still in use. These users are prone to low memory situations, especially after major system updates or as they install more apps.
Low memory triggers performance issues categorized by slow responsiveness and jank. Examples include longer app launch times, more frame drops in scrolling, more frequent cold starts as background processes are killed, and increased device temperature. Below, I’ll outline the causes, debugging methods, and potential optimizations for these issues.
This article was inspired by a real-world bug I encountered. While the issue itself wasn’t particularly “hard,” the analysis process—the tools used, the investigative logic, and some clever tips I learned from a colleague—made it a perfect candidate for a case study.
I’ve used a variety of tools mentioned in my Android Performance Optimization Methodology, including:
- Reproduction Video
- Event Log
- AS Source/Debug
- AS Profiler
- Systrace
- Dumpsys
- Unix
psutility
My goal is to document this process for myself and to share a universal troubleshooting workflow that might help others. If you have your own debugging tips, feel free to join our discussion group!
In the Overview of Jank and Frame Drops in Android - System Layer article, we listed causes of jank originating from the system. In this article, we focus on causes stemming from the App itself. When you encounter lag, before blaming the phone manufacturer, consider if it’s the App’s own inefficiency.
In the Overview of Jank and Frame Drops in Android - Application Layer article, we listed causes of jank originating from the app itself. In this article, we focus on causes stemming from the Android platform. Due to differences in hardware performance, feature implementations, and engineering capabilities among Android OEMs, system quality varies significantly. Here, we’ll categorize performance issues caused by system hardware and software.
Jank issues in Android are taken very seriously by both smartphone manufacturers and app developers. Internal teams, often called “Performance” or “Stability” groups, are typically dedicated to optimizing these experiences.
Currently, excellent third-party performance monitoring tools like Tencent’s Matrix are available. Phone manufacturers also have proprietary solutions. Since they can modify source code and bypass certain permission hurdles, manufacturers can access deeper system data, making analysis more efficient.
Android Activities have several critical launch modes: standard, singleTop, singleTask, and singleInstance. Each serves a specific architectural purpose. In this post, I’ll demonstrate their behaviors using a demo and visualizing the Activity Stack at each step.
An Activity Stack is a Last-In-First-Out (LIFO) data structure. Paying attention to the “Stack Content” column in the examples below will help you grasp how these modes differ in practice.
The demo code is available on GitLab: AndroidLaunchModeTest.
Hardware Acceleration vs. Software AccelerationMany people confuse “hardware acceleration” with “Hardware Layer” in Android, assuming that enabling hardware acceleration means enabling Hardware Layer. So before we talk about Hardware Layer, let’s first talk about hardware acceleration.
For more d...
Hardware Acceleration vs Software AccelerationMany people confuse hardware acceleration and Hardware Layer in Android, thinking that enabling hardware acceleration means enabling Hardware Layer. So before discussing Hardware Layer, let’s first talk about hardware acceleration.
For more detailed a...
This is the second article in the Systrace series, primarily explaining the prerequisites for analyzing Systrace. With these prerequisites, analyzing Systrace will be more effective, allowing you to identify issues faster and more efficiently.
This article introduces how to view thread states in Systrace, how to analyze thread wakeup information, how to interpret data in the information panel, and common shortcuts. By studying this article, you will gain an understanding of process and thread-related information and know how to extract key information from complex Systrace traces.
This is the fourth article in the Systrace series, primarily providing a brief introduction to SystemServer. It covers several important threads within SystemServer. Since Input and Binder are particularly critical, they are discussed separately and won’t be covered in detail here.
The purpose of this series is to view the overall operation of the Android system from a different perspective using Systrace, while also providing an alternative angle for learning the Framework. Perhaps you’ve read many articles about the Framework but can never remember the code, or you’re unclear about the execution flow. Maybe from Systrace’s graphical perspective, you can gain a deeper understanding.
This is the first article in the Systrace series, primarily providing a brief introduction to Systrace, its basic usage, how to interpret Systrace traces, and how to analyze phenomena in Systrace in conjunction with other tools.
The purpose of this series is to view the overall operation of the Android system from a different perspective using Systrace, while also providing an alternative angle for learning the Framework. Perhaps you’ve read many articles about the Framework but can never remember the code, or you’re unclear about the execution flow. Maybe from Systrace’s graphical perspective, you can gain a deeper understanding.
This is the third article in the Systrace series, explaining why 60 FPS is constantly emphasized. 60 FPS is a software concept, distinct from the 60Hz mentioned in screen refresh rates. For further context, refer to: A New Smooth Experience: A Talk on 90Hz.
The purpose of this series is to view the overall operation of the Android system from a different perspective using Systrace, while also providing an alternative angle for learning the Framework. Perhaps you’ve read many articles about the Framework but can never remember the code, or you’re unclear about the execution flow. Maybe from Systrace’s graphical perspective, you can gain a deeper understanding.
As Systrace becomes increasingly feature-rich, combined with Android version iterations, the previous Systrace series tutorials have become somewhat outdated. Additionally, as my own skills have improved, I’ve been able to extract more information from Systrace, which has been very helpful in solving various performance issues. I need to document these skills to enhance my summarization and organization abilities, and if it helps those who read these articles, that would be excellent.
The purpose of this series is to view the overall operation of the Android system from a different perspective using Systrace, while also providing an alternative angle for learning the Framework. Perhaps you’ve read many articles about the Framework but can never remember the code, or you’re unclear about the execution flow. Maybe from Systrace’s graphical perspective, you can gain a deeper understanding.
High-refresh-rate screens have been common on PCs for years, but they’ve only recently made their way to Android. While the Razer Phone introduced a 120Hz screen last year to a quiet reception, I believe the 90Hz screens on the Nubia Red Magic 3 and OnePlus 7 Pro represent the current “sweet spot...
PhenomenonSome users reported that while scrolling on the phone, the list would jitter. This happens when scrolling on the desktop or settings (as long as it is scrollable), but this is not reproducible for everyone; it appears for some users, but not for others.
Onlookers can scroll directly to ...
At the beginning of 2018, I wrote 2017 Best Items Recommendations. Recently, some people asked if I’d do one for 2018. Although 2018 was a tough year, there were still some great things worth recommending to everyone.
Just like in 2017, I’ll share things that I found helpful for work or life. The recommendations include apps, hardware, books, blogs, and columns. I hope they provide value to you in 2019.
Whether you are an Android App developer or a System developer, having a foundational understanding of the Android system is extremely beneficial. I recently set up a development environment at home and decided to share the process for anyone interested.
The general steps involved are as follows:...
This is the second post in the reading notes series for The Programmer’s Apprenticeship: From Good to Great. The author, Jeff Atwood, is one of the founders of Stack Overflow. His articles cover a wide range of topics. He is a seasoned programmer, manager, and entrepreneur. This book discusses ma...
Besides the CPU, many users consider RAM size when buying a phone. Different RAM configurations come with different prices—but how much RAM do you actually need? How does Android manage its memory? Average users are often confused: How much RAM does this app use? How much does the system use? How does RAM affect my experience? And how much RAM should my next phone have?
A common question on Zhihu is: “Does the Android system not release memory?”. It’s not that the user doesn’t know the system releases memory, but rather they want to understand the mechanics to optimize their experience. In this article, I’ll address these user concerns. More technical details will be covered in later articles.
I’ve long wanted to write about Android system fluency because it’s the most direct aspect of the user experience. The long-standing criticism that Android “gets laggier over time” still casts a shadow over the platform, and it’s a primary reason many users default to iPhone.
Because Google keeps Android open, different manufacturers produce devices with vastly different hardware, and app quality varies wildly. Consequently, fluency is affected by countless factors. It’s rarely just “the system isn’t optimized.” Often, two devices with the same OS but different SOCs offer completely different experiences.
In this post, I want to discuss the factors affecting Android fluency from several perspectives:
- Hardware
- System
- Applications
- The Optimization Loop
It’s often said that the overall iOS experience is superior to Android. This is partly due to third-party software quality (iOS versions are often more polished) and partly due to Apple’s tight control over its ecosystem. To get on the App Store, you must pass rigorous reviews.
Today, we’ll discuss a major differentiator between iOS and Android: the StartingWindow (colloquially, the Splash Screen). While both systems have them, their implementations vary wildly. iOS requires a StartingWindow—usually a static image—that displays immediately upon an icon tap with zero delay. Android, being open, allows developers to customize, disable, or even make the StartingWindow transparent.
This article records the essential knowledge for Android performance optimization (mainly including outstanding articles, WeChat accounts, blogs, and technical teams), covering all aspects of performance optimization. This post will be continuously updated; personal recommendations are welcome.
2017 has unknowingly passed, and the blog hasn’t been updated for a long time. One reason is that I increasingly feel my knowledge is shallow, fearing I might mislead everyone with technical articles; another reason is that I’m too lazy. Given these two reasons, I decided that this blog’s updates should no longer be limited to technical articles—some meaningful things, thoughts, etc., will also be updated here. On one hand, this is a record for myself; if it can also bring some help to readers along the way, that would naturally be the best (although there aren’t many readers…)
Since 2017 has just passed, I feel it’s necessary to recommend to everyone the things that I think had excellent experiences in 2017 or were very helpful to my work life—perhaps you’ll need them in 2018. The recommended content includes apps, hardware, books, equipment, etc. It should be noted that these are things that brought me great help in 2017, which might not necessarily suit you. Let’s not say too much, let’s get straight to the content!
2017 has passed before we knew it. The blog hasn’t been updated for a while - one reason is that I increasingly realize how shallow my knowledge is and fear that writing about technical topics might mislead readers, and another reason is simply that I’ve been too lazy. Given these two reasons, I’ve decided that blog updates no longer need to be limited to technical articles - things I find meaningful, thoughts, and reflections will also be shared here. On one hand, it serves as my own record, and if it happens to help readers along the way, that would be even better (though there aren’t many readers anyway…).
Since 2017 has just passed, I feel it’s necessary to recommend to everyone the things that I found to be great experiences or very helpful for work and life in 2017 - perhaps you’ll need them in 2018. The recommendations include Apps, hardware, books, equipment, etc. It should be noted that these are things that brought me great help in 2017 - what works for me may not work for you. Without further ado, let’s get into it!
One day in March, Google updated its design guidelines with a new component: Bottom Navigation. This release was quite surprising to many, as Bottom Navigation hadn’t been mentioned in previous Material Design iterations. Traditionally, one of the biggest differences between Android and iOS design was the use of bottom bars; while they were essential for iOS, Android apps following MD guidelines generally avoided them.
This is the second article in a series on Android Bottom Navigation, covering style, behavior, and dimensions.
One day in March, Google updated its design guidelines with a new component: Bottom Navigation. This release was quite surprising to many, as Bottom Navigation hadn’t been mentioned in previous Material Design iterations. Traditionally, one of the biggest differences between Android and iOS design was the use of bottom bars; while they were essential for iOS, Android apps following MD guidelines generally avoided them.
This is the first article in a series on Android Bottom Navigation, covering its usage and historical evolution.
Someone recently asked on Zhihu: “How to calculate APK startup time?”
“How can I use Python or direct ADB commands to calculate APK startup time? I want to measure the time from clicking the icon to the APK being fully started. For example, in a game, this would be from the icon tap to entering the login screen. Existing methods like
adb shell am start -WprovideThisTimeandTotalTime, but I’m unsure of the difference and they don’t seem to match visual reality.”
My colleague Guo Qifa and I provided detailed answers. Since Zhihu reach can be limited, I’ve compiled our responses here with his permission as a guide for other developers.
In the previous article, we used the third method to implement DelayLoad. However, the previous article was written relatively simply and only explained how to implement. This article will explain why we need to do this and the principles behind it.
This will involve some relatively important classes in Android, as well as several relatively important functions in Activity lifecycle.
Actually, the principles here are quite simple, but to clarify the implementation process, it’s still a quite interesting thing. It will involve using some tools, adding debug code ourselves, and proceeding step by step. Through this, our understanding of Activity launch will be one layer deeper. I hope that after reading this, everyone will also get some help from it.
In Android development, startup speed is a critical metric, and optimization is a vital process. The core philosophy of startup optimization is “doing less” during launch. Typical practices include:
- Asynchronous Loading
- Delayed Loading (DelayLoad)
- Lazy Loading
Most developers who have worked on startup optimization have likely used these. This article dives deep into a specific implementation of DelayLoad and the underlying principles. While the code itself is simple, the mechanics involve Looper, Handler, MessageQueue, VSYNC, and more. I’ll also share some edge cases and my own reflections.
Preface
This article serves as a set of learning notes documenting the basic workflow of RenderThread in hwui as introduced in Android 5.0. Since these are notes, some details might not be exhaustive. Instead, I aim to walk through the general flow and highlight the key stages of its operation for future reference when debugging.
The image below shows a Systrace capture of the first Draw operation by the RenderThread during an application startup. We can trace the RenderThread workflow by observing the sequence of events in this trace. If you are familiar with the application startup process, you know that the entire interface is only displayed on the phone after the first drawFrame is completed. Before this, the user sees the application’s StartingWindow.
Linked lists and arrays allow elements to be arranged in an order of our choice. However, if you want to find a specific element but have forgotten its position, you must visit every element until you find it. This can consume significant time if the collection is large. A data structure that allows for rapidly finding objects is the hash table.
HashMap is an implementation of the Map interface based on a hash table. This implementation provides all optional mapping operations and permits null values and null keys. (The HashMap class is roughly equivalent to Hashtable, except that it is unsynchronized and permits nulls.) This class makes no guarantees as to the order of the map; in particular, it does not guarantee that the order will remain constant over time.
Android Memory Optimization Series:
- Android Code Memory Optimization Suggestions - Android (Official)
- Android Code Memory Optimization Suggestions - Java (Official)
- Android Code Memory Optimization Suggestions - Android Resources
- Android Code Memory Optimization Suggestions - OnTrimMemory
The onTrimMemory callback is an API introduced in Android 4.0. It provides hints to developers when system memory is low, allowing them to release resources proactively to avoid being killed by the OS. This ensures the app stays in the background longer and starts faster when the user returns.
This article uses a Q&A format to explain the usage and effectiveness of the onTrimMemory callback across various scenarios. If you want to build high-performance Android apps with great user experiences, don’t miss this.
Android Memory Optimization Series:
- Android Code Memory Optimization Suggestions - Android (Official)
- Android Code Memory Optimization Suggestions - Java (Official)
- Android Code Memory Optimization Suggestions - Android Resources
- Android Code Memory Optimization Suggestions - OnTrimMemory
This article focuses on common memory leak scenarios in Android application development. Having a baseline understanding of memory management before writing code leads to much more robust applications. This post starts with resource usage in Android and covers optimizations for Bitmaps, database queries, Nine-Patch assets, overdraw, and more.
Android Memory Optimization Series:
- Android Code Memory Optimization Suggestions - Android (Official)
- Android Code Memory Optimization Suggestions - Java (Official)
- Android Code Memory Optimization Suggestions - Android Resources
- Android Code Memory Optimization Suggestions - OnTrimMemory
To ensure the Garbage Collector (GC) can properly release memory, it’s crucial to avoid memory leaks (often caused by global or static member variables holding object references) and to release references when they are no longer needed. For most apps, the GC handles the rest: if an object is no longer reachable, its memory is reclaimed.
High-performance software requires proactive memory management throughout the development lifecycle. Android provides several specific guidelines and techniques to help developers achieve excellent memory performance.
Android Memory Optimization Series:
- Android Code Memory Optimization Suggestions - Android (Official)
- Android Code Memory Optimization Suggestions - Java (Official)
- Android Code Memory Optimization Suggestions - Android Resources
- Android Code Memory Optimization Suggestions - OnTrimMemory
This article introduces micro-optimization techniques that, when combined, contribute to the overall performance of an app, although they don’t provide massive gains compared to choosing the right algorithms and data structures. You should incorporate these tips into your coding habits to improve efficiency.
This content is based on the Google Official Training for Performance Optimization, specifically focusing on high-performance Android code. I recommend all Android developers read these guidelines and apply these principles in their work.
Following yesterday’s Google I/O, Google released the Android M Preview for Nexus 6. You can download the firmware from the official Google website. Once flashed, you can experience the latest features of Android M. Below are the main settings screen and the Easter egg screen:
The Singleton pattern, also known as the single-instance pattern, is a widely used software design pattern. When apply this pattern, the class must ensure that only one instance of the singleton object exists. In this article, we will explore the two primary ways to construct a singleton pattern and finally introduce a sophisticated yet concise approach.
Series Catalog:
- Overview of Android Performance Patterns
- Android Performance Patterns: Render Performance
- Android Performance Patterns: Understanding Overdraw
- Android Performance Patterns: Understanding VSYNC
- Android Performance Patterns: Profile GPU Rendering
“If you can measure it, you can optimize it” is a common term in the computing world, and for Android’s rendering system, the same thing holds true. In order to optimize your pipeline to be more efficient for rendering, you need a tool to give you feedback on where the current perf problems lie.
In this video, Colt McAnlis walks you through an on-device tool built for this exact reason. “Profile GPU Rendering” will help you understand the stages of the rendering pipeline, see which portions might be taking too long, and decide what to do about it in your application.
Profile GPU Rendering Tool
Rendering performance issues are often the culprits stealing your precious frames. These problems are easy to create but also easy to track with the right tools. Using the Profile GPU Rendering tool, you can see right on your device exactly what is causing your application to stutter or slow down.
Series Catalog:
- Overview of Android Performance Patterns
- Android Performance Patterns: Render Performance
- Android Performance Patterns: Understanding Overdraw
- Android Performance Patterns: Understanding VSYNC
- Android Performance Patterns: Profile GPU Rendering
Unbeknownst to most developers, there’s a simple hardware design that defines everything about how fast your application can draw things to the screen.
You may have heard the term VSYNC - VSYNC stands for vertical synchronization and it’s an event that happens every time your screen starts to refresh the content it wants to show you.
Effectively, VSYNC is the product of two components: Refresh Rate (how fast the hardware can refresh the screen), and Frames Per Second (how fast the GPU can draw images). In this video, Colt McAnlis walks through each of these topics and discusses where VSYNC (and the 16ms rendering barrier) comes from, and why it’s critical to understand if you want a silky smooth application.
Basic Concepts
To develop a high-performance application, you first need to understand how the hardware works. The perceived speed of an app is often misunderstood as a raw hardware processing problem, but the real root is often rendering performance. To improve rendering, you must understand VSYNC.
Series Catalog:
- Overview of Android Performance Patterns
- Android Performance Patterns: Render Performance
- Android Performance Patterns: Understanding Overdraw
- Android Performance Patterns: Understanding VSYNC
- Android Performance Patterns: Profile GPU Rendering
One of the most problematic performance problems on Android is the easiest to create; thankfully, it’s also easy to fix.
OVERDRAW is a term used to describe how many times a pixel has been re-drawn in a single frame of rendering. It’s a troublesome issue, because in most cases, pixels that are overdrawn do not end up contributing to the final rendered image. As such, it amounts to wasted work for your GPU and CPU.
Fixing overdraw has everything to do with using the available on-device tools, like Show GPU Overdraw, and then adjusting your view hierarchy in order to reduce areas where it may be occurring.
What is Overdraw?
At the beginning of the video, the author uses a house painter as an analogy: painting a wall is hard work, and if you have to repaint it because you don’t like the color, the first layer was a waste of effort. Similarly, in your application, any work that doesn’t end up on the final screen is wasted. When you try to balance high performance with perfect design, you often run into a common performance issue: Overdraw!
Overdraw represents a situation where a single pixel on the screen is painted more than once within a single frame. As shown in the image below, imagine a stack of overlapping cards. The active card is on top, while the inactive ones are buried beneath. This means the effort spent rendering those buried cards is wasted because they are invisible to the user. We are wasting GPU time rendering things that don’t contribute to the final image.
Series Catalog:
- Overview of Android Performance Patterns
- Android Performance Patterns: Render Performance
- Android Performance Patterns: Understanding Overdraw
- Android Performance Patterns: Understanding VSYNC
- Android Performance Patterns: Profile GPU Rendering
Rendering performance is all about how fast you can draw your activity, and get it updated on the screen. Success here means your users feeling like your application is smooth and responsive, which means that you’ve got to get all your logic completed, and all your rendering done in 16ms or less, each and every frame. But that might be a bit more difficult than you think.
In this video, Colt McAnlis takes a look at what “rendering performance” means to developers, alongside some of the most common pitfalls that are ran into; and let’s not forget the important stuff: the tools that help you track down, and fix these issues before they become large problems.
Android Rendering Knowledge
When you think you’ve developed a world-changing app, your users might not agree. They might think your app is slow and laggy, failing to achieve the smoothness they expect, let alone changing the world. Recycle bin, here it comes! Wait! My app is perfectly smooth on my Nexus 5? How can you say it’s slow? If you know anything about Android fragmentation, you’d know that many low-end phones don’t have the powerful processor and GPU of a Nexus 5, nor do they have an unpolluted stock system.
If a large number of users complain that your app is laggy, don’t just blame their hardware. Sometimes the problem lies within the app itself, meaning your Android app has serious rendering performance issues. Only by understanding the root cause can you solve the problem effectively. Thus, knowing how Android rendering works is essential for any Android developer.
Series Catalog:
- Overview of Android Performance Patterns
- Android Performance Patterns: Render Performance
- Android Performance Patterns: Understanding Overdraw
- Android Performance Patterns: Understanding VSYNC
- Android Performance Patterns: Profile GPU Rendering
On January 6, 2015, Google officially released a series of short videos about Android performance optimization titled Android Performance Patterns. This series is available on YouTube.
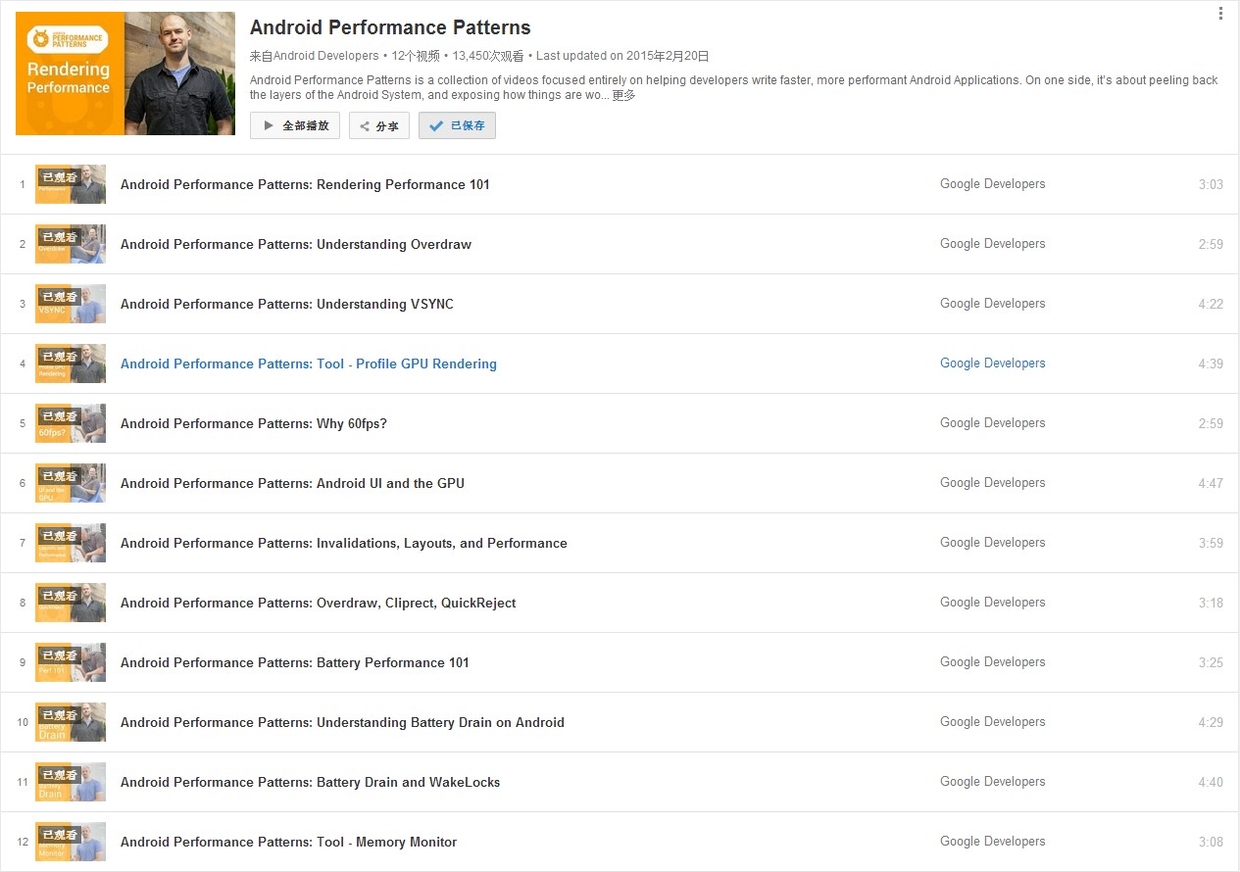
Official Introduction:
Android Performance Patterns is a collection of videos focused entirely on helping developers write faster, more performant Android Applications. On one side, it’s about peeling back the layers of the Android System, and exposing how things are working under the hood. On the other side, it’s about teaching you how the tools work, and what to look for in order to extract the right perf out of your app.
But at the end of the day, Android Performance Patterns is all about giving you the right resources at the right time to help make the fastest, smoothest, most awesome experience for your users. And that’s the whole point, right?
In short, it’s a series of videos explaining Android performance. These videos are very short, typically between 3 to 5 minutes. The speakers talk very fast, which was quite a challenge for non-native listeners before subtitles were available. The good news is that these videos now have full subtitles.
While the videos are short, they are packed with information. A single sentence mentioned by the speaker might require hours of research to understand the underlying principle or how to use a specific debugging tool. This means the series doesn’t directly teach you “how to optimize your app” step-by-step; rather, it tells you what you need to know about Android performance so that you know which tools to use, what steps to take, and what goals to aim for.
This is the final article in our MAT series, detailing how to reconstruct original images from memory snapshots to debug leaks.
- Android Memory Optimization (1) - Introduction to MAT
- Android Memory Optimization (2) - Advanced MAT Usage
- Android Memory Optimization (3) - Viewing Original Bitmaps in MAT
When using MAT to analyze Android memory, you’ll frequently encounter Bitmap and BitmapDrawable$BitmapState objects. In many cases, these Bitmaps consume the majority of the heap. Memory leaks caused by Bitmaps are especially critical and must be handled promptly. When a potential image-related leak is found, seeing the actual image contents can be invaluable for diagnosis.
This article explains how to restore a Bitmap array object in MAT back into a viewable image.
This is the second article in our MAT series, focusing on advanced techniques for analyzing memory issues in Java and Android applications.
- Android Memory Optimization (1) - Introduction to MAT
- Android Memory Optimization (2) - Advanced MAT Usage
- Android Memory Optimization (3) - Viewing Original Bitmaps in MAT
Characteristics of Java Memory Leaks
- Main features: Reachable but Useless.
- Useless: Objects created but not released after they are no longer needed.
- Inefficient: Re-creating new objects for tasks where existing ones could be reused.
Advanced MAT Techniques
Dumping Memory with Android Studio
Modern versions of Android Studio make capturing heap dumps easy: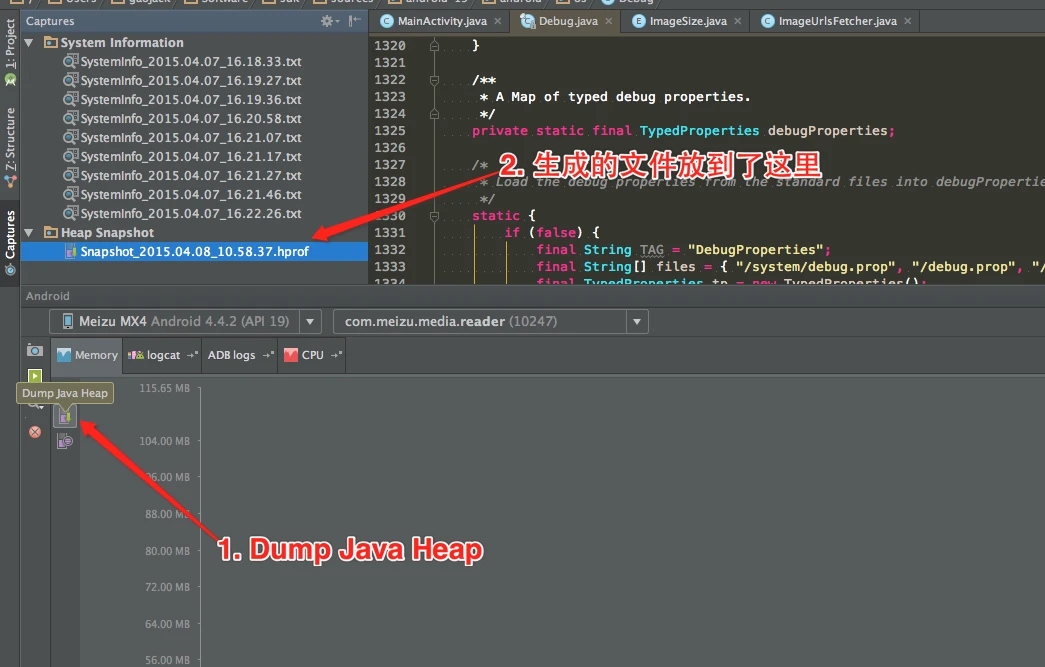
This is the first article in the series on using the MAT tool. This series consists of three articles, detailing how to use MAT to analyze memory issues, whether they are Java application memory issues or Android application memory issues:
- Android Memory Optimization (1) - Getting Started with MAT
- Android Memory Optimization (2) - Advanced MAT Usage
- Android Memory Optimization (3) - Opening Original Bitmap Images in MAT
Introduction to MAT
What is MAT?
MAT (Memory Analyzer Tool), a memory analysis tool based on Eclipse, is a fast and feature-rich JAVA heap analysis tool. It helps us find memory leaks and reduce memory consumption. Using the memory analysis tool to analyze numerous objects, quickly calculate the size occupied by objects in memory, see who is preventing the garbage collector from reclaiming, and visually view the objects that may cause this result through reports.
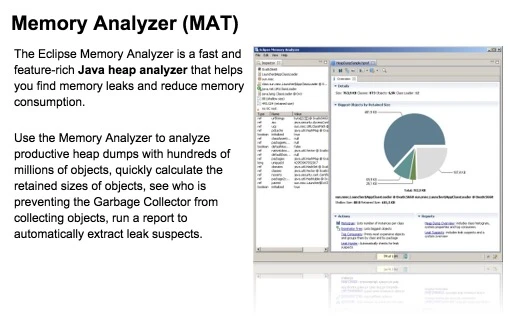
Of course, MAT also has an independent version that doesn’t rely on Eclipse, but this version requires converting the file generated by DDMS before it can be opened in the standalone version of MAT when debugging Android memory. However, the Android SDK already provides this Tool, so it is also very convenient to use.
Introduction
This article is a translation of Android Performance Case Study Follow-up by the renowned Romain Guy. It explores several techniques, methodologies, and tools for Android performance optimization.
Translation
Two years ago, I published Android Performance Case Study to help Android developers understand the tools and techniques needed to identify, track, and optimize performance bottlenecks.
That article used the Twitter client Falcon Pro as a case study. Its developer, Joaquim Vergès, was kind enough to let me use his app as an example and quickly addressed the issues I found. Fast forward to recently: Joaquim was building Falcon Pro 3 from scratch. Before its release, he contacted me about a scrolling performance issue. Once again, I had to analyze it without access to the source code.
Here’s the fourth round-up of Android tips I’ve been posting.
Note: This content is outdated. Please refer to the new Systrace Series Articles for updated information.
This is the first article in the Android Performance Optimization Tools series. This series mainly introduces the tools used during the Android performance optimization process, how to use these tools to discover problems, and how to solve them. In terms of performance optimization, Android provides many performance tools for everyone to use. Following our consistent “discover problem - solve problem” thinking, discovering the problem is the most important part. Trying to solve a problem without first identifying it properly often leads to half the effort for twice the result.
In this article, we’ll start with a brief introduction to the Systrace tool.
Introduction to Systrace
Systrace is a performance data sampling and analysis tool introduced in Android 4.1. It helps developers collect execution information from key Android subsystems (such as SurfaceFlinger, WindowManagerService, and other critical Framework modules, services, and the View system), allowing for a more intuitive analysis of system bottlenecks and performance improvements.
Systrace’s capabilities include tracking system I/O operations, kernel workqueues, CPU load, and the health of various Android subsystems. On the Android platform, it’s composed of three main parts:
- Kernel Space: Systrace leverages the
ftracefeature in the Linux Kernel. Therefore, to use Systrace, the relevantftracemodules in the kernel must be enabled. - Data Collection: Android defines a
Traceclass that applications can use to output statistical information toftrace. Additionally, theatraceprogram in Android reads statistical info fromftraceand passes it to data analysis tools. - Data Analysis Tools: Android provides
systrace.py(a Python script located inAndroid SDK directory/platform-tools/systracethat callsatraceinternally) to configure data collection (such as tags, output filename, etc.), collectftracestatistics, and generate a resulting HTML file for user viewing. Essentially, Systrace is a wrapper around the Linux Kernel’sftrace. Applications need to utilize theTraceclass provided by Android to use Systrace.
Official documentation and usage for Systrace can be found here: Systrace
Android Studio
As Google’s “own son,” the Nexus phone series receives special treatment that is obvious to everyone. After Android 5.0 was released, the Nexus 5 was updated to the latest system immediately. Similarly, Android Studio, as Google’s official IDE, is highly valued. I switched from Eclipse to Android Studio right from the start, upgrading from the initial beta versions all the way to the current 1.0 stable version (1.1 was released today, and I’ve already upgraded).
It’s been a while since my last update. After joining a new company, things have been busy, but I’ve been spending a lot of time researching Android performance. I’ve realized there’s so much I still don’t know, so I’m starting from the application level and working my way down. This series will document my learnings on Android performance optimization.
First, we’ll discuss GPU Overdraw, which is often the most direct point of contact for developers. This topic is split into two parts: Part 1 covers the theory and optimization suggestions, and Part 2 will walk through a practical optimization example.
What is Overdraw?
GPU Overdraw refers to the system drawing more than one layer on a single pixel during a frame. For example, if a TextView has a background color, the pixels displaying the text are drawn twice: once for the background and once for the characters. Overdraw inevitably impacts performance because memory bandwidth is finite. When overdraw exceeds the available bandwidth, the frame rate drops. Bandwidth limits vary significantly across different devices.
In Android development, using EditText is very common. However, sometimes EditText automatically grabs focus when entering a page, causing the soft keyboard to pop up immediately. While this is convenient in some cases, most of the time we prefer the keyboard to appear only when the user explicitly clicks on the EditText.