Android Performance

loading
Android Code Memory Optimization Suggestions - Java (Official)

Android Memory Optimization Series:

  1. Android Code Memory Optimization Suggestions - Android (Official)
  2. Android Code Memory Optimization Suggestions - Java (Official)
  3. Android Code Memory Optimization Suggestions - Android Resources
  4. Android Code Memory Optimization Suggestions - OnTrimMemory

This article introduces micro-optimization techniques that, when combined, contribute to the overall performance of an app, although they don’t provide massive gains compared to choosing the right algorithms and data structures. You should incorporate these tips into your coding habits to improve efficiency.

This content is based on the Google Official Training for Performance Optimization, specifically focusing on high-performance Android code. I recommend all Android developers read these guidelines and apply these principles in their work.

Android Performance Patterns: Understanding Overdraw

Series Catalog:

  1. Overview of Android Performance Patterns
  2. Android Performance Patterns: Render Performance
  3. Android Performance Patterns: Understanding Overdraw
  4. Android Performance Patterns: Understanding VSYNC
  5. Android Performance Patterns: Profile GPU Rendering

One of the most problematic performance problems on Android is the easiest to create; thankfully, it’s also easy to fix.

OVERDRAW is a term used to describe how many times a pixel has been re-drawn in a single frame of rendering. It’s a troublesome issue, because in most cases, pixels that are overdrawn do not end up contributing to the final rendered image. As such, it amounts to wasted work for your GPU and CPU.

Fixing overdraw has everything to do with using the available on-device tools, like Show GPU Overdraw, and then adjusting your view hierarchy in order to reduce areas where it may be occurring.

What is Overdraw?

At the beginning of the video, the author uses a house painter as an analogy: painting a wall is hard work, and if you have to repaint it because you don’t like the color, the first layer was a waste of effort. Similarly, in your application, any work that doesn’t end up on the final screen is wasted. When you try to balance high performance with perfect design, you often run into a common performance issue: Overdraw!

Overdraw represents a situation where a single pixel on the screen is painted more than once within a single frame. As shown in the image below, imagine a stack of overlapping cards. The active card is on top, while the inactive ones are buried beneath. This means the effort spent rendering those buried cards is wasted because they are invisible to the user. We are wasting GPU time rendering things that don’t contribute to the final image.

Overview of Android Performance Patterns

Series Catalog:

  1. Overview of Android Performance Patterns
  2. Android Performance Patterns: Render Performance
  3. Android Performance Patterns: Understanding Overdraw
  4. Android Performance Patterns: Understanding VSYNC
  5. Android Performance Patterns: Profile GPU Rendering

On January 6, 2015, Google officially released a series of short videos about Android performance optimization titled Android Performance Patterns. This series is available on YouTube.
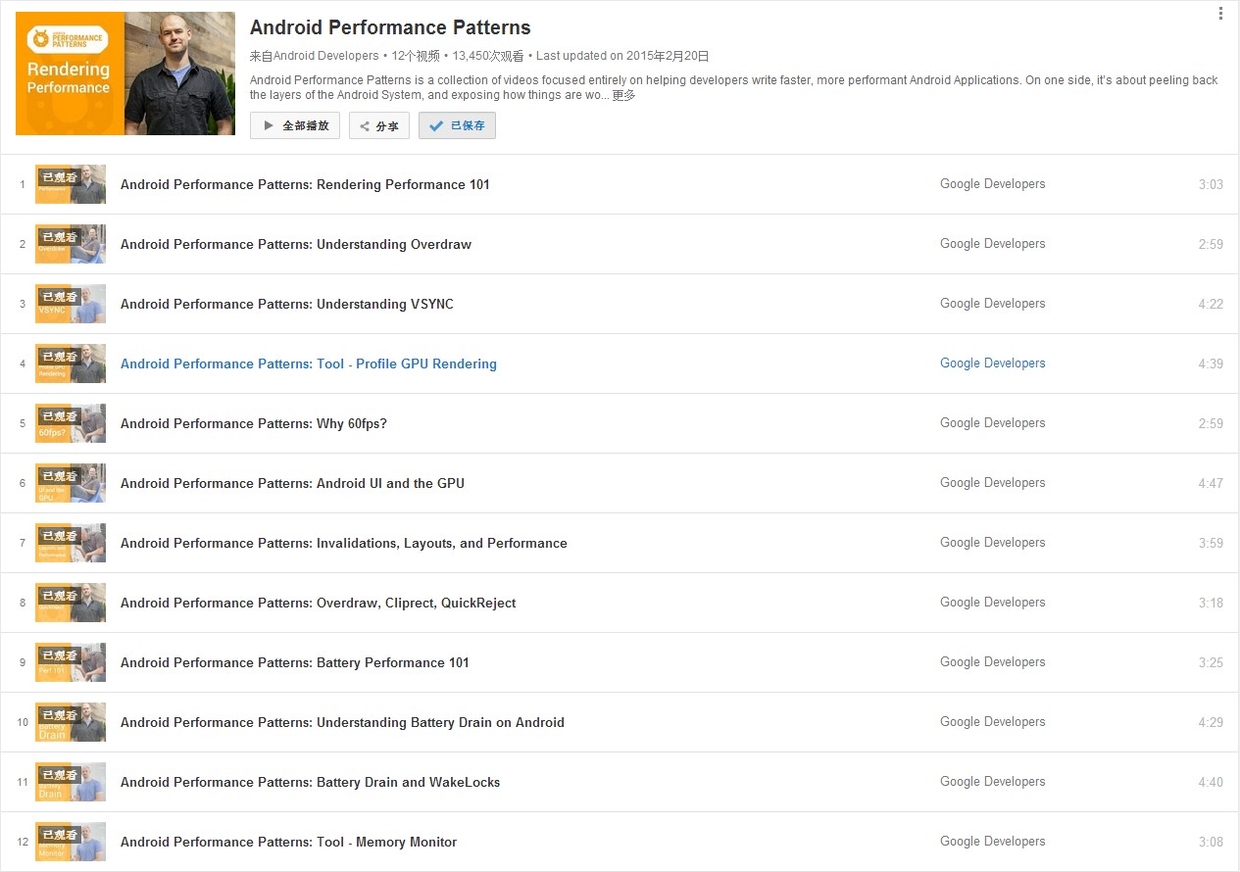
Android Performance Patterns Overview

Official Introduction:

Android Performance Patterns is a collection of videos focused entirely on helping developers write faster, more performant Android Applications. On one side, it’s about peeling back the layers of the Android System, and exposing how things are working under the hood. On the other side, it’s about teaching you how the tools work, and what to look for in order to extract the right perf out of your app.

But at the end of the day, Android Performance Patterns is all about giving you the right resources at the right time to help make the fastest, smoothest, most awesome experience for your users. And that’s the whole point, right?

In short, it’s a series of videos explaining Android performance. These videos are very short, typically between 3 to 5 minutes. The speakers talk very fast, which was quite a challenge for non-native listeners before subtitles were available. The good news is that these videos now have full subtitles.

While the videos are short, they are packed with information. A single sentence mentioned by the speaker might require hours of research to understand the underlying principle or how to use a specific debugging tool. This means the series doesn’t directly teach you “how to optimize your app” step-by-step; rather, it tells you what you need to know about Android performance so that you know which tools to use, what steps to take, and what goals to aim for.

Android Memory Optimization (2) - Advanced MAT Usage

This is the second article in our MAT series, focusing on advanced techniques for analyzing memory issues in Java and Android applications.

  1. Android Memory Optimization (1) - Introduction to MAT
  2. Android Memory Optimization (2) - Advanced MAT Usage
  3. Android Memory Optimization (3) - Viewing Original Bitmaps in MAT

Characteristics of Java Memory Leaks

  • Main features: Reachable but Useless.
  • Useless: Objects created but not released after they are no longer needed.
  • Inefficient: Re-creating new objects for tasks where existing ones could be reused.

Advanced MAT Techniques

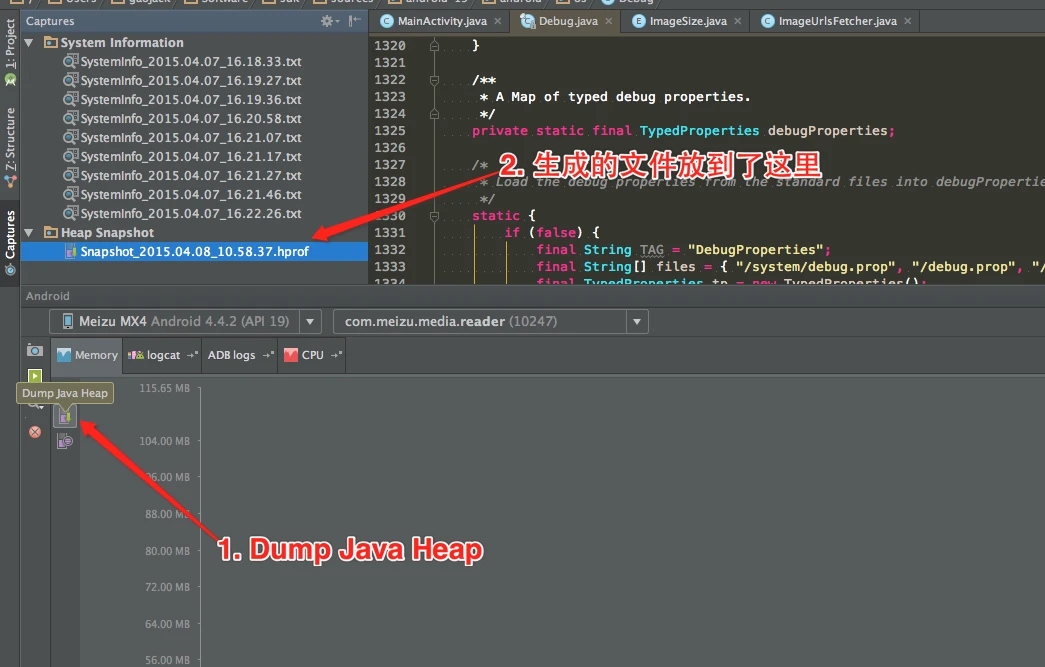
Dumping Memory with Android Studio

Modern versions of Android Studio make capturing heap dumps easy:
Android Studio Memory Profiler

Android Memory Optimization (1) - Getting Started with MAT

This is the first article in the series on using the MAT tool. This series consists of three articles, detailing how to use MAT to analyze memory issues, whether they are Java application memory issues or Android application memory issues:

  1. Android Memory Optimization (1) - Getting Started with MAT
  2. Android Memory Optimization (2) - Advanced MAT Usage
  3. Android Memory Optimization (3) - Opening Original Bitmap Images in MAT

Introduction to MAT

What is MAT?

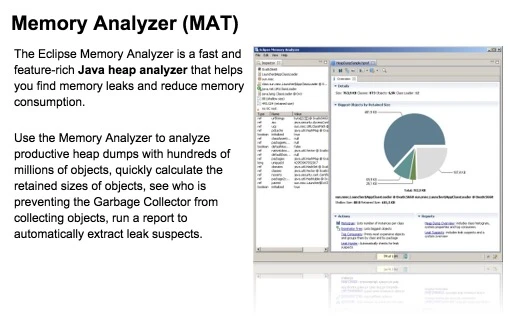
MAT (Memory Analyzer Tool), a memory analysis tool based on Eclipse, is a fast and feature-rich JAVA heap analysis tool. It helps us find memory leaks and reduce memory consumption. Using the memory analysis tool to analyze numerous objects, quickly calculate the size occupied by objects in memory, see who is preventing the garbage collector from reclaiming, and visually view the objects that may cause this result through reports.

image

Of course, MAT also has an independent version that doesn’t rely on Eclipse, but this version requires converting the file generated by DDMS before it can be opened in the standalone version of MAT when debugging Android memory. However, the Android SDK already provides this Tool, so it is also very convenient to use.

Android Performance Case Study Follow-up

Introduction

This article is a translation of Android Performance Case Study Follow-up by the renowned Romain Guy. It explores several techniques, methodologies, and tools for Android performance optimization.


Translation

Two years ago, I published Android Performance Case Study to help Android developers understand the tools and techniques needed to identify, track, and optimize performance bottlenecks.

That article used the Twitter client Falcon Pro as a case study. Its developer, Joaquim Vergès, was kind enough to let me use his app as an example and quickly addressed the issues I found. Fast forward to recently: Joaquim was building Falcon Pro 3 from scratch. Before its release, he contacted me about a scrolling performance issue. Once again, I had to analyze it without access to the source code.