
The tenth article in the Perfetto series focuses on Binder, Android’s core Inter-Process Communication (IPC) mechanism. Binder carries most interactions between system services and apps, and is often where latency and jank originate. This article uses signals from linux.ftrace (binder tracepoints + sched), thread_state, and ART Java monitor contention (via atrace dalvik) to provide a practical workflow for diagnosing transaction latency, thread-pool pressure, and lock contention.
This is the eighth article in the Perfetto series, providing an in-depth introduction to the Vsync mechanism in Android and its representation in Perfetto. The article will analyze how the Android system performs frame rendering and composition based on Vsync signals from Perfetto’s perspective, covering core concepts such as Vsync, Vsync-app, Vsync-sf, and VsyncWorkDuration.
With the popularization of high refresh rate screens, understanding the Vsync mechanism has become increasingly important. This article uses 120Hz refresh rate as the main narrative thread to help developers understand the working principles of Vsync in modern Android devices, and how to observe and analyze Vsync-related performance issues in Perfetto.
Note: This article is based on the public evolution from Android 13 to Android 16. Code snippets are aligned to AOSP main signatures, with
...used in a few places to omit non-critical branches. Always verify against your target branch.
This is the seventh article in the Perfetto series, focusing on MainThread (UI Thread) and RenderThread, the two most critical threads in any Android application. This article will examine the workflow of MainThread and RenderThread from Perfetto’s perspective, covering topics such as jank, software rendering, and frame drop calculations.
As Google officially promotes Perfetto as the replacement for Systrace, Perfetto has become the mainstream choice in performance analysis. This article combines specific Perfetto trace information to help readers understand the complete workflow of MainThread and RenderThread, enabling you to:
- Accurately identify key trace tags: Understand the roles of critical threads like UI Thread and RenderThread
- Understand the complete frame rendering process: Every step from Vsync signal to screen display
- Locate performance bottlenecks: Quickly find the root cause of jank and performance issues through trace information
This is the sixth article in the Android Perfetto series, mainly introducing knowledge related to 120Hz refresh rate on Android devices. Nowadays, 120Hz has become standard configuration for flagship Android phones. This article will discuss the advantages and challenges brought by high refresh rates, and analyze the working principle of 120Hz from a system perspective.
Over the past few years, the refresh rate of mobile device screens has evolved from 60Hz to 90Hz, and then to the now common 120Hz. This improvement not only brings smoother visual experience, but also puts forward new requirements for system architecture and application development. Through the Perfetto tool, we can more intuitively understand the process and performance of frame rendering on high refresh rate devices.
This is the fourth article in the Perfetto series, explaining how to use trace_processor_shell to open large files exceeding 2GB locally. In actual problem analysis, we often encounter very large Trace files (greater than 2GB) that cannot be opened by directly dragging them into ui.perfetto.dev due to browser memory limitations. In this case, we need to use the trace_processor_shell tool provided by the official to open large files locally.
With Google announcing the deprecation of the Systrace tool and the release of Perfetto, Perfetto has basically replaced Systrace in my daily work. At the same time, major manufacturers like OPPO and Vivo have also switched from Systrace to Perfetto. Many friends who are new to Android performance optimization feel a headache when facing the dazzling interface and complex functions of Perfetto. They hope that I can present those previous Systrace articles using Perfetto.
This is the third article in the Perfetto series. The first two articles introduced what Perfetto is and how to capture Perfetto Trace. This article simply introduces how to look at the complex Perfetto information after opening Perfetto Trace on the web side.
With Google announcing the deprecation of the Systrace tool and the release of Perfetto, Perfetto has basically replaced Systrace in my daily work. At the same time, major manufacturers like OPPO and Vivo have also switched from Systrace to Perfetto. Many friends who are new to Android performance optimization feel a headache when facing the dazzling interface and complex functions of Perfetto. They hope that I can present those previous Systrace articles using Perfetto.
The previous article Android Perfetto Series 1: Introduction to Perfetto introduced what Perfetto is. This article provides a brief introduction to Perfetto capture.
With Google announcing the deprecation of the Systrace tool and the release of Perfetto, Perfetto has basically replaced Systrace in my daily work. At the same time, major manufacturers like OPPO and Vivo have also switched from Systrace to Perfetto. Many friends who are new to Android performance optimization feel a headache when facing the dazzling interface and complex functions of Perfetto. They hope that I can present those previous Systrace articles using Perfetto.
This is the first article in the Perfetto series. It mainly provides a brief introduction to the Perfetto tool, including its history, development, and what Perfetto can do.
With Google announcing the deprecation of the Systrace tool and the release of Perfetto, Perfetto has basically replaced Systrace in my daily work. At the same time, major manufacturers like OPPO and Vivo have also switched from Systrace to Perfetto. Many friends who are new to Android performance optimization feel a headache when facing the dazzling interface and complex functions of Perfetto. They hope that I can present those previous Systrace articles using Perfetto.
With Google announcing the deprecation of Systrace in favor of Perfetto, Perfetto has essentially replaced Systrace in my daily workflow. Major manufacturers like OPPO and vivo have also transitioned to Perfetto. Many developers new to Android performance optimization find Perfetto’s complex interface and features overwhelming, which is why I’ve decided to re-present my previous Systrace articles using Perfetto.
Currently, the “Knowledge Planet” (ZSXQ) is a paid community. The income mainly goes towards blog server costs and buying cat food for my cat, Douzi. It also serves as my motivation to keep updating the blog. If you find the content helpful, consider joining to support the work! Thank you very much!
The community is named The Performance, a circle for sharing Android performance optimization. I am the host—an Android performance developer at a top-tier smartphone manufacturer in China with years of experience in performance, power consumption analysis, and case studies. This community provides a one-stop-shop for performance knowledge, covering fundamentals, methodologies, tools, and valuable real-world case analyses.
[!NOTE]
This article was originally written by Yingyun for my Knowledge Planet. Since the Planet has closed, I am publishing this series on OS performance design here.Yingyun is a veteran performance optimization expert with deep insights into system-level tuning, having worked at several major smartphone manufacturers. He is currently active in our community. If you have any questions or feedback, feel free to join our WeChat group.
1. The Genesis
This starts a new series exploring the various considerations in OS architectural design. In reality, these principles apply to the design of any large-scale software.
These views are my own and carry a subjective perspective. I welcome different viewpoints and hope that through their collision, we can all reach a deeper understanding of the field.
A while ago, a certain App became very popular because it exploited Android system vulnerabilities to gain system permissions and did a lot of things. I wanted to see what these Apps did after gaining system permissions by exploiting system vulnerabilities, hence this article. Due to hasty preparation, some Code was not looked at carefully. Interested students can research it themselves and discuss more. The corresponding articles and Code links are below:
- Deep Blue Insight: The Most “Unpardonable” Vulnerabilities of 2022
- XXX apk embedded privilege escalation code and dynamic delivery dex analysis
- History of Android Deserialization Vulnerability Attack and Defense
Regarding how this App obtained these system permissions, History of Android Deserialization Vulnerability Attack and Defense explains it very clearly, so I won’t repeat it here. I am not a security expert either, but I suggest everyone read this article a few times.
On Friday, March 25, 2022, at 9 PM, “The Performance” Knowledge Planet held its first online “Tea Talk.” We were joined by 3 planet hosts, 5 guest experts, and over 50 members. Thank you all for coming!
While we expected to wrap up in an hour, we ended up chatting for over two and a half hours—our introductions alone took an hour! Our community spans the entire Android ecosystem: from App-tier experts to System-level gurus at major smartphone manufacturers, silicon companies, and EV startups. Each introduction naturally evolved into deep dives into industry trends and company-specific insights.
We plan to hold these regularly with clearer themes and more guests. To protect the privacy of our members, we did not record the session. The following text is a reconstructed summary of our discussion.
This is the third article in the “Systrace Thread CPU State Analysis Tips” series. It focuses on the Sleep and Uninterruptible Sleep states in Systrace—their causes, troubleshooting, and optimization. These states are major performance inhibitors and are often difficult to diagnose without a systematic approach.
The goal of this series is to use Systrace to view the Android system from a different perspective and to learn the Framework through visualization. While reading Framework source code can be difficult to remember, seeing the flow in Systrace can lead to deeper understanding. You can find the complete Systrace Basics and Action Series here.
This is the second article in the “Systrace Thread CPU State Analysis Tips” series. It analyzes the causes of the “Running” state in Systrace and provides optimization strategies for when Running segments are excessively long.
The goal of this series is to use Systrace to view the Android system from a different perspective and to learn the Framework through visualization. While reading Framework source code can be difficult to remember, seeing the flow in Systrace can lead to deeper understanding. You can find the complete Systrace Basics and Action Series here.
This is the first article in the “Systrace Thread CPU State Analysis Tips” series. It analyzes the causes of the “Runnable” state in Systrace and provides optimization strategies for when Runnable segments are excessively long.
The goal of this series is to use Systrace to view the Android system from a different perspective and to learn the Framework through visualization. While reading Framework source code can be difficult to remember, seeing the flow in Systrace can lead to deeper understanding. You can find the complete Systrace Basics and Action Series here.
This is the fifth article in the Systrace series, primarily providing a brief introduction to the workflow of SurfaceFlinger. It covers several important threads within SurfaceFlinger, including Vsync signal interpretation, app buffer display, and jank detection. Since Vsync has already been covered in Systrace Basics - Vsync Explained and Detailed Explanation of Android Rendering Mechanism Based on Choreographer, it won’t be discussed in detail here.
The purpose of this series is to view the overall operation of the Android system from a different perspective using Systrace, while also providing an alternative angle for learning the Framework. Perhaps you’ve read many articles about the Framework but can never remember the code, or you’re unclear about the execution flow. Maybe from Systrace’s graphical perspective, you can gain a deeper understanding.
This is the twelfth article in the Systrace series, primarily providing a brief introduction to the CPU information area (Kernel) in Systrace. It covers how to view CPU-related information output by the Kernel module, including CPU frequency, scheduling, frequency locking, and core locking.
The purpose of this series is to view the overall operation of the Android system from a different perspective using Systrace, while also providing an alternative angle for learning the Framework. Perhaps you’ve read many articles about the Framework but can never remember the code, or you’re unclear about the execution flow. Maybe from Systrace’s graphical perspective, you can gain a deeper understanding.
This is the eleventh article in the Systrace series, providing a brief introduction to Triple Buffer within Systrace. It covers how to identify jank in Systrace, perform preliminary localization and analysis, and explains the impact of Triple Buffer on performance.
The purpose of this series is to view the overall operation of the Android system from a different perspective using Systrace, while also providing an alternative angle for learning the Framework. Perhaps you’ve read many articles about the Framework but can never remember the code, or you’re unclear about the execution flow. Maybe from Systrace’s graphical perspective, you can gain a deeper understanding.
This is the tenth article in the Systrace series, primarily providing a brief introduction to Binder and lock information in Systrace. It covers the basic situation of Binder, the representation of Binder communication in Systrace, how to view Binder information, and analysis of lock contention in SystemServer.
The purpose of this series is to view the overall operation of the Android system from a different perspective using Systrace, while also providing an alternative angle for learning the Framework. Perhaps you’ve read many articles about the Framework but can never remember the code, or you’re unclear about the execution flow. Maybe from Systrace’s graphical perspective, you can gain a deeper understanding.
This is the seventh article in the Systrace series, primarily introducing the Vsync mechanism in Android. This article examines the display of each frame in the Android system from the perspective of Systrace. Vsync is a critical mechanism in Systrace. Although invisible and intangible when operating a phone, we can see in Systrace how the Android system, guided by Vsync signals, orderly performs rendering and composition for each frame, ensuring stable frame rates.
The purpose of this series is to view the overall operation of the Android system from a different perspective using Systrace, while also providing an alternative angle for learning the Framework. Perhaps you’ve read many articles about the Framework but can never remember the code, or you’re unclear about the execution flow. Maybe from Systrace’s graphical perspective, you can gain a deeper understanding.
This article compiles most current Android app startup optimization solutions. If you need optimization guidance, simply reference this article to review others’ approaches and identify gaps. Many solutions require business-specific adjustments, so this article doesn’t detail every method—when you need a particular solution, search online for its specific implementation. This serves as a comprehensive reference.
I’ve also included some system manufacturer optimizations related to startup, though I’ve only listed those I’m aware of. Some manufacturers have proprietary technologies not discussed here. Understanding manufacturer practices may help you—for example, contacting manufacturers for whitelisting or integrating their SDKs.
This article summarizes major Android app startup optimization strategies available today. If you need to optimize your app’s launch performance, use this as a checklist to identify gaps in your current implementation. Since many solutions depend on specific business requirements, I focus on presenting the options rather than deep-diving into every implementation detail. You can easily find specific technical guides for each method online.
I’ve also included some optimizations performed by system manufacturers. Understanding what happens at the OS level can help you make better decisions, such as requesting whitelisting or integrating manufacturer SDKs.
This is the ninth article in the Systrace series, primarily introducing the MainThread and RenderThread in Android Apps—commonly known as the Main Thread and Rendering Thread. This article examines their workflows from the perspective of Systrace and covers related topics: jank, software rendering, and dropped frame calculation.
The purpose of this series is to view the overall operation of the Android system from a different perspective using Systrace, while also providing an alternative angle for learning the Framework. Perhaps you’ve read many articles about the Framework but can never remember the code, or you’re unclear about the execution flow. Maybe from Systrace’s graphical perspective, you can gain a deeper understanding.
This is the sixth article in the Systrace series, primarily providing a brief introduction to Input in Systrace. It covers the Input workflow, how Input information is represented in Systrace, and how to combine Input info to analyze related performance issues.
The purpose of this series is to view the overall operation of the Android system from a different perspective using Systrace, while also providing an alternative angle for learning the Framework. Perhaps you’ve read many articles about the Framework but can never remember the code, or you’re unclear about the execution flow. Maybe from Systrace’s graphical perspective, you can gain a deeper understanding.
In the Overview of Jank and Frame Drops in Android - System Layer article, we listed causes of jank originating from the system. In this article, we focus on causes stemming from the App itself. When you encounter lag, before blaming the phone manufacturer, consider if it’s the App’s own inefficiency.
In the Overview of Jank and Frame Drops in Android - Application Layer article, we listed causes of jank originating from the app itself. In this article, we focus on causes stemming from the Android platform. Due to differences in hardware performance, feature implementations, and engineering capabilities among Android OEMs, system quality varies significantly. Here, we’ll categorize performance issues caused by system hardware and software.
Jank issues in Android are taken very seriously by both smartphone manufacturers and app developers. Internal teams, often called “Performance” or “Stability” groups, are typically dedicated to optimizing these experiences.
Currently, excellent third-party performance monitoring tools like Tencent’s Matrix are available. Phone manufacturers also have proprietary solutions. Since they can modify source code and bypass certain permission hurdles, manufacturers can access deeper system data, making analysis more efficient.
Android Activities have several critical launch modes: standard, singleTop, singleTask, and singleInstance. Each serves a specific architectural purpose. In this post, I’ll demonstrate their behaviors using a demo and visualizing the Activity Stack at each step.
An Activity Stack is a Last-In-First-Out (LIFO) data structure. Paying attention to the “Stack Content” column in the examples below will help you grasp how these modes differ in practice.
The demo code is available on GitLab: AndroidLaunchModeTest.
Hardware Acceleration vs. Software AccelerationMany people confuse “hardware acceleration” with “Hardware Layer” in Android, assuming that enabling hardware acceleration means enabling Hardware Layer. So before we talk about Hardware Layer, let’s first talk about hardware acceleration.
For more d...
Hardware Acceleration vs Software AccelerationMany people confuse hardware acceleration and Hardware Layer in Android, thinking that enabling hardware acceleration means enabling Hardware Layer. So before discussing Hardware Layer, let’s first talk about hardware acceleration.
For more detailed a...
This is the second article in the Systrace series, primarily explaining the prerequisites for analyzing Systrace. With these prerequisites, analyzing Systrace will be more effective, allowing you to identify issues faster and more efficiently.
This article introduces how to view thread states in Systrace, how to analyze thread wakeup information, how to interpret data in the information panel, and common shortcuts. By studying this article, you will gain an understanding of process and thread-related information and know how to extract key information from complex Systrace traces.
This is the fourth article in the Systrace series, primarily providing a brief introduction to SystemServer. It covers several important threads within SystemServer. Since Input and Binder are particularly critical, they are discussed separately and won’t be covered in detail here.
The purpose of this series is to view the overall operation of the Android system from a different perspective using Systrace, while also providing an alternative angle for learning the Framework. Perhaps you’ve read many articles about the Framework but can never remember the code, or you’re unclear about the execution flow. Maybe from Systrace’s graphical perspective, you can gain a deeper understanding.
This is the first article in the Systrace series, primarily providing a brief introduction to Systrace, its basic usage, how to interpret Systrace traces, and how to analyze phenomena in Systrace in conjunction with other tools.
The purpose of this series is to view the overall operation of the Android system from a different perspective using Systrace, while also providing an alternative angle for learning the Framework. Perhaps you’ve read many articles about the Framework but can never remember the code, or you’re unclear about the execution flow. Maybe from Systrace’s graphical perspective, you can gain a deeper understanding.
This is the third article in the Systrace series, explaining why 60 FPS is constantly emphasized. 60 FPS is a software concept, distinct from the 60Hz mentioned in screen refresh rates. For further context, refer to: A New Smooth Experience: A Talk on 90Hz.
The purpose of this series is to view the overall operation of the Android system from a different perspective using Systrace, while also providing an alternative angle for learning the Framework. Perhaps you’ve read many articles about the Framework but can never remember the code, or you’re unclear about the execution flow. Maybe from Systrace’s graphical perspective, you can gain a deeper understanding.
As Systrace becomes increasingly feature-rich, combined with Android version iterations, the previous Systrace series tutorials have become somewhat outdated. Additionally, as my own skills have improved, I’ve been able to extract more information from Systrace, which has been very helpful in solving various performance issues. I need to document these skills to enhance my summarization and organization abilities, and if it helps those who read these articles, that would be excellent.
The purpose of this series is to view the overall operation of the Android system from a different perspective using Systrace, while also providing an alternative angle for learning the Framework. Perhaps you’ve read many articles about the Framework but can never remember the code, or you’re unclear about the execution flow. Maybe from Systrace’s graphical perspective, you can gain a deeper understanding.
This article records the essential knowledge for Android performance optimization (mainly including outstanding articles, WeChat accounts, blogs, and technical teams), covering all aspects of performance optimization. This post will be continuously updated; personal recommendations are welcome.
Android Memory Optimization Series:
- Android Code Memory Optimization Suggestions - Android (Official)
- Android Code Memory Optimization Suggestions - Java (Official)
- Android Code Memory Optimization Suggestions - Android Resources
- Android Code Memory Optimization Suggestions - OnTrimMemory
The onTrimMemory callback is an API introduced in Android 4.0. It provides hints to developers when system memory is low, allowing them to release resources proactively to avoid being killed by the OS. This ensures the app stays in the background longer and starts faster when the user returns.
This article uses a Q&A format to explain the usage and effectiveness of the onTrimMemory callback across various scenarios. If you want to build high-performance Android apps with great user experiences, don’t miss this.
Android Memory Optimization Series:
- Android Code Memory Optimization Suggestions - Android (Official)
- Android Code Memory Optimization Suggestions - Java (Official)
- Android Code Memory Optimization Suggestions - Android Resources
- Android Code Memory Optimization Suggestions - OnTrimMemory
This article focuses on common memory leak scenarios in Android application development. Having a baseline understanding of memory management before writing code leads to much more robust applications. This post starts with resource usage in Android and covers optimizations for Bitmaps, database queries, Nine-Patch assets, overdraw, and more.
Android Memory Optimization Series:
- Android Code Memory Optimization Suggestions - Android (Official)
- Android Code Memory Optimization Suggestions - Java (Official)
- Android Code Memory Optimization Suggestions - Android Resources
- Android Code Memory Optimization Suggestions - OnTrimMemory
To ensure the Garbage Collector (GC) can properly release memory, it’s crucial to avoid memory leaks (often caused by global or static member variables holding object references) and to release references when they are no longer needed. For most apps, the GC handles the rest: if an object is no longer reachable, its memory is reclaimed.
High-performance software requires proactive memory management throughout the development lifecycle. Android provides several specific guidelines and techniques to help developers achieve excellent memory performance.
Android Memory Optimization Series:
- Android Code Memory Optimization Suggestions - Android (Official)
- Android Code Memory Optimization Suggestions - Java (Official)
- Android Code Memory Optimization Suggestions - Android Resources
- Android Code Memory Optimization Suggestions - OnTrimMemory
This article introduces micro-optimization techniques that, when combined, contribute to the overall performance of an app, although they don’t provide massive gains compared to choosing the right algorithms and data structures. You should incorporate these tips into your coding habits to improve efficiency.
This content is based on the Google Official Training for Performance Optimization, specifically focusing on high-performance Android code. I recommend all Android developers read these guidelines and apply these principles in their work.
Series Catalog:
- Overview of Android Performance Patterns
- Android Performance Patterns: Render Performance
- Android Performance Patterns: Understanding Overdraw
- Android Performance Patterns: Understanding VSYNC
- Android Performance Patterns: Profile GPU Rendering
“If you can measure it, you can optimize it” is a common term in the computing world, and for Android’s rendering system, the same thing holds true. In order to optimize your pipeline to be more efficient for rendering, you need a tool to give you feedback on where the current perf problems lie.
In this video, Colt McAnlis walks you through an on-device tool built for this exact reason. “Profile GPU Rendering” will help you understand the stages of the rendering pipeline, see which portions might be taking too long, and decide what to do about it in your application.
Profile GPU Rendering Tool
Rendering performance issues are often the culprits stealing your precious frames. These problems are easy to create but also easy to track with the right tools. Using the Profile GPU Rendering tool, you can see right on your device exactly what is causing your application to stutter or slow down.
Series Catalog:
- Overview of Android Performance Patterns
- Android Performance Patterns: Render Performance
- Android Performance Patterns: Understanding Overdraw
- Android Performance Patterns: Understanding VSYNC
- Android Performance Patterns: Profile GPU Rendering
Unbeknownst to most developers, there’s a simple hardware design that defines everything about how fast your application can draw things to the screen.
You may have heard the term VSYNC - VSYNC stands for vertical synchronization and it’s an event that happens every time your screen starts to refresh the content it wants to show you.
Effectively, VSYNC is the product of two components: Refresh Rate (how fast the hardware can refresh the screen), and Frames Per Second (how fast the GPU can draw images). In this video, Colt McAnlis walks through each of these topics and discusses where VSYNC (and the 16ms rendering barrier) comes from, and why it’s critical to understand if you want a silky smooth application.
Basic Concepts
To develop a high-performance application, you first need to understand how the hardware works. The perceived speed of an app is often misunderstood as a raw hardware processing problem, but the real root is often rendering performance. To improve rendering, you must understand VSYNC.
Series Catalog:
- Overview of Android Performance Patterns
- Android Performance Patterns: Render Performance
- Android Performance Patterns: Understanding Overdraw
- Android Performance Patterns: Understanding VSYNC
- Android Performance Patterns: Profile GPU Rendering
One of the most problematic performance problems on Android is the easiest to create; thankfully, it’s also easy to fix.
OVERDRAW is a term used to describe how many times a pixel has been re-drawn in a single frame of rendering. It’s a troublesome issue, because in most cases, pixels that are overdrawn do not end up contributing to the final rendered image. As such, it amounts to wasted work for your GPU and CPU.
Fixing overdraw has everything to do with using the available on-device tools, like Show GPU Overdraw, and then adjusting your view hierarchy in order to reduce areas where it may be occurring.
What is Overdraw?
At the beginning of the video, the author uses a house painter as an analogy: painting a wall is hard work, and if you have to repaint it because you don’t like the color, the first layer was a waste of effort. Similarly, in your application, any work that doesn’t end up on the final screen is wasted. When you try to balance high performance with perfect design, you often run into a common performance issue: Overdraw!
Overdraw represents a situation where a single pixel on the screen is painted more than once within a single frame. As shown in the image below, imagine a stack of overlapping cards. The active card is on top, while the inactive ones are buried beneath. This means the effort spent rendering those buried cards is wasted because they are invisible to the user. We are wasting GPU time rendering things that don’t contribute to the final image.
Series Catalog:
- Overview of Android Performance Patterns
- Android Performance Patterns: Render Performance
- Android Performance Patterns: Understanding Overdraw
- Android Performance Patterns: Understanding VSYNC
- Android Performance Patterns: Profile GPU Rendering
Rendering performance is all about how fast you can draw your activity, and get it updated on the screen. Success here means your users feeling like your application is smooth and responsive, which means that you’ve got to get all your logic completed, and all your rendering done in 16ms or less, each and every frame. But that might be a bit more difficult than you think.
In this video, Colt McAnlis takes a look at what “rendering performance” means to developers, alongside some of the most common pitfalls that are ran into; and let’s not forget the important stuff: the tools that help you track down, and fix these issues before they become large problems.
Android Rendering Knowledge
When you think you’ve developed a world-changing app, your users might not agree. They might think your app is slow and laggy, failing to achieve the smoothness they expect, let alone changing the world. Recycle bin, here it comes! Wait! My app is perfectly smooth on my Nexus 5? How can you say it’s slow? If you know anything about Android fragmentation, you’d know that many low-end phones don’t have the powerful processor and GPU of a Nexus 5, nor do they have an unpolluted stock system.
If a large number of users complain that your app is laggy, don’t just blame their hardware. Sometimes the problem lies within the app itself, meaning your Android app has serious rendering performance issues. Only by understanding the root cause can you solve the problem effectively. Thus, knowing how Android rendering works is essential for any Android developer.
Series Catalog:
- Overview of Android Performance Patterns
- Android Performance Patterns: Render Performance
- Android Performance Patterns: Understanding Overdraw
- Android Performance Patterns: Understanding VSYNC
- Android Performance Patterns: Profile GPU Rendering
On January 6, 2015, Google officially released a series of short videos about Android performance optimization titled Android Performance Patterns. This series is available on YouTube.
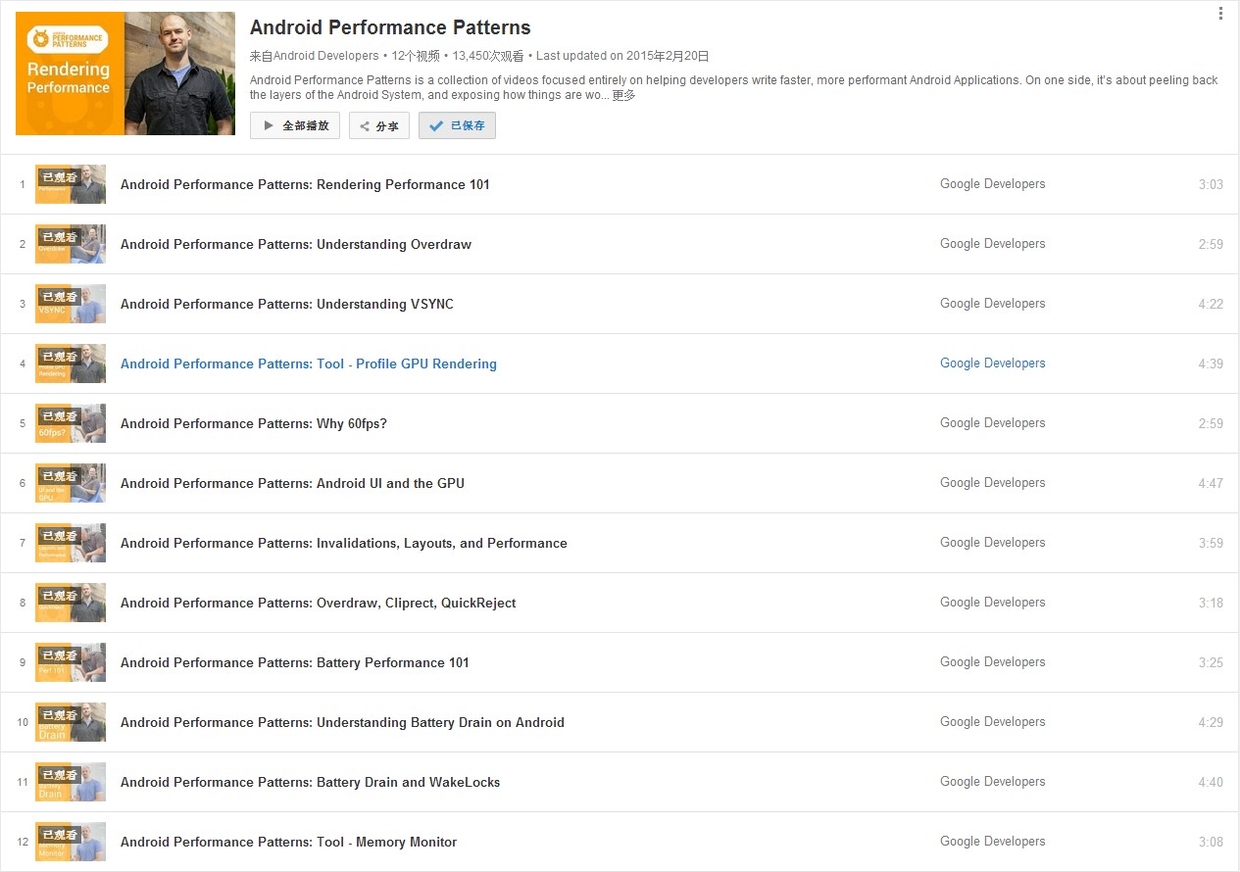
Official Introduction:
Android Performance Patterns is a collection of videos focused entirely on helping developers write faster, more performant Android Applications. On one side, it’s about peeling back the layers of the Android System, and exposing how things are working under the hood. On the other side, it’s about teaching you how the tools work, and what to look for in order to extract the right perf out of your app.
But at the end of the day, Android Performance Patterns is all about giving you the right resources at the right time to help make the fastest, smoothest, most awesome experience for your users. And that’s the whole point, right?
In short, it’s a series of videos explaining Android performance. These videos are very short, typically between 3 to 5 minutes. The speakers talk very fast, which was quite a challenge for non-native listeners before subtitles were available. The good news is that these videos now have full subtitles.
While the videos are short, they are packed with information. A single sentence mentioned by the speaker might require hours of research to understand the underlying principle or how to use a specific debugging tool. This means the series doesn’t directly teach you “how to optimize your app” step-by-step; rather, it tells you what you need to know about Android performance so that you know which tools to use, what steps to take, and what goals to aim for.
This is the final article in our MAT series, detailing how to reconstruct original images from memory snapshots to debug leaks.
- Android Memory Optimization (1) - Introduction to MAT
- Android Memory Optimization (2) - Advanced MAT Usage
- Android Memory Optimization (3) - Viewing Original Bitmaps in MAT
When using MAT to analyze Android memory, you’ll frequently encounter Bitmap and BitmapDrawable$BitmapState objects. In many cases, these Bitmaps consume the majority of the heap. Memory leaks caused by Bitmaps are especially critical and must be handled promptly. When a potential image-related leak is found, seeing the actual image contents can be invaluable for diagnosis.
This article explains how to restore a Bitmap array object in MAT back into a viewable image.
This is the second article in our MAT series, focusing on advanced techniques for analyzing memory issues in Java and Android applications.
- Android Memory Optimization (1) - Introduction to MAT
- Android Memory Optimization (2) - Advanced MAT Usage
- Android Memory Optimization (3) - Viewing Original Bitmaps in MAT
Characteristics of Java Memory Leaks
- Main features: Reachable but Useless.
- Useless: Objects created but not released after they are no longer needed.
- Inefficient: Re-creating new objects for tasks where existing ones could be reused.
Advanced MAT Techniques
Dumping Memory with Android Studio
Modern versions of Android Studio make capturing heap dumps easy: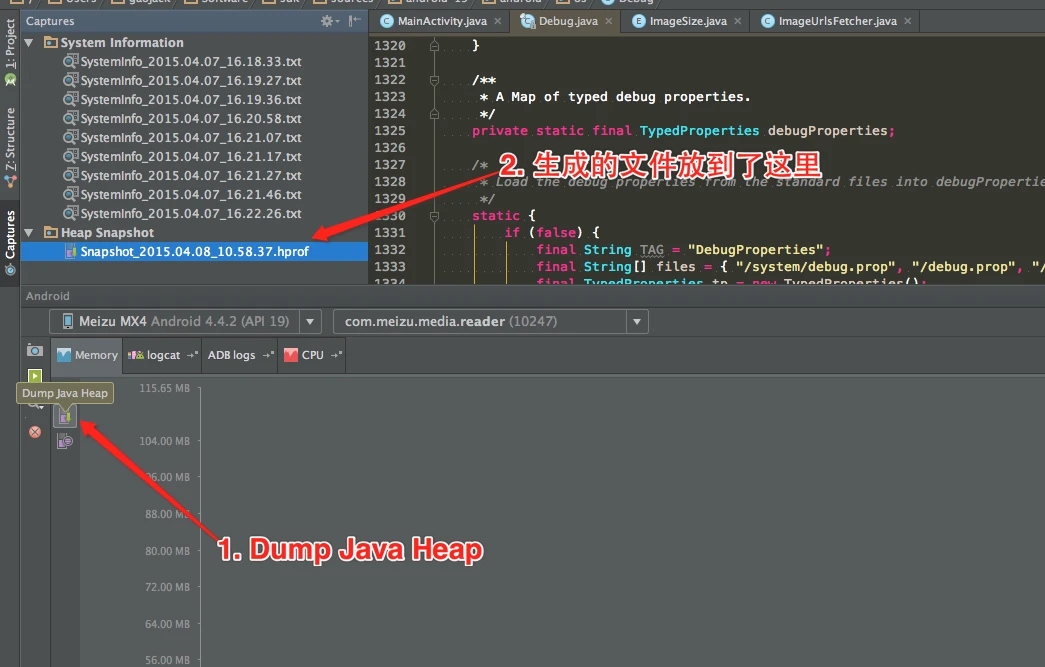
This is the first article in the series on using the MAT tool. This series consists of three articles, detailing how to use MAT to analyze memory issues, whether they are Java application memory issues or Android application memory issues:
- Android Memory Optimization (1) - Getting Started with MAT
- Android Memory Optimization (2) - Advanced MAT Usage
- Android Memory Optimization (3) - Opening Original Bitmap Images in MAT
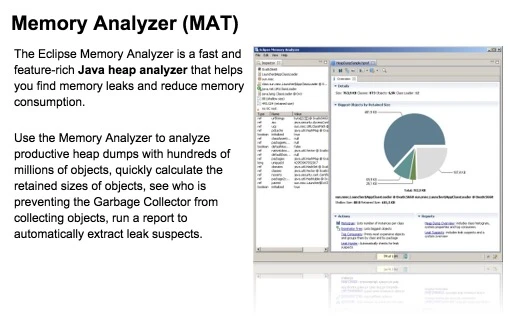
Introduction to MAT
What is MAT?
MAT (Memory Analyzer Tool), a memory analysis tool based on Eclipse, is a fast and feature-rich JAVA heap analysis tool. It helps us find memory leaks and reduce memory consumption. Using the memory analysis tool to analyze numerous objects, quickly calculate the size occupied by objects in memory, see who is preventing the garbage collector from reclaiming, and visually view the objects that may cause this result through reports.
Of course, MAT also has an independent version that doesn’t rely on Eclipse, but this version requires converting the file generated by DDMS before it can be opened in the standalone version of MAT when debugging Android memory. However, the Android SDK already provides this Tool, so it is also very convenient to use.
Introduction
This article is a translation of Android Performance Case Study Follow-up by the renowned Romain Guy. It explores several techniques, methodologies, and tools for Android performance optimization.
Translation
Two years ago, I published Android Performance Case Study to help Android developers understand the tools and techniques needed to identify, track, and optimize performance bottlenecks.
That article used the Twitter client Falcon Pro as a case study. Its developer, Joaquim Vergès, was kind enough to let me use his app as an example and quickly addressed the issues I found. Fast forward to recently: Joaquim was building Falcon Pro 3 from scratch. Before its release, he contacted me about a scrolling performance issue. Once again, I had to analyze it without access to the source code.
Introduction
The previous article covered the theory of overdraw and tools to detect it. While iOS users rely on Apple’s curation, Android users rely on developers’ discipline. Unfortunately, many market-leading Android apps still suffer from significant overdraw issues. As a developer, I want to see Android bridge and eventually surpass the experience gap with iOS.
This post walks through a practical overdraw optimization process. Since every app is different, these steps are a reference to help you start your own optimization journey.
If you missed the theory part, check it here: Android Performance Optimization: Overdraw (Part 1)
It’s been a while since my last update. After joining a new company, things have been busy, but I’ve been spending a lot of time researching Android performance. I’ve realized there’s so much I still don’t know, so I’m starting from the application level and working my way down. This series will document my learnings on Android performance optimization.
First, we’ll discuss GPU Overdraw, which is often the most direct point of contact for developers. This topic is split into two parts: Part 1 covers the theory and optimization suggestions, and Part 2 will walk through a practical optimization example.
What is Overdraw?
GPU Overdraw refers to the system drawing more than one layer on a single pixel during a frame. For example, if a TextView has a background color, the pixels displaying the text are drawn twice: once for the background and once for the characters. Overdraw inevitably impacts performance because memory bandwidth is finite. When overdraw exceeds the available bandwidth, the frame rate drops. Bandwidth limits vary significantly across different devices.