Android Performance

loading
Android Perfetto Series 8: Understanding Vsync Mechanism and Performance Analysis

This is the eighth article in the Perfetto series, providing an in-depth introduction to the Vsync mechanism in Android and its representation in Perfetto. The article will analyze how the Android system performs frame rendering and composition based on Vsync signals from Perfetto’s perspective, covering core concepts such as Vsync, Vsync-app, Vsync-sf, and VsyncWorkDuration.

With the popularization of high refresh rate screens, understanding the Vsync mechanism has become increasingly important. This article uses 120Hz refresh rate as the main narrative thread to help developers understand the working principles of Vsync in modern Android devices, and how to observe and analyze Vsync-related performance issues in Perfetto.

Note: This article is based on Android 16’s latest architecture and implementation

Android Perfetto Series 5: Choreographer-based Rendering Flow

This article introduces Choreographer, a class that App developers may not frequently encounter but is critically important in the Android Framework rendering pipeline. We will cover the background of its introduction, a brief overview, partial source code analysis, its interaction with MessageQueue, its application in APM (Application Performance Monitoring), and some optimization ideas for Choreographer by mobile phone manufacturers.

The introduction of Choreographer is mainly to cooperate with Vsync to provide a stable Message processing timing for upper-layer application rendering. When the Vsync signal arrives, the system controls the timing of each frame’s drawing operation by adjusting the Vsync signal cycle. Currently, the screen refresh rate of mainstream mobile phones has reached 120Hz, which means refreshing once every 8.3ms. The system adjusts the Vsync cycle accordingly to match the screen refresh frequency. When each Vsync cycle arrives, the Vsync signal wakes up the Choreographer to execute the application’s drawing operation. This is the main purpose of introducing Choreographer. Understanding Choreographer can also help application developers deeply understand the operating principle of each frame, and at the same time deepen their understanding of core components such as Message, Handler, Looper, MessageQueue, Input, Animation, Measure, Layout, and Draw. Many APM (Application Performance Monitoring) tools also utilize the combination mechanisms of Choreographer (via FrameCallback + FrameInfo), MessageQueue (via IdleHandler), and Looper (via custom MessageLogging) for performance monitoring. After deeply understanding these mechanisms, developers can conduct performance optimization more specifically and form systematic optimization ideas.

Android Perfetto Series Catalog

With Google announcing the deprecation of Systrace in favor of Perfetto, Perfetto has essentially replaced Systrace in my daily workflow. Major manufacturers like OPPO and vivo have also transitioned to Perfetto. Many developers new to Android performance optimization find Perfetto’s complex interface and features overwhelming, which is why I’ve decided to re-present my previous Systrace articles using Perfetto.

Performance Considerations in Operating System Design

[!NOTE]
This article was originally written by Yingyun for my Knowledge Planet. Since the Planet has closed, I am publishing this series on OS performance design here.

Yingyun is a veteran performance optimization expert with deep insights into system-level tuning, having worked at several major smartphone manufacturers. He is currently active in our community. If you have any questions or feedback, feel free to join our WeChat group.

1. The Genesis

This starts a new series exploring the various considerations in OS architectural design. In reality, these principles apply to the design of any large-scale software.

These views are my own and carry a subjective perspective. I welcome different viewpoints and hope that through their collision, we can all reach a deeper understanding of the field.

[Sticky] Blog Article Directory

The content of this blog mainly focuses on Android development and optimization-related topics, including the use of performance tools, Android App optimization knowledge, Android Framework explanations, and performance theory. Here is an organized directory for your reference. You can choose the parts you are interested in. This directory includes not only blog content but also some of my answers on Zhihu or the Knowledge Planet - The Performance. This directory lists my original blog posts. Additionally, I have collected some excellent articles in Must-Knows for Android Performance Optimization, which I update periodically.

Detailed Explanation of Android Rendering Mechanism Based on Choreographer

This article introduces Choreographer, a class that app developers rarely encounter but is crucial in the Android Framework rendering pipeline. It covers the background of Choreographer‘s introduction, an overview, source code analysis, its relationship with MessageQueue, its use in APM, and optimization ideas from mobile manufacturers.

Choreographer was introduced to coordinate with Vsync, providing a stable timing for handling Messages in app rendering. When Vsync arrives, the system adjusts the Vsync signal period to control the timing of drawing operations for each frame. Most phones currently have a 60Hz refresh rate (16.6ms). To match this, the system sets the Vsync period to 16.6ms, waking Choreographer every period to perform app drawing—this is its primary role. Understanding Choreographer also helps developers grasp the principles of frame execution and deepens knowledge of Message, Handler, Looper, MessageQueue, Measure, Layout, and Draw.

Some Thoughts on Android System Fluency

I’ve long wanted to write about Android system fluency because it’s the most direct aspect of the user experience. The long-standing criticism that Android “gets laggier over time” still casts a shadow over the platform, and it’s a primary reason many users default to iPhone.

Because Google keeps Android open, different manufacturers produce devices with vastly different hardware, and app quality varies wildly. Consequently, fluency is affected by countless factors. It’s rarely just “the system isn’t optimized.” Often, two devices with the same OS but different SOCs offer completely different experiences.

In this post, I want to discuss the factors affecting Android fluency from several perspectives:

  1. Hardware
  2. System
  3. Applications
  4. The Optimization Loop
Zhihu: Save Your StartingWindow

It’s often said that the overall iOS experience is superior to Android. This is partly due to third-party software quality (iOS versions are often more polished) and partly due to Apple’s tight control over its ecosystem. To get on the App Store, you must pass rigorous reviews.

Today, we’ll discuss a major differentiator between iOS and Android: the StartingWindow (colloquially, the Splash Screen). While both systems have them, their implementations vary wildly. iOS requires a StartingWindow—usually a static image—that displays immediately upon an icon tap with zero delay. Android, being open, allows developers to customize, disable, or even make the StartingWindow transparent.

Android App Startup Optimization - DelayLoad Implementation and Principles (Part 1)

In Android development, startup speed is a critical metric, and optimization is a vital process. The core philosophy of startup optimization is “doing less” during launch. Typical practices include:

  1. Asynchronous Loading
  2. Delayed Loading (DelayLoad)
  3. Lazy Loading

Most developers who have worked on startup optimization have likely used these. This article dives deep into a specific implementation of DelayLoad and the underlying principles. While the code itself is simple, the mechanics involve Looper, Handler, MessageQueue, VSYNC, and more. I’ll also share some edge cases and my own reflections.

RenderThread Workflow in Android hwui

Preface

This article serves as a set of learning notes documenting the basic workflow of RenderThread in hwui as introduced in Android 5.0. Since these are notes, some details might not be exhaustive. Instead, I aim to walk through the general flow and highlight the key stages of its operation for future reference when debugging.

The image below shows a Systrace capture of the first Draw operation by the RenderThread during an application startup. We can trace the RenderThread workflow by observing the sequence of events in this trace. If you are familiar with the application startup process, you know that the entire interface is only displayed on the phone after the first drawFrame is completed. Before this, the user sees the application’s StartingWindow.

Android Performance Patterns: Profile GPU Rendering

Series Catalog:

  1. Overview of Android Performance Patterns
  2. Android Performance Patterns: Render Performance
  3. Android Performance Patterns: Understanding Overdraw
  4. Android Performance Patterns: Understanding VSYNC
  5. Android Performance Patterns: Profile GPU Rendering

“If you can measure it, you can optimize it” is a common term in the computing world, and for Android’s rendering system, the same thing holds true. In order to optimize your pipeline to be more efficient for rendering, you need a tool to give you feedback on where the current perf problems lie.

In this video, Colt McAnlis walks you through an on-device tool built for this exact reason. “Profile GPU Rendering” will help you understand the stages of the rendering pipeline, see which portions might be taking too long, and decide what to do about it in your application.

Profile GPU Rendering Tool

Rendering performance issues are often the culprits stealing your precious frames. These problems are easy to create but also easy to track with the right tools. Using the Profile GPU Rendering tool, you can see right on your device exactly what is causing your application to stutter or slow down.

Android Performance Patterns: Understanding VSYNC

Series Catalog:

  1. Overview of Android Performance Patterns
  2. Android Performance Patterns: Render Performance
  3. Android Performance Patterns: Understanding Overdraw
  4. Android Performance Patterns: Understanding VSYNC
  5. Android Performance Patterns: Profile GPU Rendering

Unbeknownst to most developers, there’s a simple hardware design that defines everything about how fast your application can draw things to the screen.

You may have heard the term VSYNC - VSYNC stands for vertical synchronization and it’s an event that happens every time your screen starts to refresh the content it wants to show you.

Effectively, VSYNC is the product of two components: Refresh Rate (how fast the hardware can refresh the screen), and Frames Per Second (how fast the GPU can draw images). In this video, Colt McAnlis walks through each of these topics and discusses where VSYNC (and the 16ms rendering barrier) comes from, and why it’s critical to understand if you want a silky smooth application.

Basic Concepts

To develop a high-performance application, you first need to understand how the hardware works. The perceived speed of an app is often misunderstood as a raw hardware processing problem, but the real root is often rendering performance. To improve rendering, you must understand VSYNC.

Android Performance Patterns: Understanding Overdraw

Series Catalog:

  1. Overview of Android Performance Patterns
  2. Android Performance Patterns: Render Performance
  3. Android Performance Patterns: Understanding Overdraw
  4. Android Performance Patterns: Understanding VSYNC
  5. Android Performance Patterns: Profile GPU Rendering

One of the most problematic performance problems on Android is the easiest to create; thankfully, it’s also easy to fix.

OVERDRAW is a term used to describe how many times a pixel has been re-drawn in a single frame of rendering. It’s a troublesome issue, because in most cases, pixels that are overdrawn do not end up contributing to the final rendered image. As such, it amounts to wasted work for your GPU and CPU.

Fixing overdraw has everything to do with using the available on-device tools, like Show GPU Overdraw, and then adjusting your view hierarchy in order to reduce areas where it may be occurring.

What is Overdraw?

At the beginning of the video, the author uses a house painter as an analogy: painting a wall is hard work, and if you have to repaint it because you don’t like the color, the first layer was a waste of effort. Similarly, in your application, any work that doesn’t end up on the final screen is wasted. When you try to balance high performance with perfect design, you often run into a common performance issue: Overdraw!

Overdraw represents a situation where a single pixel on the screen is painted more than once within a single frame. As shown in the image below, imagine a stack of overlapping cards. The active card is on top, while the inactive ones are buried beneath. This means the effort spent rendering those buried cards is wasted because they are invisible to the user. We are wasting GPU time rendering things that don’t contribute to the final image.

Android Performance Patterns: Render Performance

Series Catalog:

  1. Overview of Android Performance Patterns
  2. Android Performance Patterns: Render Performance
  3. Android Performance Patterns: Understanding Overdraw
  4. Android Performance Patterns: Understanding VSYNC
  5. Android Performance Patterns: Profile GPU Rendering

Rendering performance is all about how fast you can draw your activity, and get it updated on the screen. Success here means your users feeling like your application is smooth and responsive, which means that you’ve got to get all your logic completed, and all your rendering done in 16ms or less, each and every frame. But that might be a bit more difficult than you think.

In this video, Colt McAnlis takes a look at what “rendering performance” means to developers, alongside some of the most common pitfalls that are ran into; and let’s not forget the important stuff: the tools that help you track down, and fix these issues before they become large problems.

Android Rendering Knowledge

When you think you’ve developed a world-changing app, your users might not agree. They might think your app is slow and laggy, failing to achieve the smoothness they expect, let alone changing the world. Recycle bin, here it comes! Wait! My app is perfectly smooth on my Nexus 5? How can you say it’s slow? If you know anything about Android fragmentation, you’d know that many low-end phones don’t have the powerful processor and GPU of a Nexus 5, nor do they have an unpolluted stock system.

If a large number of users complain that your app is laggy, don’t just blame their hardware. Sometimes the problem lies within the app itself, meaning your Android app has serious rendering performance issues. Only by understanding the root cause can you solve the problem effectively. Thus, knowing how Android rendering works is essential for any Android developer.

Overview of Android Performance Patterns

Series Catalog:

  1. Overview of Android Performance Patterns
  2. Android Performance Patterns: Render Performance
  3. Android Performance Patterns: Understanding Overdraw
  4. Android Performance Patterns: Understanding VSYNC
  5. Android Performance Patterns: Profile GPU Rendering

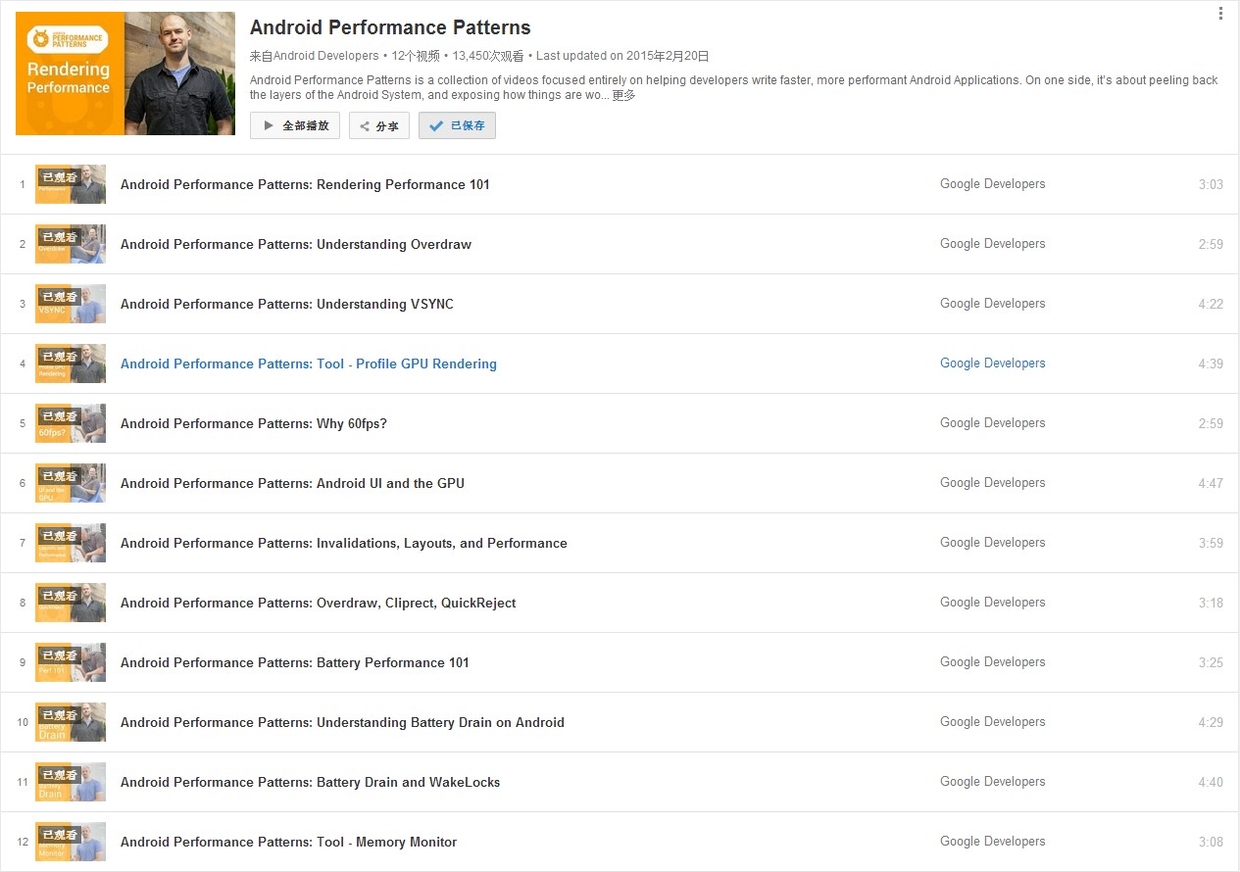
On January 6, 2015, Google officially released a series of short videos about Android performance optimization titled Android Performance Patterns. This series is available on YouTube.

Android Performance Patterns Overview

Official Introduction:

Android Performance Patterns is a collection of videos focused entirely on helping developers write faster, more performant Android Applications. On one side, it’s about peeling back the layers of the Android System, and exposing how things are working under the hood. On the other side, it’s about teaching you how the tools work, and what to look for in order to extract the right perf out of your app.

But at the end of the day, Android Performance Patterns is all about giving you the right resources at the right time to help make the fastest, smoothest, most awesome experience for your users. And that’s the whole point, right?

In short, it’s a series of videos explaining Android performance. These videos are very short, typically between 3 to 5 minutes. The speakers talk very fast, which was quite a challenge for non-native listeners before subtitles were available. The good news is that these videos now have full subtitles.

While the videos are short, they are packed with information. A single sentence mentioned by the speaker might require hours of research to understand the underlying principle or how to use a specific debugging tool. This means the series doesn’t directly teach you “how to optimize your app” step-by-step; rather, it tells you what you need to know about Android performance so that you know which tools to use, what steps to take, and what goals to aim for.

Android Performance Optimization - Introduction to Systrace (Part 1)

Note: This content is outdated. Please refer to the new Systrace Series Articles for updated information.

This is the first article in the Android Performance Optimization Tools series. This series mainly introduces the tools used during the Android performance optimization process, how to use these tools to discover problems, and how to solve them. In terms of performance optimization, Android provides many performance tools for everyone to use. Following our consistent “discover problem - solve problem” thinking, discovering the problem is the most important part. Trying to solve a problem without first identifying it properly often leads to half the effort for twice the result.

In this article, we’ll start with a brief introduction to the Systrace tool.

Introduction to Systrace

Systrace is a performance data sampling and analysis tool introduced in Android 4.1. It helps developers collect execution information from key Android subsystems (such as SurfaceFlinger, WindowManagerService, and other critical Framework modules, services, and the View system), allowing for a more intuitive analysis of system bottlenecks and performance improvements.

Systrace’s capabilities include tracking system I/O operations, kernel workqueues, CPU load, and the health of various Android subsystems. On the Android platform, it’s composed of three main parts:

  • Kernel Space: Systrace leverages the ftrace feature in the Linux Kernel. Therefore, to use Systrace, the relevant ftrace modules in the kernel must be enabled.
  • Data Collection: Android defines a Trace class that applications can use to output statistical information to ftrace. Additionally, the atrace program in Android reads statistical info from ftrace and passes it to data analysis tools.
  • Data Analysis Tools: Android provides systrace.py (a Python script located in Android SDK directory/platform-tools/systrace that calls atrace internally) to configure data collection (such as tags, output filename, etc.), collect ftrace statistics, and generate a resulting HTML file for user viewing. Essentially, Systrace is a wrapper around the Linux Kernel’s ftrace. Applications need to utilize the Trace class provided by Android to use Systrace.

Official documentation and usage for Systrace can be found here: Systrace