


When I wrote the SmartPerfetto open-source introduction on April 29, the headline was still “put an AI Assistant that can run SQL, invoke Skills, and generate reports inside the Perfetto UI.” Two weeks later the repository has moved a long way. The feature surface expanded from single-trace Q&A to reusable analysis results, multi-trace comparison, dual Claude/OpenAI runtimes, SQL guardrails, evidence-source indexing, no-install packages, rendering-pipeline teaching, and a more complete Provider diagnostic flow.
This article is based on the SmartPerfetto repository state as of May 17, 2026, and adds a new feature description on top of the previous post. Readers should walk away knowing three things: what was added in the past two weeks, where the current full feature boundary sits, and what information a good bug report should include.
Project links:
- SmartPerfetto main repository: https://github.com/Gracker/SmartPerfetto
- Previous open-source introduction: https://www.androidperformance.com/en/2026/04/29/SmartPerfetto-Open-Source-Perfetto-AI-Assistant/
What Changed Most in Two Weeks
Several numbers from the previous article are already outdated. Back then the repository had 165 YAML Skills and 12 scene strategies. In the current repository state, backend/skills/ has 220 *.skill.yaml files, and after excluding _template that comes to 216 functional Skill files. backend/strategies/ has 18 .strategy.md files and 26 .template.md files.
This is not a matter of piling files on top of files. The changes land in six areas that users will actually feel:
| Direction | Previous main path | Current state |
|---|---|---|
| Trace analysis | Ask questions, run Skills, view reports on a single trace | The original path is preserved, plus selection-based follow-up questions, result snapshots, and cross-window result comparison |
| Multi-trace comparison | Pick a reference trace in the current window, mostly real-time | New analysis result snapshots that compare completed results without requiring another window to stay open |
| Model integration | Claude Agent SDK was the main path | Claude Agent SDK and OpenAI Agents SDK are both first-class runtimes |
| Provider configuration | Mainly through .env and README notes |
UI Provider Manager, active profile, env fallback, and /health diagnostics work together |
| Evidence reliability | Mostly relied on prompts to constrain how the model wrote SQL and cited evidence | SQL stdlib guardrail, final executable SQL, evidence IDs, data-source notes, and sentence-level data citations enter the contract |
| Runtime and distribution | Docker and local source were the focus | Docker, Windows/macOS/Linux no-install packages, local source, and CLI/API are all part of the docs and release flow |
The past two weeks also fixed a batch of usability edge cases. The large-trace upload limit moved up to 5 GiB with admission and disk pre-checks; the startup script now cleans orphan trace_processor_shell processes and opens the browser automatically; Linux glibc issues, IPv6-disabled hosts, Claude SDK native binary selection, Docker env provider priority, OpenAI/MiMo tool calling compatibility, and Perfetto frontend prebuilt asset verification all received fixes.
These fixes do not look like new features, but they decide whether a real user can finish analyzing the first real trace.
Current Full Feature Map
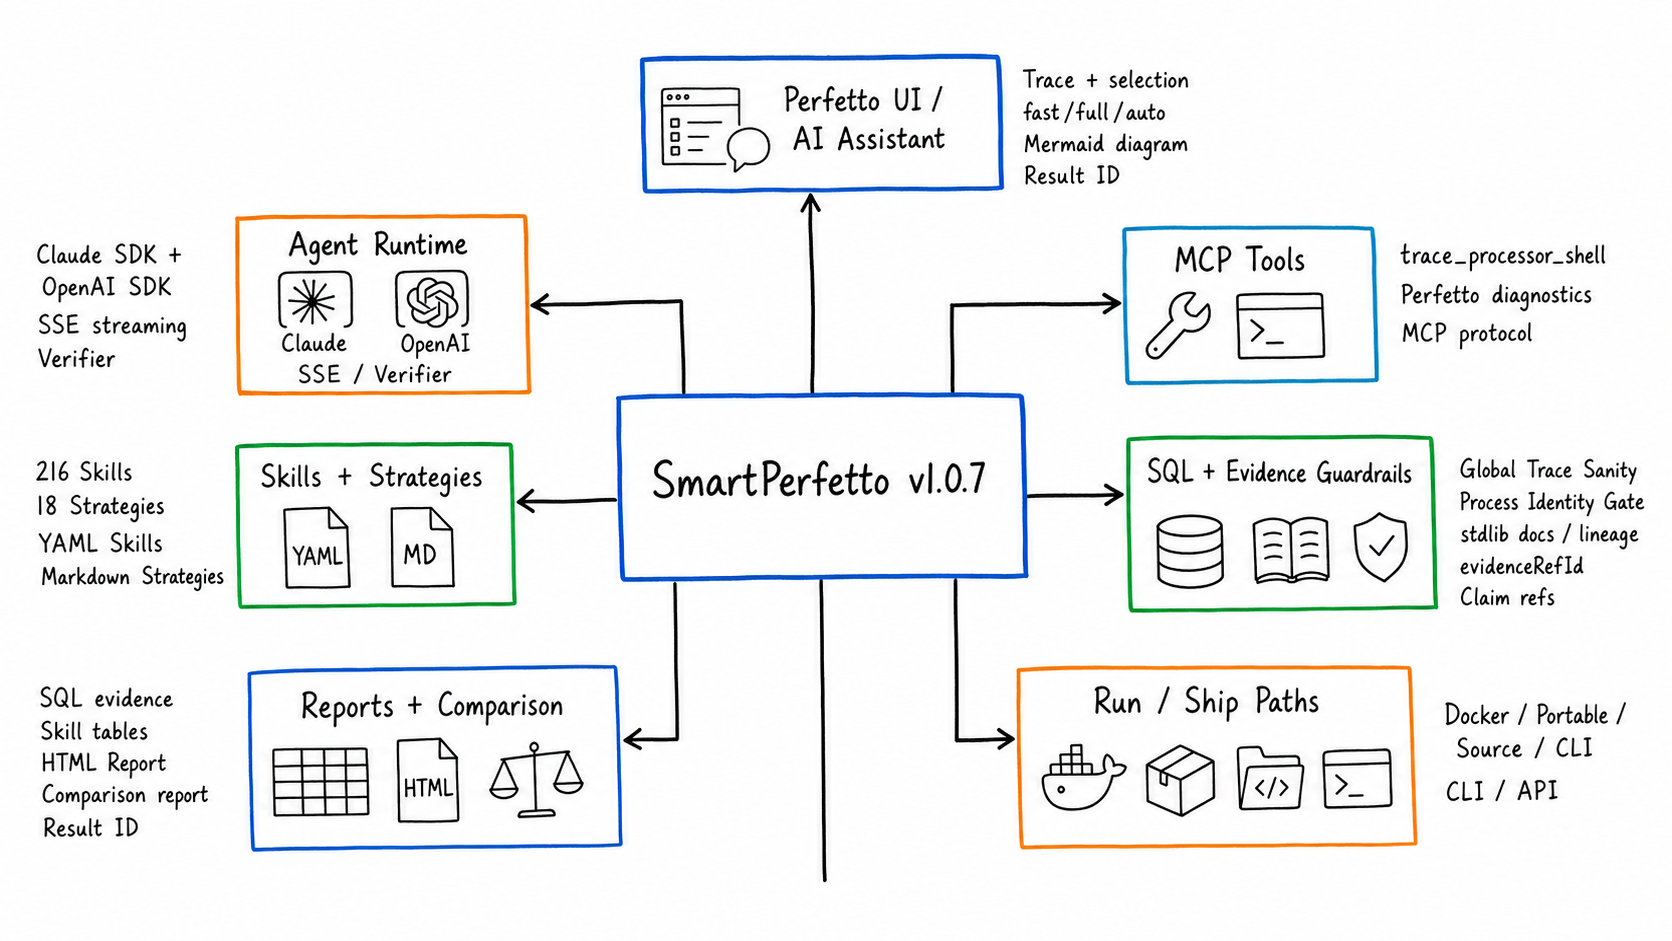
SmartPerfetto now reads as five layers: entry, analysis, evidence, output, and runtime.
| Capability | Current behavior | Fitting scenarios |
|---|---|---|
| AI Assistant inside Perfetto UI | Load .pftrace / .perfetto-trace and ask questions directly; supports fast, full, and auto analysis modes |
Daily trace inspection, quickly asking about package, process, startup, scrolling, ANR |
| Selection and event context | Perfetto area selection / track event selection are passed to the backend as selectionContext |
Analyzing just a time window, a single frame, or what happened around a suspicious slice |
| Common scene strategies | 18 strategies covering startup, scrolling, ANR, interaction, touch, memory, power, network, media, game, pipeline, teaching, overview, and more | Routing natural-language questions to the right SQL, Skill, and output format |
| YAML Skill system | 216 functional Skill files covering atomic, composite, deep, pipeline, comparison, module, and other types | Encoding Perfetto SQL, display columns, layered results, and boundary handling as reusable analysis units |
| SQL and Skill evidence | Results retain SQL, Skill tables, timestamps, threads, slices, and metric sources | Mapping the “model’s judgment” back to trace data for review |
| SQL guardrail and stdlib knowledge base | Raw SQL gets stdlib includes auto-completed; Skill validator checks table/function/macro dependencies; SQL display and copy use the final executable SQL | Reducing misjudgment caused by Perfetto stdlib migrations, missing includes, or unsafe creates |
| Global Trace Sanity | global_trace_sanity_check summarizes the longest slice, D-state, Runnable wait, Runqueue pressure, and CPU hot processes |
Looking at the global bottleneck before scene analysis so you do not fixate on one thread or one Skill |
| Evidence-source indexing | DataEnvelope carries evidenceRefId, traceSide, sourceToolCallId, plan phase, and producer reason; reports support sentence-level data citations |
When asking “where does this number come from in which table and which row,” there is a stable ID and row/column info |
| HTML analysis report | A report is generated after every analysis; the generic endpoint /api/reports/:reportId returns it |
Sharing with the team, pasting into issues, keeping as a regression record |
| Live trace comparison | The compare_arrows entry picks a reference trace and queries current/reference inside the same AI analysis round |
When both raw traces are accessible and you want to temporarily compare the current window with a reference |
| Multi-trace analysis-result comparison | The fact_check entry picks baseline/candidates, or you type a Result ID directly |
Comparing completed analysis results across runs; useful for A/B testing, version regression, multi-person collaboration |
| Provider Manager | Create, edit, and activate provider profiles in the UI; the active profile takes precedence over env fallback | Multi-model, multi-provider, multi-protocol testing without repeatedly editing .env |
| Dual SDK runtime | claude-agent-sdk and openai-agents-sdk are wired in separately and support Anthropic/Claude-compatible, OpenAI/Ollama/OpenAI-compatible |
Choosing the runtime that matches the provider’s real protocol capability |
| Rendering pipeline teaching | Teaching results are generated from App, RenderThread, Producer, SurfaceFlinger/HWC events observed in the current trace | Learning the Android rendering path while mapping static knowledge back to the actual trace |
| Productized upstream Perfetto diagnostics | heap graph, bitmap heap metadata, critical blocking calls, lock contention owner, Chrome scroll jank frame timeline land in YAML Skills | Turning upstream Perfetto analysis experience into executable SmartPerfetto evidence |
| Mermaid display | The AI Assistant expands Mermaid source blocks by default, refines rendering style, and supports click-to-zoom preview | Flowcharts, causal diagrams, and comparison diagrams in reports read better |
| API / CLI / MCP | Backend REST + SSE, the @gracker/smartperfetto CLI, MCP tool documentation |
Hooking into scripts, CI, internal platforms, or analyzing traces directly in the terminal |
| Runtime and distribution | Docker Hub, local source ./start.sh, Windows EXE, macOS App, Linux tarball |
Each user picks the least-dependency path for their environment |
| Enterprise / multi-tenant foundation | tenant/workspace, RBAC, provider isolation, scoped trace/report metadata, runtime dashboard, lease supervisor have landed on mainline | Foundation for team deployment and commercial support; large-scale external RSS/load validation is still tagged as future work in docs |
The most important thing to underline here is the evidence boundary. SmartPerfetto does not push the entire trace file into the prompt. The model only sees SQL results returned by backend tools, Skill output, report summaries, and structured context. Performance numbers still come from trace_processor_shell and deterministic computation inside Skills.
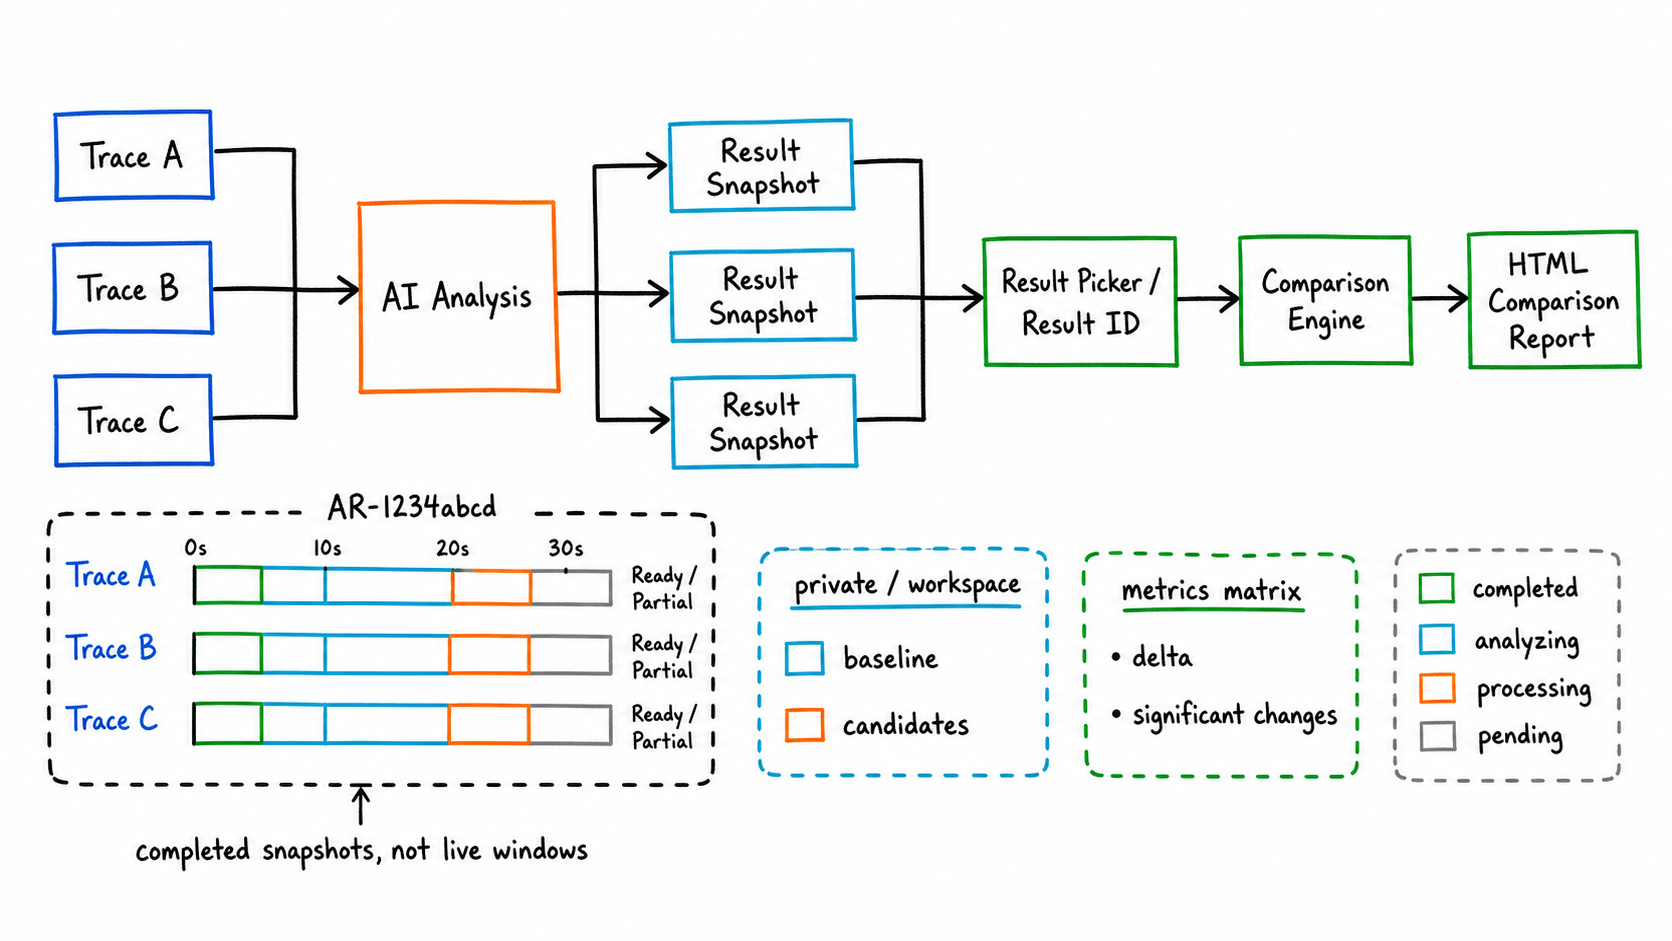
New Feature One: Multi-Trace Analysis Result Comparison
The older trace comparison is closer to “current window + reference trace” real-time analysis. That mode is still preserved and works well when you want the AI to query two raw traces in the same conversation.
The new multi-trace analysis-result comparison swaps the comparison subject. It compares completed analysis results. After every AI analysis finishes, SmartPerfetto saves key metrics, evidence references, the conclusion contract, and the report entry into an analysis result snapshot. When the UI shows Ready result or Partial result at the top, it means this analysis now has a reusable result.
There are two entry points:
- Type something like
compare with another one,compare AR-1234abcd, orcompare AR-11111111 and AR-22222222into the AI input box. - Click the
fact_checkicon at the top to open the result picker and manually choose the baseline and one or more candidates.
The problem this solves is not opening two traces at the same time; it is reusing completed analysis results. It does not require another Perfetto UI window to stay open, and it supports sharing within a workspace. Results are private by default; once a user explicitly shares one, users in the same workspace can include it as a candidate result for comparison.
Output happens in two layers:
- The chat message gives the Comparison ID, baseline/candidates, the number of significant changes, and the first few rows of key metrics.
- The HTML comparison report expands the standard metrics, the delta, the input snapshots, the significant changes, and the AI conclusion.
The currently standardized metrics focus on comparable items such as startup duration, FPS, Jank, and slow frames. When metrics are missing, the backend tries to backfill them. If the backfill fails, the comparison still completes but the missing reason is shown.
This is useful for performance regression work. A startup optimization, a scrolling feel adjustment, or a cross-device re-test can each finish AI analysis on its own trace and then sit inside the same comparison report so the differences are visible.
New Feature Two: SQL, Evidence Sources, and Upstream Diagnostic Capabilities
The part of the recent work that deserves the most explanation is how SmartPerfetto handles evidence sources. What the user sees is still conversation, tables, and reports. Internally there are three new layers of contract: how SQL becomes the final executable version, which tool call produced each table/summary, and which exact evidence row a number in the conclusion came from.
The first layer is the SQL guardrail. execute_sql, execute_sql_on, raw SQL auto include, and the Skill validator now share the same stdlib dependency analyzer that identifies tables, functions, macros, and INCLUDE PERFETTO MODULE directives inside SQL. This brings several direct benefits:
- When raw SQL references a Perfetto stdlib table or function, the backend does its best to auto-complete the required module.
- The Skill validator checks whether the
prerequisites.modulesdeclared in a Skill cover the stdlib tables/functions/macros actually used by the SQL. - The guardrail checks low-noise SQL risks such as repeatable
CREATE, safeSPAN_JOINusage, and direct parsing of theargstable. - When the AI Assistant displays and copies SQL, it uses the final executable SQL, run through the syntaqlite formatter. If the formatter fails, it falls back to the original SQL without blocking the analysis.
The boundary should be spelled out: the current guardrail is an engineering contract, not a full Perfetto SQL AST parser. It reduces frequent misjudgment but does not prove that every future Perfetto SQL syntax is statically covered.
The second layer is the stdlib docs and lineage knowledge base. The repository adds backend/data/perfettoSqlDocs.json, generated from upstream stdlib_docs.json, with module, entity, direct/transitive includes, and optional pfsql lineage status. lookup_sql_schema, list_stdlib_modules, and query_perfetto_source can return the official stdlib documentation, include relationships, and source-code search results to the Agent together. The model no longer needs to rely only on memory when writing SQL, and we do not need to hard-code every stdlib detail into the prompt.
The third layer is the data-source index. DataEnvelopes produced by SQL and Skills can carry evidenceRefId, traceSide, traceId, queryHash, sourceToolCallId, paramsHash, plan phase, toolNarration, and producerReason. The HTML report and the analysis result snapshot preserve these fields. The current report contract also adds “sentence-level data citations (structured sources)”: when key numbers, thread names, process names, frame counts, or percentages appear in the conclusion, they can be mapped to evidence_ref_id, source_ref, row_index / row_selector, column, and value.
Quick answers also use the same format. Internally we first derive the conclusion contract from the raw conclusion text, keep machine-readable evidence IDs, and then produce a cleaned-up version for the user. The analysis result snapshot persists this contract so that, when used later for multi-trace comparison or report review, the source references are not lost just because the frontend cleaned up the display.
This matters for debugging. Users do not have to just say “the AI conclusion is wrong”; they can point to Q1, a specific evidenceRefId, a specific Result ID, or a specific column of a specific table. Maintainers can then judge whether the problem lives in SQL, the Skill, the trace data source, the model summary, or report rendering.
This round also productized a batch of upstream Perfetto diagnostic experience into YAML Skills:
| Capability | SmartPerfetto landing point | User value |
|---|---|---|
| Global Trace Sanity | global_trace_sanity_check |
Look at the longest slice, D-state, Runnable wait, Runqueue pressure, and CPU hot processes before scene analysis |
| Process identity check | process_identity_resolver and the process identity gate |
Avoid Skills targeting the wrong object due to same-named processes, multi-process apps, or provider processes |
| Heap / Bitmap | android_heap_graph_summary, android_bitmap_memory_per_process |
When heap graph / bitmap tables exist, emit per-object and per-bitmap dimensions; degrade clearly when no data is available |
| Blocking calls | frame_blocking_calls |
Differentiates MainThread, RenderThread, Binder, and other thread roles while preserving the blocking source |
| Lock contention | lock_contention_in_range, lock_contention_analysis |
Outputs blocked thread, owner thread, owner TID, call site, and overlap duration |
| Chrome Scroll Jank | chrome_scroll_jank_frame_timeline |
Covers Chrome v3/v4 scroll jank, tagging, and preferred frame timeline availability |
These capabilities do not change SmartPerfetto’s core principle: the model explains and prioritizes, but the numbers still come from trace_processor_shell, SQL, Skills, and traceable data sources in reports.
New Feature Three: Provider Manager and Dual Runtimes
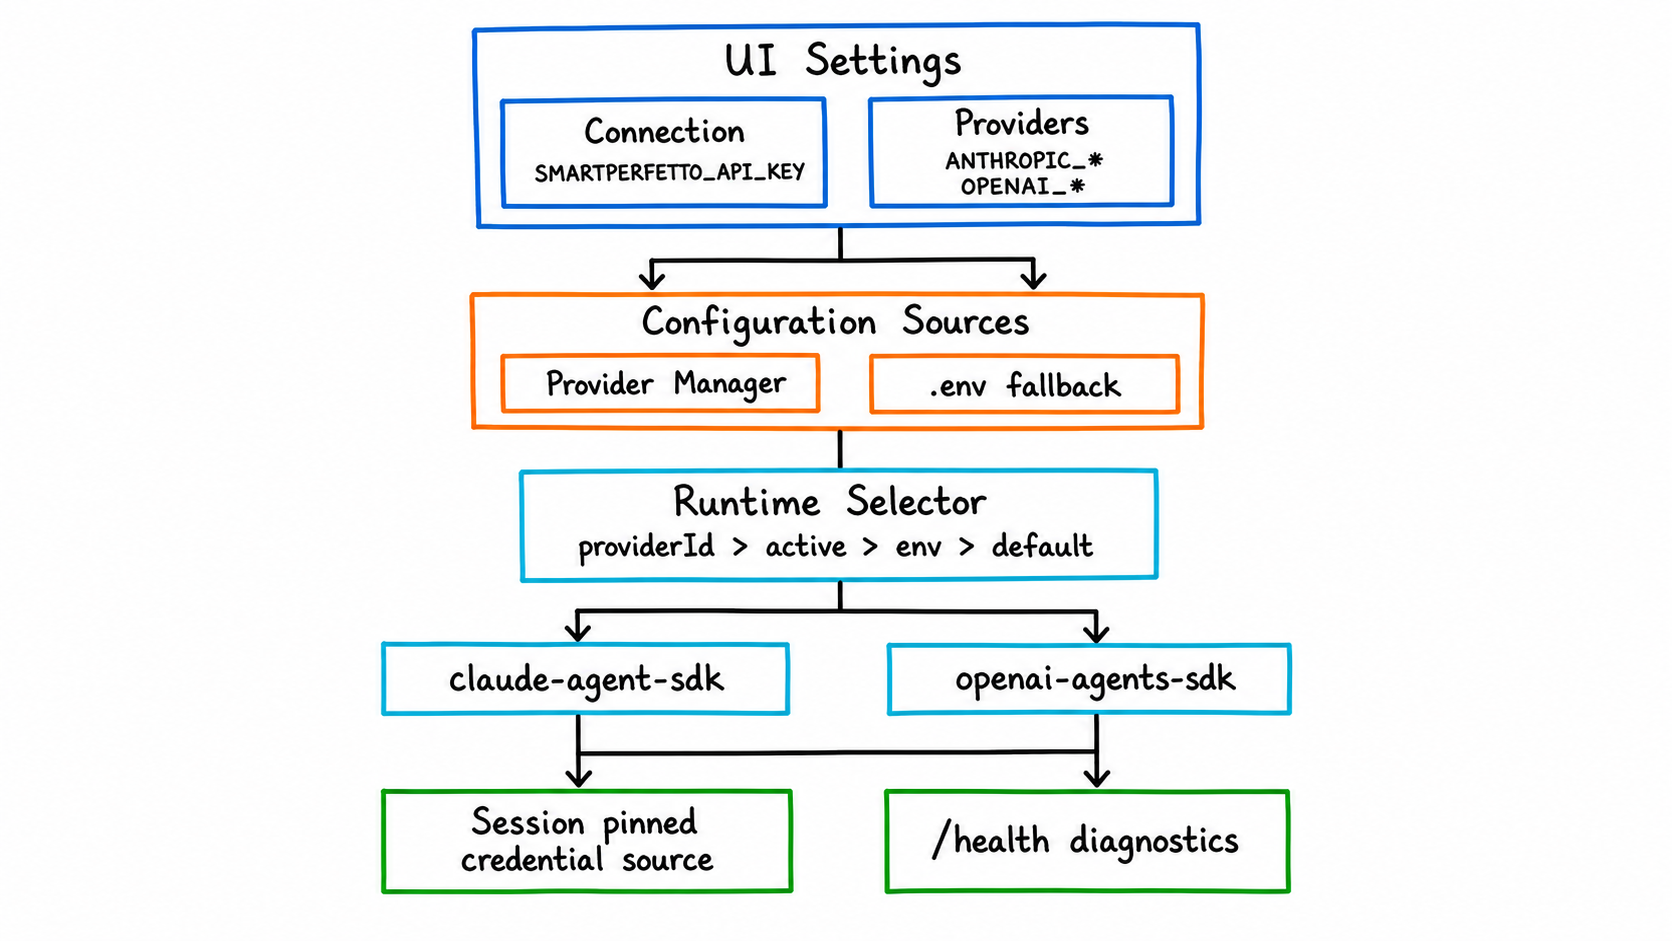
Model configuration in SmartPerfetto now has three boundaries:
Connectionconfigures the SmartPerfetto backend address and an optionalSMARTPERFETTO_API_KEY. It is not a model-vendor key.Providersconfigures model provider profiles, including Base URL, API key/token, model ID, and protocol type.- The runtime decides which SDK the backend uses to orchestrate tool calls:
claude-agent-sdkoropenai-agents-sdk.
Runtime selection priority is:
| Priority | Source |
|---|---|
| 1 | providerId in the request or session |
| 2 | Provider Manager’s currently active provider |
| 3 | SMARTPERFETTO_AGENT_RUNTIME in .env |
| 4 | Default claude-agent-sdk |
Claude Agent SDK fits Anthropic, Claude Code local auth, Bedrock, Vertex, and Anthropic/Claude-compatible providers. OpenAI Agents SDK fits the OpenAI Responses API, Ollama, and OpenAI-compatible gateways that support streaming tool/function calling.
Provider Manager profiles take precedence over .env fallback. An analysis session that has already been created pins the credential source at that moment. When that session is restored, it does not switch to a different model just because the active provider was changed afterwards. This constraint is important because multi-turn follow-up questions in trace analysis depend on the previous turn’s tool results and SDK session state.
When debugging, do not just look at .env. Open http://localhost:3000/health and inspect aiEngine.runtime, aiEngine.credentialSource, aiEngine.providerMode, and the diagnostics. Many provider presets come from public documentation and may change with account region, plan, or console domain. When connection fails, streaming output behaves oddly, or tool calls are unstable, check the Base URL, model ID, and protocol type in the provider’s own console first.
New Feature Four: Rendering Pipeline Teaching Moves From Static Docs to the Current Trace
The “rendering teaching” surface has been refactored over the past two weeks. The previous version was closer to “detect one main pipeline and show the matching Mermaid, the key slices, and the teaching doc.” The new goal is different: show what really happened between App, Framework, RenderThread, Producer, BufferQueue/Transaction, SurfaceFlinger/HWC, and present, based on the events actually observed in the current trace.
The new backend service builds an observedFlow:
lanesrepresent the roles observable in the current trace, such as app, render_thread, producer, buffer_queue, surfaceflinger, hwc_present.eventsrepresent real slice/thread/process/layer events withts,dur,durMs, evidence source, and optional frame/layer association.dependenciesrepresent confirmable dependencies, such as wakeups or critical path.completenessflags which signals are missing so static knowledge is not disguised as facts about this trace.
This is especially important for hybrid rendering. Producers such as WebView, Flutter, React Native, TextureView, SurfaceView, OpenGL ES, Vulkan, Camera, Video, and game engines cannot be flattened into a single “main pipeline.” SmartPerfetto now presents host HWUI and the producer separately, then explains whether there is a dependency between them based on evidence.
The value of the teaching feature is not memorizing the Android rendering pipeline for the user. It is mapping the knowledge back to the actual events in this trace. After reading, the user should know which paths have evidence in this trace and which paths cannot be confirmed because of capture gaps.
Usability Fixes in the Past Two Weeks
Beyond new features, the recent fixes mostly focus on “letting real users actually run the tool.”
| Fix direction | User-visible effect |
|---|---|
| 5 GiB trace upload | Larger traces can go through the upload path; the backend performs admission and disk pre-checks first, avoiding failures only at the end of a long upload |
| Startup script cleans orphan processes | A leftover trace_processor_shell from the previous abnormal exit no longer easily holds the port |
| Local startup auto-opens browser | After ./start.sh runs, the experience matches a normal daily tool |
| Linux glibc / IPv6-disabled host | Ubuntu 20.04 and IPv6-disabled environments start more reliably |
| Claude SDK native binary fallback | When the optional native package picks the wrong platform, the backend can fall back automatically |
| OpenAI/MiMo compatibility | Fixes for reasoning content, tool arguments, plan phases, startup_slow_reasons, and related compatibility issues |
| quick/full session isolation | When switching between fast/full/auto, lightweight context and full context no longer mix |
| Stale SDK conversation recovery | When Claude/OpenAI session handles expire, the backend recovers or degrades instead of dropping the second turn |
| Process identity gate | The Skill checks the target process identity before execution, avoiding SQL hitting the wrong target due to package names, process names, or multi-process scenarios |
| SQL stdlib guardrail | Missing stdlib includes, unsafe creates, and SPAN_JOIN or args parsing issues surface in the validator or guardrail stage |
| Cross-window result comparison | Result selection, heartbeat, and Result ID usage are more stable across multiple windows |
| Backend trace_processor isolation | Local traces and backend-created trace processor targets are handled separately, reducing the chance that the second trace uses the wrong target |
| Frontend prebuild asset guard | syntaqlite-*, trace_processor.wasm, trace_processor_memory64.wasm, and manifest hashes enter verification, reducing the risk of missing assets in no-install packages and Docker |
| Mermaid experience | Source is expanded by default, the style is clearer, and diagrams support click-to-zoom |
Many of these issues come from real GitHub issues and local reproduction. SmartPerfetto’s difficulty is not only “can the model analyze,” but also whether the state across model, Perfetto UI, backend SSE, trace_processor_shell, browser windows, and provider protocols stays consistent. Any state drift eventually shows up as “the AI result is unreliable.”
How to Choose a Runtime Today
For typical users, Docker or the no-install package is the first choice.
| Runtime | Who it fits | Notes |
|---|---|---|
| Docker Hub | Anyone who wants to try or deploy quickly | No Node.js, no submodule init; needs model credentials in .env or the UI Provider Manager |
| No-install package | Users who do not want to install Docker | Windows: unzip and double-click SmartPerfetto.exe; macOS: double-click SmartPerfetto.app; Linux: run ./SmartPerfetto |
Local source ./start.sh |
Developers who want to follow mainline | Uses the prebuilt frontend committed to the repository; daily backend/Skill/strategy changes do not require rebuilding Perfetto UI |
Dev mode ./scripts/start-dev.sh |
People modifying the AI Assistant plugin UI | Needs the perfetto/ submodule initialized; saves of frontend code trigger watch rebuilds |
CLI smp |
People who want to analyze traces in a terminal or script | Reuses agentv3, Skills, report generation, and local session storage |
Local source requires Node.js 24 LTS. The repository ships .nvmrc and .node-version, npm has engine-strict=true, and ./start.sh, ./scripts/start-dev.sh, and ./scripts/restart-backend.sh prefer switching to Node 24 through nvm/fnm.
The macOS no-install package currently uses ad-hoc signing to avoid being flagged as damaged by the system directly. Proper notarization still requires a Developer ID and a notary profile. This status should be spelled out in release notes so users do not treat Gatekeeper behavior as a backend problem.
Sponsorship and Commercial Support
SmartPerfetto’s open-source maintenance cost mainly comes from four areas: real-trace reproduction, model tokens, provider compatibility validation, and cross-platform release-package validation. The project accepts individual sponsorship, corporate sponsorship, AI Credits / token vendor sponsorship, and also commercial licensing and enterprise support consultations built around AGPL.
Individual sponsorship is suited to supporting open-source maintenance, test traces, documentation examples, and the model consumption for public demos. Individual sponsors can enter the README thank-you list; if a sponsor prefers anonymity, the project will simply record it as anonymous support.
Regular corporate sponsorship is suited to supporting long-term maintenance, issue reproduction, public documentation, and regression testing. Corporate sponsors can also enter the README thank-you list and have their company name and link displayed on the sponsor page. Deeper enterprise collaboration can be handled through commercial support, for example Android performance trace expert diagnostics, Perfetto / SmartPerfetto team training, enterprise on-prem deployment, custom YAML Skill / Strategy work, and commercial licensing or integration consulting.
LLM / API / token vendor sponsorship fits better with credits, token plans, trial accounts, or developer quotas that support SmartPerfetto. A tool like SmartPerfetto needs more than chat: it needs stable streaming output, tool/function calling, long-context recovery, structured arguments, and real trace analysis. Vendor sponsorship can be exchanged for three more direct forms of project support:
| Sponsor type | Project-side support |
|---|---|
| Individual sponsorship | README thank-you list; supports open-source maintenance and public-example costs |
| Regular corporate sponsorship | README thank-you list; sponsor page placement; entry point for enterprise support / training / diagnostics |
| LLM / token vendor sponsorship | Top-position sponsor placement in the README; Provider configuration notes; candidacy in the recommended models list; first-priority adaptation and regression validation |
The “recommended models” piece must be grounded in real validation. Sponsorship does not change SmartPerfetto’s default provider selection, compatibility conclusions, or technical judgments. If a model is unstable in real trace analysis, tool calling, or long-running reasoning, the documentation will say so honestly. Conversely, if a vendor provides sustainable credits and the model runs stably across real SmartPerfetto analysis tasks, it earns a more prominent README position, a place in the provider configuration guide, and recommendation in the model notes.
Contact still goes through the current sponsor page and the WeChat ID 553000664 in the README. Security issues, commercial licensing, and enterprise on-prem deployment requests should be discussed separately, not mixed into public bug issues.
How to Write a Good Bug Report
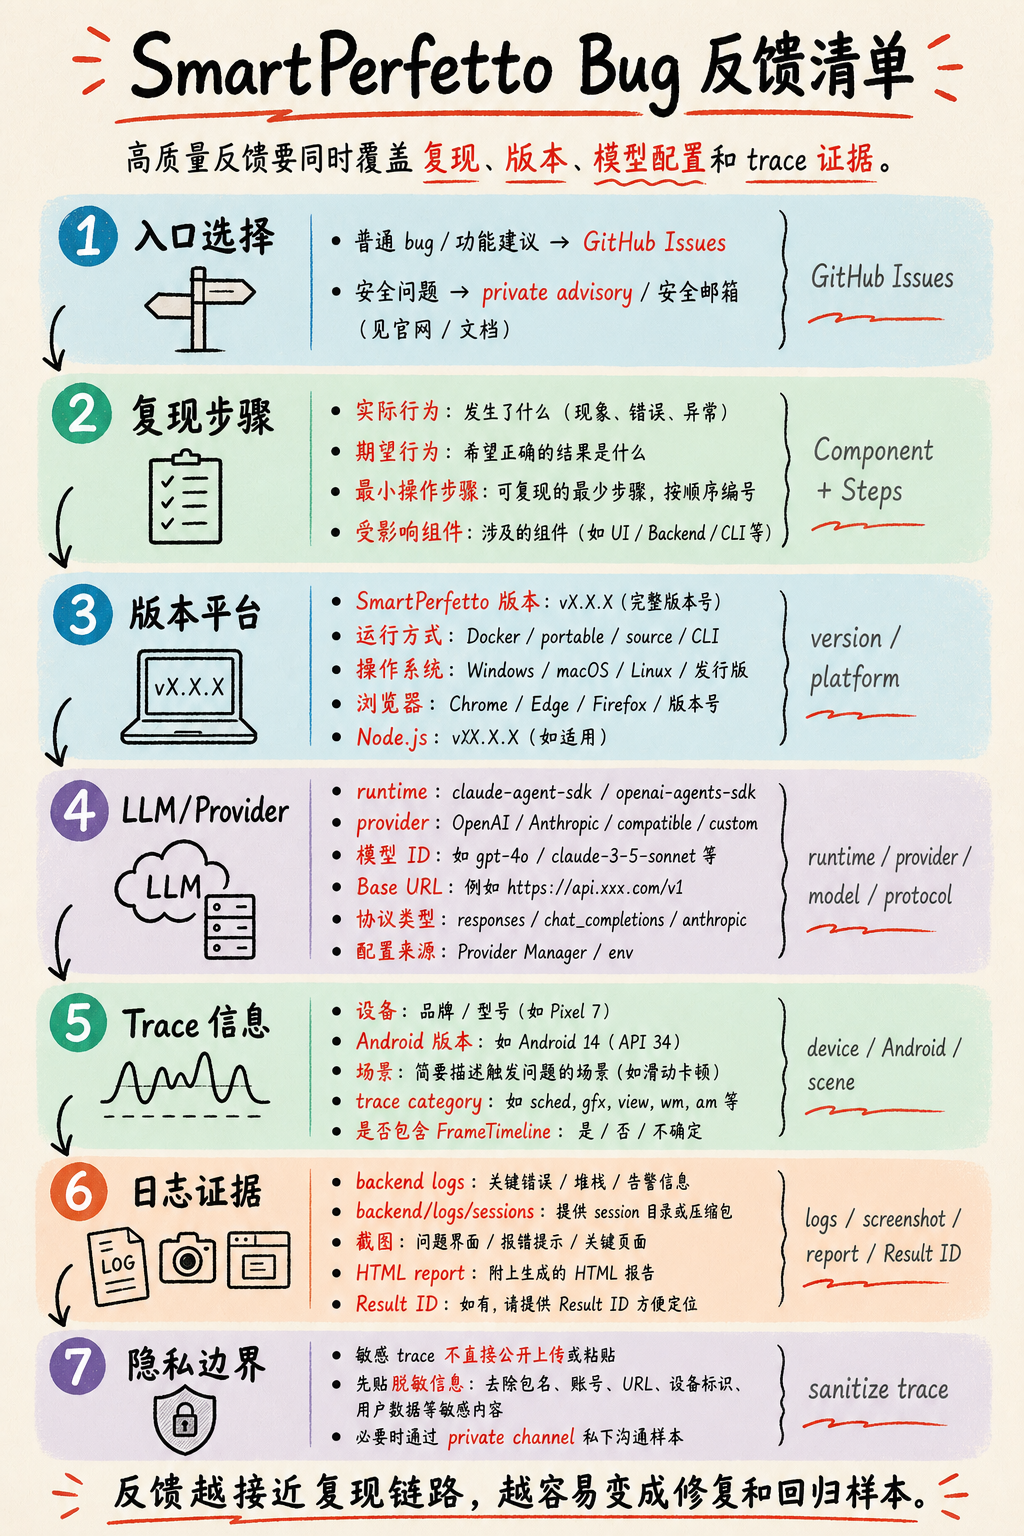
SmartPerfetto bug reports live in GitHub Issues. Security issues should not be filed as public issues; use GitHub private advisory or a security email instead.
A normal bug report should at minimum include the six fields the current template asks for: Description, Component, Steps to Reproduce, Trace Information, Logs / Screenshots, and Environment. For SmartPerfetto specifically, you should also fill in version, platform, and LLM configuration. Many issues are jointly affected by the provider protocol, the model’s tool calling, trace capture quality, and runtime session state, and cannot be handled as pure frontend or backend bugs.
A locatable report typically contains these fields:
| Category | What to write |
|---|---|
| SmartPerfetto version | Version number, commit, Docker image tag, or no-install package filename — at least one of these |
| Runtime | Docker Hub, source ./start.sh, dev mode, Windows/macOS/Linux no-install package, or CLI |
| Platform | OS version, browser, Node.js version; for the Docker path, also Docker Desktop/Engine and WSL2 status |
| Component | AI Analysis, Skills, Frontend UI Panel, Trace Processor, Backend API, Provider Manager, CLI, etc. |
| Reproduction steps | The minimal sequence of load-trace, click, input, and switch steps, with actual vs expected result |
| Trace information | Device, Android version, business scenario, trace category, whether FrameTimeline is included, trace size |
| LLM / Provider | Whether the runtime is claude-agent-sdk or openai-agents-sdk; provider name, model ID, Base URL, protocol type, and whether configuration comes from Provider Manager or .env |
| Analysis options | fast, full, or auto, and whether the mode was switched during multi-turn questions |
| Evidence pointers | Result ID, HTML report, evidenceRefId, sourceToolCallId, Q1/C1 from sentence-level data citations, related SQL or Skill tables |
| Evidence material | Backend logs, backend/logs/sessions/, screenshots, HTML report, Result ID, the aiEngine slice of /health |
| Privacy boundary | Traces may contain business and user data. Do not upload sensitive traces directly into a public issue; share desensitized info first and arrange private samples only when necessary |
For provider-related issues, separate “the model can chat” from “the model can do stable tool calls.” SmartPerfetto depends on streaming output, tool/function calling, context recovery, and structured arguments. A provider being fine in plain chat does not mean it can finish a full trace analysis.
For trace-related issues, document the capture conditions. Android 12+ traces that include FrameTimeline are a better fit for SmartPerfetto. Scrolling, startup, ANR, and GPU/rendering each need different categories. When the corresponding data source is missing, the correct behavior is to flag the missing signal, not to fabricate a definite conclusion.
When an analysis conclusion does not match expectations, prefer pasting the evidence location from the report. For example, if a conclusion claims “main thread Runnable wait 120ms,” paste the matching Q1/C1, evidenceRefId, table row, column name, and value. That kind of feedback can turn directly into a SQL fix, a Skill branch, or a report contract fix.
What Kind of Feedback Helps Most Right Now
What SmartPerfetto is short on right now is samples that can reproduce a problem, regress against a fix, and improve a Skill. Vague evaluations are hard to convert into code fixes or Skill improvements.
More useful feedback usually looks like this:
- “In a particular scrolling trace, SmartPerfetto blames jank on the RenderThread, but a manual review says it is a main-thread Binder wait.” Include the time window, frame ID, related SQL, or screenshots.
- “In a particular report, the sentence-level data citation points to the wrong row or is missing a critical value.” Include
Q1/C1,evidenceRefId, the Result ID, the HTML report, and a screenshot of the matching table. - “A particular provider produces malformed tool-call arguments under
openai-agents-sdk.” Include the runtime, provider, model ID, protocol type, and a session log. - “A particular device/vendor trace is missing common tables, causing a Skill to fail.” Include the Android version, the trace category, the failing Skill name, and the error log.
- “A particular Result ID cannot be found in multi-trace comparison.” Include the workspace, the visibility setting, the Result ID, the current window state, and the steps to reproduce.
A good bug report should turn into one of three things: a code fix, a Skill branch, or a regression test. A screenshot plus “the result is wrong” makes it hard to tell whether the issue lives in the trace, the model, the provider, the frontend state, or a backend tool.
Closing
The direction of SmartPerfetto’s changes in the past two weeks is clear: from “add an AI conversation window inside Perfetto” toward “turn trace analysis into a queryable, reusable, shareable, regression-friendly engineering system.”
The project is still in fast development. Public APIs, internal contracts, provider presets, and the enterprise deployment surface will continue to adjust. For typical users, the most stable path is running one of your own traces with Docker or the no-install package. For contributors, the most useful input is reproducible traces, evidence that explains the failure attribution, and SQL plus regression samples that can fold back into Skills or strategies.
If you already use Perfetto in Android performance work, SmartPerfetto is worth trying again now. The introduction from two weeks ago is no longer sufficient to describe the current repository state.