


The previous SmartPerfetto update was published on May 17. At that point the project had already moved from “an AI Assistant inside Perfetto UI” to “a reusable trace analysis platform.” By June 4, the new work is concentrated in five areas: Smart Mode, selected-range quick analysis, CLI capture, stronger evidence rules for Power / ANR / Input / IO / Network, and four Agent runtimes.
This article is based on the SmartPerfetto main branch on June 4, 2026. The latest public release at this point is v1.0.28. The goal is simple: list what changed after May 17, explain how runtimes and evidence sources are handled, and show what information makes a useful bug report.
Project links:
- SmartPerfetto main repository: https://github.com/Gracker/SmartPerfetto
- Previous update: https://www.androidperformance.com/en/2026/05/17/SmartPerfetto-Two-Week-Update/
2026-05-17 to 2026-06-04 Overview
The feature map in the previous article still showed SmartPerfetto v1.0.7. The public release is now v1.0.28. At this commit, the repository has 230 *.skill.yaml files. After excluding _template, 226 of them are functional Skill files. backend/strategies/ has 20 .strategy.md files and 35 .template.md files.
The count changed, but the useful change is not the count itself. Users will notice the changes in six areas:
| Area | May 17 state | Current state |
|---|---|---|
| Analysis entry | Ask questions inside Perfetto UI with fast / full / auto modes | Smart Mode starts with scene inventory, selected-range quick analysis only inspects the current range, and CLI uses the shared analysis core |
| CLI and capture | CLI / API were already documented and shipped | smp capture, smp analyze, compare workflows, CLI turn files, and npm package checks are now part of release verification |
| Scene coverage | startup, scrolling, ANR, interaction, touch, memory, power, network, and related strategies already existed | smart.strategy.md and io.strategy.md were added, and Power / ANR / Input / Display / IO / Network / Observability now have stricter evidence requirements |
| Evidence reliability | SQL guardrails, evidence IDs, and sentence-level citations were already in place | Failed SQL no longer becomes frontend evidence; final report checks, claim verification, and scene-specific evidence rules cover more scenes |
| Model integration | Claude Agent SDK and OpenAI Agents SDK were first-class runtimes | claude-agent-sdk, openai-agents-sdk, pi-agent-core, and opencode now share one output format |
| Release verification | Docker, portable packages, source, and CLI were in release docs | Before v1.0.28, all four runtimes passed startup / scrolling strict E2E, 6 canonical scene trace regressions, npm, portable, and Docker checks |
The main direction is clear: more scenes now have verifiable analysis flows. The model still explains and prioritizes. The numbers still come from trace_processor_shell, SQL, Skill tables, and structured evidence in reports.
Current Feature Map
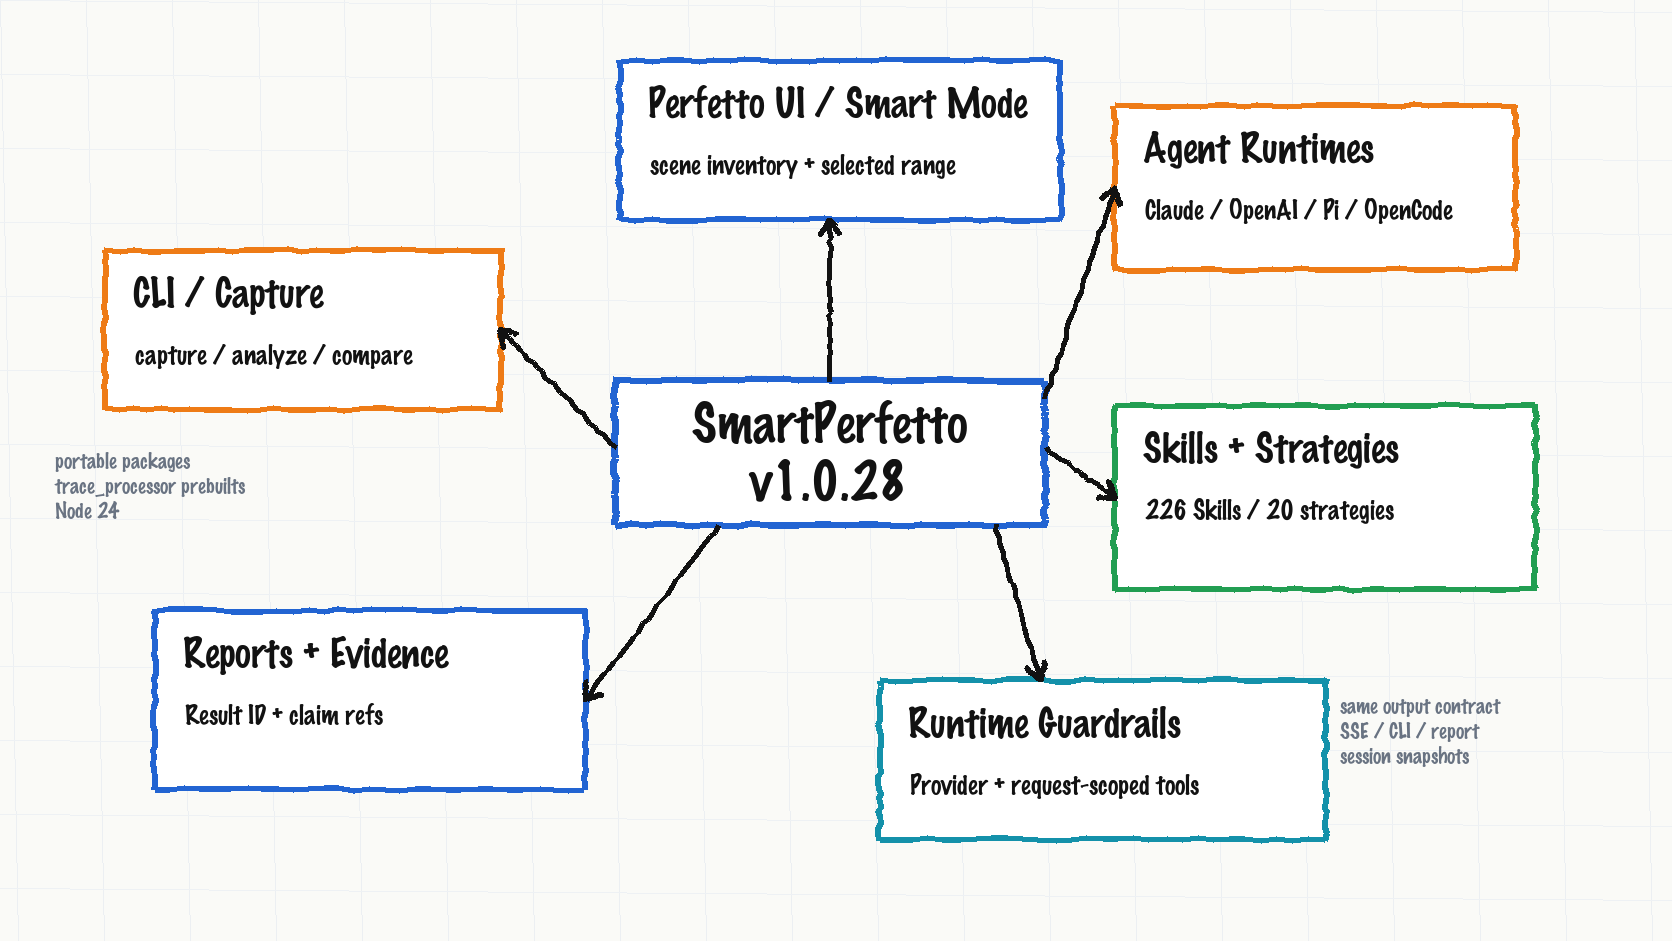
SmartPerfetto now has five practical layers: entry, analysis, evidence, runtime, and distribution.
| Surface | Current behavior | Good fit |
|---|---|---|
| Perfetto UI / Smart Mode | Load .pftrace / .perfetto-trace, ask questions directly, or let Smart Mode identify startup, scrolling, click, navigation, ANR, and device-state ranges first |
Mixed traces where you want to find the useful ranges before spending full-analysis tokens |
| Selected-range quick analysis | Perfetto area selection / track event selection carries selectionContext; the backend runs quick analysis in that bounded scope |
Understanding a short time window, one frame, or what happened around a suspicious slice |
| CLI / Capture | smp / smartperfetto reuse backend runtimes, MCP tools, Skills, reports, and session snapshots |
Terminal analysis, scripts, CI, and remote environments |
| Skills + Strategies | 226 functional Skill files, 20 scene strategies, and 35 templates covering startup, scrolling, ANR, interaction, memory, power, network, pipeline, IO, Smart Mode, and more | Routing natural-language questions to deterministic SQL, Skills, and report requirements |
| Reports + Evidence | HTML reports, Result IDs, analysis-result snapshots, claim refs, data-source narration, and CLI turn files are preserved together | Mapping “what the AI said” back to SQL, Skills, rows, and evidence IDs |
| Agent Runtimes | Claude, OpenAI, Pi Agent Core, and OpenCode are selected explicitly through Provider Manager or env config | Running one trace-analysis output format through different SDK or server orchestration modes |
| Runtime Guardrails | Provider Manager, request-scoped MCP tools, session snapshots, and /health diagnostics constrain runtime behavior |
Debugging cases where connection testing passes but the actual analysis runtime is not the one expected |
| Distribution | Docker Hub, Windows / macOS / Linux portable packages, source ./start.sh, and npm CLI all have verification |
Trial use, developer work, team deployment, and script integration |
One rule matters before everything else: SmartPerfetto does not push the whole trace into the prompt. The model sees SQL results returned by backend tools, Skill output, scene context, report summaries, and structured evidence. New runtimes do not bypass that rule.
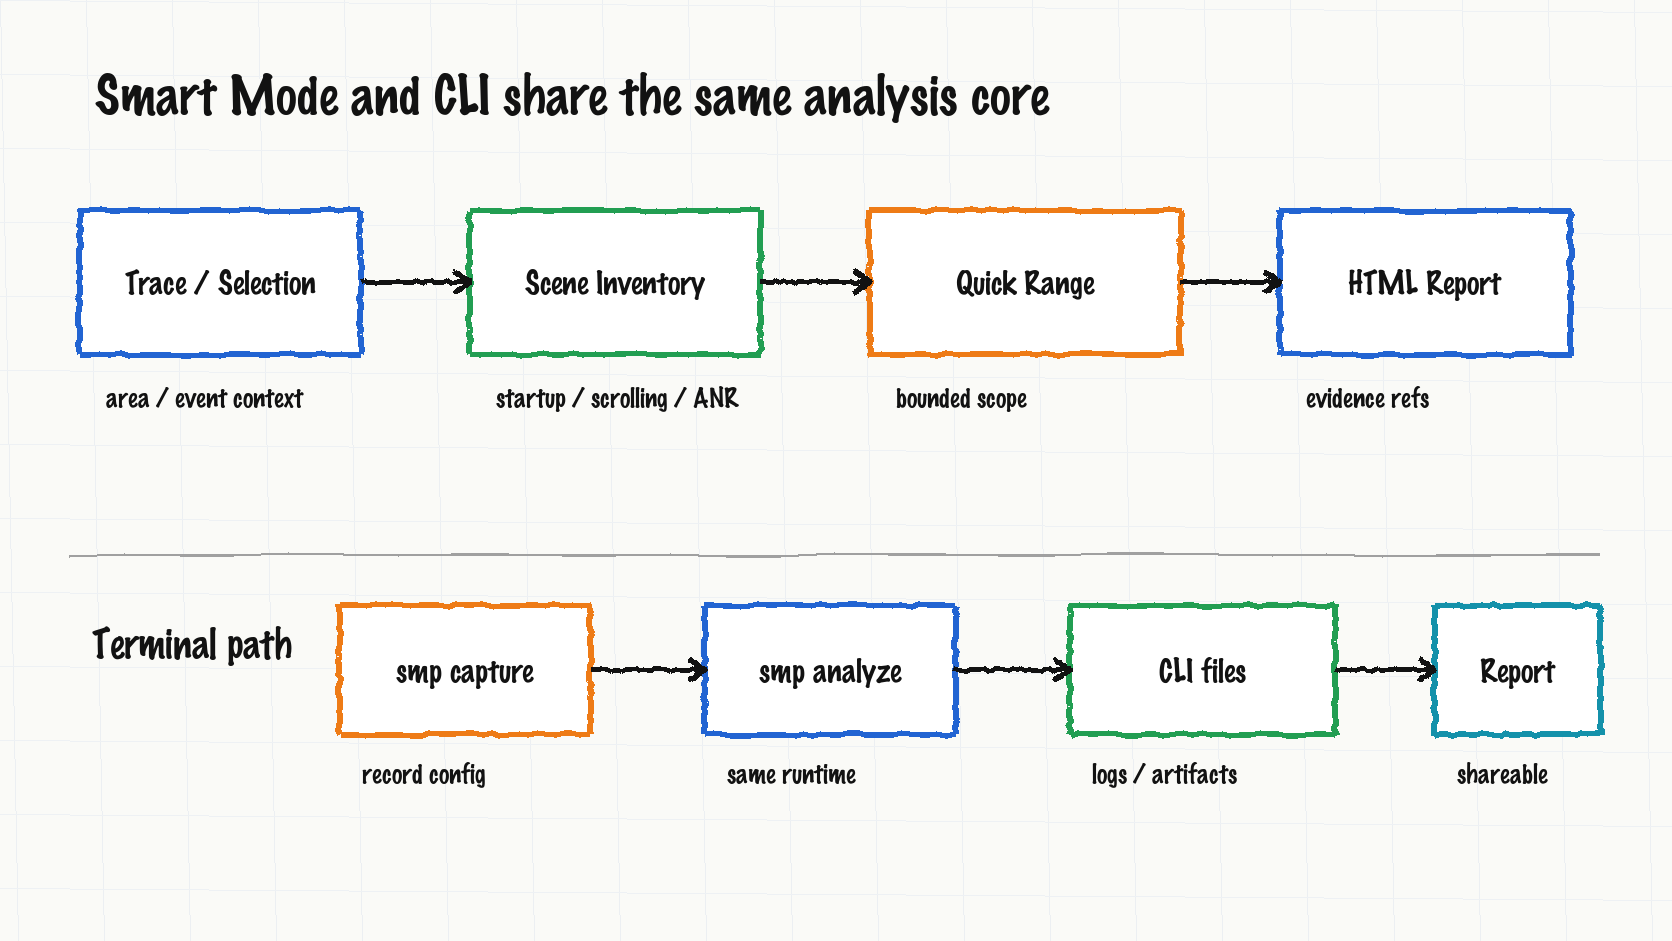
Feature One: Smart Mode, Selected-Range Quick Analysis, and CLI Share One Core
The previous article already covered fast / full / auto analysis modes. After May 17, SmartPerfetto added two more practical entries: Smart scene selection and range-scoped quick analysis.
Smart Mode starts with scene inventory. A mixed trace can contain startup, scrolling, clicks, navigation, ANR, and device-state changes in the same file. SmartPerfetto first identifies analyzable ranges, attaches eligibility, confidence, context, verification, and report IDs, then lets the user deep-dive all scenes or only one scene type.
Selected-range quick analysis solves a smaller but common problem. In Perfetto UI, users often select a time range or one track event and ask “why is this range slow?” or “what happened around this slice?” The backend now passes that selected context into the request. The quick path gathers evidence around that range instead of treating the whole trace as the analysis target.
The CLI entry also became a real terminal product instead of a thin backend wrapper. smp capture handles capture, smp analyze handles analysis, and compare workflows, session files, report output, and Provider/runtime selection reuse the Web logic. CLI does not start the Web UI, and it still uses the shared analysis core.
| Scenario | Before | Now |
|---|---|---|
| Mixed-trace triage | Inspect the timeline manually and ask about one scene | Smart Mode lists scenes first, then the user chooses what to deep-dive |
| A selected jank range | Copy timestamps or type a range manually | Selection context enters the backend; quick analysis stays in the selected range |
| Remote-machine capture | Capture with external tools, then move the trace into the UI | smp capture records the trace; smp analyze runs the shared Skills and report flow |
| Regression comparison | Pick a reference trace or Result ID in the UI | CLI compare workflows and analysis-result snapshots can be scripted |
This is the reason the four-runtime work can fit into the product. The entry may be UI, CLI, or API, but the implementation returns to AgentAnalyzeSessionService, Skills, MCP tools, and report checks.
Feature Two: Evidence Rules Now Cover More Scenes
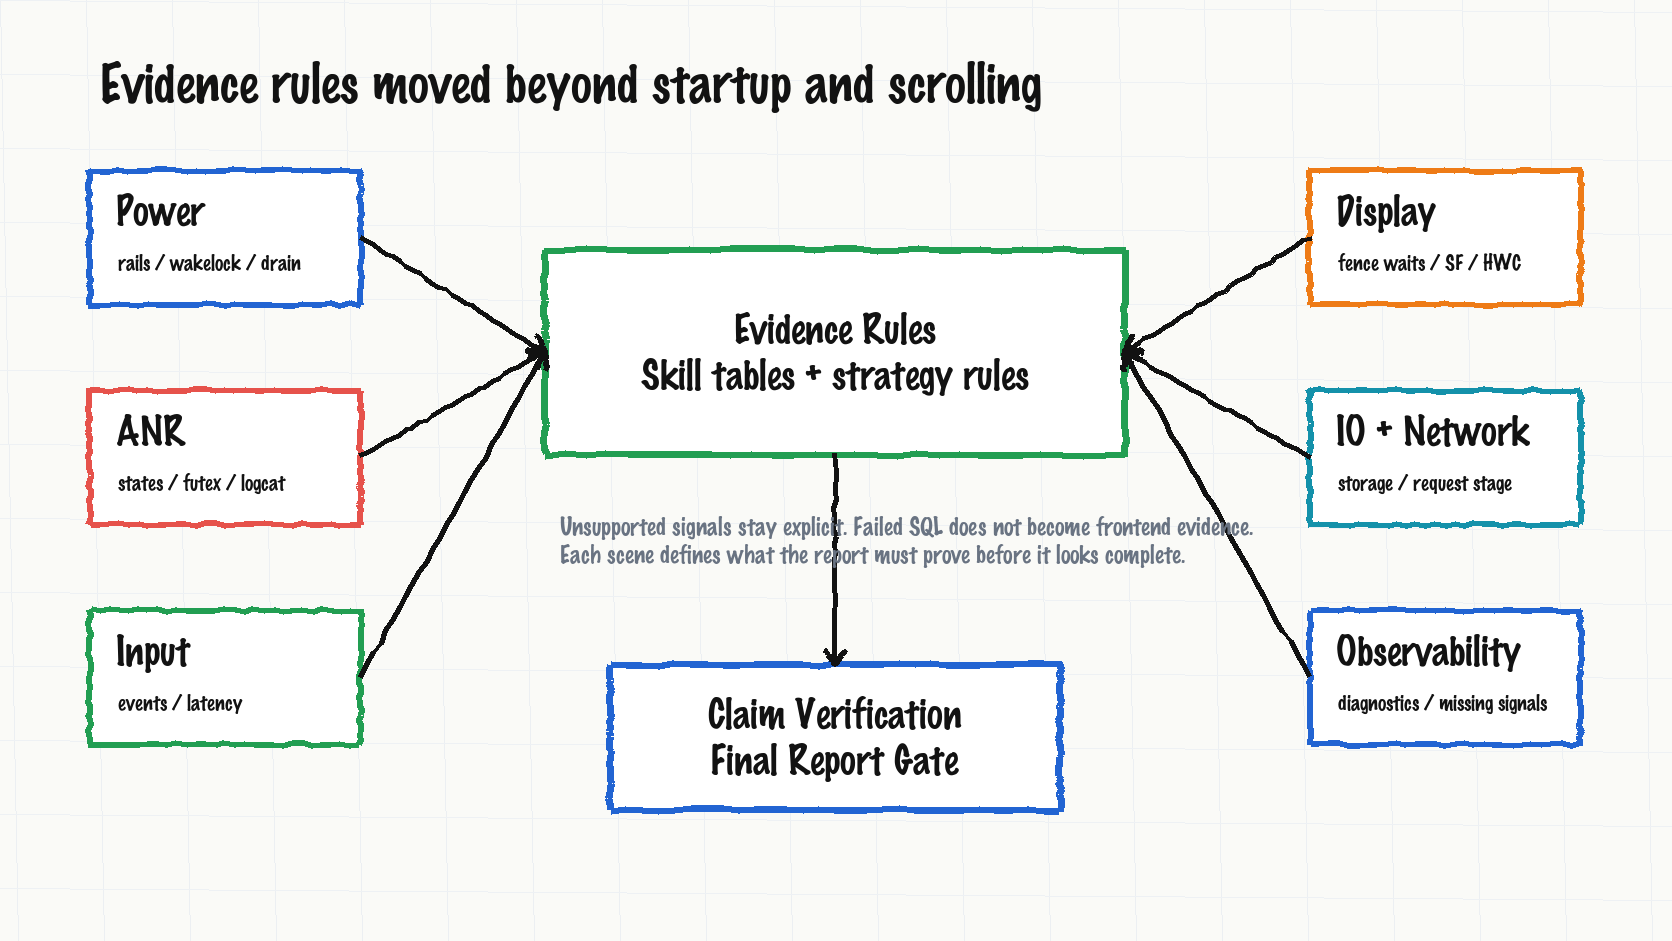
Earlier SmartPerfetto work was heavily focused on startup and scrolling. The late-May work expands the rule set for what a report must prove in more scenes.
| Scene | Added or strengthened evidence | What users get |
|---|---|---|
| Power | battery drain, power rails, wakelock, CPU freq / idle, JobScheduler, modem / network related Skills | A report can connect background power, rail energy, wakeups, and scheduler events instead of only listing CPU hotspots |
| ANR | anr_context_in_range, main thread states / slices, futex wait, logcat, and ANR detail requirements |
The report can separate running, waiting, futex, Binder, and logcat signals instead of turning any stall into an ANR root cause |
| Input / Interaction | input events, scroll response latency, click response analysis / detail | Input-to-response latency has its own evidence path, so not every jank is pushed into RenderThread by default |
| Display / Pipeline | fence wait decomposition and display evidence rules in pipeline strategy | Producer, SurfaceFlinger, HWC, fence, and report conclusions are tied to explicit evidence |
| IO / Network | io.strategy.md and network request-stage evidence templates |
IO wait, network request phases, and scene conclusions have concrete entry points |
| Observability | diagnostics evidence templates, missing-signal policy, trace completeness probing | Missing tables or categories are reported as missing signals instead of becoming confident conclusions |
This is bigger than adding a few SQL queries. Before, report quality relied mostly on prompts asking the model to cite evidence. Now strategy frontmatter, Skill evidence rules, final report checks, and claim verification work together. When key numbers, threads, processes, frame counts, or percentages appear in a report, they need to point back to their evidence source.
That is also why failed SQL diagnostics cannot become frontend evidence. Failed SQL is useful for maintainers. It is not a trace fact for the user. Verified data, diagnostics, visible report text, and snapshot provenance are stored separately.
Feature Three: Four Runtimes Share One Product Output
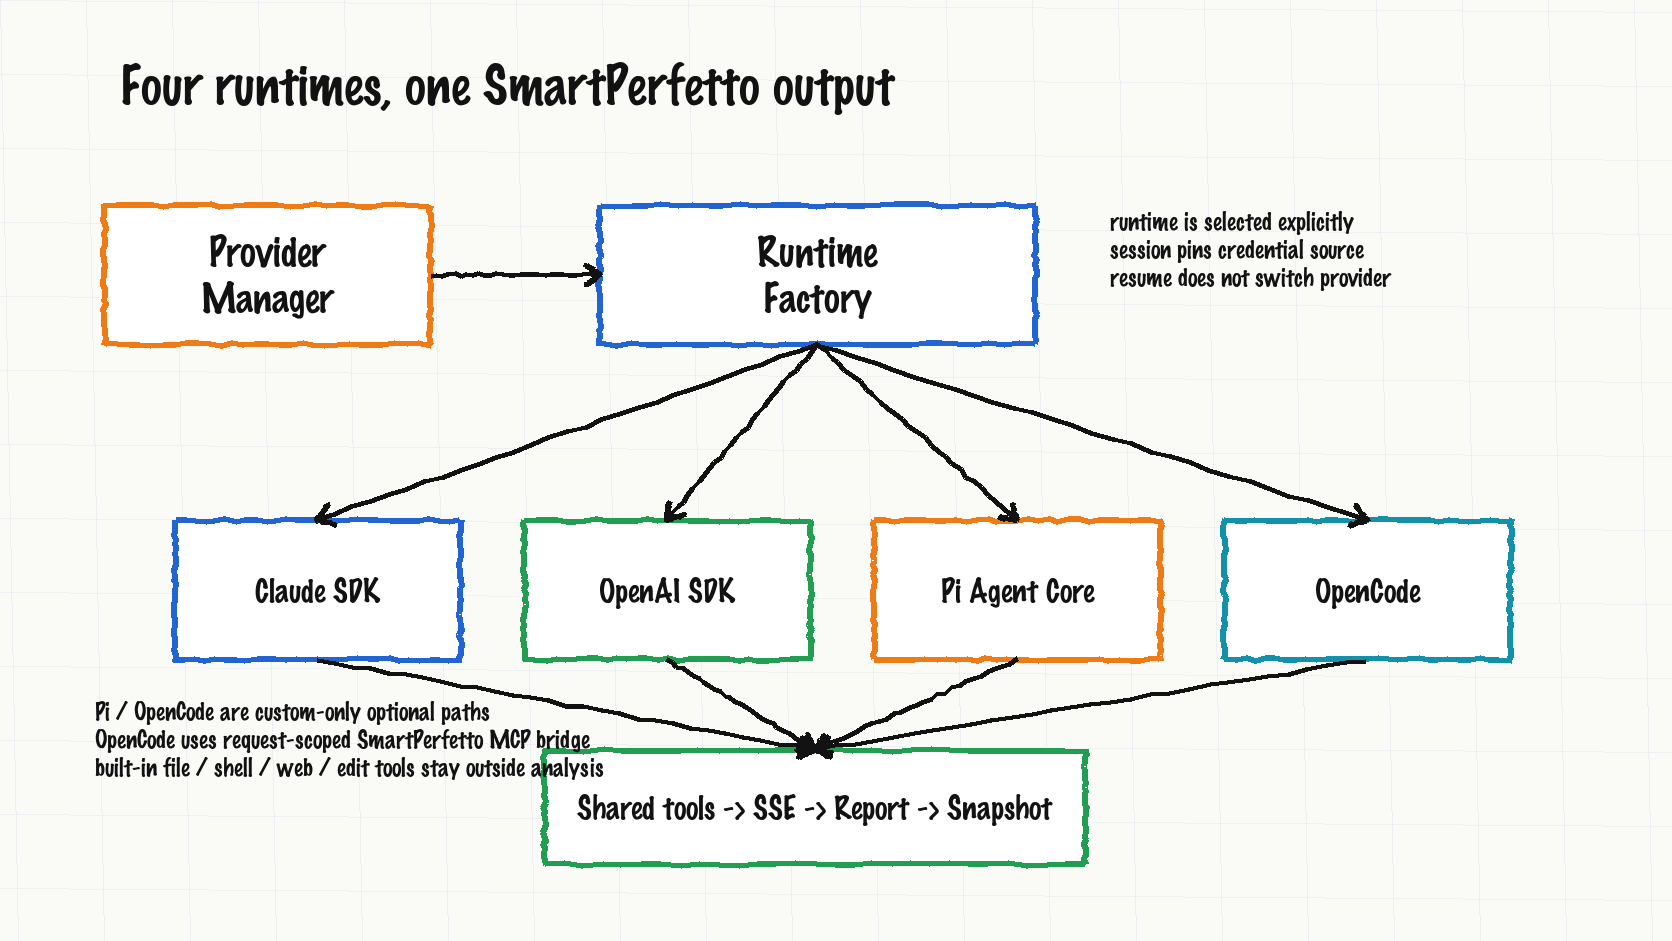
The previous article covered Claude Agent SDK and OpenAI Agents SDK. In v1.0.28, SmartPerfetto has four runtimes:
| Runtime | Provider fit | Boundary |
|---|---|---|
claude-agent-sdk |
Anthropic, Bedrock, Vertex, DeepSeek, Anthropic-compatible gateways, local Claude Code config | Default path; keeps in-process MCP server, verifier, sub-agent, and SDK resume behavior |
openai-agents-sdk |
OpenAI, Ollama, OpenAI-compatible gateways | Reuses the shared SmartPerfetto MCP tool registry through function tools |
pi-agent-core |
custom provider | Optional public runtime; reuses SmartPerfetto prompt, tools, and report flow; does not enable .pi discovery, package extensions, shell tools, or file tools |
opencode |
custom provider or explicit OpenAI-compatible config | Uses a request-scoped SmartPerfetto MCP bridge; does not read the user’s own OpenCode login state or project state, and does not enable built-in file / shell / web / edit tools |
Provider Manager and env config do not guess the runtime from whichever key exists. The priority is request/session providerId, active Provider Manager profile, SMARTPERFETTO_AGENT_RUNTIME, then the default claude-agent-sdk. Once an analysis session is created, it pins the credential source used at that moment. Restoring an old session does not silently switch to a new active provider.
The internal mechanisms differ. Claude runtime exposes an in-process MCP server. OpenAI runtime adapts the shared tool descriptors into function tools. Pi Agent Core uses request-scoped native tools. OpenCode calls SmartPerfetto tools through an isolated server and a request-scoped MCP bridge.
The product output is shared:
1 | runtime result |
The release checks follow that output format. Before v1.0.28, Claude, OpenAI, Pi Agent Core, and OpenCode all passed startup / scrolling strict E2E. All 8 E2E runs required claim verification to pass, 12 checked claims, 0 unsupported / issues, and a non-partial final report. The release flow also ran 6 canonical scene trace regressions, frontend prebuild checks, CLI pack checks, npm fresh-install smoke, portable packaging, GitHub Release checks, and Docker Hub manifest checks.
This does not mean every runtime prints identical wording. Different SDKs have different tool-call timing, streaming events, context recovery, cost, and timeout behavior. SmartPerfetto constrains the shared surfaces: SSE events, HTML reports, CLI turn files, analysis-result snapshots, claim verification, and session resume semantics.
Feature Four: Reports and Debugging Data Are Easier to Inspect
Some changes are less visible than runtime support, but they matter more in daily use.
The first group is report completeness. Changes such as ensure complete agent final reports, final report presentation hardening, evidence table readability, and analysis quality rules all address one problem: running many tools does not guarantee a complete user-facing report. A report now needs to satisfy the final report rules defined by the scene, and its claims need to pass claim verification. The frontend may clean up visible text. Provenance needed by reports, CLI, or snapshots must stay intact.
The second group is SQL and diagnostics. Raw SQL artifacts, failed SQL diagnostics, and trace processor startup failures are handled more explicitly. Failed SQL diagnostics can go into logs and debugging material, but they should not be mixed into the evidence table for the current trace. If trace_processor_shell fails to start, a prebuilt binary is missing, or trace loading fails, the error should show up in health checks or error output, not as a vague AI-quality problem.
The third group is codebase-aware analysis. SmartPerfetto can include local codebase context in an analysis task. This helps map trace evidence to code. It does not replace trace evidence. Code locations can explain possible fixes; performance judgment still comes from trace data.
This makes bug reports more useful. Instead of only saying “the AI conclusion is wrong,” users can attach a Result ID, HTML report, evidenceRefId, claim ref, related SQL, Skill table, and /health runtime data.
Usability Fixes
Recent fixes also focus on whether a real user can run the first trace and diagnose a failure.
| Fix area | User-visible effect |
|---|---|
| trace processor prebuilts | Source and npm CLI paths more reliably get the pinned trace_processor_shell; startup failure messages are clearer |
| Provider debug status | /health shows actual runtime, credential source, provider mode, and diagnostics |
| Node 24 hardening | Source and CLI require Node.js >=24 <25, reducing build/runtime drift |
| npm CLI bin | smp / smartperfetto are valid package bins; fresh installs can run version and doctor smoke checks |
| service port config | SmartPerfetto service ports are configurable; port cleanup avoids killing unrelated client processes |
| Docker healthcheck | Docker healthcheck syntax is fixed, so release checks can cover runtime image smoke |
| frontend evidence table | Evidence tables in AI Assistant are easier to read in chat and reports |
| final SSE conclusion | SSE conclusion, analysis_completed, and HTML report final state are more stable |
| raw SQL artifact | Raw SQL, final executable SQL, failed diagnostics, and user-visible evidence are separated |
| release verification | npm, portable assets, GitHub Release, Docker latest, and Docker version tags are verified after publishing |
These fixes are not flashy. They decide whether Android performance teams can use the tool on real traces. SmartPerfetto crosses Perfetto UI, Express backend, SSE, trace processor, Provider protocol, model SDK, CLI, Docker, and portable packages. State drift in any of these surfaces usually shows up to the user as “the AI analysis is unreliable.”
How to Choose a Run Path
For most users, Docker or the portable package is still the first choice. Developers and script users can choose source or CLI.
| Run mode | Good fit | Notes |
|---|---|---|
| Docker Hub | Fast trial or deployment | Does not use host Claude Code login state; needs Provider Manager or .env provider config |
| Portable package | Users who do not want Node.js or Docker | Windows, macOS, and Linux packages bundle Node.js 24, backend, prebuilt frontend, and pinned trace processor |
Local source ./start.sh |
Developers changing backend / Skills / strategies | Uses committed prebuilt frontend; normal backend and Skill work does not require rebuilding Perfetto UI |
Dev mode ./scripts/start-dev.sh |
People changing the AI Assistant plugin UI | Requires the perfetto/ submodule and frontend watch build |
npm CLI smp |
Terminal capture, analysis, CI, and scripts | Does not start Web UI; reuses shared runtime selection, MCP tools, Skills, reports, and session snapshots |
For runtime config, pick one mode first:
| What you have | Recommended choice |
|---|---|
Local source, and claude already works in the same terminal |
Default claude-agent-sdk; no OpenAI key needed |
| OpenAI, Ollama, or OpenAI-compatible gateway | openai-agents-sdk |
| Pi Agent Core model config | custom provider + pi-agent-core |
| OpenCode model config | custom provider + opencode |
| Docker / portable, and you do not want env files | Create and activate a provider profile in UI Provider Manager |
Do not put provider names into SMARTPERFETTO_AGENT_RUNTIME. That variable only accepts claude-agent-sdk, openai-agents-sdk, pi-agent-core, and opencode. Providers such as DeepSeek, Qwen, Kimi, MiMo, and TokenHub should be configured through Provider Manager or the matching protocol env block.
How to File a Useful Bug Report
SmartPerfetto bug reports still belong in GitHub Issues. Security reports should not be filed as public issues; use GitHub private advisory or the security contact instead.
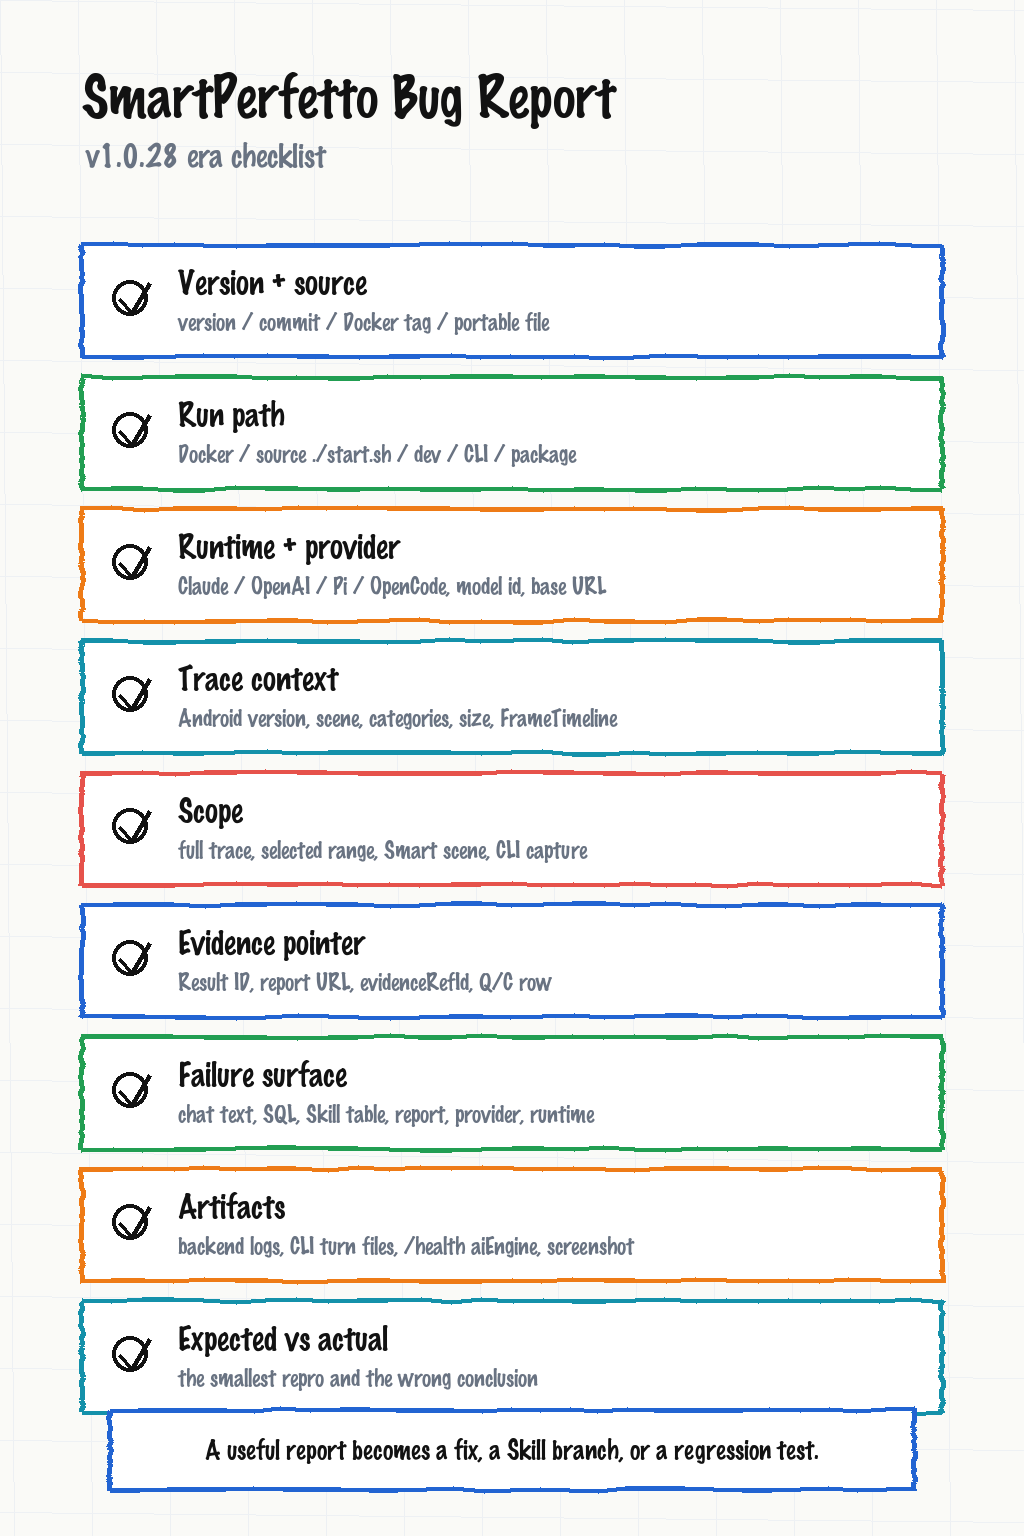
After v1.0.28, a useful report should include:
| Category | What to include |
|---|---|
| SmartPerfetto version | version, commit, Docker image tag, portable filename, or npm CLI version |
| Run mode | Docker, portable, source ./start.sh, dev mode, npm CLI, or API |
| Runtime / Provider | claude-agent-sdk, openai-agents-sdk, pi-agent-core, or opencode; provider name, model ID, Base URL, protocol type |
| Trace information | device, Android version, scenario, trace categories, FrameTimeline availability, trace size |
| Analysis scope | full trace, selected range, Smart scene, CLI capture, and whether the issue happened during follow-up turns or mode switching |
| Evidence pointer | Result ID, HTML report, evidenceRefId, claim ref, Q/C row, related SQL, or Skill table |
| Failure surface | chat text, SQL, Skill table, report, provider connection, runtime selection, session resume, or CLI output |
| Artifacts | backend logs, CLI turn files, /health aiEngine snippet, screenshot, HTML report |
| Expected vs actual | smallest repro steps, actual output, expected output, and the manual evidence behind the expectation |
Provider issues should separate “the model can chat” from “the model can run stable tool / function calls.” SmartPerfetto depends on streaming output, structured tool arguments, context recovery, and long report generation. Normal chat success does not prove full trace analysis works.
Trace issues also need capture conditions. Android 12+ traces with FrameTimeline are better for startup, scrolling, and rendering analysis. Power, ANR, network, and IO each need different categories. When the data source is missing, the correct behavior is to report missing signals, not to invent a confident conclusion.
Feedback That Helps Most Right Now
SmartPerfetto needs feedback that can become a code fix, a Skill branch, or a regression test.
Useful samples look like this:
- A power trace where the report blames CPU, but manual inspection points to wakelock or modem activity. Attach power rails, wakelock, CPU freq / idle evidence.
- An ANR trace where the report says the main thread is blocked by futex, but logcat or thread state does not support it. Attach the ANR range, main-thread state table, futex wait table, and logcat snippet.
- An OpenAI-compatible provider passes connection testing but mutates tool arguments during full analysis. Attach runtime, provider, model ID, protocol type, session log, and
/health. - An OpenCode or Pi Agent Core config passes smoke but startup / scrolling E2E quality is unstable. Attach model config, command, Result ID, and HTML report.
- Smart scene detection picks the wrong range. Attach the trace range, scene inventory output, expected scene type, and manual evidence.
- CLI capture or analyze fails on a remote machine. Attach Node version, platform,
smp doctor --format json, CLI turn files, and trace processor error.
A screenshot plus “the result is wrong” is hard to act on. The maintainer needs to know whether the problem is trace capture, SQL, Skill logic, scene strategy, Provider protocol, runtime session, frontend display, or report rules.
Closing
Between May 17 and June 4, SmartPerfetto moved from answering trace questions inside Perfetto UI toward delivering trace-analysis results through multiple entries, multiple runtimes, and shared evidence rules.
It is still moving quickly. Provider presets, runtime config, public APIs, report rules, and the Skill system will continue to change. For ordinary users, the best next step is to run Docker or a portable package on a real trace. For contributors, the most useful inputs are reproducible traces, wrong-attribution reports with evidence pointers, SQL that can improve a Skill or strategy, and regression samples.
The May 17 article no longer describes the current repository state. If you try SmartPerfetto again now, start with Smart Mode, selected-range quick analysis, CLI, and the four runtime options.