

For slow camera opens, audio underruns, a stalled WebView first screen, or dropped frames in Flutter and games, the evidence is scattered across the app, system_server, cameraserver/audioserver, HAL, SurfaceFlinger, and scheduling tracks. Simply inspecting a few more tracks in the UI can easily leave critical timestamps unnoticed.
Using Camera and Audio as examples, this article describes a reusable method for domain-specific analysis: capture the right data, identify the objects, calculate stages and blocking, and preserve timestamps in the report so that reviewers can return to the UI. Camera and Audio are examples; the core is a domain schema and collaboration with platform tracing. By the end, you should at least be able to break a slow camera open into reviewable stages and an audio underrun into cycle anomalies, rather than delivering only a table of the longest slices.
Perfetto Series Catalog
- Android Perfetto Series Catalog
- Android Perfetto Series 1: Introduction to Perfetto
- Android Perfetto Series 2: Capturing Perfetto Traces
- Android Perfetto Series 3: Familiarizing with the Perfetto View
- Android Perfetto Series 4: Opening Large Traces via Command Line
- Android Perfetto Series 5: Choreographer-based Rendering Flow
- Android Perfetto Series 6: Why 120Hz? Advantages and Challenges
- Android Perfetto Series 7: MainThread and RenderThread Deep Dive
- Android Perfetto Series 8: Understanding Vsync and Performance Analysis
- Android Perfetto Series 9: Interpreting CPU Information
- Android Perfetto Series 10: Binder Scheduling and Lock Contention
- Android Perfetto Series 11: PerfettoSQL, Trace Processor and Regression Detection
- Android Perfetto Series 12: Trace Dataflow and Data Loss
- Android Perfetto Series 13: Perfetto SDK, Track Event and App Field Traces
- Android Perfetto Series 14: heapprofd and Memory Profiling
- Android Perfetto Series 15: Boot Traces and Long-running Field Tracing
- Android Perfetto Series 16: GPU, Power Counters and Hardware Bottlenecks
- Android Perfetto Series 17: Scenario Automation and Platform Tracing
- Android Perfetto Series 18: Input Response Latency
- Video (Bilibili) - Android Perfetto Basics and Case Studies
- Video (Bilibili) - Android Perfetto: Trace Graph Types - AOSP, WebView, Flutter + OEM System Optimization
This article applies the preceding methods to domain automation: the SQL methods from Part 11, quality checks from Part 12, application semantics from Part 13, and field capture from Part 15 all come together here in specific domains and platform infrastructure. Rather than explaining those methods again, we reorganize them around domain objects.
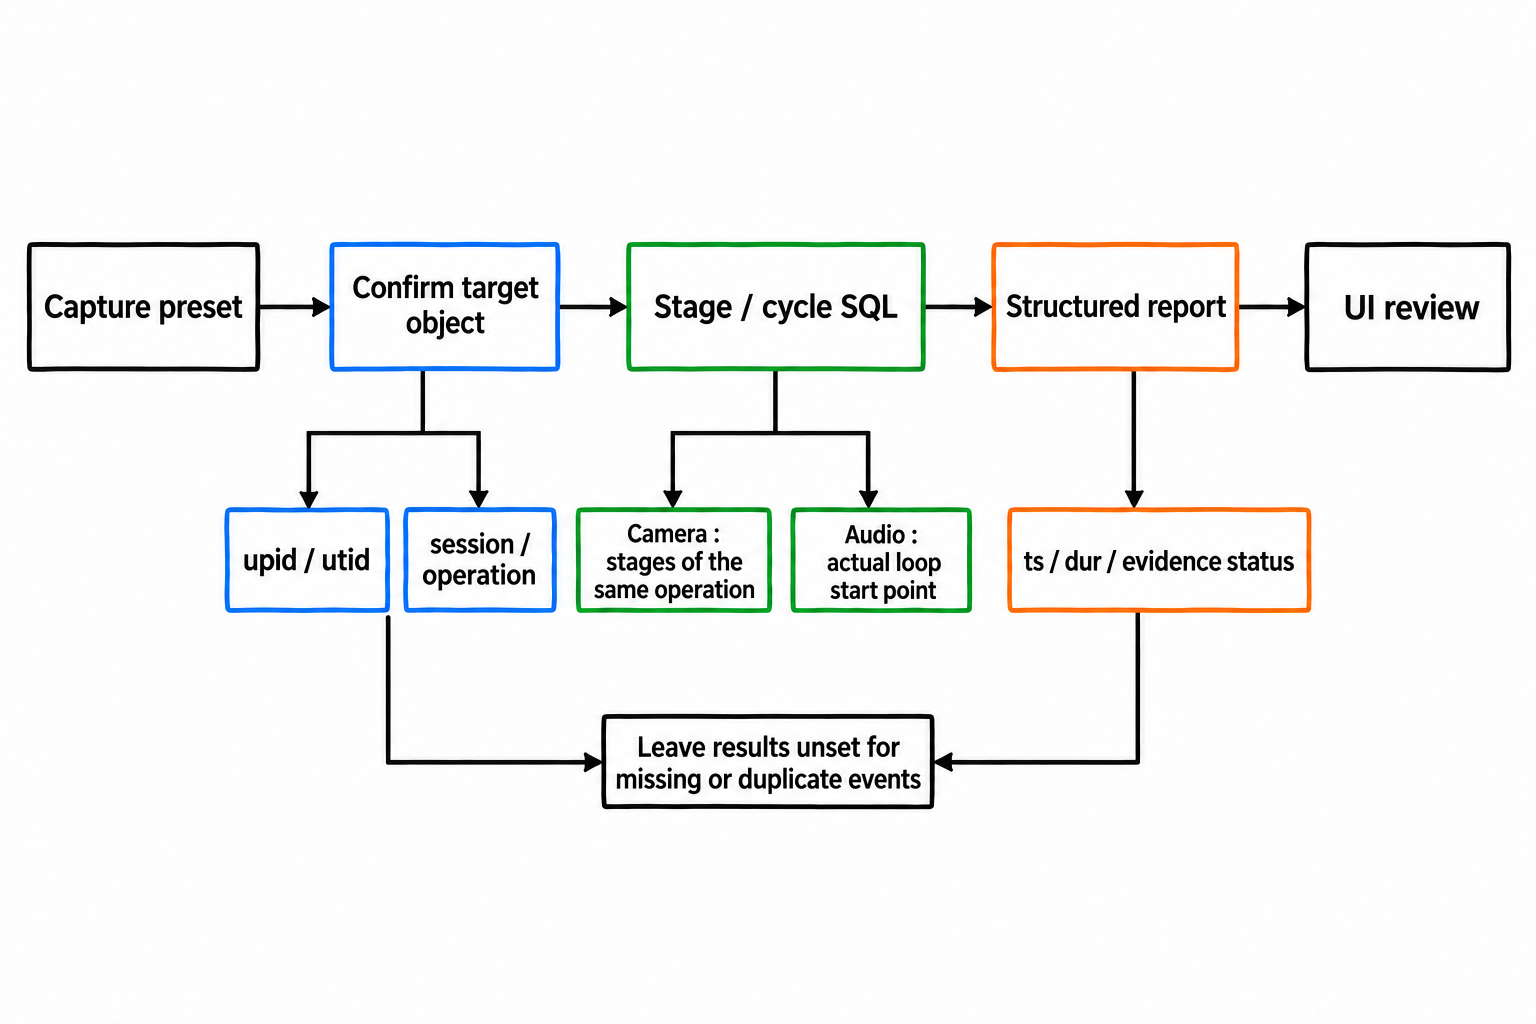
Illustration: Camera stages belong to the same operation; Audio periods are measured from actual cycles. Reports retain timestamps for returning to the UI.
Domain Analysis Starts with an Object Dictionary
The difficulty with Camera and Audio is not whether a camera/audio category exists, but which objects are actually present in the trace:
| Domain | Objects | Why identify them? |
|---|---|---|
| Camera | App client, cameraserver, provider, HAL, request/session IDs |
Open, configure, preview, and capture can span different processes |
| Audio | App audio thread, audioserver, MixerThread, FastMixer, audio HAL, Bluetooth/audio route |
Underruns often result from cycle jitter, irregular writes, HAL blocking, or scheduling delays |
The first step in automated analysis is to generate an object dictionary: relevant processes, threads, tracks, slice names, log tags, and request/session IDs. Subsequent SQL does not guess a root cause directly; it calculates stage durations and blocking evidence around this dictionary.
The object dictionary should be script output, rather than a set of keywords that exists only in someone’s head. A Camera case may involve the app process, cameraserver, provider@2.7-service, a vendor camera daemon, a codec, and SurfaceFlinger. An Audio case may involve the app, audioserver, audio.primary, Bluetooth, and a media codec.
An initially confirmed object dictionary looks like this. SQL is only one way to generate and validate it:
1 | object_dictionary_version: camera_audio_v1 |
The domain schema is the collaboration interface between the app, platform, SQL, and reports. Version it rather than scattering it across articles, scripts, and verbal agreements:
1 | schema_version: camera_domain_v1 |
The script first lists candidate objects, then the domain owner confirms which belong to this scenario. That confirmation must be recorded in a domain_objects table or equivalently structured YAML/JSON, rather than remaining in someone’s head. Subsequent queries join only against this dictionary.
1 | CREATE TABLE domain_objects AS |
Note that this uses ordinary SQLite CREATE TABLE, not CREATE PERFETTO TABLE: the latter creates a read-only table, so UPDATE cannot write back the results of manual confirmation. At a minimum, the fields must cover role, process/thread, track_id, vendor aliases, confidence, and manual confirmation status. The initial version can still be generated from keywords, but reports may use only objects with owner_confirmed = 1. Otherwise, as soon as a vendor HAL, provider, codec, or Bluetooth route changes, the automation falls back to fuzzy matching.
List candidate objects for the domain owner to review as follows:
1 | SELECT DISTINCT |
A person needs to inspect this output. Automation can narrow the scope, but LIKE cannot reliably establish ownership for every provider, HAL, codec, and Bluetooth route.
Write confirmed objects back to the same table, or persist them as equivalently structured YAML/JSON. The following confirms objects by upid already reviewed in this trace. Do not automatically confirm everything matching %provider%: that would bring other Camera or Media services into the report. Audio needs its own role confirmation. If only specific threads in a process belong to a role, also restrict by utid.
1 | -- 42/43/44 are placeholders: replace them with upid values actually reviewed above. |
Subsequent SQL uses only objects with owner_confirmed = 1. The candidate table aims for completeness; the confirmed table makes reports stable. The fixed role enum includes camera_app_client, camera_service, camera_provider, camera_hal, display_service, audio_app, audio_server, audio_mixer, audio_hal, and bluetooth_audio.
Start Configuration with a Domain Preset
First make the permission boundaries explicit:
| Capability | Who can use it | Notes |
|---|---|---|
| App markers / metadata | Ordinary apps | android.os.Trace, NDK ATrace, Track Event, application metadata |
| Registered triggers | Ordinary apps or test harnesses | Can activate only trigger names predeclared by the platform |
| App profiling | shell + profileable or debuggable |
Prefer profileable for release performance comparisons; use debuggable only for debugging |
| ftrace/process stats/FrameTimeline/system log | shell, Traceur, trusted platform/OEM consumers | Subject to SELinux and build-type restrictions; ordinary apps cannot enable these |
| Uploads, rate limits, privacy, preset selection | Platform/OEM diagnostics workflow | Requires authorization, redaction, retention periods, and auditing |
The following is a lab_domain_debug configuration, not a low-overhead field preset. It retains sched/freq/idle, Camera/Audio/hal/binder atrace, FrameTimeline, process stats, and logs for development devices, userdebug, or laboratory reproduction. Reduce the field version to necessary data sources; enable logs, binder_lock, and high-frequency domain events only for short, focused traces.
Using Android 17 as the current reference, place configuration files in /data/misc/perfetto-configs on Android 12 and later; do not assume that perfetto can read a config directly from /data/local/tmp. Measuring the first camera frame visible to the user also requires SurfaceFlinger layer/present evidence; use FrameTimeline only if it supports that preview path. Camera/HAL signals alone measure only API return, a HAL buffer, or a provider stage.
1 | duration_ms: 30000 |
atrace_categories enables Android system categories; it does not automatically enable android.os.Trace or NDK ATrace in the app. App-side ATrace shares ATRACE_TAG_APP and requires package-specific atrace_apps configuration, with no separate category filtering. When arguments and cross-thread correlation are needed, use the Perfetto SDK Track Event approach from Part 13.
For app profiling or certain local debugging signals on a user build, release packages should use <profileable android:shell="true" />. debuggable changes performance characteristics and is suitable for debugging, not rigorous timing comparisons. System services, HAL, and CPU/native profiling require userdebug/eng or platform diagnostics permissions through their respective paths.
Official documentation lists android.log support for userdebug. A rooted user build may also capture logs if logd/SELinux permissions allow it, but adb root alone does not guarantee this as a general capability. On ordinary user builds or in production, do not assume logs will be in the trace. Include external logcat, bugreports, or platform-redacted logs in the same case package. Field packages should retain only allowlisted tags and window summaries; raw logs require authorization and redaction.
Category names also depend on the target system. Perfetto documentation separates ATrace into system categories and per-app events. System categories come from Android internal processes; app events share ATRACE_TAG_APP and must be enabled by package name. Do not simply copy the category list from someone else’s device into a preset. Check supported categories for the current version in the Perfetto UI Record page or the device-side configuration.
buffers.size_kb configures the Perfetto central buffer, not the ftrace per-CPU kernel ring buffer. For sched/ftrace data loss, inspect ftrace overrun/dropped/data_loss entries in stats. Adjust parameters such as ftrace_config.buffer_size_kb and drain_period_ms only when necessary, first verifying device compatibility and overhead with a short trace. Before adding vendor kernel tracepoints, check /sys/kernel/tracing/events/*/*/format, field stability, and Perfetto parser/stdlib support. Otherwise, they can only serve as candidate evidence in raw ftrace, or require changes to the Perfetto parser or a custom data source.
Do not express the quality gate as only an abstract score. At a minimum, always run this SQL:
1 | SELECT name, idx, severity, source, value |
The meaning of idx varies by statistic: for traced_buf_* it is usually a buffer index, and for ftrace CPU statistics it is a CPU number; check definitions for other entries. Group findings by affected_signal: ftrace/sched, atrace/systrace, track_event, FrameTimeline, android.log, clock, and central_buffer. Explain overwritten data separately under RING_BUFFER: it may simply mean old data outside the window was overwritten, or that insufficient pre-issue evidence remains. Apply separate report downgrades for data loss, packet loss, and overwrites.
Analyze Camera by Stage
A slow camera open needs more than a statement that “the camera is slow.” Break it into at least these stages:
I keep three endpoints separate here: the API call returning, the first buffer arriving from the HAL, and the first preview frame reaching the screen. Calling all three “camera open time” can make an optimization look successful even when the preview has not appeared any sooner.
| Stage | Owner | What to examine |
|---|---|---|
| App initiates open | App marker | User action, permissions, whether the UI thread is waiting |
App to cameraserver |
App + camera service | Binder round trips, server thread-pool congestion |
cameraserver to provider/HAL |
Platform event | Provider process, HAL threads, device waits |
| Configure streams | Platform/HAL event | Stream count, resolution, Surface, HAL configure duration |
| First HAL buffer | HAL/provider event | Request submission, buffer returned from HAL |
| First presented frame | SurfaceFlinger layer/present evidence + app marker; FrameTimeline where supported | Verify that the Buffer was actually presented; SurfaceView previews cannot be judged from FrameTimeline alone |
| Capture/result | Platform/HAL event | Request ID, result callback, buffer/metadata return |
These are three different measurement endpoints: API return, the first frame returned from HAL, and the first frame visible to the user. The first two primarily concern the Camera framework/HAL; the third also involves BufferQueue and SurfaceFlinger. FrameTimeline availability depends on the preview path. State which one you measured in the report. Otherwise, “open got faster” might mean only that the API returned earlier, with no improvement to the first preview frame.
Domain SQL must be tied to the issue window. That window can come from trigger metadata, application markers, user reproduction steps, or an interval selected manually in the UI. If owner events are missing, report missing_owner_event or stage_unavailable; do not promote a LIKE query into a stage conclusion.
1 | WITH target_window AS ( |
When stable events exist, first restrict the analysis to a single operation. The following requires all stages to carry the same camera_id/session_id/operation_id, with configure also matching the target stream_id. These IDs are a contract that application instrumentation must provide, not something automatically supplied by the system. No duration is emitted when events are missing, candidates are duplicated, or timestamps are reversed. Use EXISTS to match a slice to objects, avoiding row multiplication from multiple tracks in the object dictionary. Treat FirstPreviewFrame as an application-defined candidate endpoint until layer/token/present has been checked; it cannot yet be called the first user-visible frame:
1 | WITH target_window AS ( |
If stable events have not yet been fully instrumented, fall back to a candidate-slice query. This query only establishes candidate stages. Focus on process_name, thread_name, slice_name, and dur_ms; it cannot directly replace the stage definitions above:
1 | WITH target_window AS ( |
If this query does not provide enough stage information, there are usually two options: add android.os.Trace / ATRACE / Track Event instrumentation, or have the platform add stable event names at key stages in CameraService, the provider, and HAL. Validate camera_id/session_id/request_id in event arguments. With Track Event, obtain them from args/debug annotations or flow IDs rather than relying only on event names.
Analyze Audio by Cycle
Audio issues depend even more on periodic behavior than Camera issues. One long slice does not necessarily cause an audible problem. Jitter across several consecutive mixer cycles, irregular app write intervals, and blocking HAL writes are more directly relevant to underruns or dropouts.
An Audio report should first examine whether the tail of the cycle-duration distribution grows, whether anomalies occur consecutively, and whether they coincide with underrun logs, route changes, or the time of an audible problem. The longest slices are supporting clues only.
Audio candidate slices must also be restricted to the issue window and should preferentially use domain_objects, preventing historical noise from the entire trace from entering the analysis:
1 | WITH target_window AS ( |
Next, examine intervals between Mixer/FastMixer scheduling slices in audioserver. A single mixer work cycle may be preempted into several sched slices, so the start-to-start interval between adjacent Running slices is not an audio mixer period. The following outputs only scheduling intervals and off-CPU gaps. Explaining them still requires correlation with thread_state, HAL slices, underrun logs, and route metadata.
1 | WITH target_window AS ( |
sched_start_interval_ms and off_cpu_gap_ms describe scheduling only. To measure mixer periods, use a confirmed application/platform slice emitted once per cycle, such as the AudioFlinger#MixerCycle event defined below. Order slices within each utid and calculate the difference between adjacent start timestamps. Do not compare arbitrary context switches with audio buffer deadlines.
After confirming that AudioFlinger#MixerCycle has been instrumented or mapped, calculate actual cycle start intervals:
1 | WITH cycles AS ( |
Do not assign period_ms a fixed threshold across devices. It depends on sample rate, buffer size, fast path, Bluetooth route, offload, and how AAudio/OpenSL ES/AudioTrack is used. A more reliable method is to establish a baseline from clean playback on the same device and route, then compare whether the tail grows in the problematic capture, whether it grows across consecutive cycles, and whether that coincides with underrun logs or audible-problem timestamps.
Calculate Running and Runnable Separately
Many domain reports mix thread states together. Parts 09 and 11 already explain Running/Runnable definitions, the meaning of R+, and the prerequisites for scheduling evidence: complete sched data and no ftrace loss in stats. We will not repeat them here. Domain analysis differs in only one respect: the threads being measured come from the domain_objects dictionary with owner_confirmed = 1, rather than guesses based on thread names.
This SQL outputs both Running and Runnable for domain threads within the issue window:
1 | WITH target_window AS ( |
This uses Running/Runnable states in thread_state for a consistent calculation. Durations remain blank when records are missing or cover only part of the window. full means only interval coverage and does not replace stats checks. If a thread was alive for only part of the window, narrow the window before calculating again.
If Runnable time is high, first examine CPU contention, thread priority, frequency, and wakeup sources. If Running time is high, consider CPU profiling or function-level hotspots.
Use Logs to Add Stage Semantics
Logs are useful for adding request IDs, session IDs, route changes, underruns, and error codes. When the trace includes android.log, restrict it to the issue window as well:
1 | WITH target_window AS ( |
Do not treat logs as the sole evidence. They name the stages; durations and blocking still need to be traced back to slices, sched, thread_state, Binder, and HAL threads.
Reports Must Lead Back to the UI
Automated reports should output more than SQL tables. Use four fixed sections:
| Section | Output |
|---|---|
| Data quality | Trace duration, stats anomalies, presence of key data sources |
| Object dictionary | Relevant processes, threads, tracks, log tags, request/session IDs, confirmation status |
| Stage metrics | Camera open/config/HAL buffer/presented frame; Audio write/mix/output cycles |
| Review points | ts, dur, process, thread, slice/log names |
An illustrative report structure (the numbers below are examples, not measurements from a supplied trace):
1 | Camera open analysis |
Every anomaly in the report should lead back to Perfetto UI. Conclusions without timestamps cannot be reviewed by someone else.
For domain owners, a report must point to reviewable intervals rather than stop at “the script says Camera HAL is slow.” For example: provider configure took 98 ms, the request ID was 17, a Binder thread was Runnable for 41 ms at the same time, and there was no data loss. The script assembles the context; the final conclusion must still be verifiable against the UI and source code paths.
The server and case package also need a machine-readable summary.json:
1 | { |
Add Stable Events in the App and Platform
Name drift is a major problem for Camera/Audio automation. Slice names can vary across Android versions, vendor HALs, camera modules, and audio routes. Add stable events in code under your control:
| Event | Owner | Required args | Purpose | Privacy boundary |
|---|---|---|---|---|
Camera#OpenStart |
App | camera_id, session_id, operation_id, event_id |
Start of open_api | No user content |
Camera#OpenEnd |
App | camera_id, session_id, operation_id, event_id, result |
End of open_api | Allowlisted error codes |
Camera#ConfigureStreamsStart |
Platform | camera_id, session_id, operation_id, stream_id |
Start of configure stage | Resolution/format may be retained |
Camera#FirstPreviewFrame |
Platform/App | camera_id, session_id, operation_id, stream_id, surface_id |
Candidate first visible frame | No image content |
Audio#TrackStart |
App/Platform | track_id, route, sample_rate, buffer_frames |
Start of audio cycles | Route represented as an enum |
Audio#WriteBuffer |
App | track_id, frames, buffer_level |
App write cadence | No media content |
Audio#Underrun |
Platform | track_id, route, sample_rate, buffer_frames, underrun_count |
Underrun event | Allowlisted routes/tags |
Audio#RouteChange |
Platform | old_route, new_route, reason |
Route change | No unique device identifiers |
These events can come from android.os.Trace, NDK ATrace, Perfetto SDK Track Event, or platform ATRACE. Keep event names stable; do not concatenate dynamic IDs into them.
With ATrace, focus on stable slice names and async cookies. Prefer Track Event arguments, flow IDs, logs/side tables, or metadata in the same case for ID information. Counters should contain interpretable numeric values such as queue depth, buffer level, and underrun count. For richer arguments and cross-thread correlation, prefer Perfetto SDK Track Event as described in Part 13.
A platform-specific custom data source is a lower priority. Build one only for high-frequency, strongly structured data or information that ordinary slices/counters cannot represent. Its manifest must specify the data source name, producer process, SELinux domain, TraceConfig, parser, and SQL compatibility policy.
Expand Domain Methods into an Issue Checklist
Camera and Audio are only examples. To use Perfetto reliably as a team, translate common symptoms into capture presets, collectors, build types, analysis paths, and output evidence.
| Issue | Base data sources | Additional domain signals | Default output |
|---|---|---|---|
| UI jank | sched, freq, idle, gfx, view, wm, input, process_stats, FrameTimeline | binder_driver, app ATrace/Track Event | Problematic frames, App/HWUI/SurfaceFlinger stages, thread states |
| Slow tap response | input, sched, freq, view, wm, binder_driver, FrameTimeline | App visual-state counters, high-speed camera comparison | Input to first visible change |
| App startup | sched, freq, am, wm, view, binder_driver, FrameTimeline | log, CPU profiling, app ATrace/Track Event | Startup stages, first frame, longest waits |
| ANR | sched, freq, binder_driver, am, wm | lock, IO, CPU profiling; authorized android.log where supported |
Main-thread wait evidence |
| Slow Binder | sched, binder_driver, binder_lock, process_stats | system_server logs, interface events |
Top N slow transactions, server state |
| Native memory | process_stats | heapprofd, log, application triggers | Allocation stacks and growth trends |
| Camera | sched, freq, camera, hal, binder_driver, SurfaceFlinger layer/present; FrameTimeline where supported | log, CPU profiling, platform events | Open/config/HAL buffer/first visible frame |
| Audio | sched, freq, audio, hal, binder_driver, log | CPU profiling, platform events | Cycle jitter around underruns |
| Power/thermal management | sched, freq, idle, android.power, thermal | GPU counters, devfreq, power rails; authorized android.log where supported |
Resource trends and anomalous windows |
Every preset needs an owner, version, purpose, default window, collector, build boundaries, data sources, overhead level, privacy level, and quality gate. Without these fields, presets quickly become a pile of configurations that nobody dares to delete:
1 | preset_id: ui_jank_v4 |
Ordinary apps cannot independently start system-level ftrace, process stats, or SurfaceFlinger FrameTimeline sessions. Apps can emit stable markers, send registered triggers, and provide local metadata. The system trace session is normally held by a platform service, OEM diagnostics component, Traceur, shell, or a laboratory script.
On user builds, Traceur, shell, and authorized platform/OEM diagnostics are common collection entry points; the exact consumers and permissions depend on the device. Arbitrary ordinary apps or unauthorized diagnostics apps cannot directly control the system-level Perfetto consumer socket. Production should accept only reviewed binary TraceConfigs or preset IDs, not arbitrary text protos.
App profiling on user builds also depends on profileable/debuggable. Before automatically uploading raw traces, logcat, or bugreports from production, there must be user authorization, an enterprise or OEM diagnostics agreement, a redaction policy, access controls, retention periods, and audit records. Configure trace_filter / field-level redaction on the capture or read side of production/bugreport paths, and record the filter-rule version in case metadata.
Reports also need evidence grades for their conclusions:
| Grade | Wording | Required fields |
|---|---|---|
| Confirmed | X blocked Y within window A |
owner_confirmed=true, complete ordered stage events, required_signals_available=true, data_quality=clean, ui_review_points>=1, source_sql |
| Tentative | The evidence points more toward X |
Primary evidence holds; missing_evidence lists missing source code, logs, or domain state |
| Not supported | The evidence does not currently support X |
signal_present=true and metrics do not support that direction; this cannot be inferred from missing data |
| Downgraded | This trace cannot determine X |
degrade_reason specifies data loss, a missing data source, or insufficient samples |
These grades protect report quality. Many engineering disagreements stem not from the trace itself, but from assigning the wrong conclusion grade: evidence that supports only a tentative direction is presented as confirmed.
What the Platform and OEM Need to Build
Apps can add application semantics, but many issues occur outside their view: blocked system_server Binder calls, AudioFlinger underruns, Camera HAL blocking, Power HAL policy changes, scheduler CPU migrations, insufficient GPU execution tracks, or evidence scattered through a bugreport. The platform needs to standardize four things: presets, triggers, evidence-package format, and the automated analysis entry point.
Engineers should not have to write an ad hoc TraceConfig every time. Manage TraceConfig versions like an interface, with review, testing, and releases in a repository:
1 | perfetto-presets/ |
A Perfetto infrastructure should have at least three layers:
| Layer | Use case | Collector | Capture characteristics | Typical data sources |
|---|---|---|---|---|
| field | Production/staged-rollout issues on user builds | Platform/OEM diagnostics components or Traceur; apps emit only markers/triggers | Low overhead, ring buffer, stop trigger for a short window | sched, process stats, a few app ATrace events, necessary counters |
| lab | Laboratory reproduction and version comparisons | shell, test frameworks, platform scripts | Controlled devices, repeatable scripts, stable metrics | FrameTimeline, freq, idle, Binder, domain log excerpts |
| deep | Focused investigation | userdebug/root, platform engineering tools | Short duration, high overhead, manual operation | heapprofd, linux.perf, GPU counters, additional HAL events |
Do not deploy deep presets in production. CPU profiling, native heap profiling, and GPU counters are valuable in laboratory and focused investigations, but are too expensive for long-running field capture on user builds and carry greater privacy and stability risks.
Document the boundaries of deep presets separately:
linux.perfis a sampling profiler, not a complete event stream. By default, restrict it to short windows, low sampling rates, and target processes/threads, and document unwind, kernel-frame, root/userdebug/kptr restrictions.- Before using vendor tracepoints, check
/sys/kernel/tracing/events/*/*/format, field stability, andftrace_setup_errors. Unknown events can serve only as raw events or candidate evidence. - The field layer prohibits
linux.perf, heapprofd, GPU counters, and high-frequency syscall/pagefault events. Necessary counters must specify sampling period, units, supported devices, and upload privacy level. - Each preset needs measured write rates and a data-loss baseline. A
cost_levelis no substitute for a real budget.
A ring buffer is useful for retaining a short window around a trigger; it cannot preserve all context indefinitely. Long traces need the background capture, segmented storage, and explicit exit conditions from Part 15.
The trigger registry also needs consolidation. App agents, Framework watchdog, AudioFlinger, CameraService, Thermal/Power, and laboratory tools may send only registered trigger names. The platform then applies rate limits by device, user, version, scenario, network, and storage state. Once a name enters the platform, do not change it casually: doing so breaks server indexes, SQL templates, historical trends, and alert rules.
Integrate Bugreport with Perfetto as well. bugreport_score > 0 marks a running trace session as a Bugreport candidate; sessions with bugreport_score <= 0 are excluded. When Android dumpstate calls perfetto --save-for-bugreport, it selects the highest-scoring candidate trace and saves it to the Bugreport path. Android 12/13 saves the candidate trace and stops the original session early; Android 14 or later creates a read-only snapshot and lets the original session continue. bugreport_filename is an Android 15 / Perfetto v42+ field. bugreport_score > 0 also changes cloning/attachment behavior. Record supported versions, privacy level, and authorized access principals in the manifest.
Build a system instrumentation dictionary before adding code:
1 | camera: |
This platform dictionary and the Camera#* names in the earlier domain schema are two distinct layers. CameraService#Open and CameraHAL#FirstResult are instrumentation implementation names inside individual services; Camera#OpenStart and Camera#FirstHalBuffer are interface names used for analysis and reporting. Match the layers through the owner field in the schema’s stable_events and a mapping table. SQL and reports use only schema names; renaming an implementation event requires updating only the mapping, not the analysis layer.
Names must be stable and their meaning suitable for SQL aggregation. Put dynamic information in arguments, counters, or metadata, rather than concatenating it into event names. Plaintext URLs, contacts, message content, search terms, and geographic locations must not enter trace events.
The server needs at least five functions: file acceptance checks, evidence-reliability checks, scenario summaries, aggregation indexes, and a manual review entry point. Before anyone opens the UI, the report should already identify the preset, trigger, trigger window, quality-gate status, relevant processes and threads, and the owner indicated by the machine-generated summary.
Represent processing status as an explicit state machine:
1 | ingested |
This state machine constrains the provenance of evidence: every conclusion can be traced back to the same preset, SQL, and evidence grade. After a version upgrade, renamed fields, missing events, or unavailable data sources can trigger a downgrade directly at quality_checked, preventing reports from continuing to emit apparently certain conclusions.
Common Pitfalls
- Matching only
LIKE '%camera%'misses providers, vendor HALs, codecs, and media processes. - Enabling only
atrace_categoriesmisses app-sideandroid.os.Trace; useatrace_appsor Track Event. - Ordinary apps cannot enable system ftrace/process stats themselves; they can only cooperate with a platform collector by emitting markers or triggers.
- Prefer FrameTimeline for ordinary View UI, startup, and tap-response analysis. If the target uses SurfaceView or the device has no corresponding frame data, inspect target layer/present evidence and state that the frame metric is unavailable.
- Design for the documented userdebug support of
android.log. On rooted user devices, verify permissions and actual data; prepare alternative sources for ordinary user builds. - Slow Binder is a symptom. The server may be waiting for HAL, a lock, IO, or downstream hardware.
- Analyze Audio cycle jitter rather than only the longest slices.
- Separate Camera open, configure, preview, and capture rather than combining them into one duration.
- For Running, use actual execution intervals (
schedorRunninginthread_state); for Runnable, useR/R+inthread_state. Calculate them separately. - An agent or script organizes evidence; it cannot replace UI review and domain-owner judgment.
- Distinguish API return, HAL buffer return, and visible presentation when measuring the first camera frame.
- Establish Audio period thresholds against a baseline for the device, route, and buffer configuration.
- Increasingly heavy production presets create power, privacy, and stability problems.
- Without a system instrumentation dictionary, event-name drift invalidates SQL and historical trends.
- Keeping Bugreports and traces separate forces engineers to locate the same time window manually across multiple attachments.
Summary
For domain problems such as Camera and Audio, standardize a preset, build an object dictionary, write SQL around stages and cycles, produce reports with timestamps, and return to the UI to review anomalies.
The same approach applies to WebView, Flutter, games, and vendor-defined system services. Only the object dictionary and metric templates change. The foundation remains trace quality, process/thread ownership, stage durations, scheduling states, and log semantics. Add platform support for presets, triggers, Bugreport, system instrumentation, server summaries, and permission boundaries, and Perfetto can grow from an individual tool into a team capability.
You do not need to build this engineering workflow from scratch. My open-source project SmartPerfetto has already implemented much of it: scenario presets, SQL skills, evidence rules, and an AI agent runtime form a reusable automated trace-analysis platform. Object dictionaries, evidence grading, and conclusions that can be reviewed in the UI are built-in constraints. For the current version’s full capabilities, see SmartPerfetto: A Six-Week Update Review.
References
- ATrace data source
- Track events
- Android Log data source
- Android Jank detection with FrameTimeline
- Buffers and dataflow
- Trace Processor Stats
- Getting Started with PerfettoSQL
- Trace Processor Python API
- AOSP Camera HAL
- AOSP Audio architecture
- Advanced System Tracing on Android
- TraceConfig reference
- Android
<profileable>manifest element
Source revision checked: b23c67be1159e3f0b0657bd97be9e139e0d8ee2c (2026-09-19).
About Me and the Blog
Follow Android Performance.