

Selecting a window in Perfetto UI, inspecting the main thread, RenderThread, and CPU states, then taking screenshots works well for one investigation. The harder question is whether another trace or device supports the same conclusion. I care more about being able to recompute that conclusion next time than about making one screenshot look convincing.
Part 11 covers PerfettoSQL and Trace Processor. The aim is straightforward: turn judgments made in the UI into queries that others can check, then use Python to run them across multiple traces. You do not need to become a SQL expert first. Treat a trace as a set of timestamped tables, and translate your visual assessment into a query you can run repeatedly.
The article follows one path: understand Trace Processor, express an assessment as a query over a defined time window, run it from the command line, process multiple traces with Python, and finally turn the results into stable metrics and Trace Summary output. Each step includes SQL you can reuse.
Perfetto Series Catalog
- Android Perfetto Series Catalog
- Android Perfetto Series 1: Introduction to Perfetto
- Android Perfetto Series 2: Capturing Perfetto Traces
- Android Perfetto Series 3: Familiarizing with the Perfetto View
- Android Perfetto Series 4: Opening Large Traces via Command Line
- Android Perfetto Series 5: Choreographer-based Rendering Flow
- Android Perfetto Series 6: Why 120Hz? Advantages and Challenges
- Android Perfetto Series 7: MainThread and RenderThread Deep Dive
- Android Perfetto Series 8: Understanding Vsync and Performance Analysis
- Android Perfetto Series 9: Interpreting CPU Information
- Android Perfetto Series 10: Binder Scheduling and Lock Contention
- Android Perfetto Series 11: PerfettoSQL, Trace Processor and Regression Detection
- Android Perfetto Series 12: Trace Dataflow and Data Loss
- Android Perfetto Series 13: Perfetto SDK, Track Event and App Field Traces
- Android Perfetto Series 14: heapprofd and Memory Profiling
- Android Perfetto Series 15: Boot Traces and Long-running Field Tracing
- Android Perfetto Series 16: GPU, Power Counters and Hardware Bottlenecks
- Android Perfetto Series 17: Scenario Automation and Platform Tracing
- Android Perfetto Series 18: Input Response Latency
- Video (Bilibili) - Android Perfetto Basics and Case Studies
- Video (Bilibili) - Android Perfetto: Trace Graph Types - AOSP, WebView, Flutter + OEM System Optimization
From Screenshot Conclusions to Queries Others Can Check
Part 03 covered basic Perfetto UI operations, Part 04 explained how to open large traces, and Parts 09 and 10 included SQL examples for CPU and Binder analysis. This article does not repeat those topics. It adds one thing: how to move from “this looks like the cause this time” to “we can measure it by the same standard next time.”
You can start here directly, but it helps to have four things ready: a .perfetto-trace file, the target app’s package name, a target time window you can select in the UI, and a working local trace_processor. The SQL below revolves around these four inputs.
The path from manual assessment to an automated report breaks down into these steps:
1 | Form an assessment in Perfetto UI |
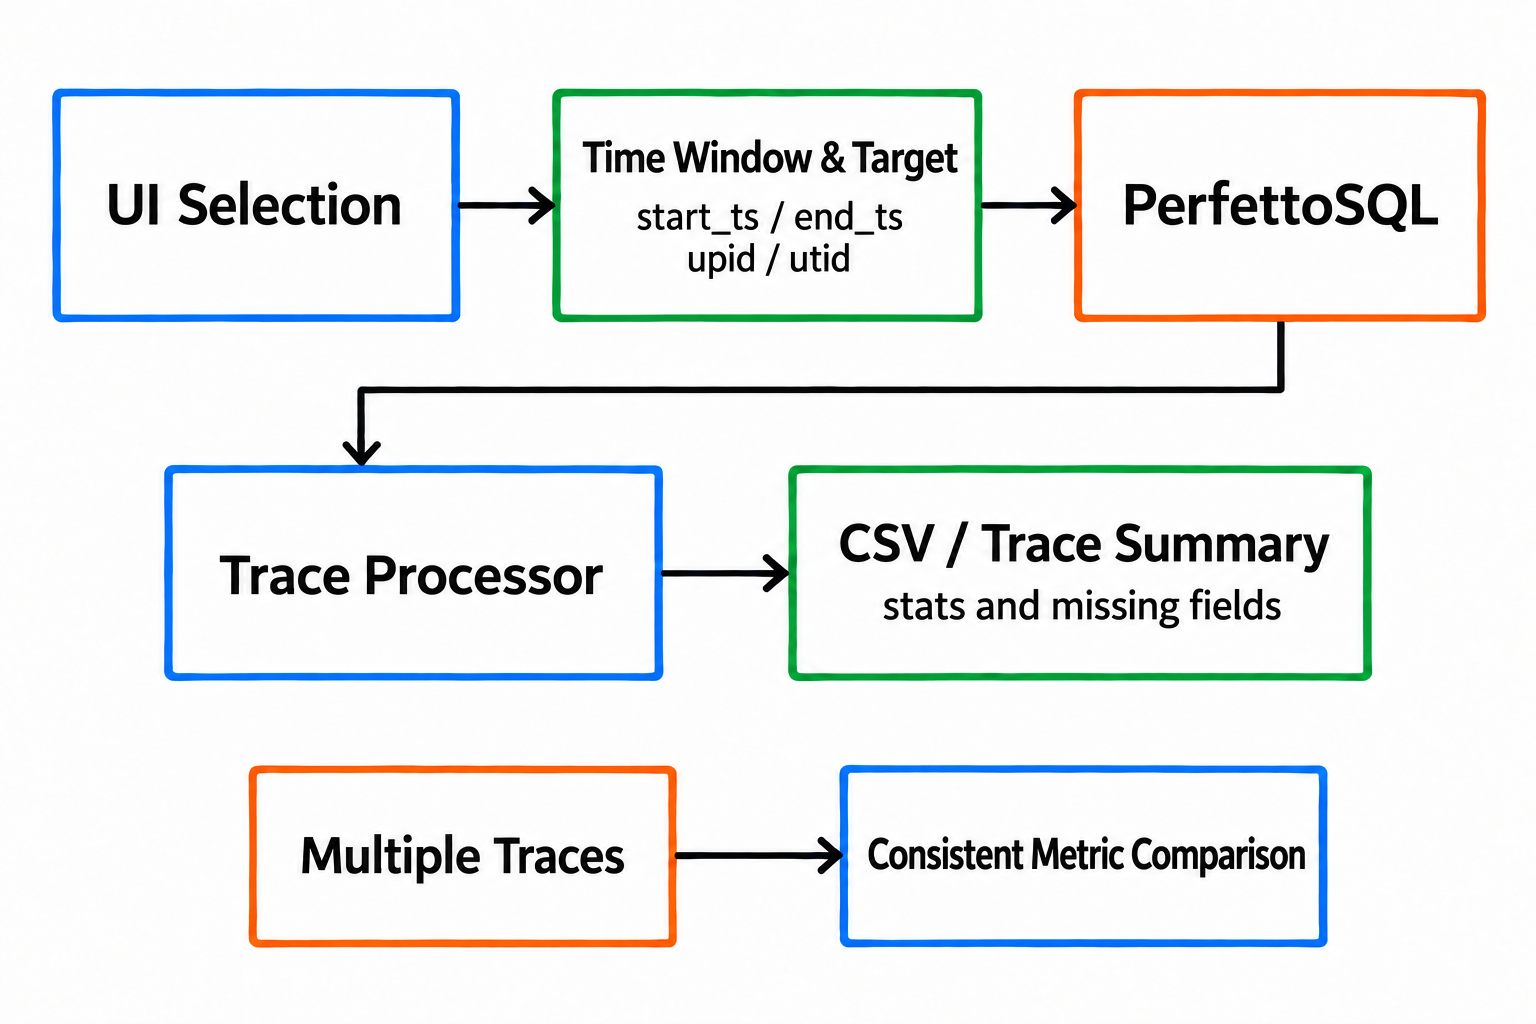
Diagram: fix the window, target, and quality conditions before using SQL results for batch comparisons.
There are three common engineering uses:
- Ad hoc investigation: find a suspicious interval in the UI, then use SQL to extract its time, thread, process, duration, and underlying evidence.
- Domain-specific analysis: inspect dozens of traces for the same class of problem, such as scrolling jank, tap response, or slow camera opening, and produce the same diagnostic fields.
- Regression detection: run the same queries for every version and put before/after results into reports or dashboards.
The UI remains valuable. SQL preserves the assessments made there so they can be checked and compared in bulk.
What Is Trace Processor?
Trace Processor is Perfetto’s analysis engine. It parses files such as .perfetto-trace, Chrome traces, and simpleperf protobufs into a unified set of SQL tables. Many tracks in Perfetto UI are also obtained by querying these tables and views.
Part 04 used trace_processor_shell --httpd to open large traces. Current official documentation calls the user-facing command trace_processor: the downloaded file is a Python wrapper that retrieves and caches the native Trace Processor executable for your platform on its first run.
First, install the command. These commands download trace_processor and confirm that it can enter the interactive SQL environment.
1 | curl -LO https://get.perfetto.dev/trace_processor |
Older documentation and scripts often use ./trace_processor trace.perfetto-trace directly. This default interactive mode still works, but new scripts should use explicit subcommands to make their purpose clear.
For command-line batch processing, focus on query. It loads the trace, executes SQL, and prints the results without opening the UI:
1 | ./trace_processor query trace.perfetto-trace \ |
For large traces, the UI can still use a local Trace Processor to reduce parsing work in the browser. The current subcommand syntax is:
1 | ./trace_processor server http trace.perfetto-trace |
This command only starts the local HTTP RPC server. Perfetto UI in the browser must still connect to that local Trace Processor at the address and port shown in the output before the local process takes over parsing.
Older entry points such as trace_processor_shell and --httpd retain compatibility support; prefer subcommands in new scripts. Two different ways of performing the same action can leave a team unsure which one is recommended six months later.
Think of a Trace as a Set of Tables
PerfettoSQL is the SQL dialect provided by Trace Processor. You do not need to memorize the entire schema to begin. Start with a few common table types:
| Type | Common tables | Purpose |
|---|---|---|
| Slices | slice |
Events with a start time and duration, such as ATrace, Track Event, and some imported or derived slices |
| Counters | counter, counter_track |
Values that change over time, such as CPU frequency, memory, power, and application counters |
| Threads and processes | thread, process |
Thread names, process names, tid, pid, utid, and upid |
| Tracks | track, thread_track, process_track |
Ownership of events such as slices and counters; visible UI tracks do not necessarily map one-to-one to these tables |
| Scheduling states | thread_state, sched |
thread_state records thread states; sched records the Running intervals when a thread actually occupies a CPU |
| CPU samples | perf_sample, cpu_profile_stack_sample |
Sample fact tables for CPU profiling |
| Stack dimension tables | stack_profile_* |
Stack information such as callsites, frames, and mappings, usually queried together with sample tables |
| Integrity | stats |
Collection-quality information, including data loss, parsing errors, and buffer problems |
The easiest distinction to miss is tid/pid versus utid/upid. System tids and pids can be reused, and a single trace can contain multiple threads with the same name. Trace Processor uses utid/upid to identify unique thread and process entities within that trace. Prefer utid/upid in scripts rather than relying solely on thread names.
Learn the time units early: ts and dur are generally in nanoseconds. The two conversion directions have different precision. In time.conversion, time_from_ms() performs multiplication and is exact for expressing thresholds; dur > time_from_ms(5) is easier to read than a bare 5e6. By contrast, time_to_ms() performs integer division ($nanos / (1000 * 1000), returning LONG), truncating 1.6 ms to 1. It is therefore suitable only for locating timestamps or coarse bucketing. Duration columns used in reports or before/after comparisons should use ROUND(dur / 1e6, 3), or submillisecond differences will disappear from the report. counter.value has no universal unit: interpret it using counter_track, the relevant module, and the collection configuration. CPU frequency, memory, power rails, and application counters cannot all be compared using the same AVG definition.
Another distinction matters: names such as thread_slice refer to views provided by the slices.with_context standard-library module, not raw schema tables. The module joins slices, tracks, threads, and processes for you, which is why you can query process_name, thread_name, and is_main_thread directly. When copying these queries, do not omit the preceding INCLUDE PERFETTO MODULE ... statement.
Classify SQL failures before changing anything. If INCLUDE PERFETTO MODULE fails or reports a missing module, your local Trace Processor is often too old and its standard library does not yet include that module; run ./trace_processor --version before deciding to upgrade. For no such table or no such column, first suspect a missing INCLUDE or schema evolution, and check column names with PRAGMA table_info(table_name);. A successful query returning zero rows is a third case: the data source may not have been collected, or the window may be wrong. That is not a syntax problem; return to stats and the collection configuration. These three cases need different responses, so do not immediately rewrite the SQL itself.
Scheduling states also depend on the collection configuration. To analyze thread_state, Running, Runnable, and wakeups, the trace needs ftrace scheduling events, particularly sched/sched_switch, sched/sched_wakeup, and sched/sched_waking. Running analysis mainly depends on switch events; explaining the relationship between wakeups and Runnable also requires wakeup/waking events. If these events are missing, the conclusion is “insufficient evidence,” not “no scheduling problem.”
CPU profiling has similar limits. perf_sample and cpu_profile_stack_sample contain sampled observations, not a complete execution record. Sampling frequency, sampling window, unwinding, symbolization, and lost-sample statistics all affect the conclusion. If the sample tables are absent, report “CPU profile not collected,” not “no CPU hotspot.”
Expressing a Complete Analysis in SQL
Consider a common scenario: you notice a clear main-thread stall within a target window in the UI and want to turn that assessment into a query others can check. The window may come from a UI selection, Track Event marker, input event, or the start and end of a frame/CUJ.
Collection Quality Determines the Strength of the Conclusion
Check collection quality before writing any conclusion. stats includes ordinary counters as well as errors and data loss. An automated gate should not treat every nonzero item as failure. First list the items that directly limit the conclusion, then decide per data source whether to recollect, downgrade confidence, or restrict the impact to particular metrics.
The official statistics definitions use types such as kError, kDataLoss, and kInfo, but query values in stats.severity are lowercase strings. This query retains the original name/idx/severity/source/value fields and adds an impact hint. A generic entry point should not classify every error or data_loss item as fatal to the entire trace.
1 | SELECT |
If the results include data_loss, parser errors, buffer overruns, or packet loss, qualify subsequent conclusions. ftrace loss directly affects sched/thread_state/wakeup assessments, but does not necessarily invalidate all app Track Events. Missing FrameTimeline data affects frame metrics, but may not affect Binder or memory queries. Preserve the detailed stats in the report, then decide for each metric whether to recollect, exclude, or downgrade.
When optimizing the collection configuration, broaden the filter to value != 0 and inspect the full stats table. Informational items such as buffer size, write volume, and ftrace counters can also explain why data was lost. Part 12 covers the full classification of data loss; here, the aim is to make the check part of the automation entry point.
For frame metrics, also check whether FrameTimeline data exists. Long slices are not a definition of slow frames. FrameTimeline’s actual/expected frames, jank types, and overruns are the data needed to answer frame-level regression questions:
1 | SELECT 'actual' AS table_name, COUNT(*) AS row_count |
This query always returns two rows. A row_count = 0 does not necessarily mean the trace is broken; the Android version, collection configuration, or scenario may not support that data. Report “frame metrics unavailable” rather than substituting long RenderThread slices for a slow-frame conclusion.
Fix the Target Window First
The target window cannot remain “a range selected in the UI.” A script needs explicit start_ts/end_ts values, and subsequent long-slice, scheduling-state, and frame queries must use the same window. The most reliable source is a Trace.beginSection() or Track Event marker emitted by the app itself:
1 | INCLUDE PERFETTO MODULE slices.with_context; |
If the window comes from a frame, CUJ, input event, or UI selection, first express it using the same fields. For example, select a target frame from FrameTimeline and use ts and ts + dur as the window. If the query returns zero rows, the report should say metric_status=unavailable and degrade_reason=missing_frame_timeline, rather than falling back to long RenderThread slices as frame metrics:
1 | INCLUDE PERFETTO MODULE time.conversion; |
To keep the examples short, the queries below still hardcode a window in a target_window CTE. Production scripts should pass window_source/window_name/start_ts/end_ts from metadata or a preceding query and include those fields in the report.
Do Not Find Threads by main Alone
Many examples simply use thread.name = 'main'. That looks convenient for one app, but can select unrelated threads in a system trace because every app may have a main thread. First list the threads in the target process to establish their upid/utid identities:
1 | INCLUDE PERFETTO MODULE time.conversion; |
A NULL first_thread_start_ms means that the trace did not record the thread’s creation time, commonly because the thread already existed when recording began. Do not treat NULL as zero or infer that the thread does not exist.
Replace com.example.app with your package-name prefix. Multiprocess apps may include :remote, :push, WebView sandboxes, and isolated processes. For UI rendering issues, prioritize the process hosting the Activity, FrameTimeline, or app marker. For a cross-process application path, retain multiple upid values rather than collapsing them into one “total app duration.”
Long Slices Identify Suspects Only
The PerfettoSQL standard library provides prejoined views that avoid many error-prone JOINs. This SQL includes slices.with_context and time.conversion to find thread slices longer than 5 ms within the target window.
The times in target_window are trace timestamps, still in nanoseconds. In practice, replace them with start and end times derived from a UI selection, Track Event, or input event.
1 | INCLUDE PERFETTO MODULE slices.with_context; |
This query corresponds to “find long main-thread tasks” in the UI. It cannot directly establish a root cause or replace slow-frame metrics. It lists suspicious work in the target window: the thread, the slice, its overlap with the window, and the original slice duration.
Runnable Is Not Running
A long slice may contain prolonged execution, or it may span time spent waiting. Inspect scheduling states next. thread_state.state = 'Running' represents intervals actually occupying a CPU. States such as R and R+ mean the thread is runnable but is not executing on a CPU; R+ typically means it remains runnable after preemption.
Before scheduling analysis, check whether thread_state/sched data exists within the same window. If the target thread cannot be matched, or stats contain ftrace loss/drop/error, report insufficient_sched_evidence or sched_evidence_grade=weak:
1 | WITH target_window(start_ts, end_ts) AS ( |
The next query remains within the same target window and separates Running, Runnable, S, and D for the main thread and RenderThread:
1 | WITH target_window(start_ts, end_ts) AS ( |
S commonly occurs during normal sleep or futex waits; D is closer to an uninterruptible wait. Before attributing a cause, examine the blocked reason, io_wait, and waker fields in thread_state, together with the schema version. In scenarios such as tap response, the first scrolling frame, or the first launch frame, a long Runnable interval means CPU contention or scheduling delay also needs investigation, but cannot establish the cause alone. Thread running time is a thread-level metric. To explain CPU utilization and cluster behavior, separately inspect sched.cpu, CPU idle, CPU frequency, and capacity within the same window.
Move the Query to the Command Line
Save the same SQL as queries/slow_slices.sql and run it with Trace Processor:
1 | ./trace_processor query \ |
At this point, the analysis has moved from screenshots to a text file. A text file can be reviewed, reused, included in CI, and sent to colleagues for verification.
Batch Analysis with the Python API
You can inspect one trace carefully in the UI; multiple traces call for a script. The script needs to do four things: read the trace, read its matching .json metadata file, run quality gates, and emit stable fields for the same target window. Pay particular attention to TraceProcessor(trace=...), tp.query(...), and the report’s column names.
1 | pip install perfetto |
A regression platform should not depend on downloading tools on first use. CI should pin the Python perfetto package version and prewarm or cache the native Trace Processor. TraceProcessorConfig(bin_path=...) can point directly to a preinstalled binary, avoiding an on-demand download on the CI machine’s first run. Record trace_processor --version, the TraceConfig id, and the SQL package version in metadata. Otherwise, a tool upgrade can change the parsing assumptions between before and after.
1 | import csv |
metadata.json must provide window_start_ts/window_end_ts as integer nanoseconds. The script stops if they are missing; it must not guess the window. frame_timeline_available only means that frame records exist somewhere in the trace, and no_selected_stats_findings only means the selected statistics raised no alarms. Neither proves that the target window is complete. sched_coverage is also only a check of state-interval coverage and must still be considered alongside ftrace loss. When there are no slow slices, the summary row has no thread identity, so its scheduling columns remain blank. When one utid has multiple slow-slice rows, running_ms/runnable_ms repeat on each row; deduplicate by utid before aggregating these columns.
This script is still a starting point, but already has three properties needed for long-lived scripts: the same windowed SQL, the same thresholds, and the same output structure. quality/*.stats.json preserves the queried stats details, while the CSV expresses reasons for downgrading through quality_grade/degrade_reason/data_loss_sources. SLOW_SLICE_QUERY_TEMPLATE only considers the main thread and RenderThread in the target window, avoiding the mistake of treating long background-thread tasks elsewhere in the trace as evidence of UI jank.
As the number of traces grows, replace the handwritten loop with the official BatchTraceProcessor. It reuses the same PerfettoSQL and can return results separately for each trace, or combine them into a table with source information through query_and_flatten():
1 | pip install perfetto pandas |
1 | import glob |
This kind of batch processing suits lab regression testing and large collections of field traces. Memory and concurrency must be controlled: before loading hundreds of large traces at once, try a small sample, check memory consumption and query duration, then scale up.
From Ad Hoc Queries to Stable Metrics
Ad hoc SQL is for exploration; stable metrics are for long-term comparison. Before integrating a query into an engineering workflow, define at least four sets of constraints:
- Output contract: fix column names, units, and sort order.
dur > time_from_ms(5)is better suited to long-lived scripts than a bare5e6. A name such asoverlap_total_mstells the reader that the value has already been intersected with the target window. - Identity: use
utid/upidfor multiprocess scenarios. Thread names are readable labels, not unique identifiers;main,RenderThread, andBinder:*can all repeat. - Target window: taps, launches, the first scrolling frame, and camera opening cannot be assessed solely through whole-trace totals. Include
window_source/window_name/window_start_ms/window_dur_msin the report. - Data quality: every trace needs detailed stats and downgrade fields.
quality_grade/degrade_reason/missing_sources/fallback_usedserves a regression gate better than a single total.
For complex JOINs, look for standard-library views first. thread_slice, process_slice, and thread_or_process_slice reduce basic mistakes. Prefer Trace Summary for long-term projects: the official direction is v2 summary for structured output, rather than starting a new solution around the older v1 metrics.
A useful test is whether the query result can go directly into a version comparison. If someone still has to explain that “this column was called A last time and B this time,” it is not yet a stable metric.
Another easily missed requirement is how to interpret a metric when something goes wrong. “Cumulative duration of main-thread slices over 5 ms” only describes long tasks among the slices; it cannot independently prove jank. “Total Runnable time” only indicates that the thread spent time waiting for CPU and does not replace CPU frequency, load, or scheduler evidence. If FrameTimeline is missing, the report should say metric_status=unavailable, fallback_used=false, and degrade_reason=missing_frame_timeline. If ftrace loss is detected, scheduling metrics should carry sched_evidence_grade=weak.
Nested slices overlap in time. SUM(overlap_dur) is a cumulative slice quantity, not nonoverlapping wall-clock time or CPU time. Nor can parent and child slices simply be added together to calculate thread utilization.
CPU frequency, CPU idle, thermal conditions, and cluster/CPU placement within the same target window fit better as explanatory variables in the report. They usually do not establish a cause on their own, but can explain why the same application slice is slower in one trace.
Regression Questions Require Multiple Traces
A single trace helps locate a problem in one captured occurrence. Multiple traces are needed to answer whether an optimization improves performance consistently. Many performance reports suffer less from the traces themselves than from how the evidence is organized: lots of screenshots and strong conclusions, but no fixed configuration, sample count, data-loss check, or consistent before/after statistics.
For multiple-trace analysis, first fix the input contract. The minimum set is trace_name/scenario/group/device/build/config_id; duration_ms/thermal_state/trace_processor_version/sql_package_version helps rule out environmental and tool drift. Each batch should include at least these fields:
| Field | Example | Purpose |
|---|---|---|
trace_name |
after-run03.perfetto-trace |
Locate the original file |
scenario |
feed_scroll_120hz |
Distinguish scenarios |
group |
before / after |
Compare versions |
device |
Pixel_8 |
Aggregate by device model |
build |
UP1A.xxx |
Identify the system version |
config_id |
ui_jank_v4 |
Confirm consistent TraceConfig |
duration_ms |
30000 |
Assess the collection window |
thermal_state |
nominal |
Rule out thermal interference |
trace_processor_version |
v49.0 |
Rule out parser or standard-library changes |
sql_package_version |
perf-v3 |
Confirm consistent query logic |
These fields can come from filenames, metadata, or a test platform, or be stored in the case package’s metadata.json. Without them, the numbers are difficult to interpret.
This CSV uses hypothetical values and adds conclusion_level/next_action after manual review. Its quality_grade values match those produced by the script above:
1 | trace_name,group,scenario,window_name,quality_grade,degrade_reason,ftrace_loss_count,frame_timeline_available,thread_name,slice_name,slice_count,overlap_total_ms,runnable_ms,conclusion_level,next_action |
Do not reduce quality problems to one total. ftrace loss directly affects sched/thread_state/wakeup conclusions, but does not necessarily invalidate all app Track Events. Missing FrameTimeline data affects frame metrics, but may not affect Binder or memory analysis. Retain at least name/source/idx or aggregate by data source, then let regression gates decide whether to recollect, exclude, or downgrade according to each metric’s dependencies.
Do not judge regressions solely by averages, either. Keep the median, p95, worst value, and raw value from each run:
| Metric | Direction | Suggested assessment |
|---|---|---|
| FrameTimeline overrun / jank rate | Lower is better | Inspect p95_frame_overrun_ms, worst_frame_overrun_ms, jank_count, jank_rate, and the jank_type distribution; use valid_frame_count to state the sample size |
| launch duration | Lower is better | Define its start and end separately; do not mix it with frame duration |
| jank count / jank rate | Lower is better | Retain total frame count, valid frame count, window duration, and proportion |
| slow binder count | Lower is better | Examine both the count and whether events cluster in the same phase |
| CPU Running time | Depends | Interpret alongside scenario actions and frame windows |
| RSS/PSS/unfreed native allocations | Usually lower is better | Inspect peaks, growth slope, and whether values fall again |
| battery current / power rail | Depends | Meaningful only for A/B comparisons on the same device under the same conditions |
Five before/after runs can reveal obvious regressions, but cannot establish a 1% or 2% change. State sample counts and environmental conditions explicitly. Downgrade conclusions when samples are insufficient, thermal states differ, or quality gates are not clean.
Use Trace Summary for Long-Term Metrics
Direct SELECT queries are flexible, but their output schema changes with the query. Platforms, dashboards, and CI need a stable structure. Trace Summary is designed to place metrics into a unified TraceSummary protobuf.
The current command-line entry point is the summarize subcommand. If you downloaded the trace_processor wrapper earlier, keep using that entry point.
The following minimal spec.textproto demonstrates Trace Summary using a memory metric. Memory is chosen simply to keep the example short. Once the SQL for long slices, frames, Binder, or other metrics stabilizes, those can be migrated in the same way.
1 | metric_spec { |
Run this summary spec and request the memory_per_process metric:
1 | ./trace_processor summarize \ |
The source-tree command trace_processor_shell summarize expresses the same operation. The older --summary --summary-spec ... --summary-metrics-v2 ... form remains supported, but new scripts should prefer subcommands so they are easier to follow alongside the official documentation.
Trace Summary suits long-term metrics: memory, launch, frames, Binder, CPU, and power data tracked across versions. For ad hoc troubleshooting, direct SQL remains useful. When migrating frame metrics, output app FrameTimeline metrics separately from SurfaceFlinger/display metrics; do not treat long RenderThread slices as frame duration.
A summary spec must at least define the metric id, dimensions, and value. An individual metric_spec can declare unit and polarity directly—for example, BYTES for memory with LOWER_IS_BETTER. For templates, value_column_specs can declare units and directions separately for multiple value columns. Consumers of the protobuf then know how to sort, flag, and compare values.
Another capability useful for platform integration is metadata_query_id. If the spec also defines a metadata query returning key / value, the command line can use --metadata-query, and the Python API can pass metadata_query_id. This carries fields such as device, build, scenario, and config_id alongside the summary, so later aggregation does not have to guess from filenames.
Start with Python + CSV if that fits the project. Once fields stabilize, consumers are established, and metrics need long-term maintenance, migrate the key metrics to Trace Summary.
Common Pitfalls
- Treat time columns such as
ts/duras nanoseconds by default. Use report names such asdur_ms/overlap_ms, andtime_from_ms()for thresholds to avoid unit mistakes. For durations, useROUND(x / 1e6, 3), nottime_to_ms(), which truncates to whole milliseconds. Check track and module definitions separately for counter/value fields. - A slice with
dur = -1is an event that remained open when the trace ended. Handle it before intersecting windows or calculatingSUM(dur); the examples in this article filter withdur > 0. If the target event itself is unclosed, explain it separately rather than counting it as an ordinary long slice. mainandRenderThreadare not unique. Filterprocess_name/upidfirst, thenthread_name/utid. Includeupid/utidin reports to avoid collisions between thread names.pid/tidcan be reused. Preferupid/utidin scripts, retaining tid/pid as auxiliary fields when correlating with system logs.- A visible UI track does not necessarily correspond to a single raw table. State the data source in the report—for example,
thread_slice,thread_state, oractual_frame_timeline_slice—to avoid confusing the presentation layer with the schema. RandR+mean Runnable; onlyRunningmeans actual execution. Separaterunning_ms/runnable_ms/sleeping_ms/uninterruptible_blocked_msin reports instead of merging them into “thread busy.”- If
statsreports data loss, avoid strong conclusions. Keepname/source/idxanddegrade_reason, and assess the impact according to metric dependencies. - Schemas evolve. When a batch script fails, first use
PRAGMA table_info(table_name);to confirm that columns exist. Retaintrace_processor_version/sql_package_versionin the report. - Do not compare metrics when before and after use different TraceConfigs. Output
config_idand recollect first if they differ. - Keeping only the report, without the original trace, configuration, SQL, and metadata, prevents later reproduction. At minimum, retain the trace filename, configuration id, SQL version, and window source.
Conclusion
Do not treat screenshots as conclusions. Screenshots help you spot problems; SQL, metadata, quality gates, and repeatable output turn the assessment into regression evidence.
For the next trace you receive, follow this order: check stats, fix the target window and upid/utid, then write long slices, Running/Runnable, frame metrics, and downgrade reasons into CSV or Trace Summary. SQL makes an assessment checkable, but cannot replace collection quality or scenario definition. With the wrong window, lost trace data, or changed configuration, even elegant queries produce untrustworthy numbers.
I have automated this “stats health check → fixed window → SQL evidence → repeatable output” workflow in my open-source project SmartPerfetto. PerfettoSQL queries like those in this article have become more than two hundred scenario-specific SQL skills and evidence rules connected to an AI agent runtime. Given a trace, it automatically checks its health, selects a scenario strategy, and produces conclusions with evidence grades. Start there to experience the complete workflow; see SmartPerfetto Six-Week Update for an overview of the current version’s capabilities.
References
- Trace Processor
- Trace Processor Python API
- Getting Started with PerfettoSQL
- PerfettoSQL standard library
- PerfettoSQL Prelude tables
- Trace Processor Stats
- Trace Summarization
- Batch Trace Processor
Source revision checked: b23c67be1159e3f0b0657bd97be9e139e0d8ee2c (2026-09-19).
About Me and the Blog
Follow Android Performance.