

A system trace can tell you when a thread ran, which CPU core it ran on, and which FrameTimeline frame missed its deadline. With Binder/ftrace/sched evidence enabled, it can also reconstruct Binder calls and clues about waiting. But it does not know which frame ID a player is decoding, which scene a game engine is loading, or how long an application task has spent in a queue.
This article answers one question: how do application semantics enter a trace? The system can tell you that the main thread was slow; Track Event tells you which frame was being decoded, which queue was blocked, and which request moved between threads. Combining the two lets you narrow “the main thread was slow by 18 ms” to a candidate texture-upload interval around frame 1082, then continue validating it with RenderThread/HWUI, GPU, and FrameTimeline evidence.
The article follows the practical integration order: decide whether instrumentation is needed and at which layer, define an application-phase dictionary and backend, then build the minimal integration, category controls, combined system capture, and cross-thread flows. Finally, control write volume and define the app-side field tracing protocol.
Perfetto Series Catalog
- Android Perfetto Series Catalog
- Android Perfetto Series 1: Introduction to Perfetto
- Android Perfetto Series 2: Capturing Perfetto Traces
- Android Perfetto Series 3: Familiarizing with the Perfetto View
- Android Perfetto Series 4: Opening Large Traces via Command Line
- Android Perfetto Series 5: Choreographer-based Rendering Flow
- Android Perfetto Series 6: Why 120Hz? Advantages and Challenges
- Android Perfetto Series 7: MainThread and RenderThread Deep Dive
- Android Perfetto Series 8: Understanding Vsync and Performance Analysis
- Android Perfetto Series 9: Interpreting CPU Information
- Android Perfetto Series 10: Binder Scheduling and Lock Contention
- Android Perfetto Series 11: PerfettoSQL, Trace Processor and Regression Detection
- Android Perfetto Series 12: Trace Dataflow and Data Loss
- Android Perfetto Series 13: Perfetto SDK, Track Event and App Field Traces
- Android Perfetto Series 14: heapprofd and Memory Profiling
- Android Perfetto Series 15: Boot Traces and Long-running Field Tracing
- Android Perfetto Series 16: GPU, Power Counters and Hardware Bottlenecks
- Android Perfetto Series 17: Scenario Automation and Platform Tracing
- Android Perfetto Series 18: Input Response Latency
- Video (Bilibili) - Android Perfetto Basics and Case Studies
- Video (Bilibili) - Android Perfetto: Trace Graph Types - AOSP, WebView, Flutter + OEM System Optimization
When Application Semantics Are Needed
If there is no gap in application semantics, you do not need to integrate the SDK. Choose the tool for the scenario first:
| Scenario | Recommendation |
|---|---|
| Temporarily marking function duration in Java/Kotlin | Use android.os.Trace or AndroidX tracing, and enable app atrace during capture |
| Long-term instrumentation in Android native / C++ modules | Use Track Event from the Perfetto SDK |
| Cross-platform engines, games, players, and Camera pipelines | Use Track Event with stable arguments and counters |
| Complex structured state that ordinary slices/counters cannot express | Consider a custom DataSource |
| Only system thread states, Binder, or frequencies are needed | Start with system data sources; no SDK is needed without an application-semantics gap |
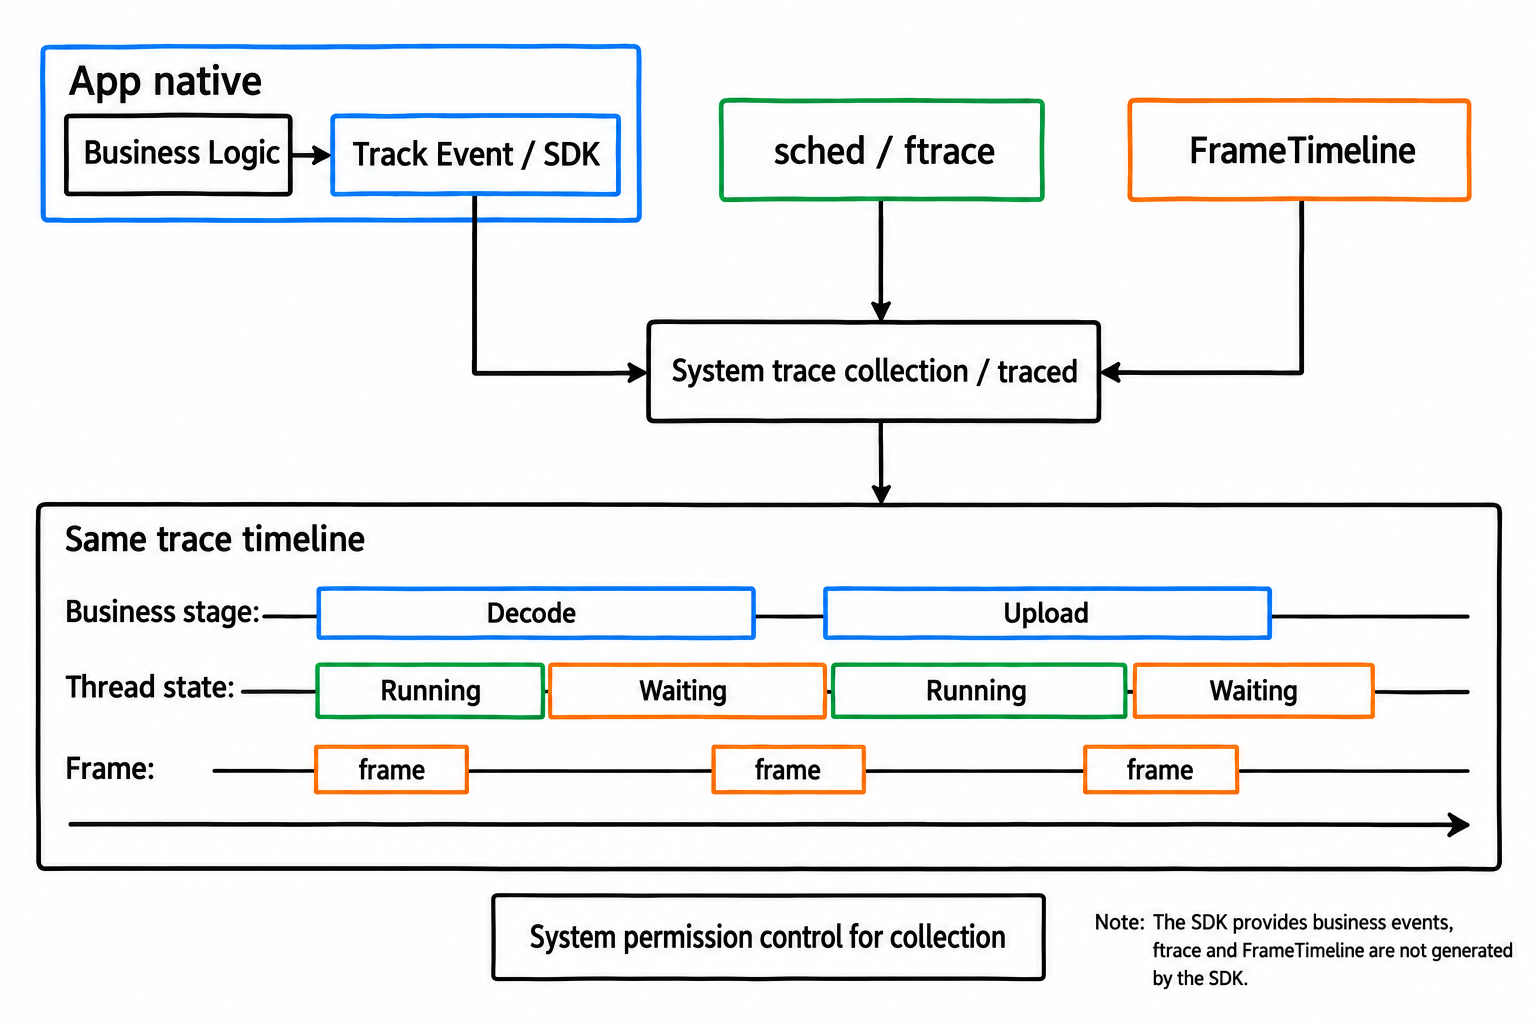
Diagram: a system-backend session places app events and independent system data sources in the same trace.
For Android-only use cases, the official guidance also recommends continuing to use android.os.Trace and NDK ATrace_* when they are sufficient. These events enter Perfetto through the atrace path and suit ordinary app function markers. During capture, configure atrace_apps: "com.example.app" in linux.ftrace, or use -a com.example.app on the command line to enable the app. The SDK still suits Android native, cross-platform, and structured application-semantics scenarios; simple Android-only sections do not need to replace ATrace just for consistency.
The Perfetto SDK is better suited to native and cross-platform modules. It produces Track Events directly and supports categories, slices, counters, flows, arguments, and independent tracks, making it convenient to place them on the same timeline as system traces. This article uses the C++ SDK. The upstream repository also provides Java and Rust SDKs, so “official support is C/C++ only” is no longer a valid selection premise. Java/Kotlin projects can evaluate integration and distribution of upstream PerfettoTrace / PerfettoTrackEventBuilder, or use an existing JNI wrapper; simple sections can continue using android.os.Trace.
Choose app-side tracing capabilities by their boundaries:
| Capability | Typical use | Version and field constraints |
|---|---|---|
android.os.Trace / AndroidX Trace |
Coarse Java/Kotlin sections | App tracing is available by default on Android 12–17; the capture configuration must still enable atrace_apps |
NDK ATrace_* |
Coarse native sections | Available on Android 12–17; check the target SDK and device for specific async/counter APIs; also uses atrace |
AndroidX tracing-perfetto |
App-controlled startup/local Perfetto capture | Handles in-app capture and initialization, not end-to-end system cold-start analysis |
Perfetto SDK kSystemBackend |
Writing Track Events from native / cross-platform modules into system traces | Android 12–17 enables tracing services by default; still check the producer socket, SDK version, and capture permissions on the device |
ATrace also has overhead. Adding android.os.Trace / ATrace_* to hot loops, every lock attempt, or every object lets JNI, trace_marker, and the kernel path themselves perturb the result. Java/Kotlin and NDK ATrace are better suited to coarse sections. For high-frequency application state, prefer SDK category gating, sampling, or debug categories that are disabled by default.
SDK Integration Boundaries
The Perfetto SDK offers two layers of capability:
| Capability | Suitable for expressing | Cost |
|---|---|---|
| Track Event | Function durations, application phases, queue lengths, frame IDs, request IDs, and cross-thread relationships | Low integration cost; native support in Trace Processor and the UI |
| Custom DataSource | Custom protobuf state, high-frequency structured data, and specialized binary formats | Requires schema maintenance and usually additional Trace Processor parsing |
Prefer Track Event whenever slices, counters, flows, and arguments can express the problem. A custom DataSource has a higher entry cost and is not a good first instrumentation design.
A custom DataSource suits two situations: ordinary slices, counters, and debug annotations cannot express the structure, such as a periodic subsystem state dump; or the data volume requires a strongly typed schema to reduce the size of each event.
Its cost is also direct: Trace Processor does not understand your protobuf by default, so you must add parsing, query tables, or Trace Summary output. Starting with Track Event avoids maintaining an entire additional data format.
Define the Application-Phase Dictionary Before Writing Code
Track Event is not about placing a macro in every function. I would define the application-phase dictionary before writing the instrumentation: event names, phases, field units, and the fallback when a field is missing. The SQL and reports depend on those choices.
event_name |
category |
phase |
Required arguments | Optional arguments | Units / identity scope | Sampling | Report metrics |
|---|---|---|---|---|---|---|---|
DecodeFrame |
player |
decode | frame_id, stream_id, codec |
width, height |
frame_id is unique within stream_id |
Once per frame; enable debug fields as needed | decode_dur_ms, decode_max_ms |
UploadTexture |
rendering |
upload | frame_id, texture_bytes |
surface_id |
texture_bytes is in bytes |
At most once per frame | upload_dur_ms, upload_bytes |
RenderSubmit |
rendering |
submit | frame_id, surface_id |
queue_depth |
queue_depth is in items |
Once per frame | submit_dur_ms, queue_depth_items |
WaitForBuffer |
camera |
wait | request_id, buffer_queue |
producer |
request_id is unique within a session |
Record only when the wait exceeds a threshold | wait_for_buffer_ms |
Renaming or deleting fields, or changing units, requires incrementing arg_schema_version. Long-term report fields should be called frame_id / request_id from the application schema, rather than debug.frame_id; also record frame_id_domain, nullable_policy, and compatibility policy. When RenderSubmit is missing, the report can describe only decode/upload phases and must withhold end-to-end conclusions. Set missing_marker=RenderSubmit and evidence_grade=partial.
Two Backends Solve Different Problems
The Perfetto SDK can use either an in-process backend or the system backend:
| Backend | Who controls the trace | Suitable scenarios |
|---|---|---|
kInProcessBackend |
The app creates its own tracing session | Single-process validation, offline testing, and application events alone |
kSystemBackend |
An external perfetto command or system service |
Combined analysis with sched, freq, Binder, and FrameTimeline |
The system backend is more common in Android performance analysis. The app is only a producer; the system tracing session decides when to start and stop. Make this boundary explicit in the design: when recording system traces, the app must not read the complete system trace itself, to avoid accessing other processes’ data.
Using Android 17 as the current reference, devices running Android 12 or later can use a text TraceConfig with the system backend for laboratory and local reproduction. Default integration into production products still requires separate evaluation of compatibility, package size, and enablement policy.
Minimal Integration Skeleton
The minimal integration addresses three things: stable categories, the system backend, and queryable event names. A native module can use this skeleton.
1 | // tracing_categories.h |
The header only declares categories. Category names enter traces and subsequent SQL, so keep them stable; do not embed dynamic IDs, page-instance IDs, or request numbers in them.
1 | // tracing_categories.cc |
PERFETTO_TRACK_EVENT_STATIC_STORAGE() provides the static storage required for Track Event registration. Place it in only one .cc file to avoid multiple definitions.
1 | // tracing_init.cc |
Initialization selects the backend and registers the categories defined above with Track Event. Android system tracing usually uses kSystemBackend, allowing app events to appear in the same trace as system sched, Binder, and FrameTimeline data.
You can then instrument application code. This example uses a slice for duration and an argument for the frame ID:
1 | void DecodeFrame(int frame_id) { |
TRACE_EVENT is scoped: it begins on entering the current scope and ends on leaving it. It suits synchronous work such as decode, layout, upload, and submit.
Use TRACE_EVENT_BEGIN and TRACE_EVENT_END for events that do not follow function scope. They help with phases spanning multiple functions, but do not scatter begin/end calls across unrelated call paths: that can confuse same-thread slice nesting, mismatch endings, or make SQL interpretation difficult.
SDK integration also has a build boundary. The official C++ SDK is a C++17 library, commonly distributed as the amalgamated perfetto.h and perfetto.cc source files for integration into existing native build systems.
Adding perfetto.h alone is insufficient. Check the language standard, threading library, symbol stripping, package-size increase, and whether Tracing::Initialize() has completed early in app-process startup.
Take care with early startup as well. The C++ SDK records ordinary Track Events only after a tracing session is enabled. AndroidX tracing-perfetto offers startup initialization, but it addresses the app’s own startup capture, not system cold-start analysis. Cold-start analysis still needs system signals such as ActivityTaskManager, zygote, Binder, the main thread, and first-frame presentation.
Decide initialization timing and process boundaries together. Call Tracing::Initialize() only once per process, on a deterministic process-entry path such as JNI_OnLoad or a shared-library load triggered by Application#onCreate, with idempotence protection. Track Events emitted before registration are silently discarded without errors, making them difficult to distinguish from actual packet loss later. Every process in a multiprocess app needs its own Initialize + Register; subprocesses such as :remote and :player do not inherit the main process’s initialization. With the system backend, starting a process after the tracing session has begun is fine: once its producer connects to traced, matching data sources are enabled automatically. Events before that connection simply do not exist; do not interpret that gap as application idleness.
Categories Are Production Controls
Categories determine which events are enabled. Design them as a configuration interface rather than inventing names casually. In the C++ SDK (perfetto::Category), categories without debug or slow tags are enabled by default when no rule matches. The C SDK (PerfettoTeCategory) behaves oppositely: unmatched categories are disabled by default.
The main rule for production presets is simple: explicitly set disabled_categories: "*", then allowlist the required categories. This avoids C/C++ default differences and accidental enablement of debug categories in the field. The debug and slow tags are disabled by default; enable them explicitly for targeted analysis.
Common divisions are:
player: major player phases such as prepare, decode, and render.rendering: render submission, texture upload, and scene transitions.camera: requests, HAL callbacks, and buffer queues.pipeline.debug: high-frequency debugging events; add thedebugtag when defining the category.pipeline.slow: events with higher overhead; add theslowtag when defining the category.
Design categories around subsystems and enablement granularity, not pages, experiment groups, or request types. Put those details in arguments or metadata to avoid an explosion in category count.
This configuration selects categories explicitly:
1 | buffers { |
The benefit is that field captures can change which application events are enabled through configuration alone, without replacing the app build. With the system backend, track_event may come from multiple producers. Field or production presets should constrain scope using producer_name_filter or a regex. The example’s com.example.app is a placeholder: confirm the actual producer name from the trace, data-source list, or producer list first. Use multiple exact filters or regex filters for multiprocess apps.
Capture Alongside System Traces
Application events explain “what the application is doing.” System events explain “why this work is slow.” A combined capture usually places track_event and ftrace in the same configuration:
1 | buffers { size_kb: 131072 fill_policy: RING_BUFFER } # 0: sched / ftrace |
After recording, confirm with SQL that the events arrived. This query uses the thread_slice view introduced in Part 11 to retrieve process names, thread names, and application arguments directly. thread_slice, provided by slices.with_context, already joins slice, track, thread, and process context. When reading this article independently, keep the preceding INCLUDE.
1 | INCLUDE PERFETTO MODULE slices.with_context; |
This query suits Track Events or atrace slices on default thread tracks. Events on independent tracks or process tracks may lack a utid and therefore may not appear in thread_slice. Use process_slice, thread_or_process_slice, or query slice JOIN track directly and reconstruct context from track.name/parent_id.
The query does more than confirm event presence: its results can be correlated by time range with thread_state, CPU frequency, Binder events, and FrameTimeline. A TrackEvent slice is evidence on the application timeline; it does not mean the CPU was executing that work continuously. CPU execution requires additional correlation with sched / thread_state, distinguishing the default ThreadTrack, custom Track, and cross-thread flows. Ordinary key/value arguments enter args as debug annotations, read in SQL as debug.<key>. Typed TrackEvent fields do not use this debug.* argument representation; they require corresponding parsing, tables, or dedicated fields.
Time-range correlation is only the first step. An app’s frame_id identifies an application frame; FrameTimeline’s frame/vsync identifies a system frame. Temporal overlap alone can assign queuing, prerendering, or cross-thread work to the wrong frame. Confirm against Choreographer frame/vsync, JankStats frame start, RenderThread/HWUI slices, and actual_frame_timeline_slice / expected_frame_timeline_slice.
The frame_id here is a debug annotation, suitable for investigation and ad hoc SQL. Debug annotations are debugging fields by default. If they feed long-term metrics, freeze their names, types, units, defaults, and migration policies as an interface. Consider typed TrackEvent fields or custom DataSources only when you control Perfetto proto definitions, parsing, and release procedures. Field presets can also use filter_debug_annotations / filter_dynamic_event_names to reduce privacy and size risks.
Application-phase reports must check all three required markers using the composite process/session/stream/frame key; seeing RenderSubmit alone does not make the record complete. The following query requires all three phases to include session_id/stream_id/frame_id. The earlier minimal single-marker example includes only frame_id, so add the remaining arguments first. Keep events lacking identity fields separate as missing_identity; do not combine them with other null-ID events.
1 | INCLUDE PERFETTO MODULE slices.with_context; |
Here, complete means only that the number and closure state of the application markers satisfy this example’s contract. It does not prove that the frame was displayed. The following report illustration includes additional FrameTimeline correlation and expansion of missing items; it is not the direct output of the SQL above:
1 | trace_name,scenario,frame_or_request_id,phase,start_ms,dur_ms,thread_name,frame_jank_type,evidence_grade,missing_marker |
Use Flows or Independent Tracks for Cross-Thread Tasks
Many application delays occur between queues rather than inside a single function. For example, a UI thread submits a request, a decoder thread processes it, and a render thread consumes it. Same-thread slices alone make it hard to recognize that they belong to the same frame.
Flows can connect related events. Do not directly use an easily reused application frame_id as a flow ID; first allocate a token that will not be reused within the process. Hash64 below is a placeholder for a composite hash you must provide, not a Perfetto API. Hashes do not guarantee freedom from collisions. A production implementation should allocate a monotonically increasing 64-bit token at enqueue time and pass it to later stages:
1 | uint64_t MakeFlowId(uint64_t session_id, uint64_t stream_id, uint64_t frame_id) { |
When you select an event, the Perfetto UI shows the relationships as arrows. Continue using Flow for intermediate stages and use TerminatingFlow at the final consumption stage.
This example uses ProcessScoped(flow_id), so the ID must remain stable at least within the process over a trace’s lifetime. Do not directly use a temporary pointer that can be reused as a flow ID. For cross-process flows, do not retain ProcessScoped semantics: at minimum, use a globally unique ID and specify its namespace and source process. A multistage pipeline can also allocate a separate flow ID for each edge, such as enqueue_to_decode_flow_id and decode_to_render_flow_id, to avoid reusing a flow across multiple paths.
A long-lived task spanning functions and threads can also use an independent track:
1 | void StartRequest(uint64_t request_id) { |
These events suit task queues, player pipelines, asynchronous loading, and cross-thread GPU submission. They explain an application’s execution path better than instrumenting every function.
The ID in perfetto::Track(request_id) must uniquely identify that concurrent task within a trace. Production request IDs and frame IDs are easily reused; reuse merges different tasks onto one track, making them look like one long task or an incorrectly serialized sequence. Add a session/pipeline namespace or generate a dedicated 64-bit track ID. For ongoing analysis, include a track descriptor/name so the UI and SQL can identify its lifecycle. If descriptors or interned data are lost, return to the stats checks in Part 12.
Counters Represent State, Not Logs
Counters suit numeric values that change over time, such as queue length, in-flight request count, and buffer occupancy. A frame ID is an identifier, not an aggregatable metric; it belongs in slice arguments or flow IDs. This example records decode queue depth:
1 | void ReportDecodeQueueDepth(int depth) { |
Counters should not carry log text, nor should identifiers be averaged or maximized. Keep logs in logcat; retain only numeric values in the trace that can be correlated with the timeline and interpreted as state.
Fix the units and aggregation semantics of each counter. For DecodeQueueDepth_items, inspect the peak and mean within the observation window; for InFlightRequests_count, the peak and duration; for BufferBytes_bytes, the peak, growth slope, and whether it falls again. Do not compute avg/max over identifiers such as frame_id or request_id.
Event Names Are a SQL Interface
Once event names enter SQL, dashboards, and regression reports, they become an interface. Do not concatenate dynamic IDs into event names.
1 | // Avoid: each frame gets a different event name, making stable SQL aggregation difficult. |
A better naming pattern is “phase + action”:
DecodeFrame: decode an application frame, withframe_id,stream_id, andcodecarguments.UploadTexture: upload a texture or buffer, withframe_idandtexture_bytesarguments.RenderScene: submit a scene-rendering pass, withscene_idorsurface_idarguments.SubmitRequest: submit a cross-thread request, withrequest_idandqueue_deptharguments.WaitForBuffer: wait for an upstream buffer, correlatable with Binder, thread-state, and buffer-queue evidence.
Stable event names make downstream SQL stable. Convert duration columns consistently with / 1e6: time_to_ms() from time.conversion performs integer division, truncating the maximum duration to whole milliseconds and giving it a different precision from the mean:
1 | INCLUDE PERFETTO MODULE slices.with_context; |
Control Write Volume
Track Event has low overhead, but it is not free. Part 12 covered data loss; distinguish two paths here. Excessive android.os.Trace / ATrace writes put pressure on ftrace per-CPU buffers. Excessive Perfetto SDK Track Event writes mainly pressure producer shared memory, central buffers, and incremental state. Do not tune ftrace buffers for SDK Track Event packet loss, and do not focus solely on track_event stats when ATrace events are lost.
Set a budget for each instrumentation class:
- Event density: estimate write volume from
events/sec, events per frame, argument bytes, and target trace duration. At 120 Hz, multiple threads, stages, and dynamic strings can make even once-per-frame recording too dense. - Data shape: do not enable events for every small object, every lock attempt, or every pixel-level loop by default. Keep high-frequency debug categories disabled; targeted traces can use 1/N sampling or a short window after a trigger.
- Argument cost: pass inexpensive scalars directly; put expensive strings, JSON, container iteration, and state snapshots taken under locks inside an enabled check or lambda. Category gating cannot eliminate argument-construction work already performed before the macro call.
- Producer-side fallback: evaluate
shmem_size_hint_kbandBufferExhaustedPolicy::kStallonly after confirming shared-memory bursts as the bottleneck. Part 12 covers their tradeoffs. First reduce event density and split large packets rather than immediately tuning parameters. - Capture acceptance: place application Track Events in a separate central buffer for long traces, then run the acceptance query below over
traced_buf_*andtrack_event_*statistics. Separate buffers isolate central-buffer contention only; they do not fix burst loss in producer shared memory. - For ring buffers, watch Track Event descriptors, string interning, and incremental state. Use
incremental_state_config.clear_period_msor a low-write-rate buffer as appropriate to prevent later events from losing names and context.
Start the unified acceptance query with Part 12’s health check, then add Track Event-specific items:
1 | SELECT name, idx, severity, source, value |
Give the report a separate track_event_trust_level. For example, even with zero packet loss, nonzero track_event_tokenizer_errors or track_hierarchy_missing_uuid still requires downgrading application-event evidence.
The App-Side Field Tracing Protocol
A common pitfall when integrating Perfetto into an app is treating the app as a small adb shell perfetto client. Ordinary apps do not have permission to start arbitrary system tracing, and dynamically delivering expensive TraceConfigs to production apps is inappropriate. A field solution is better divided into three layers:
- Platform: provision controlled TraceConfigs that declare triggers, ring buffers, file paths, data-source allowlists, and capture limits.
- App: record application markers and page state, detect slow frames, hangs, timeouts, and other anomalies, and activate triggers through the platform contract.
- Server: receive trace packages, run
stats, summary SQL, and aggregate indexing, and provide evidence that human analysts can revisit.
Perfetto STOP triggers suit this scenario. A trace records continuously into a ring buffer; after the app detects a problem, it activates a declared name, and the system wraps up after stop_delay_ms. This preserves context before the problem as well as the tail after the trigger.
A controlled field UI-jank preset can look like this. It suits laboratory or field investigations with a rollout allowlist, controlled sampling, measured write rates, and stats-based acceptance. Default production presets should reduce atrace categories, retaining only sched, FrameTimeline, and minimal Track Events if necessary. This is not a comprehensive graphics preset, but it supports initial investigation using the main thread, RenderThread/HWUI, FrameTimeline, CPU scheduling, SurfaceFlinger-side FrameTimeline/thread-scheduling clues, and app Track Events. Switch to a dedicated graphics preset for attribution involving Layers, Transactions, HWC, or Display.
1 | buffers { size_kb: 131072 fill_policy: RING_BUFFER } # 0: sched / ftrace |
Here, max_per_24_h and skip_probability are fallback controls. Products still need platform-side rate limits by user, device, version, trigger, and day. Switch to a fuller graphics/power preset for GPU, SurfaceFlinger, HWC, or power investigations.
On test devices, you can validate the trigger with this command:
1 | /system/bin/trigger_perfetto app_ui_jank |
The Perfetto trigger model is that an authorized consumer declares trigger names in advance, while producers such as apps can only activate declared names. Native modules integrating the Perfetto SDK can also trigger through the SDK. In products, a platform interface should still centralize permissions and quotas:
1 | perfetto::Tracing::ActivateTriggers({"app_ui_jank"}, 10000); |
The second argument is the trigger request’s TTL, preventing an indefinitely pending trigger when the producer has not yet connected to the tracing service.
Production apps should not assume they can execute /system/bin/trigger_perfetto. Prefer a controlled platform interface, such as a system service, vendor SDK, enterprise device-management component, or test-framework proxy. The app submits only a constrained request:
1 | { |
The platform decides whether to trigger based on the preset allowlist, sampling rate, permissions, device state, and daily quota. This interface contract is easier to maintain long term than letting the app assemble its own TraceConfig. Server-side matching should output trigger_event_ts, nearest_marker, marker_delta_ms, and matched_by, so correlating external JSON with the trace timeline does not depend on human guesswork.
Trigger policy should reflect what users perceive rather than internal implementation details:
| Trigger | Typical signal | What to inspect in the trace |
|---|---|---|
| Slow UI frames | Consecutive slow frames in JankStats or severe budget overruns | Main thread, RenderThread, FrameTimeline, CPU |
| Warning signs of a main-thread hang | 2 s / 4 s / 8 s watchdog | Main-thread state, Binder, locks, IO, system services |
| Application timeout | Camera open, player prepare, or initial-screen timeout | App markers, Binder, HAL, thread states |
Keep trigger names stable once they enter platform presets. Renaming them breaks continuity in server aggregation, SQL templates, and historical data.
Trace Packages Need Context
Separate the minimum field package from later platform extensions. This article requires only the essentials: the trace itself, application metadata, capture preset, and stats-based trust results. Upload policy, log allowlists, and retention periods are platform rules that can be designed separately later.
1 | trace-package/ |
app_metadata.json describes the incident context. Keep its fields fixed and include a schema version:
1 | { |
The other files also need a minimal set of fields:
trace_stats.json should at least preserve Part 12’s health-check results:
1 | { |
upload_policy.json specifies whether the field package can be uploaded and how long it is retained:
1 | { |
app_events.jsonl stores the trigger and a small amount of app-side state as one JSON event per line, sharing scenario_id/session_id/action_id with Track Events:
1 | {"elapsed_realtime_ns":123456789000000,"event":"trigger","scenario_id":"feed_scroll_120hz","session_id":"s-20260504-001","action_id":"scroll-42","page":"Feed","action":"scroll"} |
log_excerpt.txt contains only a short-window summary of allowlisted tags, recording at least the tag, level, elapsed realtime, and redacted message.
Use consistent elapsedRealtimeNanos / CLOCK_BOOTTIME timestamp semantics and make them explicit in field names. Perfetto can synchronize clock domains carried by trace packets through timestamp_clock_id / ClockSnapshot, but external JSON is not normalized automatically. Prefer recording trace start/end elapsed realtime in metadata, or use an explicit server-side offset to place external events back into the trace window. Let the SDK timestamp Track Events by default. Pass explicit timestamps only when you can guarantee the clock domain and conversion logic, and record the clock source, offset, and unit.
Do not truncate trace.perfetto-trace directly on the app side. A Perfetto trace is a protobuf stream; crude binary trimming can damage packets, clock synchronization, and incremental state. Control the window at capture time instead: ring buffers bound the pre-trigger window, stop_delay_ms controls the post-trigger window, and trigger rate limits control repeated captures.
max_file_size_bytes is a hard file-size cap that stops tracing when reached. A long-running flight recorder with too small a cap can stop before the trigger. Use it with write_into_file / file_write_period_ms to control disk-write risks; it is not a window-trimming tool.
As the solution becomes a platform, encode quotas, privacy, and retry behavior in product upload rules:
- Device-side quotas: rate-limit by user, device, version, trigger, and day.
- Network conditions: upload by default only on Wi-Fi or user-approved networks; defer on low battery, abnormal temperature, or background restrictions.
- Content allowlists: fix metadata fields, allow only listed log tags, and prohibit embedding user input in app trace sections.
- Trace contents: minimize data sources, restrict processes/producers, and avoid logcat by default. ftrace, sched, Binder, thread names, and process names may themselves contain sensitive information.
- Transport and retention: encrypt uploads, audit server access, give traces, log excerpts, and aggregated results separate TTLs, and delete them automatically on expiry.
The app supplies application phases, anomaly triggers, and metadata; the platform supplies controlled presets, triggers, and file management; the server supplies trust checks, summaries, and aggregation. With all three in place, Perfetto can move from repeated manual captures to a sustainable production troubleshooting workflow.
Summary
The Perfetto SDK adds application semantics: the system knows that a thread is running; the SDK tells you which frame it is decoding, how deep the queue is, and where a request flows next.
A practical implementation order is to start with android.os.Trace in Java/Kotlin, use Track Event for long-term native instrumentation, and consider custom DataSources for complex structures. Stable event names, controllable categories, counters with units, and flows with stable IDs let SQL and reports remain reusable over time. For field tracing, the app must also design triggers, metadata, evidence packages, and upload policy together.
References
- Tracing SDK
- Track events
- Recording In-App Traces with Perfetto
- androidx.tracing.perfetto
- Trace configuration - Triggers
- android.os.Trace
- JankStats Library
Source revision checked: b23c67be1159e3f0b0657bd97be9e139e0d8ee2c (2026-09-19).
About Me and the Blog
Follow Android Performance.