

Many performance problems cannot be reproduced with a single tap. Slow boot, intermittent jank, problems after turning the screen on or off, audio interruptions after several hours, periodic stutters in an automotive system, and performance degradation as temperature rises are all poor fits for a manually recorded 10-second trace.
This article covers long-running field traces: defining the observation window in advance, using triggers to preserve the incident, ensuring the file finishes writing safely, and determining whether the collected data is trustworthy. Boot tracing is covered below as a special observation window. Part 02 already covered basic interactive capture methods—the command line, official scripts, Developer options, and the web interface. Here, we focus on what changes in the field and during long-running recording.
Perfetto Series Catalog
- Android Perfetto Series Catalog
- Android Perfetto Series 1: Introduction to Perfetto
- Android Perfetto Series 2: Capturing Perfetto Traces
- Android Perfetto Series 3: Familiarizing with the Perfetto View
- Android Perfetto Series 4: Opening Large Traces via Command Line
- Android Perfetto Series 5: Choreographer-based Rendering Flow
- Android Perfetto Series 6: Why 120Hz? Advantages and Challenges
- Android Perfetto Series 7: MainThread and RenderThread Deep Dive
- Android Perfetto Series 8: Understanding Vsync and Performance Analysis
- Android Perfetto Series 9: Interpreting CPU Information
- Android Perfetto Series 10: Binder Scheduling and Lock Contention
- Android Perfetto Series 11: PerfettoSQL, Trace Processor and Regression Detection
- Android Perfetto Series 12: Trace Dataflow and Data Loss
- Android Perfetto Series 13: Perfetto SDK, Track Event and App Field Traces
- Android Perfetto Series 14: heapprofd and Memory Profiling
- Android Perfetto Series 15: Boot Traces and Long-running Field Tracing
- Android Perfetto Series 16: GPU, Power Counters and Hardware Bottlenecks
- Android Perfetto Series 17: Scenario Automation and Platform Tracing
- Android Perfetto Series 18: Input Response Latency
- Video (Bilibili) - Android Perfetto Basics and Case Studies
- Video (Bilibili) - Android Perfetto: Trace Graph Types - AOSP, WebView, Flutter + OEM System Optimization
The purpose of a long-running field trace is to retain enough data before and after a problem to explain its root cause. Enabling every option and recording for an hour only brings file-size, overhead, and data-loss problems sooner. A good field capture strategy produces reviewable evidence at a controlled cost.
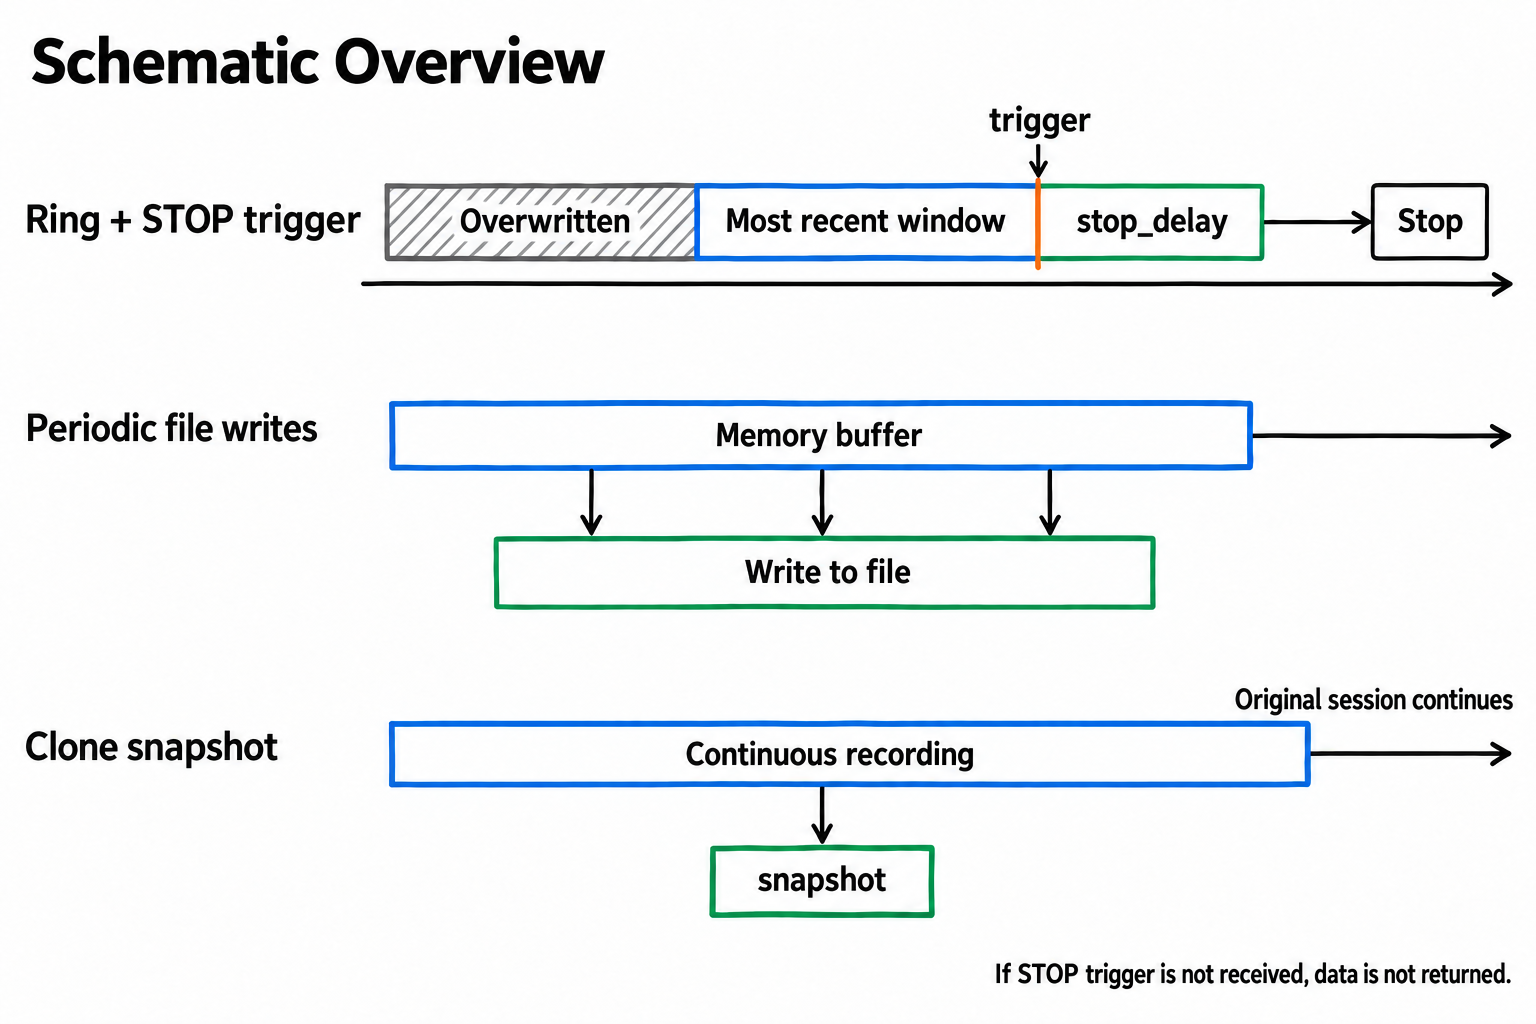
Diagram: a STOP trigger preserves the trigger window, periodic file writes persist data in batches, and cloning leaves the original session running.
Design the Evidence Window First
Long-running traces require tradeoffs: how much to retain before and after the problem, and which data sources are worth keeping. Before writing the configuration, establish the observation window:
| Question | Configuration implications |
|---|---|
| How often does the problem recur? | duration_ms, whether background execution is needed, whether periodic snapshots are needed |
| Does the root cause precede or follow the observed problem? | Choose a STOP or START trigger |
| How many seconds before the problem must be retained? | Ring buffer size, breadth of data sources, file-write interval |
| Can the user stop recording manually? | Whether automatic triggers or bugreport integration are needed |
| Is ADB unavailable during the early phase? | Boot tracing, platform provisioning, init/service activation, or a vendor solution |
| Might USB disconnect after recording starts? | --background-wait, detached mode, snapshots, or a background service |
| What is the maximum file size? | max_file_size_bytes, upload policy, local TTL |
| Is the data sensitive? | Log tag allowlist, whether to disable atrace_apps: "*" |
Intermittent UI jank usually requires tens of seconds before the problem; thermal throttling may require several minutes of trends; long-term automotive stability problems may require hours of execution. Such scenarios often use periodic snapshot retrieval or upload only a summary.
Map common scenarios to presets before writing the TraceConfig:
| Scenario | Recommended mode | Trigger and acceptance checks |
|---|---|---|
| Intermittent UI jank | Ring buffer + STOP trigger | App markers, FrameTimeline coverage of the target window, sufficient pre-trigger history |
| Signs of an impending ANR | Ring buffer + STOP trigger | Main thread, Binder, lock waits, I/O, and critical business phases are all present |
| Thermal throttling | write_into_file or snapshots |
Preserve minute-scale trends for CPU frequency, idle, thermal state, and critical app phases |
| Business-operation timeout | App marker + STOP/START trigger | Use STOP when the root cause precedes the timeout; use START when recovery needs further observation |
| Audio underrun | Ring buffer + STOP trigger | Align audio/server events, sched, Binder, wakeups, and the underrun marker |
Device Capabilities and Permissions Constrain Field Capture
A field capture strategy depends on more than TraceConfig: device version, build type, and the trigger emitter’s permissions also matter.
| Environment | What you can rely on | What you should not assume |
|---|---|---|
| userdebug / rooted development device | adb root, /data/misc/perfetto-configs, android.log, more system services and ftrace events |
Log allowlists, buffer sizes, and upload scope still need limits |
| user build + adb shell | Ordinary system traces, package-scoped atrace, reviewed presets | Do not rely on android.log by default; do not assume arbitrary config paths are readable; prefer /data/misc/perfetto-configs |
| Ordinary app | Record app-side ATrace / Track Event and activate predeclared triggers | It cannot decide which system data to collect, how much to capture, or where to upload it |
| CPU / native / Java profiling | Check debuggable, profileable, and Android version as required by the data source |
Do not treat <profileable> as a universal permission switch for system tracing in the field |
Text proto configurations may use either .pbtxt or .pbtx; parsing is determined by perfetto --txt or an encoding step in the toolchain. This article consistently uses .pbtxt filenames below.
Boot Tracing Is a Special Field Observation Window
App cold starts and system boot are different problems. The older Systrace response-latency walkthrough covered app startup paths, and Part 05 covered rendering after startup. Here, we focus only on device-level boot: when ADB is not yet available but Android has reached the boot phase after /data is mounted, how do we capture a complete system trace, interpret it correctly, and produce reviewable conclusions?
Common scenarios requiring boot tracing include:
| Symptom | Why an ordinary trace is insufficient |
|---|---|
| Slow boot to the home screen | The problem occurs before ADB is available |
| Slow first boot after an OTA | init, zygote, dexopt, and system_server all need examination |
| Late Launcher first frame | system_server, SurfaceFlinger, and Launcher need to be examined together |
| A service blocks during boot | init/service manager/Binder context is needed |
| A user reports “it takes a long time to become usable after reboot” | The readiness criterion must be defined first |
Boot tracing is a specialized platform or system-startup observation window; app cold-start analysis takes a different route. Establish these boundaries before analysis:
- Android boot tracing is available on Android 13+. Earlier versions require a vendor-specific boot capture solution.
- Recording begins after persistent properties load, which means
/datais already mounted. It does not cover PMIC power-on, the bootloader, early kernel boot, or first-stage init. Earlier phases require pstore, kernel cmdline/ftrace persistent buffers, or vendor init instrumentation. - This workflow generally assumes
adb rootis available on a development or userdebug device. Production user builds require platform provisioning, an engineering build, or a vendor diagnostic entry point. - The start of the UI’s relative timeline is not the moment the power button is pressed or the PMIC powers on. SQL
tsretains timestamps in Trace Processor’s unified clock domain and does not automatically reset to zero when tracing starts. Compare relative phases within the same trace in reports; do not directly compare absolutetsvalues across devices. - There is no single definition of “boot complete.” Launcher first frame, accepting input, network availability, navigation service readiness, and background-task completion may be different teams’ metrics.
- The output file is not ready until tracing stops, or at least until the first flush/file-write interval.
persist.debug.perfetto.boottraceis one-shot and must be set again before the next boot.
Set a sensible duration_ms in boottrace.pbtxt to end the session. flush_period_ms controls periodic flushing; it does not replace the capture duration. Keep the initial configuration focused: init, sched, frequency, idle, process lifecycle, process stats, and Activity/Window/SurfaceFlinger-related ATrace. Enable logs only with an allowlist on userdebug or platform diagnostic builds.
The boot trace’s buffer policy must match the readiness milestone. DISCARD is better at preserving early init/zygote events, but loses later readiness events once the buffer fills. RING_BUFFER preserves the recent window but may overwrite early boot evidence. Do not expect a 32 MB DISCARD buffer to handle a 90-second boot window. Increase the buffer, narrow the data sources, or enable periodic file writes and check traced_buf_chunks_discarded.
1 | duration_ms: 90000 |
A reusable capture workflow can look like this. Do not pull the file merely because it is nonempty: an automation script should wait for the configured duration to end, then verify that the file size remains stable across consecutive checks:
1 | adb root |
Validate the boot trace before analyzing it:
- Does the trace cover the Android boot window after
/datais mounted through the target readiness milestone? - Does
statsreport data loss, packet loss, or ftrace setup errors? - Are processes such as init, system_server, surfaceflinger, and launcher visible?
- Do process stats, sched, and frequency all contain data? Check logs only when both the configuration and build type support them.
- Was this a cold boot, an
adb reboot, or the first boot after an OTA? - Does
metadata.jsonrecord the button/reboot method, boot ID, readiness criterion, trace start/end, device build, and capture operator’s permissions?
Use a consistent analysis order: init/service startup, zygote, system_server, PackageManager/ActivityTaskManager, SurfaceFlinger, Launcher, and the first-frame/input-ready milestone. State the readiness criterion explicitly in the report; otherwise, “boot is three seconds slower” can easily become a cross-team dispute.
To read the final portion of ftrace before a crash-induced reboot, see linux.frozen_ftrace in Tracing across reboot. It relies on a persistent ring buffer provisioned in the kernel and is a different approach from the boottrace workflow here, which automatically records during the next Android boot.
Three Modes for Long-Running Field Traces
Long-running Perfetto field traces can use these three modes:
| Mode | Behavior | Suitable scenarios | Risks |
|---|---|---|---|
| Ring buffer + STOP trigger | Continuously records the most recent window and stops after an anomaly | Dropped frames, impending ANRs, audio underruns | A small buffer overwrites the root cause; without a matching trigger, no incident trace is returned |
Long recording with write_into_file |
Periodically writes the buffer to a file | Trends spanning tens of minutes to hours | I/O overhead and oversized files |
--clone-by-name snapshot |
Clones the current window on demand while the original session continues | Parameter tuning, thermal management, power-policy experiments | The device’s perfetto must support --clone-by-name; check perfetto --help / --version. On Android, this generally requires Android 14 (U)+ or a newer Perfetto integrated by the vendor |
Do not combine all three into one all-purpose configuration. Choose the mode for the problem first, then choose the data sources.
I choose the mode by how far before the incident I need to look. If the cause is in the preceding few seconds, a measured ring window is more useful than a long trace whose volume nobody has checked. If the trend itself lasts minutes, periodic file writes deserve their overhead assessment.
A Baseline Ring Buffer Configuration
The following configuration targets intermittent UI jank. Recording starts immediately, and the ring buffer retains only the recent window. When the app, a platform service, or a test harness detects a slow frame and activates the app_ui_jank trigger, Perfetto records for one more second and stops.
This configuration assumes that app-side business markers and a trigger emitter, discussed in Part 13, are already integrated. trigger_config does not automatically trigger based on FrameTimeline. Without an emitter, the session simply waits for cleanup at trigger_timeout_ms; it does not provide a fallback capture of the final window.
1 | unique_session_name: "ui_jank_flight_recorder" |
There are two buffers: high-frequency ftrace/atrace goes into the large buffer, while FrameTimeline, process stats, and app Track Events go into the smaller semantic buffer. For graphics problems, retaining sched events is not enough if FrameTimeline, app markers, or process descriptions have been overwritten. You would still be unable to determine whether the jank came from the app, SurfaceFlinger, BufferQueue, or system scheduling.
producer_name_regex restricts which producers may activate the trigger. The regular expression must match the actual emitter’s producer name. If a test harness triggers on its behalf, add the harness producer to the allowlist or give the harness a separate trigger name.
ftrace_config.buffer_size_kb, buffer_size_lower_bound, and drain_period_ms increase kernel per-CPU ftrace buffer usage and the frequency of traced_probes drain wakeups. They should not be defaults for every field preset. They are included in this UI jank preset to reduce the chance of high-frequency scheduling events being overwritten in kernel ftrace within a short window. Before rollout, use a short trace to validate ftrace_setup_errors, CPU overhead, and write rate.
FrameTimeline requires Android 12 or later. It is not a trigger emitter: it provides facts in the trace, including app frames, SurfaceFlinger frames, jank_type, present_type, on_time_finish, and app-to-SF flows. Restrict atrace_apps to the target package; do not use atrace_apps: "*" as a field default.
Ring buffer retention is determined by the write rate and buffer size, not by trigger_timeout_ms. The estimate remains the one from Part 12: retained window in seconds = buffer MB / write rate in MB/s.
For ftrace, examine three buffer layers: kernel per-CPU ftrace buffers, producer shared memory, and the Perfetto central buffer. Enlarging the central buffer only extends the final retained window. It cannot recover events lost earlier because traced_probes could not drain the kernel buffer in time.
Consider ftrace_config.buffer_size_kb, buffer_size_lower_bound, drain_period_ms, and drain_buffer_percent when tuning long-running field traces, after checking overhead and device compatibility in short traces. The current semantics of drain_buffer_percent were introduced in Perfetto v48, and the official proto comments state that it has no effect on Linux kernels older than 6.9. Do not treat it as a universal replacement for drain_period_ms on older kernels.
At an ftrace write rate of 2 MB/s, 64 MB retains only about 32 seconds. Enabling logs, Track Events, and camera/audio events in the field makes that window shorter. Retaining two minutes before the problem requires fewer data sources, a larger buffer, or periodic file writes. A STOP trigger returns no trace data unless it is matched; manually stopping cannot bypass that condition. For a manual fallback, activate a preauthorized manual trigger or start a separate named snapshot/fallback session that is not subject to that trigger restriction. Whether a snapshot can read pre-trigger data must also be verified for the specific version.
After recording with the UI jank preset, first confirm that FrameTimeline data actually exists:
1 | SELECT 'expected' AS table_name, COUNT(*) AS rows |
Then confirm that both the app and SurfaceFlinger have frame records within the target window:
1 | WITH target_window AS ( |
If you suspect hardirq, softirq, or kworker activity is taking CPU time, do not put these events into the default long-running trace. Start with a focused short-window preset, then decide from the results whether to include them in field capture:
1 | data_sources { |
Long Recordings Need Periodic File Writes
Problems spanning hours cannot rely only on memory buffers. This fragment shows only the fields relevant to long recordings; add data sources before using it:
1 | duration_ms: 3600000 |
By default, duration_ms excludes system suspend time. For field problems measured by wall-clock time, such as screen on/off, standby, or automotive sleep, consider prefer_suspend_clock_for_duration: true. It also changes the time semantics of a trigger’s stop_delay_ms.
The official buffers documentation gives a typical Android scheduler tracing rate of about 1–2 MB/s; use the measured rate for your actual preset. Estimate recording time as max_file_size_bytes / measured write rate. At 1–2 MB/s, a 2 GB limit lasts only about 17–34 minutes, not an hour. To record for an hour, narrow the data sources, raise the file-size limit, or switch to a summary/snapshot strategy.
Logs, syscalls, page faults, camera/audio events, and overly broad Track Event collection can increase the write rate by an order of magnitude. flush_period_ms is useful for long traces because it reduces ordering and import problems caused by low-frequency data sources holding data for too long before submitting it. Frequent flushes increase producer wakeups and I/O pressure. Field presets typically start with 10–30 seconds; record the Perfetto/Android versions, write_flush_mode, and measured write rate in the report.
Background Recording and Safe Shutdown
USB often disconnects during field testing. Prefer --background-wait for ordinary long-running field traces: it waits for data sources to start before returning the PID, reducing the chance of missing the beginning compared with plain --background.
On Android 12 or later, place the configuration in /data/misc/perfetto-configs, then start the background trace; check write access on the target device:
1 | adb push field.pbtxt /data/misc/perfetto-configs/field.pbtxt |
If the Android 12–17 target device cannot use the configuration path above, pass the config through stdin. Production M2M toolchains should use reviewed presets or binary TraceConfig rather than allowing a server to send arbitrary text configurations:
1 | PID=$(adb shell perfetto --background-wait --txt \ |
When stopping, do not run adb pull immediately after kill. Perfetto still needs to finish writing the tail of the trace. At minimum, wait for the perfetto process to exit, then confirm that the file exists and its size is stable before pulling it:
1 | case "$PID" in |
If the script controls both ends, it can start inotifyd to watch for close_write before sending kill. When the device lacks inotifyd, consecutive stable-size checks after process exit provide a fallback. Stable file size alone does not prove that the file has closed. An unmatched trigger, startup failure, or empty file must cause a timeout and exit; the script must not wait forever or proceed with the pull.
Using Triggers
The value of Perfetto triggers is permission separation. A privileged party declares trigger names and behavior in advance. An ordinary app or system component only reports that an event occurred; it cannot decide what to capture, how much to capture, or where to upload it.
A field capture strategy must identify the trigger emitter explicitly. For UI jank, app-side JankStats, FrameMetrics, or a custom threshold detector can activate app_ui_jank; a platform service or test harness can also activate it on the app’s behalf. Either path requires deduplication and rate limiting, with the trigger source, activation time, and decision threshold recorded in metadata.
A useful app-emitter contract is a fixed JSON event accompanied by a Track Event with the same event_id:
1 | { |
The server or analysis script uses event_id and the time window to align external trigger records, Track Events inside the trace, and slow FrameTimeline frames. If they do not align, the trace provides only system-side context; it cannot directly attribute the problem to a page or business action.
In a test environment, these shell methods can activate a trigger, but this example also sets producer_name_regex. A shell emitter may not match that filter. Use an emitter with a matching producer name, or adjust the filter in a laboratory-only preset; a successful shell command alone does not prove that the session matched the trigger:
1 | adb shell /system/bin/trigger_perfetto app_ui_jank |
Alternatively, activate the same trigger using a configuration containing only activate_triggers:
1 | echo 'activate_triggers: "app_ui_jank"' | \ |
STOP triggers suit problems whose root cause precedes activation, such as slow frames, impending ANRs, and audio underruns. START triggers suit cases that need observation after the event, such as recording for another 10 seconds after temperature enters the hot state.
When using a START trigger, do not also configure an ordinary duration_ms; trigger_config manages the trigger window.
The toolchain must also handle the case where no trigger matches. Under the official TraceConfig semantics, if trigger_timeout_ms expires without any matching trigger, both STOP_TRACING and START_TRACING stop the session and return no data. The output file is empty by design, not because capture failed. The script should explicitly record trigger_matched=false and clean up the empty file. An empty trace is not evidence that no problem occurred. Conversely, once a trigger matches, the session ends after stop_delay_ms. To maintain long-term flight-recorder coverage, platform-side supervisory logic must restart the next session and generate a fresh case ID and output filename for each round, avoiding overwriting the previous incident.
Snapshots for Parameter Tuning
Some scenarios call for a snapshot of the current window every few seconds without stopping the original trace—for example, tuning CPU policies, thermal parameters, or power policies. The --clone-by-name command-line entry point was added in Perfetto v49.0. Session cloning itself also requires Android 14 (U)+ platform support or a vendor integration. Ultimately, check adb shell perfetto --help / --version.
Name the session in the configuration:
1 | unique_session_name: "thermal_snapshot" |
After it starts, clone the current ring buffer on demand. The original session keeps running:
1 | adb shell perfetto --clone-by-name thermal_snapshot \ |
Snapshots are not the only way to capture field problems. They suit experiments that repeatedly observe trends, rather than trigger-based problems that require a single capture to preserve the incident.
Use Detached Mode Sparingly
--detach separates the tracing session from the lifetime of the perfetto command, leaving the traced service holding the session. The official documentation explicitly discourages routine use because it can leak sessions and leave devices tracing for long periods.
If detached mode is necessary, enable write_into_file in the configuration and prepare commands to inspect and stop the session:
1 | adb shell perfetto --detach=field_session --txt \ |
Automation scripts need fallback cleanup: check for old sessions before starting, stop sessions after testing, and stop them automatically when their TTL expires.
Bugreport as a Field Fallback
Users, testers, or operations staff often initiate a bugreport first when a field problem occurs. A long-running trace intended for inclusion in a bugreport must explicitly declare that in TraceConfig:
1 | unique_session_name: "field_ui_jank_bugreport" |
Only sessions with bugreport_score > 0 become bugreport candidates; higher scores receive higher priority for saving. bugreport_filename supplies a readable filename for --save-all-for-bugreport starting with Android 15 / Perfetto v42; older versions use a default name. This is distinct from ordinary -o /path/trace.perfetto-trace and --upload: the former serves bugreports, while the latter two serve the current command’s output or framework reporting.
Development or platform scripts can verify bugreport behavior with these commands:
1 | adb shell perfetto --save-for-bugreport |
On Android 12/13, saving for a bugreport takes the trace contents and stops the session early. On Android 14 or later, the system creates a read-only snapshot and the original session can continue. Record the Android version and verification-command output in the report. Do not treat bugreport packaging as equivalent to ordinary background tracing.
What a Field Evidence Package Should Contain
A .perfetto-trace file alone is not enough. At minimum, a field evidence package must explain the scenario, when it was triggered, and whether the file is complete.
1 | case-20260504-153012/ |
Recommended fields for metadata.json include:
1 | { |
This metadata does not replace the trace. It helps investigators locate the problem window, filter versions, and assess environmental differences. Part 13 covered adding app-side page, business-phase, and user-action information. Metadata in the field evidence package must align those business markers.
summary.json is the entry point for automation, with fields that directly drive triage, upload, and retention:
1 | { |
These timestamps and values illustrate the field relationships: 20 seconds before the trigger and about one second after it. Verify actual coverage against the earliest retained event and buffer-loss stats. Keep summary.json to machine-readable states, rather than narrative conclusions. evidence_grade can use A/B/C/D: A means the target window, key data sources, stats, and metadata are all complete; B means there is minor data loss but the core judgment remains usable; C permits only directional judgments; D means the trace can only document the environment.
Long-running traces also need explicit clock-domain information. ftrace commonly uses CLOCK_BOOTTIME, Android logs carry wall time, and other data sources may be synchronized through Perfetto’s ClockSnapshot.
External metadata should record at least elapsed realtime, wall time, and boot ID together. A more robust approach also records the trigger itself as a Track Event inside the trace. If analysis reveals clock synchronization failures or invalid clock snapshots, reduce confidence in alignment across data sources.
Trim at Capture Time First
Perfetto traces contain incremental state, track descriptors, stats, and metadata. Cutting a binary file after capture can easily break parsing. The recommended order is:
- Use a ring buffer to retain only the recent window.
- Use
stop_delay_msto control how much to retain after the trigger. - Use
max_file_size_bytesto cap file size. - Upload the original trace covering the complete incident window.
- Generate summaries, screenshots, and SQL results on the server as lightweight indexes.
If offline trimming is unavoidable, the tool must rewrite TracePackets and retain the necessary descriptors and stats. Do not use dd, text truncation, or arbitrary cuts through a protobuf byte stream.
Upload and Cleanup Policies
Long-running field traces are collected close to real user environments, so upload policies must consider more than engineering convenience:
- Upload by default only under conditions such as Wi-Fi, charging, or user authorization.
- When a file exceeds the threshold, upload the summary first and retain the original trace locally for manual export.
- Collect logs using a tag allowlist and redact them before upload.
- Give trace files a TTL, such as automatic cleanup after three days.
- Apply both TraceConfig’s
max_per_24_hand client-side rate limiting to triggers. - Run
statsbefore upload and record data loss in metadata. - Do not allow servers to send arbitrary text proto configurations to user devices; allow selection only from reviewed presets.
These constraints reduce ad hoc tuning flexibility, but control upload, privacy, and stability risks.
Standard Checks Before Analysis
Long-running field traces are more susceptible to data loss. Before analysis, check two acceptance criteria: whether the time covered by the trace meets expectations, and whether stats supports trusting the key data sources.
1 | SELECT |
If the duration is unexpected, first check trigger_timeout_ms, max_file_size_bytes, whether the background process was killed, whether the file is still open, and whether duration_ms accounts for suspend as intended. When data is incomplete, explicitly state which conclusions must be withheld.
Then run the global quality check. Part 12 already provides the complete stats health-check query and a mapping from common stats items to corrective actions. Reuse that SQL at the beginning of your analysis script; it is not repeated here. Long-running field traces need two additional layers of checking.
First, check each buffer. For traced_buf_*, idx is the buffer index. The global flush/config items listed alongside them below must not be interpreted as buffer-specific indices:
1 | SELECT name, idx, severity, source, value |
With RING_BUFFER, traced_buf_chunks_overwritten does not necessarily indicate an error: it usually means old data outside the retained window was overwritten. Check separately whether it overwrote the root cause before the trigger:
1 | SELECT name, idx, severity, source, value |
If ftrace is enabled in the field, also record the ftrace clock, available events, and setup errors. When comparing traces, differences in clocks or event sets directly affect the credibility of sched/frequency conclusions:
1 | adb shell cat /sys/kernel/tracing/trace_clock |
Turn Intermittent Problems into Evidence
Long-running field traces require observation windows, triggers, completeness criteria, and upload boundaries to be defined in advance. A ring buffer retains the recent window; triggers preserve the incident; write_into_file controls long recordings; --background-wait and file-close checks help ensure the data reaches disk; and stats plus metadata establish how much of that evidence remains trustworthy.
Part 13 covered app-side Track Events, while this article covers field observation windows. Together, they provide the foundation for bringing slow frames, impending ANRs, and business-operation timeouts into a single incident package.
References
- Trace configuration
- Buffers and dataflow
- Tracing in Background
- Running perfetto in detached mode
- Perfetto command-line reference
- TraceConfig proto reference
- Android boot tracing
- FrameTimeline
- ATrace
- Android Log
- Clock synchronization
- Trace Processor Stats
Source revision checked: b23c67be1159e3f0b0657bd97be9e139e0d8ee2c (2026-09-19).
About Me and the Blog
Follow Android Performance.