

FrameTimeline marks a frame as late, yet the main thread, RenderThread, and SurfaceFlinger all seem to stay within their budgets. It is tempting to write “possibly a GPU bottleneck.” That is a risky claim: GPU frequency, GPU counters, battery current, and power rails are not tools for attributing an individual App frame to a root cause.
Parts 07 and 08 covered the rendering path from the App to SurfaceFlinger; Parts 06 and 09 covered refresh rates and CPU scheduling/frequency. This article adds an often-skipped step without repeating those topics: when a problem appears to have reached the hardware resource layer, how should GPU, devfreq, battery counters, and power rails enter the analysis of the same trace interval?
These counters are difficult because not every device provides them, and different GPU vendors use different counter names. A conclusion cannot simply say “a high GPU value means a GPU bottleneck.” FrameTimeline, RenderThread, SurfaceFlinger, the GPU timeline, frequency, and power data must be examined over the same interval.
Perfetto Series Catalog
- Android Perfetto Series Catalog
- Android Perfetto Series 1: Introduction to Perfetto
- Android Perfetto Series 2: Capturing Perfetto Traces
- Android Perfetto Series 3: Familiarizing with the Perfetto View
- Android Perfetto Series 4: Opening Large Traces via Command Line
- Android Perfetto Series 5: Choreographer-based Rendering Flow
- Android Perfetto Series 6: Why 120Hz? Advantages and Challenges
- Android Perfetto Series 7: MainThread and RenderThread Deep Dive
- Android Perfetto Series 8: Understanding Vsync and Performance Analysis
- Android Perfetto Series 9: Interpreting CPU Information
- Android Perfetto Series 10: Binder Scheduling and Lock Contention
- Android Perfetto Series 11: PerfettoSQL, Trace Processor and Regression Detection
- Android Perfetto Series 12: Trace Dataflow and Data Loss
- Android Perfetto Series 13: Perfetto SDK, Track Event and App Field Traces
- Android Perfetto Series 14: heapprofd and Memory Profiling
- Android Perfetto Series 15: Boot Traces and Long-running Field Tracing
- Android Perfetto Series 16: GPU, Power Counters and Hardware Bottlenecks
- Android Perfetto Series 17: Scenario Automation and Platform Tracing
- Android Perfetto Series 18: Input Response Latency
- Video (Bilibili) - Android Perfetto Basics and Case Studies
- Video (Bilibili) - Android Perfetto: Trace Graph Types - AOSP, WebView, Flutter + OEM System Optimization
This article addresses practical questions: which hardware data is worth capturing, how to narrow conclusions when it is unavailable, and how to avoid misinterpretation when it is available. You do not need to become a GPU driver engineer. You do need to define the limits of an investigation: when the UI is late, threads are not busy, and composition is not blocked, which hardware signal should you examine next?
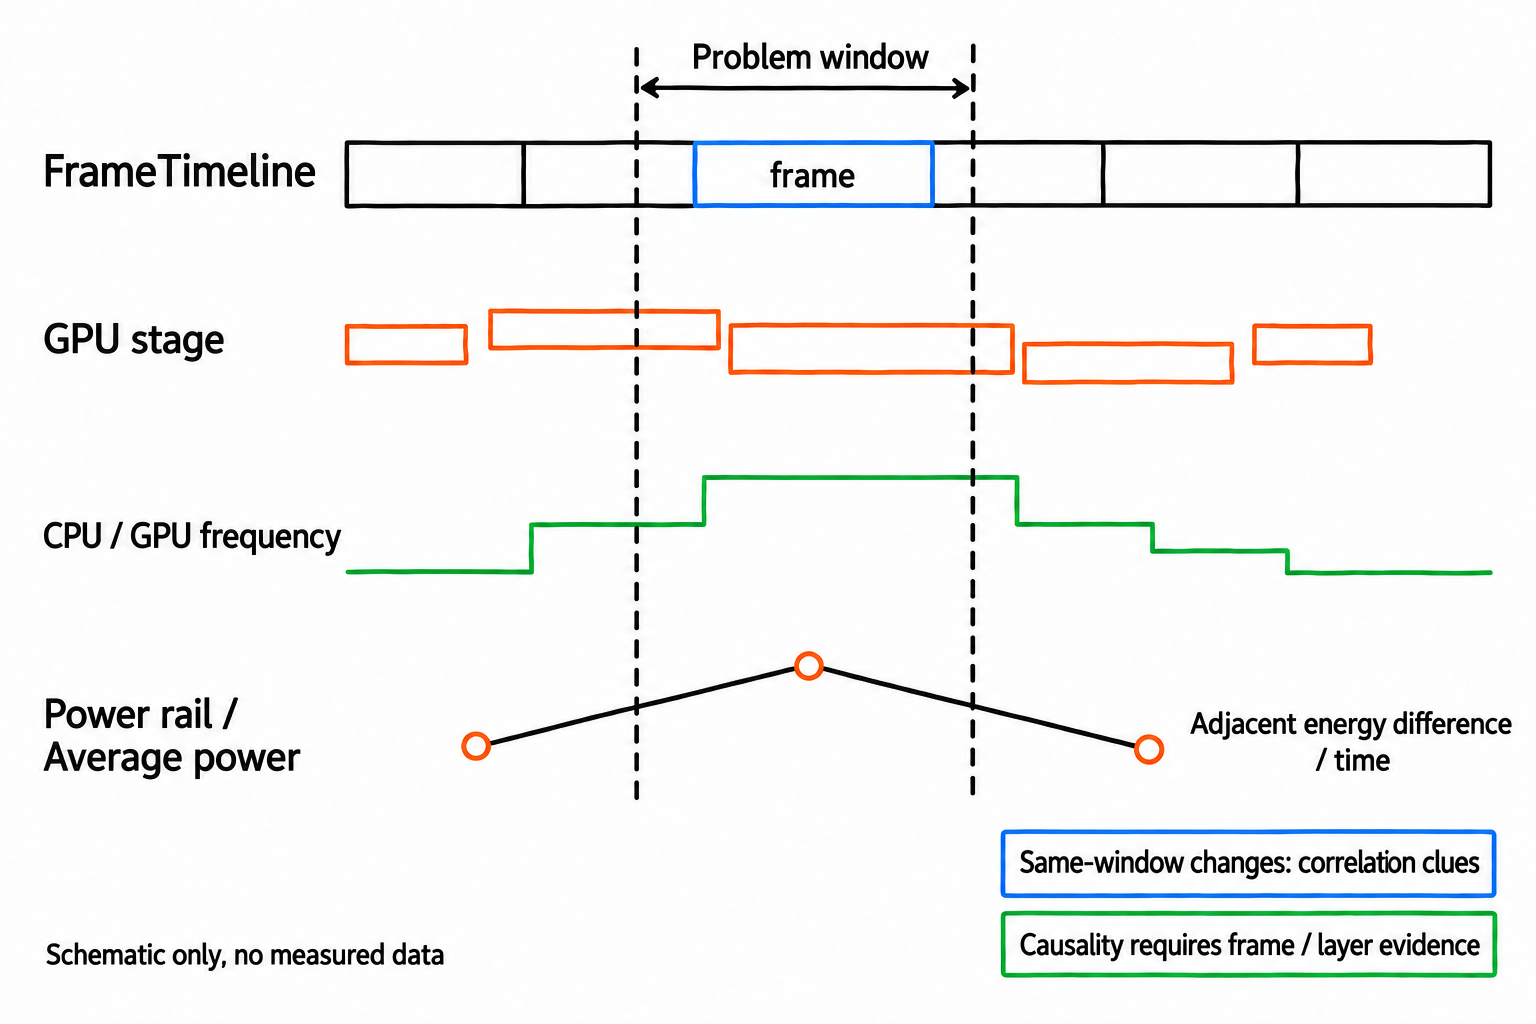
Diagram: frames, GPU stages, frequency, and energy samples aligned to the same window. Temporal overlap alone does not prove a GPU root cause.
When Hardware Counters Are Needed
FrameTimeline can identify a janky frame. CPU scheduling can show whether a thread obtained CPU time. RenderThread/HWUI can help determine whether the App completed drawing and produced or submitted a buffer within budget. GPU execution, completion, and hardware pressure require a combined reading of FrameTimeline, GPU render stages, fences, GPU counters, or AGI/vendor tools.
Hardware counters address the later part of that investigation:
| Symptom | What counters can add |
|---|---|
| RenderThread submits on time, but the frame is still late | GPU render stages, GPU completion, GPU frequency |
| GPU frequency rises, but frames remain slow | GPU counters, GPU memory, devfreq / interconnect / memory-related device frequency tracks |
| Frame rate drops after running for a while | Power rails, battery current, thermal logs, changes to frequency caps |
| Abnormal power consumption without obvious UI jank | Power rails, battery counters, screen state, continuous animation/wakeups |
| Heavy load in a game or player | AGI GPU counters, Perfetto system context, application Track Events |
Hardware counters rarely identify a root cause on their own. They are more useful for ruling out unpromising directions: is the problem on the CPU, GPU, composition, memory-bandwidth, or power/thermal-policy side?
First, distinguish these terms:
frequencyis a frequency track. It shows the operating level selected by a frequency-scaling policy, not utilization.- A
counteris a sampled value exposed by hardware or a driver. It may represent a percentage, bytes, an event count, or a vendor-defined unit. - A
render stageis an interval of GPU work. It helps determine whether GPU work exceeds a frame budget, but depends on producer and driver support. battery currentis measured at the battery and covers the whole device. It is not an individual App’s power consumption.- A
power railmeasures subsystem energy. It can show changes in rails such as GPU, Display, Memory, and WLAN, but still does not provide per-process measurements.
Read hardware counters together with frames, threads, SurfaceFlinger, and application actions from the same interval. No single track, however clear, can establish attribution by itself.
When I see a high GPU frequency track, I treat it as a reason to inspect the frame, not as a verdict that the GPU held it up. A frequency policy can react to load without telling us which stage missed the deadline. Align render stages and fences with App and SurfaceFlinger frames before assigning the delay.
Keep the Data Types Separate
| Data | TraceConfig collection entry point | PerfettoSQL module/table | Questions it can answer | Limitations |
|---|---|---|---|---|
| GPU render stages | gpu.renderstages or a producer with a vendor suffix |
GPU tracks such as gpu_slice |
Whether GPU work extends beyond the target window | Depends on GPU producer and driver support |
| GPU frequency | linux.ftrace + power/gpu_frequency, or linux.sys_stats polling |
stdlib android.gpu.frequency / view android_gpu_frequency |
GPU frequency scaling, caps, and frequency state under thermal control | Frequency is not utilization; label units according to the device and track |
| GPU memory | linux.ftrace + gpu_mem/gpu_mem_total |
stdlib android.gpu.memory / view android_gpu_memory_per_process |
Per-process GPU memory trends and possible texture/buffer/Surface scale issues | Memory usage is neither bandwidth nor per-frame GPU activity |
| GPU counters | gpu.counters, gpu.counters.adreno, etc. |
counter, gpu_counter_track |
Hardware events involving fragments, vertices, textures, memory, etc. | Counter IDs/names depend on the device |
| GPU work period | linux.ftrace + power/gpu_work_period |
Module android.gpu.work_period; table android_gpu_work_period_track |
UID/GPU work periods on some devices | Not equivalent to per-frame completion; attribution to a frame/layer still needs tokens, render stages, or fences |
| Battery counters | android.power |
counter |
Changes in battery current, voltage, and charge | Whole-device measurements affected by USB/charging state, not App power consumption |
| Power rails | android.power + collect_power_rails |
stdlib android.power_rails |
Energy changes in rails such as GPU, Display, and Memory | Depends on hardware and the IPowerStats HAL; not per-process |
android_gpu_work_period_track is a track-dimension table providing attribution fields such as id/uid/ugpu/gpu_id; it does not contain work intervals. Join slice using slice.track_id = android_gpu_work_period_track.id and inspect ts/dur for those intervals. Do not assume there is an android_gpu_work_period table, or treat an interval directly as the GPU completion time of an individual frame.
The official Perfetto GPU documentation also mentions data sources such as vulkan.memory_tracker and gpu.log. These serve specialized graphics investigations and should not be included in a default long trace. Locate the problematic interval with minimal system context first, then decide whether to add specialized data sources.
Device Support Comes First
GPU counters are not a universal Android capability. Keep these constraints from the official documentation in mind:
- A GPU producer may register a data source name with a hardware suffix, such as
gpu.counters.adrenoorgpu.renderstages.mali. TraceConfig must use the exact name. - GPU counters are selected using device-specific counter IDs or counter names. Available IDs/names come from the descriptor exposed by the GPU producer.
- Choose either
counter_idsorcounter_names; do not mix them. Only some producers supportcounter_namesand glob selection. Checksupports_counter_names/supports_counter_name_globsin the descriptor. - Android GPU frequency can be captured through the ftrace event
power/gpu_frequency. - Per-process GPU memory can be captured through the ftrace event
gpu_mem/gpu_mem_total.
Power counters have similar limitations. Battery counters depend on device power-management hardware and are more common on Pixel devices. Power rails depend on specialized hardware such as ODPM (on-device power rail monitor) and the IPowerStats HAL. Availability still needs to be checked per device on Android 12–17; many production devices lack it.
Actual availability of Perfetto’s ODPM data source depends on specialized hardware and the HAL. The Pixel 6+ wording in Android Studio Power Profiler documentation is guidance about tool experience and practical device coverage; it does not imply that every Android 12–17 device has power rails.
Confirm Device Capabilities First
Do not write a GPU/Power configuration and hope it works. Before capturing, use the Record page in Perfetto UI or query data source descriptors on the device to confirm producer names, counter IDs, units, and support for selection by name:
1 | adb shell perfetto --query --long |
The query output can be long. Extract the key fields: data source name, GPU counter ID, unit, description, supports_counter_names, supports_counter_name_globs, and power rail metadata. Common Android GPU producers have hardware suffixes, such as gpu.counters.adreno or gpu.renderstages.mali. TraceConfig must use the exact name exposed by the descriptor.
Keep a capability inventory in the report so that “unsupported device,” “configuration name mismatch,” “buffer data loss,” and “signal did not rise” remain separate:
1 | { |
Use separate tiers of field presets as well:
| Preset | Data sources | Scenario | Upload and fallback rules |
|---|---|---|---|
baseline_jank |
FrameTimeline, App markers, sched, CPU/GPU freq, idle | First pass in production or an ordinary field investigation | May be included in a field package; without GPU stages, explicitly record missing evidence and limit findings to hardware trends |
gpu_suspect_short |
Baseline + render stages, GPU memory, devfreq, short-interval power/battery polling | A 10–30-second reproduction window | Short windows only; downgrade conclusions if stats report data loss |
gpu_counter_lab |
GPU counters, AGI/vendor counters, necessary system context | Specialized laboratory investigation | No default upload; record counter ID/name/unit and the device descriptor |
A Minimal Signal Set for Short Traces
This configuration assumes collection with shell/system privileges through adb shell, Perfetto UI, record_android_trace, or a trusted system consumer. An ordinary App cannot independently enable ftrace, android.power, or GPU counters/renderstages. It can expose only its own pages, actions, and phases through Track Event / ATrace.
Build the first configuration on the UI jank baseline from Part 15: FrameTimeline, ATrace / Track Event for the target package, and sched/freq/idle form the primary attribution path; GPU/Power adds supporting signals. This short-trace configuration is for reproduction windows only. For long-running field tracing, reuse the file writing, file limits, and trigger approach from Part 15.
1 | duration_ms: 10000 |
The aim is to collect a complete set of evidence for the same window first. FrameTimeline requires Android 12 or later. gpu.renderstages depends on GPU producer and driver support and is unavailable on many devices. If render stages cannot be captured, report “GPU stage evidence is missing.” Do not promote frequency or power rail measurements directly into a conclusion about GPU execution.
Be explicit when GPU stages are missing: gpu_stage_status=unavailable; conclusion_scope=hardware_trend_only; cannot_claim=gpu_execution_delay.
Remember to pair stat_period_ms with explicit stat_counters. Leaving stat_counters empty may collect all /proc/stat counters, including per-CPU times and per-IRQ counts. Specifying STAT_CPU_TIMES makes the intended data clear and avoids pulling hundreds of IRQ counters into the trace.
power/gpu_frequency and devfreq/devfreq_frequency are event paths; gpufreq_period_ms and devfreq_period_ms are sysfs polling paths. Events provide precise change points, but you may need to look before the window for the preceding state. Polling captures sustained trends but is constrained by its sampling period and may miss brief spikes. power/cpu_idle records transitions; cpuidle_period_ms polls idle-state durations. USB connections, wakelocks, and whether a scenario is in the foreground or background all affect idle measurements.
Thermal-zone names, units, and availability vary by device. If thermal_period_ms was not collected or there are no thermal tracks, report only “this trace contains no thermal evidence,” not “thermal control had no effect.”
These polling periods suit only short diagnostic windows. Long traces require longer sampling periods, separate buffers, and measurements of write rate and CPU overhead. These power counters are not a Power HAL trace. Unless you also capture the Power HAL’s own atrace, logs, or vendor events, report only “frequency, rail, and thermal changes occurred in the same window,” not “the Power HAL caused it.”
Using Android 17 as the current reference, devices running Android 12 or later can place a text configuration in /data/misc/perfetto-configs. pbtxt works well for manual investigation and article examples, while generated binary proto configurations are preferable for automation or long-term deployment:
1 | adb push gpu_power.pbtxt /data/misc/perfetto-configs/gpu_power.pbtxt |
For short traces, these signals can share one buffer. For long traces, separate them and examine their data volumes. Combining 1 ms GPU counter sampling, logcat, Track Event, and ftrace sched can quickly shrink the ring-buffer window. Reuse the constraints on data loss and buffer windows from Part 12 and on long-running file output from Part 15.
GPU Counter Selection Examples
Select GPU counters for the particular device. Selecting counter IDs from its descriptor is the more robust approach; use counter_names and globs only when the producer descriptor explicitly supports them.
The following illustrates the configuration shape only. If the descriptor exposes a suffixed name such as gpu.counters.adreno or gpu.counters.mali, use that exact name. name, counter_ids, and counter_names must all match what the target device supports.
1 | data_sources { |
If the producer supports name-based selection, the configuration can look like this:
1 | data_sources { |
Choose specialized counter sampling periods carefully. A 1 ms period provides detail but increases overhead and data volume. GPU counters should not be enabled by default for long-running field traces.
Dividing the Work Between AGI and Perfetto
AGI is better suited to questions inside the graphics pipeline:
- Which render passes, draw calls, shaders, and pipeline states make up a frame?
- How should specialized GPU counters for fragments, vertices, textures, and bandwidth be interpreted?
- How can rendering be optimized at the Vulkan/OpenGL level?
Perfetto is better suited to system timing relationships:
- Is there unusual behavior in the main thread, RenderThread, SurfaceFlinger, or Binder around the problematic frame?
- Do GPU render stages run beyond the App/SF target window?
- Do GPU/CPU frequency, power rails, and thermal logs change at the same time?
- Does the issue occur only with the screen on, during refresh-rate changes, as temperature rises, or under background contention?
Games, maps, video, and demanding Flutter/WebView scenarios therefore often need both sets of evidence: Perfetto supplies system context, and AGI supplies GPU internals.
Check Trace Health First
After obtaining a trace, do not immediately interpret missing tracks as “device unsupported.” Part 12 covers the general data-loss check, including stats for buffer packet loss and ftrace enablement failures and how to handle them. Run that query first. GPU and power data also have their own parsing stats: GPU counter specification errors, render-stage parsing errors, and power-rail parsing errors can all make signals silently disappear. Use this additional query for domain-specific entries:
1 | SELECT name, idx, severity, source, value |
The meaning of idx depends on the statistic: traced_buf_* usually uses buffer indices, ftrace CPU entries use CPU numbers, and non-indexed entries may be null. Do not map every idx to a buffer. Distinguish three cases in the report: the device did not expose a signal, the configuration did not match a producer, or buffer policy/data loss discarded the signal. Only after checking configuration and trace health can you narrow the conclusion to “this device or this trace did not provide a usable signal.”
Identify the Counters Present in the Trace
First, list all counter tracks:
1 | SELECT |
Then query gpu_counter_track specifically for GPU counters. Names are only hints; inspect units and descriptions too:
1 | SELECT |
For reports spanning multiple GPUs or devices, include GPU metadata:
1 | SELECT |
If the target GPU / power counter is absent from the results, skip the specialized SQL that follows.
You can also list power-rail metadata first, so the report does not mistake a raw rail name for an application-level meaning:
1 | INCLUDE PERFETTO MODULE android.power_rails; |
If this table is empty, do not write “the GPU rail did not rise.” Write instead: this device or this trace did not provide usable power-rail metadata.
Where the Problem Window Comes From
GPU/Power queries must use the same problem window. Record its source in the report: frametimeline, track_event, trigger, or manual annotation.
Select a janky frame for the target App from FrameTimeline and extend the window before and after it:
1 | WITH jank_frame AS ( |
When selecting a window from an App Track Event or the trigger metadata from Part 15, retain the same event_id:
1 | WITH marker AS ( |
Without a window source, you can scan only for global trends. Do not attribute a GPU/Power fluctuation to a particular scroll or frame.
Querying GPU Render Stages
The analysis step “check whether GPU work extends beyond the target window” uses the gpu.renderstages data source. Support is much narrower than for frequency, and many devices have no corresponding producer. Always start by confirming that this trace actually contains render-stage tracks:
1 | SELECT id, name |
Older articles and scripts often use SELECT id, name FROM gpu_track WHERE scope = 'gpu_render_stage'. This still works today, but gpu_track is marked deprecated in Perfetto source: it mixes unrelated tracks such as drm, mali, render stage, vulkan, and gpu_log in one table. Its scope column is also just an alias for type. New scripts should query track.type directly.
If the query returns zero rows, stop here and return to “Device Support Comes First.” Report gpu_stage_status=unavailable; do not substitute frequency or rail data.
If tracks exist, extract stage slices within the problem window and sort them by time spent inside it. Focus on which stage types on which queues fill the window:
1 | WITH target_window(start_ts, end_ts) AS ( |
This query answers “what was the GPU executing in the target window, and for how long?” A stage that extends beyond or fills the target frame window, combined with FrameTimeline and RenderThread evidence, can move the finding from “the frame was late” toward “GPU execution was late.” Correlation fields such as submission and render target vary by device. They are stored in slice args; inspect the keys actually present before deciding how to join the data:
1 | SELECT DISTINCT a.flat_key |
Record two limitations in script comments. First, the GPU producer determines track names, stage names, and args keys. Adreno and Mali output differs, so scripts intended for multiple devices must not hardcode those names. Second, newer trace processor versions organize render-stage tracks by internal track type; gpu_track is only a compatibility view for older scripts. If a query reports no such table/column, use the three-way diagnosis from Part 11 and start with PRAGMA table_info, rather than changing application logic first.
GPU Frequency and GPU Memory
Every specialized query must first bind to a problem window. The examples use 30–45 seconds; in practice, derive the window from a problematic FrameTimeline frame, an application marker, or the trigger metadata from Part 15.
The standard library provides a GPU frequency module. This query returns GPU frequency intervals overlapping the problem window:
1 | INCLUDE PERFETTO MODULE android.gpu.frequency; |
The unit of gpu_freq_raw must follow the current device and track output, and the report must state it. Do not compare raw numbers directly across devices.
GPU memory can be aggregated by process. This query finds the processes with the highest peaks in the problem window:
1 | INCLUDE PERFETTO MODULE android.gpu.memory; |
High GPU frequency means only that policy raised the frequency, not that the GPU is fully utilized. High GPU memory does not establish a memory-bandwidth bottleneck either; it suggests directions such as textures, buffers, or Surface counts. devfreq represents frequency nodes exposed by the device/kernel. List raw names first, then interpret them using the SoC, kernel nodes, and vendor documentation.
1 | WITH target_window AS ( |
Power Rails and Battery Counters
Power rails are cumulative energy counters. The standard library converts adjacent samples into average_power in mW; energy is measured in uWs, or microjoules. Note that energy_delta is the difference from the preceding sample, whereas ts/dur describes the interval toward the following sample. Do not directly combine them by multiplication when clipping to a window. The query below uses energy_since_boot_at_end - energy_since_boot to calculate energy for the current interval, joins metadata by track_id, and then aggregates over the problem window:
1 | INCLUDE PERFETTO MODULE android.power_rails; |
energy_delta_uWs estimates energy over the overlap assuming constant power between adjacent samples. avg_power_mw averages only over covered intervals with valid adjacent samples; missing intervals are not treated as zero power. Intervals where the cumulative count decreases are excluded. Include valid_samples, covered_dur_ns, and the window length in the report. Do not draw conclusions from rail rankings when coverage is insufficient.
Battery counters can be queried directly from raw counters, but units must be labeled:
1 | WITH target_window AS ( |
There is another laboratory trap: USB connections affect battery current. The official documentation also warns that a connected USB cable may produce positive current and rising charge, indicating that the device is charging. For power comparisons, control USB power, separate the data and power connections, or use battery current only as a trend reference.
Counter track names take the form batt.<counter>. When the device reports a battery name, they become batt.<battery_name>.<counter>. Determine units with suffix GLOB patterns rather than hardcoding full names.
batt.current_ua measures current at the whole-device battery: negative values usually indicate battery discharge, while positive values indicate that external power is charging the battery. This sign describes battery current only; it does not represent the power consumption of a particular rail or App.
Use window averages, medians, or stable intervals in reports, not isolated peaks. Every interpretation of current must also state USB/charging status.
Power analysis is closer to an A/B experiment than to locating individual janky frames. Control brightness, refresh rate, network, temperature, background tasks, USB power, and scenario duration, then compare two versions on the same device. Android Studio Power Profiler documentation likewise uses ODPM data to compare different implementations of the same feature, not to blame an App after a single sample.
Work Through the Same Window
For GPU/Power investigations, this sequence is more reliable:
- Use FrameTimeline to locate the problematic frame or window.
- Check whether the main thread, RenderThread, or SurfaceFlinger has already missed its timing target.
- Check whether GPU render stages / GPU completion extend beyond the target window.
- Check GPU frequency changes for boosts, reductions, or thermally constrained caps.
- Inspect GPU counters or AGI for directions such as fragment, texture, shader, or bandwidth pressure.
- Inspect power rails / battery current for power or temperature-rise constraints.
- Return to the system trace and check whether Binder, CPU contention, background animations, or refresh-rate changes explain the same interval.
Do not jump from a power-rail peak to “this App consumes excessive power.” Battery counters cover the whole device; power rails cover hardware subsystems. App attribution also requires foreground state, UID, threads, Surfaces, and application events.
Make Reports Machine-Readable
GPU/Power conclusions need a minimal schema so reviewers can see what evidence is missing and what the available evidence supports:
1 | { |
For App teams, power investigations more often produce A/B reports than accusations based on a single trace:
1 | run_id,group,device,brightness,refresh_rate,network,thermal_state,usb_power_state,scenario_duration_ms,avg_gpu_rail_mw,avg_display_rail_mw,avg_battery_current_ua,jank_rate,frame_count,confidence_notes |
Report signals separately from actions available to the App:
| Signal | Possible App actions |
|---|---|
| Fragment/shader pressure | Reduce overdraw, shader complexity, and the share of blur/shadows/effects |
| Texture/bandwidth pressure | Reduce texture dimensions and format cost, upload frequency, and repeated sampling |
| High GPU memory | Inspect Surface, texture, and buffer lifecycles and cache limits |
| SF jank / composition pressure | Inspect layer counts, transparent layers, HWC/GPU composition, and BufferQueue |
| Power/thermal trend | Reduce frame rate, animation duty cycle, and background rendering; adjust refresh-rate policy |
Use consistent conclusion grades:
| Grade | Supported conclusion | Claims to avoid |
|---|---|---|
| Strong conclusion | Frames, thread/SF evidence, GPU stages, and counters or AGI agree within the same window | Attribution based only on frequency or rails |
| Correlated direction | Frequency, devfreq, rails, and thermal signals change with the window, but GPU stages/counters are missing | Presenting this as the root cause of an individual App frame |
| Missing evidence | Descriptors, stats, metadata, or key tracks are missing | Treating missing tracks as proof that no problem exists |
Three Common Scenarios
GPU Pressure and Late Frames in the Same Window
This scenario requires at least the following evidence: FrameTimeline identifies problematic frames; App-side UI/RenderThread/HWUI did not exceed budget first; the SurfaceFlinger timeline distinguishes App jank from SF jank; GPU render stages or completion are late; GPU frequency rises; and GPU counters indicate some form of fragment/texture/bandwidth pressure.
Also validate attribution using surface_frame_token / display_frame_token, layer_name, process, and the App/SF actual timelines. If the evidence cannot be associated with the current frame, layer, or process, report only “GPU-side pressure correlates with the problem window,” not “this App’s GPU work caused it.”
Render stages cannot independently replace fences. For display completion, also validate the present fence, FrameTimeline, and SurfaceFlinger timeline.
Still Slow After a Frequency Boost
Common directions include internal GPU bottlenecks, frequency pressure on memory/interconnect-related devices, a more complex SurfaceFlinger composition path, thermal throttling, and tight dependencies between stages in the App/SF/GPU pipeline. AGI or vendor GPU tools are especially useful here. Do not conclude from Perfetto frequency tracks alone.
Abnormal Power Consumption
Start with screen state, refresh rate, brightness, continuous animation, and background rendering, then inspect CPU/GPU/devfreq and power rails. Brief current peaks are not a sound basis for a conclusion. Combine this analysis with long traces or snapshots from Part 15 and check whether the same scenario reproduces consistently across runs.
Checks Before Writing the Report
| Check | How to report it |
|---|---|
| GPU counters, render stages, or power rails are missing | Write “this trace has no corresponding evidence,” not “there is no GPU/power problem” |
| Counter names and semantics differ by GPU vendor | Record device model, GPU, counter ID/name/unit, and descriptor source |
| Battery current covers the whole device | Report whole-device trends; do not attribute them directly to an App |
| USB affects battery current | Record USB/charging state and how power supply was controlled |
| GPU frequency is high or low | Describe frequency state and cap changes; do not directly claim a GPU bottleneck or lack of response |
| Power rails measure subsystem energy | Report the rail/subsystem, not an individual process’s consumption |
| GPU counters generate large data volumes | Record sampling period, window length, and whether collection is restricted to the laboratory |
| The same counter is not comparable across GPU vendors | State device and driver boundaries; do not compare raw values across vendors |
Turn Hardware Signals into Reviewable Conclusions
GPU/Power counters supplement rendering analysis with hardware evidence. They cannot replace FrameTimeline, RenderThread, SurfaceFlinger, or CPU scheduling. They help determine whether the problem has reached the GPU, memory/interconnect, power, or thermal-control layer.
Follow three rules in reports: mark signals the device did not provide as missing rather than as counterevidence; identify a GPU/power direction only when multiple sources agree within the same window; and move to AGI or vendor GPU tools when the evidence points inside the GPU.
References
- GPU data sources
- Power data sources
- PerfettoSQL standard library
- AGI GPU performance counters
- Android Studio Power Profiler
- FrameTimeline
- CPU frequency and idle states
- Trace Processor Stats
Source revision checked: b23c67be1159e3f0b0657bd97be9e139e0d8ee2c (2026-09-19).
About Me and the Blog
Follow Android Performance.