

One of the most troublesome situations when opening a trace is finding that the file appears to contain data, but some of it was lost along the way. The UI still shows tracks, and SQL still returns rows, yet part of a thread’s state history is missing, process names do not line up, or some Track Events have disappeared. The further you analyze it, the more your conclusions start to resemble guesses.
SQL can only analyze evidence that still exists in the trace. I would not discard an entire trace just because it reports ftrace loss; first identify whether scheduling, app markers, or frame data were affected.
Part 02 covered capture, and Part 11 covered SQL queries. This article focuses on one question: where did the trace lose data, which conclusions does that affect, and how should the next capture configuration change?
We will follow the data from the kernel to the trace file, locating loss at each stage: ftrace, producer shared memory, the central buffer, incremental state, and flush. Each stage loses data differently and needs a different remedy. At the end, there is a template for explaining how much of a trace remains trustworthy in an analysis report.
Perfetto Series Catalog
- Android Perfetto Series Catalog
- Android Perfetto Series 1: Introduction to Perfetto
- Android Perfetto Series 2: Capturing Perfetto Traces
- Android Perfetto Series 3: Familiarizing with the Perfetto View
- Android Perfetto Series 4: Opening Large Traces via Command Line
- Android Perfetto Series 5: Choreographer-based Rendering Flow
- Android Perfetto Series 6: Why 120Hz? Advantages and Challenges
- Android Perfetto Series 7: MainThread and RenderThread Deep Dive
- Android Perfetto Series 8: Understanding Vsync and Performance Analysis
- Android Perfetto Series 9: Interpreting CPU Information
- Android Perfetto Series 10: Binder Scheduling and Lock Contention
- Android Perfetto Series 11: PerfettoSQL, Trace Processor and Regression Detection
- Android Perfetto Series 12: Trace Dataflow and Data Loss
- Android Perfetto Series 13: Perfetto SDK, Track Event and App Field Traces
- Android Perfetto Series 14: heapprofd and Memory Profiling
- Android Perfetto Series 15: Boot Traces and Long-running Field Tracing
- Android Perfetto Series 16: GPU, Power Counters and Hardware Bottlenecks
- Android Perfetto Series 17: Scenario Automation and Platform Tracing
- Android Perfetto Series 18: Input Response Latency
- Video (Bilibili) - Android Perfetto Basics and Case Studies
- Video (Bilibili) - Android Perfetto: Trace Graph Types - AOSP, WebView, Flutter + OEM System Optimization
A Trace with Data Does Not Necessarily Have Complete Evidence
Perfetto is not a lossless recorder. Its write path is asynchronous to keep overhead low: producers first write to their own shared memory; when shared-memory pages fill, tracing ends, or a flush occurs, they submit that data to the central buffer in traced. The data is then written to the output file when tracing ends, during streaming, or through periodic file writes.
Data loss can occur whenever any stage cannot keep up. A flush only asks producers to hand uncommitted data to the tracing service; it does not mean the data has been written directly to the file.
Before analyzing a trace, make an integrity check part of your routine:
1 | Open the trace |
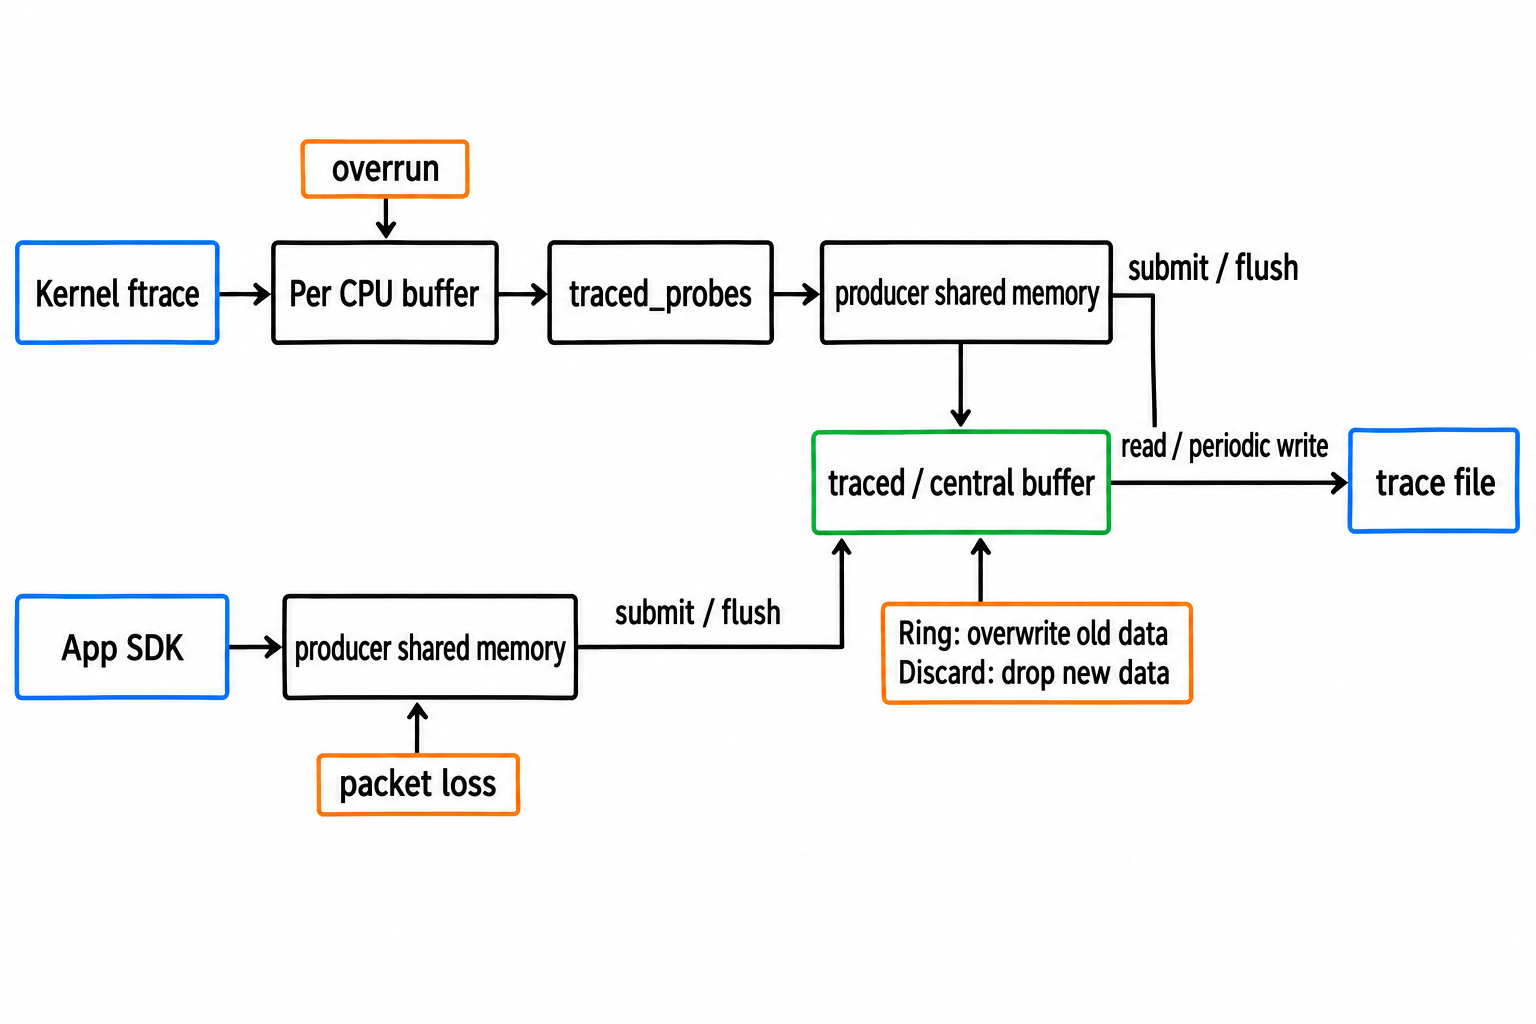
Diagram: the ftrace kernel buffers, producer shared memory, and central buffers are separate stages; a flush is not the same as writing the file to storage.
This takes little time and can save you from spending the next half hour analyzing a trace with gaps.
A common field scenario looks like this: you can find a janky frame and main-thread slices in Perfetto UI, but stats also contains ftrace_cpu_has_data_loss. First distinguish the sources of your evidence.
On Android 12+ with android.surfaceflinger.frametimeline enabled, FrameTimeline can still serve as an entry point if the expected/actual FrameTimeline slices exist in the target window and there are no parser or pairing anomalies. App SDK Track Events may also help locate business-level stages.
However, Choreographer, HWUI, RenderThread, and SurfaceFlinger slices from atrace/ftrace, along with Runnable and wakeup conclusions, must be downgraded when ftrace loss occurs. “No Runnable wait was observed” cannot be written as “there was no scheduling issue.”
How Data Reaches the Trace File
The Perfetto data path can be divided into four stages:
| Stage | Where it happens | Common problems |
|---|---|---|
| Data sources produce events | traced_probes, app processes, native processes, heapprofd |
Too many events enabled; dense bursts of writes |
| Producer shared memory | Shared memory between each producer and traced |
Producers write faster than traced can drain the data |
| Central buffer (the tracing service’s central buffer) | buffers in TraceConfig |
Ring overwrites old data; Discard drops new data |
| Output file and parsing | Trace file, Trace Processor | Long traces are not written to file promptly; import sorting or clock synchronization anomalies |
Incremental state is a concern across stages, not a separate transport path. When context packets such as Track Event track descriptors, interned strings, and process/thread metadata are overwritten or missing, subsequent events may retain only IDs or be skipped by Trace Processor.
linux.ftrace has an additional kernel per-CPU buffer stage. Kernel events first enter each CPU’s ftrace buffer, which traced_probes reads periodically. This stage is particularly vulnerable when ftrace tracepoints such as sched_switch, sched_waking, Binder, and IRQ, along with some vendor Camera/GPU ftrace events, are enabled.
Binder evidence requires explicitly enabling binder_driver or the corresponding binder ftrace events and checking ftrace_setup_errors. Available categories and events vary with Android and kernel versions.
1 | SELECT name, idx, severity, source, value |
The ftrace_setup_errors count is in stats; the location of details and the severity depend on the parser version. In v57.2 it is info, with failure details available under the same name in metadata; in v58.2 it is notice, with details in the trace import logs. In either version, filtering only for error/data_loss misses it. Cross-version queries should retain this count by name.
The Buffers and dataflow documentation gives a useful estimate: at a total write rate of 2 MB/s, a 16 MB central buffer retains roughly 8 seconds. A small central buffer alone is insufficient for captures lasting 30 seconds, 60 seconds, or several minutes.
This explains many cases where a long recording does not contain the target window: Ring overwrites old data, while Discard drops subsequent new data. Setting a 60-second recording duration does not mean every buffer retains 60 seconds of data. The length of the trace file’s timeline, the window a buffer can retain, and the actual coverage of a particular data source are three different things.
A single SQL query provides an initial check of these distinctions. Inspect the earliest and latest events in each high-frequency table and compare them with the trace boundaries:
1 | SELECT 'trace' AS source, trace_start() AS min_ts, trace_end() AS max_ts |
A min_ts later than trace_start() only tells you that the first observed event of that type occurred later. The difference alone does not prove overwrite: a data source starting late, a thread not yet being created, or an interval with no events can produce the same result. Assess this alongside traced_buf_chunks_overwritten, buffer mappings, data-source start/stop behavior, and scenario markers. First and last timestamps cannot rule out gaps in the middle, either. Report the observed range and the evidence for coverage, rather than treating total trace duration as complete coverage for every source.
Checking Trace Health with stats
Part 11 introduced Trace Processor. Here, we use it to run a query directly. This query belongs at the beginning of every analysis script: besides error / data_loss, it includes info entries for central buffers, ftrace setup, FrameTimeline parsing/pairing, flushes, and clocks that can affect conclusions.
First distinguish rows in stats from the definitions of statistics: the table is not a complete capability registry. kSingle entries can have preinitialized rows with a value of 0, whereas kIndexed entries appear according to the CPU/PID/buffer indices actually recorded in this trace. Consequently, COUNT(*) = 0 neither proves that the current version does not support an entry nor independently proves that capture was complete. ftrace_cpu_has_data_loss and several heapprofd_* entries are defined in both v57.2 and v58.2, but may have no rows if no corresponding records were triggered. To determine version support, check the source matching trace_processor --version; to assess the quality of this capture, also check whether the data source was captured and whether it covers the target window.
Note that the official stats reference uses types such as kError, kDataLoss, kNotice, and kInfo, but SQL severity values are lowercase: error, data_loss, notice, and info. ftrace_setup_errors has severity notice in v58.2 and info in v57.2. The query below retains it by name, independently of severity:
1 | ./trace_processor query trace.perfetto-trace " |
Do not read the results merely as “are there any nonzero values?” First map common entries to decisions:
stats entry / symptom |
Affected data sources | Questions still answerable | Questions no longer answerable | Decision |
|---|---|---|---|---|
ftrace_cpu_has_data_loss |
sched, thread_state, wakeup, Binder kernel events |
Positive evidence that survived can provide leads | Cannot conclude “no Runnable wait,” “no wakeup delay,” or “no scheduling blockage” | Downgrade scheduling attribution; recapture if necessary |
traced_buf_chunks_overwritten / discarded |
Data sources assigned to the affected buffer | Positive evidence in windows that were not overwritten | App markers, FrameTimeline, or process/thread metadata in overwritten windows | Use idx to identify the buffer and target_buffer; decide whether to recapture or downgrade |
| FrameTimeline tables have rows, but target-window coverage is incomplete | FrameTimeline | Facts about surviving frames | Cannot prove that target-window frame metrics are complete | Output frame_metrics_partial |
clock_sync_failure* |
Timestamp conversion | Some metadata that does not depend on time | Precise timing, durations, or cross-thread ordering | Treat time semantics as untrustworthy first |
perf_* / heapprofd_* / meminfo_* / rss_stat_* |
CPU profiling, native allocations, RSS/PSS, system memory | Conclusions that depend on unaffected data sources | Corresponding profile or memory measurements | Downgrade individual metrics |
Standardize report fields as well; otherwise every report still relies on someone writing an ad hoc judgment:
1 | trace_quality_status,affected_sources,affected_metrics,usable_metrics,unusable_metrics,evidence_grade,fallback_used,recapture_required,recapture_reason,next_trace_config_change |
To investigate buffer pressure specifically, inspect overwrite and discard counts per buffer. Some versions classify these counts as info, so filtering only for data_loss misses clues:
1 | SELECT name, idx, severity, source, value |
To determine whether frame metrics are usable, also query FrameTimeline. It is not produced directly by ftrace, but it can still be affected by whether the data source is enabled, the Android version, central-buffer overwrite, and parser/pairing anomalies:
1 | SELECT 'actual' AS table_name, COUNT(*) AS row_count |
Whole-table row counts are insufficient. Frame records are not a continuous signal: a static screen may produce no new frames. Min/max timestamps enclosing a window neither prove that no frame records are missing in between nor constitute a necessary condition for complete capture. Check expected/actual pairing, unclosed or dropped frames, capture start/stop, and loss in the same source buffer for the target upid, layer, and frame tokens. The following query only lists the range of observed frames in the window; it cannot automatically determine completeness.
1 | INCLUDE PERFETTO MODULE time.conversion; |
For a broader review of the capture configuration, inspect all nonzero statistics:
1 | SELECT name, idx, severity, source, value |
Check source, too. source = 'trace' usually points to capture or trace-content issues, so start with TraceConfig, producers, or device capabilities. source = 'analysis' more often concerns Trace Processor import, parsing, or modeling, so start with import parameters, parser version, producer implementation, or trace-format issues. Do not assume that increasing buffer sizes alone fixes a parser error.
Reading stats should not stop at checking whether values exist. After finding a nonzero entry, ask:
- Where was data lost: ftrace, producer shared memory, the central buffer, or parsing?
- What does it affect: scheduling events, potentially missing process/thread names, or gaps in app custom events, FrameTimeline, or logs?
- How can it be corrected: fewer events, larger buffers, separate buffers, file writing, or a shorter capture window next time?
ftrace Loss: Kernel Events Outpace Readers
If stats contains ftrace_cpu_has_data_loss, loss occurred between the kernel ftrace per-CPU buffers and userspace readers. Typical causes are enabling too many events or traced_probes failing to read each CPU’s buffer promptly while the device is under heavy load.
Counters such as ftrace_cpu_overrun_* help identify which CPU experienced overruns, but cannot reconstruct exactly when loss occurred on the trace timeline. More precise timing requires FtraceEventBundle.lost_events or raw-packet/UI evidence. Without that evidence, limit the conclusion to “this CPU’s ftrace/sched evidence is unreliable.”
For an ftrace-specific check, do not rely only on the general query. Statistics for overruns and dropped events may be classified as info in some versions and need to be selected explicitly:
1 | SELECT name, idx, severity, source, value |
This kind of loss affects conclusions about CPU scheduling, Runnable time, wakeup relationships, and Binder kernel events. Observed sched rows can still provide surviving clues, but all negative conclusions must be downgraded: do not claim “no Runnable wait,” “no wakeup delay,” or “no scheduling blockage.” To discuss CPU busy time, also check coverage of sched, thread_state, CPU idle, CPU frequency, or sys_stats cpufreq in the same window.
For the next capture, you can start tuning from this configuration:
1 | data_sources { |
Also remove ftrace events that are irrelevant to the current problem. Do not enable every checkbox and expect buffers to absorb everything. For scroll jank, start with sched/sched_switch, sched/sched_waking, FrameTimeline, and app markers; remove irrelevant IRQ, Camera, and vendor GPU events first. Enable binder events for slow Binder calls, and add Camera/GPU events for Camera open investigations. High-frequency ftrace events can displace low-frequency kernel tracepoints in the same ftrace per-CPU buffers. Displacement of process stats, logs, power, or FrameTimeline data happens later, when sources share central buffers.
The example’s 32768 KiB buffer is per CPU. On an eight-core device, this stage alone can consume about 256 MiB. It is a high-memory setting that must be selected after measurement, not used directly as a production default. buffer_size_kb and drain_period_ms are local tuning parameters; the official reference also warns that they are not guaranteed to take full effect as configured when ftrace sessions run concurrently.
For public presets, reduce events first. Consider buffer_size_kb + buffer_size_lower_bound only when you need a non-default ftrace buffer and compatibility across Perfetto versions; most Perfetto v43+ configurations can leave these unset. A public preset should specify more than a number: include the device scope, Android/Perfetto versions, event set, and file growth rate.
Producer / TraceWriter Packet Loss: Locate It Before Assigning a Cause
Treat traced_buf_trace_writer_packet_loss as a general packet-loss signal first, rather than attributing it directly to producer shared memory. It may result from producer shared-memory bursts, but it can also relate to packet loss before the start of a RING_BUFFER or after the end of DISCARD, missing sequence packets, or central-buffer policy. Attribution requires considering traced_buf_chunks_overwritten, traced_buf_chunks_discarded, traced_buf_sequence_packet_loss, traced_buf_patches_failed, buffer idx, and fill policy together.
Common Android android.os.Trace / androidx.tracing instrumentation follows the atrace/ftrace path, so check ftrace loss and ftrace_setup_errors first. Producers such as Perfetto SDK Track Event, custom DataSources, large packets, and heapprofd sampling relate more directly to shared memory and producer-side write policies.
The implications are straightforward: if your app’s custom events delimit business stages, stage-duration evidence may be incomplete. If the lost data belongs to heapprofd or CPU profiling, confidence in the sampling conclusions must also be reduced.
Represent missing markers as report fields instead of merely saying “business events may have been lost.” For example, if network_done is missing between checkout_submit and first_frame_present, you can report only end-to-end latency, not split it into network and rendering stages: fallback_used=true, missing_marker=network_done, and recapture_reason=track_event_marker_missing.
An easily overlooked shared-memory figure is its default size: 256 KB, with an approximate practical range of 128–512 KB in the official documentation. This is usually sufficient for ordinary slices, but not for bursts of large packets. The documentation uses a screenshot data source as an example: the average write rate may look modest, but writing 2 MB at once can briefly far exceed the rate at which traced moves data.
A useful order of remedies is:
- Reduce event density. Do not emit a Track Event on every iteration of a hot loop.
- Break up oversized events. A single large packet can exhaust shared memory.
- For Perfetto SDK producers, evaluate
shmem_size_hint_kbor the producer shared-memory size. This is appropriate only after confirming that producer-side bursts, rather than central-buffer overwrite, are the bottleneck. BufferExhaustedPolicy::kStallcan prevent immediate packet loss, but makes the producer wait when the buffer is exhausted. Use it to protect critical events only after establishing that the blocking overhead is acceptable.
Part 13 expands on this in its discussion of app-side Track Events and field tracing. The denser your instrumentation, the more important event density, packet size, and producer-side backpressure policy become.
Central-Buffer Loss: Ring Overwrites Old Data; Discard Drops New Data
The buffers in TraceConfig are central buffers. Two common types of loss occur here; inspect the statistic names directly rather than relying solely on severity:
traced_buf_chunks_overwritten:RING_BUFFERoverwrites old data after filling up.traced_buf_chunks_discarded:DISCARDdrops new data after filling up.
Also inspect TraceBufferV2’s traced_buf_data_loss_* reason breakdown. These entries already exist in v57.2/v58.2; whether they appear and what values they contain also depend on whether the capture side reports the corresponding statistics. All have severity data_loss, so the earlier general query covers them, as does the traced_buf_* query below:
traced_buf_data_loss_overwrite: the ring wraps and overwrites chunks that have not yet been read.traced_buf_data_loss_smb_full: the producer reports shared-memory exhaustion;traced_buf_data_loss_writer_abort: a writer aborts an unfinished fragmented packet.traced_buf_data_loss_read_gap,traced_buf_data_loss_chunk_corrupted: a gap in chunk numbering or a corrupted chunk during reading.traced_buf_data_loss_orphan_continuation,traced_buf_data_loss_reassembly_gap,traced_buf_data_loss_reassembly_broken_chain: a missing initial fragment, a reassembly gap, or a broken fragment chain.
These entries attribute loss by buffer and are not equivalent substitutes for the kernel per-CPU ftrace_cpu_has_data_loss. In particular, traced_buf_chunks_overwritten counts overwrites, whereas traced_buf_data_loss_overwrite indicates a specific loss reason received by the parser. Interpret both against the target window and target_buffer; not every overwrite means that the incident window was damaged.
Review capacity per buffer idx. For traced_buf_*, idx is usually the buffer index; for ftrace CPU statistics, it is usually a CPU ID. Include idx_semantics in reports to avoid confusing CPU 3 with buffer 3.
1 | SELECT name, idx, severity, source, value |
When every data source shares one central buffer, high-frequency sched events can displace lower-frequency or critical data such as process stats, logs, power, FrameTimeline, App Track Event, and SurfaceFlinger/Winscope. The UI may still show abundant scheduling events, while only a small fraction of thread names, process names, memory samples, logs, and frame metrics survives.
For android.log, consider device constraints as well. Official documentation lists android.log support for userdebug builds. Rooted user builds may also capture logs when logd/SELinux permissions permit it, so build type alone cannot prove unavailability. However, adb root does not guarantee support on every device. Do not assume that the android.log data source is available on an unmodified production user build; external logcat, bugreport, or sanitized platform logs can be included in the same case package.
The Trace configuration documentation gives an Android-oriented example: scheduler tracing on a typical phone may write roughly 10,000 events, or about 1 MB, per second, while memory statistics are written only once every 5 seconds. Put them in the same 4 MB central buffer, and only one memory snapshot may survive—or none at all. Opening the trace will not produce an error saying “memory sampling did not work”; the file simply has too little evidence left.
Short Traces: First Separate Sources That Compete for Buffers
A more reliable approach separates high-frequency and low-frequency data:
1 | buffers { size_kb: 131072 fill_policy: RING_BUFFER } # 0: High-frequency ftrace |
Check target_buffer for critical graphics data sources and App SDK Track Event as well. FrameTimeline, SurfaceFlinger/Winscope, and App SDK Track Event can be isolated through each data source’s target_buffer. HWUI, Choreographer, and RenderThread atrace data follow linux.ftrace; protect them by reducing ftrace events, increasing ftrace per-CPU buffers, and increasing or isolating the ftrace central buffer. Separate buffers isolate only central-buffer contention; they cannot repair producer shared memory that has already overflowed.
To determine whether displaced data is required by your analysis, check each dependency: expected/actual FrameTimeline row counts in the target window, app marker counts, process/thread name completeness, log/power/memory coverage of the target window, and the affected buffer idx in stats. If these checks do not line up, prioritize recapture. If only explanatory variables are affected, downgrade the report accordingly.
Long Traces: Then Add Periodic File Writing
For long-running field captures, larger memory buffers alone are insufficient. Have Perfetto write to the file periodically:
1 | duration_ms: 600000 |
A shorter file_write_period_ms reduces memory pressure but increases I/O overhead. Long traces also require explicit consideration of flush behavior. Newer versions can use the automatic policy in write_flush_mode; for public configurations spanning versions, prefer an explicit flush_period_ms and inspect config_write_into_file_no_flush and config_write_into_file_discard in stats. The Trace configuration documentation gives about 1–4 MB/s as a common Android trace data rate. Use that only as an initial estimate; measure file growth for your specific configuration.
If the issue has a clear trigger, prefer a smaller capture window or triggered capture. Retaining a few tens of seconds around the issue reduces overwrite and I/O pressure more effectively than recording indefinitely without a target.
File writing also depends on the device and how capture starts. Restrictions such as /data/misc/perfetto-traces/ refer to the TraceConfig.output_path field when using system traced. Ordinary adb shell perfetto -o ... and bugreport clone/save follow a different consumer path. To include a trace in bugreport, set bugreport_score > 0 so dumpstate triggers saving; session handling also differs between Android 12/13 and Android 14 or later. A public preset should include Android/Perfetto versions, the execution command, and the output path, not just pbtxt.
Be cautious with I/O-related tracepoints, syscalls, and page faults as well. Writing a long trace can compete with the workload for the same storage path. Clean stats indicate that trace data is relatively complete; they do not prove that capture did not perturb the scenario. Distinguish trace_quality_status from collection_perturbation_risk in reports.
A rough sizing formula is:
1 | Minimum central-buffer size |
The safety factor should generally be at least 2. Writes are not uniform: scrolling, startup, Camera open, and audio-route changes can all produce short bursts.
Incremental-State Loss: Events Remain, but Names and Context Are Missing
Perfetto reuses context information to reduce trace size. If context packets such as Track Event track descriptors, interned strings, and process/thread metadata are overwritten or missing, later events may retain only IDs or fail to parse completely.
The less obvious symptoms often include:
- The UI shows only a tid, without a process name.
- Track Event track names are missing or parse incorrectly.
statscontains entries related to sequences, incremental state, tokenizers, interning, or track hierarchy.- Trace Processor skips packets that reference missing descriptor packets.
Start with these statistics:
1 | SELECT name, idx, severity, source, value |
Tokenizer, interning, and track-hierarchy statistics are better understood as parsing consequences or supporting signals. They can indicate missing names and context, but the root cause often lies in missing sequence packets, ring overwrite, or producer write bursts. Rather than reporting only “no Track Event packet loss observed,” include track_event_packet_loss_count, track_event_sequence_loss_count, track_event_tokenizer_error_count, interning_error_count, track_hierarchy_error_count, and track_event_invalid_end_count, then assign a track_event_trust_level.
There are two types of remedy:
1 | incremental_state_config { |
clear_period_ms makes data sources that use incremental state resend descriptors periodically, which is useful for ring buffers. Another option is to use target_buffer to place low-frequency metadata in a buffer less likely to be overwritten.
This setting only notifies data sources that declare support for incremental-state clearing; it does not forcibly apply to every source. The Buffers and dataflow documentation recommends a stricter relationship: clear_period_ms should ideally be an order of magnitude smaller than the central buffer’s estimated retention window. For example, if a buffer retains about 60 seconds of data, refreshing descriptors every 5 seconds is much more robust than every 30 seconds.
Long Traces Also Need Attention to Flushes
During long captures, data sources with few events may leave data in shared memory for a long time before submitting it. This can appear as an unexpectedly stretched timeline in the UI or as out-of-order problems during Trace Processor import.
You can add a periodic flush:
1 | flush_period_ms: 10000 |
This setting makes the tracing service periodically request that data sources submit partially filled shared-memory pages. The Buffers and dataflow documentation gives 10–30 seconds as a common range for long traces. Actual behavior also depends on the device’s Android/Perfetto version and settings such as write_into_file and write_flush_mode.
In practice, first check write_into_file, file_write_period_ms, I/O pressure, and import errors, then decide whether to set flush_period_ms explicitly. Excessively frequent flushes increase overhead.
If stats contains traced_flushes_failed or traced_final_flush_failed, first state the limits of confidence in the report, then check file writes, flush/write-flush configuration, and I/O pressure for the long trace. Do not dismiss these entries as ordinary parser noise.
If you already have a long trace captured without periodic flushes and encounter out-of-order import problems, a one-off recovery option is to import it into Trace Processor with --full-sort. This uses more memory and moves additional sorting work into import. It is suitable for offline analysis, not as a permanent substitute for a sound capture configuration.
--full-sort cannot fix clock problems. If you see clock_sync_failure, clock_sync_failure_unknown_source_clock, clock_sync_mixed_clock_sources, or clock_sync_failure_undeferrable_packet_loss, first treat timestamp/clock semantics as untrustworthy. Then investigate packet loss, ClockSnapshot, producer implementation, and import sorting together to locate the cause. Do not explain the issue solely in terms of --full-sort or flushing.
Reporting Confidence
A trace with data loss is not necessarily unusable in its entirety, but the report must state its limits. Define structured fields first:
1 | stat_name,stat_idx,idx_semantics,severity,source,value,affected_evidence,affected_metrics,decision,next_config_action |
A prose template could look like this:
1 | Integrity check: stats contains ftrace_cpu_has_data_loss with CPU 3 value=1; ftrace_cpu_overrun_delta / dropped_events_delta serve only as supporting information. |
This makes it clear which conclusions readers can trust and which only point toward further investigation. One of the biggest risks in performance analysis is turning “not observed” into “did not happen.”
Summary
Checking stats assigns an evidence grade to every subsequent conclusion. When a trace has gaps, continuing to make strong claims only amplifies the risk of misdiagnosis. State what remains usable, what is merely suggestive, and how the next capture should fill the gaps.
Every key conclusion should include its evidence source + confidence + limitations. For example: FrameTimeline shows 3 janky frames in the target window, whose coverage is complete, so that finding is trustworthy; Runnable attribution is affected by ftrace loss and can only provide a lead. Part 11 addressed how to express judgments in SQL. This article adds the prerequisite: SQL can measure only evidence that still exists in the trace. Part 13 returns to the same issue when discussing app-side Track Events: more instrumentation is not always better, and overly dense writes can displace the very evidence you need.
References
- Buffers and dataflow
- Trace configuration
- Trace Processor Stats
- Instrumenting the Linux kernel with ftrace
Source version checked: b23c67be1159e3f0b0657bd97be9e139e0d8ee2c (2026-09-19).
- Perfetto stats definitions
- v58.2 stats definitions (including indexed entries)
- v57.2 stats definitions
About Me and the Blog
Follow Android Performance.