CN

loading
I Built a Health App for Myself, and It Took a Year

On October 22, 2025, I made the first commit to an empty Xcode project. A little over a year and 578 commits later, it is on the App Store as 100 Years Life.

The app started with exactly one user: me. I have a few chronic conditions, I exercise a lot, and I keep data on everything. Checkup reports, a smart scale, sleep, workouts: I had data for all of it.

The problem was that none of it lived in the same place.

Half a Year in the Making: Open-Sourcing an Android Internals Ebook

There is no shortage of material on Android internals. AOSP, official docs, blog posts, papers, trace discussions — it is all findable. The annoying part is that every piece speaks for a different version: this post concludes something about Android 12, that one does not say which version it tested, a third describes what happened on one particular device.

That gap is what AIW is for. The full name is Android Internal Wiki; the Chinese book title is 《Android 技术内幕:系统机制、性能优化与工具实战》 — five parts, twenty-six chapters, with the content pinned to Android 17. The repository is now public:

https://github.com/Gracker/android-internals-wiki

What the repository gives you is twenty-six chapters of content, a full table of contents, and an EPUB rebuilt every week.

Those twenty-six chapters are now far enough along to put in front of people. If you read a passage that does not match the source, an issue or a pull request is welcome.

What I Am Building

This page brings together the projects I maintain, am developing, have made public, or have not yet released. They include Android performance analysis, Perfetto tools, AI automation, iOS apps, Android demos, test suites, blog series, communities, and my accounts on other platforms.

If this is your first visit, start with what you need: the Perfetto and Systrace series for Android performance analysis; SmartPerfetto, TraceFix, and Android App Memory Analysis for tools; OpenClaw and AI Field Notes for AI-assisted knowledge management and everyday work; or the links at the end to contact me.

The projects fall into four areas. Performance analysis includes tools such as SmartPerfetto, Android App Memory Analysis, TraceFix, and Perfetto Auto-Pin, alongside the High Performance Friends Circle test platform. AI and automation includes OpenClaw, AI Field Notes, Gracker Skills, and Open Design. Personal apps include the iOS projects 100Years and iBattery, and the Android project Juju. The main content projects are this blog and Android Weekly. The entries below describe their status, including ongoing maintenance, current development, and paused work.

Android Perfetto Series 18: Response Latency in Practice, from Input Events to First-Frame Feedback

This article addresses a topic easily overshadowed by startup speed and smoothness: first-frame interaction response. It asks how long the screen takes to provide the first frame of feedback after a user action. Complete page loading and stability later in an animation require other metrics.

After tapping a button, how long until its pressed state appears? After tapping a WeChat conversation, how long until the first frame of the conversation page starts moving? After swiping a list, how long until its content follows the finger? These questions relate to slow startup and dropped frames, but need their own measurement definitions.

We use Perfetto to break down this interval: from InputReader read_time, through the App receiving the event, to an associated frame’s present. This gives a candidate internal delay, estimated_input_to_present_ms. Only after confirming the target layer and that the business state visibly changed on that frame should a report call it input_to_present_ms. Neither value covers touch IC latency, delays before driver reporting, display scanning, or panel response. By the end, you should be able to define a start, endpoint, capture configuration, SQL metrics, and supplementary App markers for a tap or scroll scenario.

The article examines response latency through four independent measurements—read/dispatch, handling, ACK→first frame, and scroll responsiveness. Each comes with capture configuration, the first tracks to inspect in the UI, and SQL. It then covers five common attribution paths and the respective boundaries of high-speed cameras and Perfetto.

Android Perfetto Series 17: Domain Automation, Issue Checklists, and Platform Infrastructure

For slow camera opens, audio underruns, a stalled WebView first screen, or dropped frames in Flutter and games, the evidence is scattered across the app, system_server, cameraserver/audioserver, HAL, SurfaceFlinger, and scheduling tracks. Simply inspecting a few more tracks in the UI can easily leave critical timestamps unnoticed.

Using Camera and Audio as examples, this article describes a reusable method for domain-specific analysis: capture the right data, identify the objects, calculate stages and blocking, and preserve timestamps in the report so that reviewers can return to the UI. Camera and Audio are examples; the core is a domain schema and collaboration with platform tracing. By the end, you should at least be able to break a slow camera open into reviewable stages and an audio underrun into cycle anomalies, rather than delivering only a table of the longest slices.

Android Perfetto Series 16: GPU, Power Counters, and Hardware Bottleneck Analysis

When FrameTimeline marks a late frame but the main thread and RenderThread show no obvious long tasks, GPU work and fences are useful next checks. GPU frequency, battery current, and power rails describe hardware state in that window; they do not establish on their own why an app frame presented late.

Parts 07 and 08 covered the rendering path from the App to SurfaceFlinger; Parts 06 and 09 covered refresh rates and CPU scheduling/frequency. This article adds an often-skipped step without repeating those topics: when a problem appears to have reached the hardware resource layer, how should GPU, devfreq, battery counters, and power rails enter the analysis of the same trace interval?

These counters are difficult because not every device provides them, and different GPU vendors use different counter names. A conclusion cannot simply say “a high GPU value means a GPU bottleneck.” FrameTimeline, RenderThread, SurfaceFlinger, the GPU timeline, frequency, and power data must be examined over the same interval.

Android Perfetto Series 15: Boot Traces, Long-Running Field Traces, and Capturing Intermittent Problems

Many performance problems cannot be reproduced with a single tap. Slow boot, intermittent jank, problems after turning the screen on or off, audio interruptions after several hours, periodic stutters in an automotive system, and performance degradation as temperature rises are all poor fits for a manually recorded 10-second trace.

This article covers long-running field traces: defining the observation window in advance, using triggers to preserve the incident, ensuring the file finishes writing safely, and determining whether the collected data is trustworthy. Boot tracing is covered below as a special observation window. Part 02 already covered basic interactive capture methods—the command line, official scripts, Developer options, and the web interface. Here, we focus on what changes in the field and during long-running recording.

Android Perfetto Series 14: heapprofd and Memory Profiling

The hardest part of a memory problem is that a rising number does not immediately tell you what is growing. dumpsys meminfo provides RSS/PSS, and a Java heap dump reveals object retention relationships. But for JNI/C++, CPU-side Skia/Bitmap allocations, and native wrappers in media players, you often also need to know which call stack issued the malloc/new request.

This article covers heapprofd. Its value is bringing native allocations, frees, and call stacks into a Perfetto trace, where you can inspect them alongside application events, thread scheduling, and Binder on the same timeline.

Use heapprofd after confirming the trend. I would split the growth between native heap, graphics buffers, and other mappings with meminfo or smaps before opening a flamegraph. Otherwise, it is easy to chase a malloc stack when the growth came from GraphicBuffer. This article does not address Java object references or graphics backing memory.

We will cover when to use heapprofd, how to capture a profile, how to read it in the UI and SQL, how to interpret sampling intervals and symbolization, and finally what to check before publishing a report.

Android Perfetto Series 13: Perfetto SDK, Track Event, and App Field Tracing

A system trace can tell you when a thread ran, which CPU core it ran on, and which FrameTimeline frame missed its deadline. With Binder/ftrace/sched evidence enabled, it can also reconstruct Binder calls and clues about waiting. But it does not know which frame ID a player is decoding, which scene a game engine is loading, or how long an application task has spent in a queue.

Track Events can record decoding, texture uploads, queue depth, and cross-thread task IDs. Put them in the same window as the system tracks to find a candidate application phase, then use RenderThread, GPU, and FrameTimeline evidence to check whether it affected a visible frame.

The article follows the practical integration order: decide whether instrumentation is needed and at which layer, define an application-phase dictionary and backend, then build the minimal integration, category controls, combined system capture, and cross-thread flows. Finally, control write volume and define the app-side field tracing protocol.

Android Perfetto Series 12: Trace Dataflow and Data Loss Troubleshooting

A trace can open in the UI and return SQL rows even after data was lost during capture. If thread-state intervals are missing, process names do not line up, or Track Events have IDs but no names, first find which stage lost the data, then decide which parts of the analysis can continue.

SQL can only analyze evidence that still exists in the trace. I would not discard an entire trace just because it reports ftrace loss; first identify whether scheduling, app markers, or frame data were affected.

Part 02 covered capture, and Part 11 covered SQL queries. This article focuses on one question: where did the trace lose data, which conclusions does that affect, and how should the next capture configuration change?

We will follow the data from the kernel to the trace file, locating loss at each stage: ftrace, producer shared memory, the central buffer, incremental state, and flush. Each stage loses data differently and needs a different remedy. At the end, there is a template for explaining how much of a trace remains trustworthy in an analysis report.

Android Perfetto Series 11: PerfettoSQL, Trace Processor, and Regression Detection

Selecting a window in Perfetto UI, inspecting the main thread, RenderThread, and CPU states, then taking screenshots works well for one investigation. When I open another trace or switch devices, I want to know whether I can calculate comparable, checkable numbers for the same kind of problem.

Part 11 covers PerfettoSQL and Trace Processor. The aim is straightforward: turn judgments made in the UI into queries that others can check, then use Python to run them across multiple traces. You do not need to become a SQL expert first. Treat a trace as a set of timestamped tables, and translate your visual assessment into a query you can run repeatedly.

The article follows one path: understand Trace Processor, express an assessment as a query over a defined time window, run it from the command line, process multiple traces with Python, and finally turn the results into stable metrics and Trace Summary output. Each step includes SQL you can reuse.

SmartPerfetto Is Open Source: A Perfetto AI Assistant for Android Trace Analysis

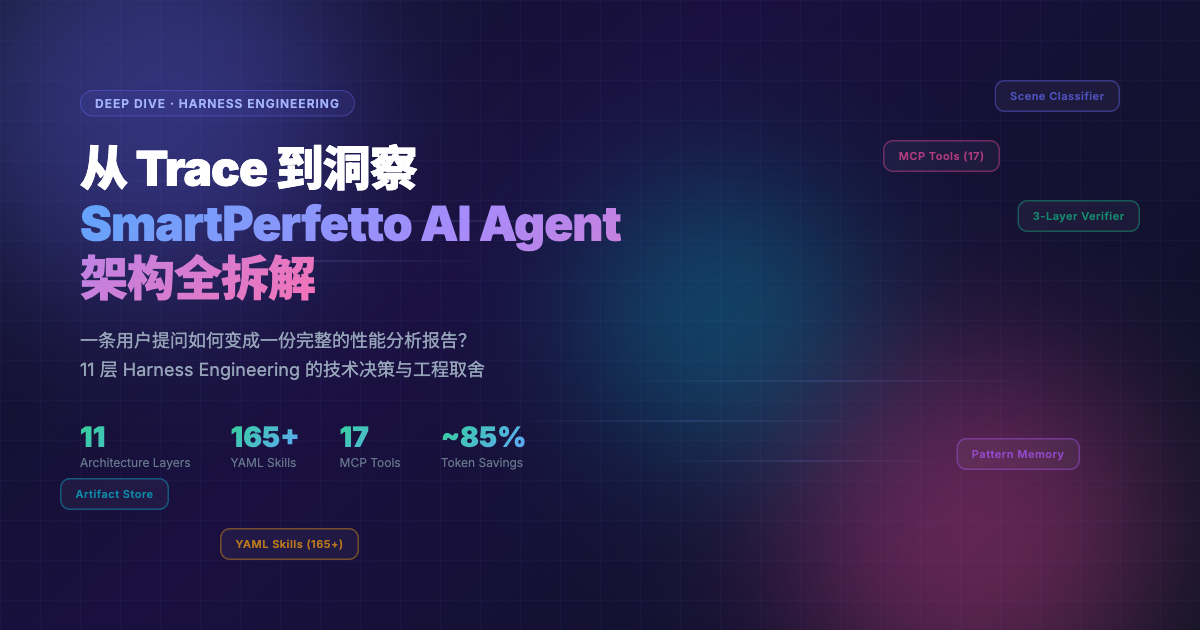
SmartPerfetto is now fully open source. Open the repository and you can see the runnable mainline project as it exists today: the Perfetto UI fork, the agentv3 backend, MCP tools, YAML Skills, scene strategies, scripts, and documentation. There is no private core module kept outside the repository, and this is not just a thin demo shell.

The project comes from a very concrete daily workflow: you have a trace in hand, Perfetto has already exposed the facts, but moving from facts to judgment still means jumping through tables, writing SQL, matching threads, checking FrameTimeline, finding the Binder peer, and then returning to the timeline to confirm everything again. SmartPerfetto tries to turn those repeated actions into tools, so performance engineers can spend more time on judgment.

It is still in development. I am releasing it now because trace analysis grows from real samples: real devices, real vendor differences, real product traces, and real PRs all change how Skills and strategies should be written. Waiting until every capability is stable before publishing it one way would miss the stage where samples matter most.

If you often open Perfetto to inspect scrolling jank, startup, ANR, Binder, CPU scheduling, or rendering pipelines, SmartPerfetto provides a Perfetto UI with an AI Assistant. After loading a trace, you ask questions in natural language. The backend queries trace_processor_shell, invokes YAML Skills, organizes evidence, and streams conclusions plus data tables back into the browser.

Project links:

For normal trial use, you only need the main repository. Gracker/perfetto is the frontend fork used by the perfetto/ submodule. It mainly matters to developers who want to modify the AI Assistant plugin UI.

The previous two technical articles are better for readers who want the engineering details:

Those two articles go deep into the internal architecture. Once the source is public, readers usually care more about what is actually in the repository, whether it can run, and which parts are not stable yet. This article focuses on the open-source release itself: what is open, what works today, how the internal pieces are divided, how to run it locally, and where collaboration is most useful.

Long-form Forecast: Phones May No Longer Start from Apps: How Agent OS Takes Over the Task Entry Point

Starting from Ming-Chi Kuo’s April 27, 2026 supply-chain report about an OpenAI phone, this article looks at the possible system shape after phones and AI merge, from the perspective of someone who works on Android phones.

Introduction: This Is Not Just a New Phone Problem

The most interesting part of Kuo’s report is not the 2028 mass-production window. It is not whether MediaTek, Qualcomm, or Luxshare ends up in which supplier position either.

It pushes the question into the system layer:

If the user’s primary goal shifts from opening apps to completing tasks, what should a phone operating system look like?

That sounds like a UI question. From an Android practitioner’s perspective, it touches the whole system structure: Launcher, notifications, permissions, IPC, app capability declarations, model runtime, TEE, device-cloud sync, task state machines, audit logs, payment confirmation, and developer revenue sharing all need to be reconsidered.

Over the past few years, most discussions about AI phones have stayed at the feature layer. Vendors talk about AI photo editing, AI erase, AI summaries, AI search, AI assistants, and AI briefings. All of these can fit inside today’s Android or iOS architecture.

If OpenAI really builds an AI Agent phone, it will move the question from “how many AI features can be added to a phone” to “should the phone’s first entry point still start from app icons?”

The main line is this: Agent OS looks like a structural migration of mobile OS after the graphical interface era. The foreground moves from an app grid to a task stream. The background moves from app-owned capability to authorized capability. The system moves from managing processes and windows to managing tasks, context, and responsibility.

OpenAI does not have to build on Android, but Android is the more likely path because it inherits hardware adaptation, drivers, app compatibility, and supply-chain experience. If OpenAI wants to design the first screen, permissions, and task flow completely around Agent OS, it may also choose an “Android-compatible but not quite Android” path, or even build a Linux-based system and fill the service gap with the web, cloud execution, and an app compatibility layer.

Different OS choices will change go-to-market speed. They will not change the five things Agent OS must solve:

  1. The phone must continuously understand the user’s current state.
  2. Apps must move from foreground entry points to background capability providers.
  3. The system must have a task runtime that is recoverable, cancellable, and auditable.
  4. Device-side and cloud-side execution must be split by data sensitivity and real-time needs.
  5. Every cross-app, cross-device, and cross-cloud action must have permission, responsibility, and rollback boundaries.

Without these five things, an AI phone is still just “a phone with an AI assistant.” Once they become system constraints, the phone starts moving toward Agent OS.

After Running OpenClaw Locally for Three Weeks, I Realized It's Not a Chatbot

I’ve been using OpenClaw heavily on my local machine for a while now. At first, I treated it like any other AI tool. But after wiring it into Telegram, Obsidian, scheduled tasks, local models, and my content workflow, I began to see it as a system that could keep working between conversations. It can receive messages, call tools, run scheduled tasks, dispatch to different models, build long-term memory, write results back to Obsidian, and delegate complex tasks to other agents. If you’re only using it as a chatbot, you’re using only part of its capabilities.

Android Perfetto Series 9: CPU Information Interpretation

When an app misses a frame deadline, first distinguish Running, Runnable, and sleeping or blocked time. Each leads to a different investigation. This article uses CPU scheduling, frequency, idle, and sampling data to turn “the CPU is slow” into observable behavior.

Verify CPU numbering, frequency limits, and scheduling policy on the target device. Running on a smaller core alone does not establish a scheduling error.

Android Perfetto Series 8: Understanding Vsync Mechanism and Performance Analysis

Perfetto’s vsync-app, vsync-sf, and app doFrame tracks can look like the same event. This article follows a frame request from SurfaceFlinger scheduling to the app, then relates it to RenderThread, buffers, and FrameTimeline.

The examples mainly concern 120 Hz operation. Phase settings, hardware-callback enablement, and pending frame requests affect the tracks; separate those meanings before interpreting latency.

Version note (reviewed October 2026): Java, JNI, and scheduling code are checked against android-16.0.0_r1; app/appSf roles also reference Android 13 source. Historical screenshots are not universal Android 16/17 configurations. Excerpts omit surrounding state where noted and come from different classes, not one compilable program.

Android Perfetto Series 7: MainThread and RenderThread Deep Dive

During a scrolling slowdown, the main thread may be doing layout or may already have handed drawing work to RenderThread. This article follows their hand-off, buffer submission, and SurfaceFlinger activity in Perfetto screenshots to locate waits.

The focus is the hardware-accelerated View/HWUI path. Other engines and software drawing can use different threads. FrameTimeline and presentation-side evidence are needed to determine what reached the screen.

Android Perfetto Series 6: Why 120Hz? Advantages and Challenges

120 Hz reduces the nominal refresh interval from 60 Hz’s 16.67 ms to about 8.33 ms. Display refreshes, app-produced frames, and distinct frames presented are different counts. This article uses a historical Perfetto trace to explain their relationship and the rendering/power trade-offs.

Part five covered Choreographer callbacks; here the focus is the shorter display cycle. The screenshots describe that capture, not every 120 Hz device’s scheduling configuration.

Android Perfetto Series 5: Choreographer-based Rendering Flow

This article introduces Choreographer, a class that App developers may not frequently encounter but is critically important in the Android Framework rendering pipeline. We will cover the background of its introduction, a brief overview, partial source code analysis, its interaction with MessageQueue, its application in APM (Application Performance Monitoring), and some optimization ideas for Choreographer by mobile phone manufacturers.

Choreographer coordinates pending frame callbacks with display timing; it does not itself set the screen refresh rate. At 120 Hz, the interval is about 8.33 ms. Meeting a frame deadline also depends on CPU scheduling, GPU work, buffers, and composition. Apps request callbacks as needed rather than redraw on every physical Vsync. This article also distinguishes what FrameCallback, FrameMetrics, gfxinfo, Looper, and Perfetto can observe.

Android Perfetto Series 4: Opening Large Traces via Command Line

This is the fourth article in the Perfetto series, explaining how to use trace_processor_shell to open large files exceeding 2GB locally. In actual problem analysis, we often encounter very large Trace files (greater than 2GB) that may fail to open in ui.perfetto.dev because of browser memory limits. The limit applies to memory used while parsing, not directly to the trace file’s size. In this case, we can use the official trace_processor_shell tool to open large files locally.

When I started this series, Perfetto had largely replaced Systrace in my daily work, and the OPPO and vivo teams I encountered were also migrating. Newcomers found the interface overwhelming and asked me to explain the subjects of my Systrace articles through Perfetto.

Android Perfetto Series 3: Familiarizing with the Perfetto View

The first two articles covered what Perfetto is and how to capture a trace. This third article starts after you open that trace: with so much on the screen, where do you look?

Android documentation labels Systrace a legacy tool and recommends Perfetto on Android 10+. When I wrote this article, Perfetto had largely replaced Systrace in my daily work, and the OPPO and vivo teams I encountered were migrating. This series continues the earlier analysis methods with Perfetto.

Technical review: 2026-10-14. The 2024 interface and case screenshots are retained. Updates to shortcuts and analysis semantics use official documentation and v58.3 source (11fbaed83636). The original case traces are not provided here; their illustrated wake-up chains and measurements are not new-version test results.

Android Perfetto Series 2: Capturing Perfetto Traces

The previous article Android Perfetto Series 1: Introduction to Perfetto introduced what Perfetto is. This article provides a brief introduction to Perfetto capture.

Android documentation labels Systrace a legacy tool and recommends Perfetto on Android 10+. When I wrote this article, Perfetto had largely replaced Systrace in my daily work, and the OPPO and vivo teams I encountered were also migrating. This series revisits the earlier analysis methods with Perfetto.

Technical review: 2026-10-14. The main examples target Android 12+. Original 2024 screenshots remain, with older-system and newer-UI differences explained below. Commands and configuration were checked against official documentation and script source; this update adds no new device-capture results.

Android Perfetto Series 1: Introduction to Perfetto

This is the first article in the Perfetto series. It mainly provides a brief introduction to the Perfetto tool, including its history, development, and what Perfetto can do.

Android documentation labels Systrace a legacy tool and recommends Perfetto on Android 10+. By the time I wrote this article, Perfetto had largely replaced Systrace in my daily work, and the OPPO and vivo teams I encountered were also migrating. Newcomers facing its complex interface asked me to revisit the Systrace articles using Perfetto.

Technical review: 2026-10-14. The original article and screenshots date from 2024. The updates below distinguish Android 10/11/12 data-source requirements and Perfetto v48.0/v49.0 UI changes from that earlier experience. Available data still depends on the device, recording configuration, and tool version.

Reflections on 2023: Health, Career, and the Future

I’m taking the easy way out this year and using a template to look back at the past year through several lenses: Health/Fitness, Work/Career, Friendship/Social, Personal Life/Family, Learning/Knowledge Management, Travel/Culture, Interests/Creativity, Emotions/Mental State, and Finances.

This post is more of a personal record for 2023 than a formal summary, and my writing isn’t anything special. But as I’ve realized, if you don’t record things, they slowly fade away. I hope that whenever I look back at this post, I’ll remember 2023 as a vibrant year—filled with unforgettable moments, low points, visits from distant friends, and journeys through mountains and rivers. I also want to remember the things I did poorly so I can do better next time, and to remind myself to fight the laziness that often prevents me from following through on what I know is right.

Feel free to read along and have a laugh at my expense.

Performance Considerations in Operating System Design

This article was originally written by Yingyun for my Knowledge Planet. Since the Planet has closed, I am publishing this series on OS performance design here.

Yingyun is a veteran performance optimization expert with deep insights into system-level tuning, having worked at several major smartphone manufacturers. He is currently active in our community. If you have any questions or feedback, feel free to join our WeChat group.

1. The Genesis

This starts a new series exploring the various considerations in OS architectural design. In reality, these principles apply to the design of any large-scale software.

My knowledge and experience have limits, and these views are subjective. There will be gaps. I would like to hear other views and see what I have missed.

Can an App Really Do Whatever It Wants With System Permissions?

In 2023, public research described vulnerability exploitation code and dynamically delivered DEX files associated with an Android app. I wanted to see which system capabilities this code attempted to use. I put the original article together in a hurry and did not examine all the code closely. The walkthrough remains here, with corrections based on the screenshots and AOSP source. The original references follow:

  1. Deep Blue Insight: The Most “Unpardonable” Vulnerabilities of 2022
  2. XXX apk embedded privilege escalation code and dynamic delivery dex analysis
  3. History of Android Deserialization Vulnerability Attack and Defense

Security is not my specialty. For background, see History of Android Deserialization Vulnerability Attack and Defense. This article does not reproduce the exploit chain or treat an API call as proof of root access.

The Performance Community Tea Talk - Episode 1

On Friday, March 25, 2022, at 9 PM, “The Performance” Knowledge Planet held its first online “Tea Talk.” We were joined by 3 planet hosts, 5 guest experts, and over 50 members. Thank you all for coming!

We had no set topic and expected to finish in an hour. We ended up talking for two and a half hours; introductions alone took an hour! We had talked plenty in the group and on Knowledge Planet, but this was our first voice chat together. People worked across the Android ecosystem, from app companies and phone manufacturers to chip companies and EV startups. Someone would mention their work, someone else would ask a question, and off we went.

At the time, we planned to hold more sessions with clearer themes and more guests, on topics beyond technology too. We did not record this session to protect participants’ privacy. The notes below reconstruct part of the conversation without including private details.

Systrace Thread CPU State Analysis Tips - Sleep and Uninterruptible Sleep

This is the third article in the “Systrace Thread CPU State Analysis Tips” series. It focuses on the Sleep and Uninterruptible Sleep states in Systrace—their causes, troubleshooting, and optimization. These states often represent normal waiting; investigate their conditions and dependencies when they delay a critical path.

The goal of this series is to use Systrace to view the Android system from a different perspective and to learn the Framework through visualization. While reading Framework source code can be difficult to remember, seeing the flow in Systrace can lead to deeper understanding. You can find the complete Systrace Basics and Action Series here.

Systrace Thread CPU State Analysis Tips - Running

This is the second article in the “Systrace Thread CPU State Analysis Tips” series. It analyzes the causes of the “Running” state in Systrace and provides optimization strategies for when Running segments are excessively long.

The goal of this series is to use Systrace to view the Android system from a different perspective and to learn the Framework through visualization. While reading Framework source code can be difficult to remember, seeing the flow in Systrace can lead to deeper understanding. You can find the complete Systrace Basics and Action Series here.

Systrace Thread CPU State Analysis Tips - Runnable

This is the first article in the “Systrace Thread CPU State Analysis Tips” series. It analyzes the causes of the “Runnable” state in Systrace and provides optimization strategies for when Runnable segments are excessively long.

The goal of this series is to use Systrace to view the Android system from a different perspective and to learn the Framework through visualization. While reading Framework source code can be difficult to remember, seeing the flow in Systrace can lead to deeper understanding. You can find the complete Systrace Basics and Action Series here.

Techniques, Philosophy, and Tools for Android Performance Optimization

Hackers & Painters

In his book Hackers & Painters, Paul Graham asserted, “The disparity in the efficiency of languages is becoming more pronounced, hence the rising importance of profilers. Currently, performance analysis isn’t given the attention it deserves. Many still seem to hold onto the belief that the key to accelerating program execution lies in developing compilers that generate faster code. As the gap between code efficiency and machine performance widens, it will become increasingly apparent that enhancing the execution speed of application software hinges on having a good profiler to guide program development.” by Paul Graham, Hackers & Painters

Search for “Android optimization tools” and you’ll find plenty of articles. Many repeat the same material or go straight to instructions without explaining how the tools fit together. It is easy to come away thinking one tool can solve everything. Our team’s experience says otherwise: there is no silver bullet. Tools change, and familiar problems return in new forms. You still need to understand what is happening underneath.

We’ll start with the data we collect, how we collect it, and how we analyze it. Then we’ll look at Google’s traditional “big three” performance tools. We want you to understand the measurements as well as the tools, and save yourself some of the detours others have already taken.

Android Performance Optimization: Techniques, Methods, and Tools

Hackers and Painters

In his book , Paul Graham states: “The execution efficiency gap between different programming languages is becoming increasingly large, so profilers are becoming more important. Currently, performance profiling is not receiving enough attention. Many people still believe that the key to improving program running speed is developing compilers that can generate faster code. The gap between code efficiency and machine performance is continuously increasing, and we will increasingly clearly see that the key to improving application software running speed is having a good performance profiler to guide program development.”

By Paul Graham — Hackers and Painters

Search for “Android optimization tools” and you’ll find plenty of articles. Many repeat the same material or go straight to instructions without explaining how the tools fit together. It is easy to come away thinking one tool can solve everything. Our team’s experience says otherwise: there is no silver bullet. Tools change, and familiar problems return in new forms. You still need to understand what is happening underneath.

We’ll start with the data we collect, how we collect it, and how we analyze it. Then we’ll look at Google’s traditional “big three” performance tools. We want you to understand the measurements as well as the tools, and save yourself some of the detours others have already taken.

2021 Year in Review: Baby, Career, and Growth

2021 has passed. Taking advantage of the New Year holiday, I’d like to look back at the year. This will be a casual review—writing whatever comes to mind. 2021 for me was marked by becoming a father, changing jobs (including a long, boring spell at home in between), and making new friends. Overall, it was a pretty good year.

However, in terms of personal growth, I feel like I might have stagnated or even regressed, which is a bit alarming. Learning is like rowing upstream; if you don’t move forward, you fall back. In 2022, I need to spend more time working through things properly. I hope to progress together with everyone reading this.

I’ve also tallied some data related to my technical sharing, shared my income from these platforms, and listed some hardware and software I recommend. Feel free to take a look.

What Should Be in a Book About Android Smoothness?

Recently, I read a new book: Building Smooth Android Apps (JD link: https://item.jd.com/10035215362170.html). I bought it because of the title, and after reading it, I felt it was necessary to write an article so that colleagues who haven’t bought it yet can understand what it’s about.

My personal suggestion is: if you are an experienced developer, I don’t recommend buying it. This book doesn’t go into much depth on principles and doesn’t offer a comprehensive overview of Android smoothness. If you are a beginner, it’s decent for broadening your horizons and identifying gaps in your knowledge, but it’s still a bit lacking for a deep understanding of Android smoothness.

I say this because the book doesn’t focus much on performance or smoothness. It lacks deep theoretical parts. Instead, a large portion is dedicated to static code analysis, using Android Studio Profiler, App architecture, app stay-alive techniques, network performance optimization, APK size optimization, app power consumption, etc. These topics are covered briefly and at a shallow level.

Android System Development Series (1): Downloading, Compiling, and Flashing Android 12

Android 12 source was released in 2021. My test phone at the time was a Pixel 3 XL. This article keeps that hands-on record and pins the release-build example to android-12.0.0_r3. Verify version mappings in the AOSP tags/build numbers table.

Compiling the code locally offers several advantages:

  1. Direct Debugging: You can flash the build onto a physical device for local debugging and import the code into Android Studio.
  2. Userdebug Builds: These provide additional debugging capabilities. adb root/remount still depends on adbd, AVB/verity, partition layout, and build configuration. A userdebug build does not make every directory writable or replace an app’s own debugging permissions.
  3. Studying the System: You can enable more system debug logs, add your own, and change the code to see how it works.
Android Systrace Responsiveness in Action 3 - Extended Knowledge on Responsiveness

Jank, slow response, and ANRs can share causes or occur together, but they are not three severity levels of the same problem. When a user says an app feels slow, first distinguish uneven animation, a long delay after an action, and a system-detected failure to respond.

Animation and scrolling stutter is usually called jank. Long startup, screen wake-up, or navigation delays are slow response / high latency. An ANR depends on a specific system timeout condition. Frame-drop rate, startup duration, and ANR rate measure different things.

This is the third article in the Responsiveness series, focusing on extended knowledge when using Systrace to analyze app responsiveness, including startup speed testing, log interpretation, state analysis, and third-party startup libraries.

Android Systrace Responsiveness in Action 2 - Responsiveness Analysis - Using App Startup as an Example

Jank, slow response, and ANRs can share causes or occur together, but they are not three severity levels of the same problem. When a user says an app feels slow, first distinguish uneven animation, a long delay after an action, and a system-detected failure to respond.

Animation and scrolling stutter is usually called jank. Long startup, screen wake-up, or navigation delays are slow response / high latency. An ANR depends on a specific system timeout condition. Frame-drop rate, startup duration, and ANR rate measure different things.

This is the second article in the Responsiveness series, using Android App Cold Start as an example to explain how to use Systrace for analysis.

Android Systrace Responsiveness in Action 1 - Understanding Responsiveness Principles

Jank, Responsiveness, and ANR often appear together and can share contributing causes, but they are not severity levels of one mechanism. Uneven visual progress, delayed feedback, and an ANR triggered by a particular timeout need separate evidence. Treat a user’s “the app is slow/stuttering” as an experience report first, then establish which action and outcome are delayed.

Uneven animation or scrolling is usually called Jank. Long startup, screen-wake, or transition delays are slow response / high latency; ANR means Application Not Responding. These categories can overlap. High latency can coexist with jank, while ANRs must be diagnosed by their specific trigger.

Furthermore, within Apps or manufacturers, Jank, Responsiveness, and ANR have individual metrics like Frame Drop Rate, Startup Speed, and ANR Rate. Mastering the analysis and optimization of these issues is crucial for developers.

This is the first article in the Responsiveness series, focusing on theoretical knowledge, including an overview of performance engineering, key responsiveness concepts, and analysis methodologies.

Android Systrace Smoothness in Action 3 - FAQs During Jank Analysis

Different people have different understandings of smoothness (jank/dropped frames) and different perceptions of jitter thresholds. Therefore, before starting this series, it is necessary to clarify the content to avoid misunderstandings. Here are some basic explanations:

  1. For mobile users, jank encompasses many scenarios: dropped frames when scrolling lists, excessive white screen during app startup, slow screen wake-up when pressing the power button, unresponsive interface followed by a crash, no response when clicking an icon, incoherent window animations, lagging touch response, or stuttering when entering the desktop after a reboot. These scenarios differ slightly from what developers understand as “jank.” Developers categorize these more finely, which is a cognitive gap between developers and users that must be noted when handling feedback from users or testers.
  2. Developers can initially classify feedback as Smoothness (uneven visual progress), Responsiveness (long waits after an action), or Stability (crashes and ANRs). These can overlap. An icon that appears unresponsive is not necessarily a stability failure; input, application state, and logs determine the diagnosis.
  3. These are not one Message-timeout mechanism with different thresholds. Long main-thread tasks can delay both input and rendering, but GPU work, SurfaceFlinger, the display stack, scheduling, or remote services can also cause delays. ANRs depend on specific input or component timeout rules; crashes have separate causes such as exceptions or signals. A long Message alone establishes neither.
  4. This series primarily analyzes smoothness-related issues. Responsiveness and stability will be covered in dedicated articles. Understanding smoothness first will make analyzing responsiveness and stability much easier.
  5. This series focuses on using Systrace (Perfetto) for analysis. Systrace is our entry point because many factors affect smoothness—some within the app itself and others within the system. Systrace (Perfetto) provides a holistic view of the system’s operation during the problem, helping us initially pinpoint the root cause.
Android Systrace Smoothness in Action 2 - Case Analysis - MIUI Launcher Scroll Jank Analysis

Different people have different understandings of smoothness (jank/dropped frames) and different perceptions of jitter thresholds. Therefore, before starting this series, it is necessary to clarify the content to avoid misunderstandings. Here are some basic explanations:

  1. For mobile users, jank encompasses many scenarios: dropped frames when scrolling lists, excessive white screen during app startup, slow screen wake-up when pressing the power button, unresponsive interface followed by a crash, no response when clicking an icon, incoherent window animations, lagging touch response, or stuttering when entering the desktop after a reboot. These scenarios differ slightly from what developers understand as “jank.” Developers categorize these more finely, which is a cognitive gap between developers and users that must be noted when handling feedback from users or testers.
  2. Developers can initially classify feedback as Smoothness (uneven visual progress), Responsiveness (long waits after an action), or Stability (crashes and ANRs). These can overlap. An icon that appears unresponsive is not necessarily a stability failure; input, application state, and logs determine the diagnosis.
  3. These are not one Message-timeout mechanism with different thresholds. Long main-thread tasks can delay both input and rendering, but GPU work, SurfaceFlinger, the display stack, scheduling, or remote services can also cause delays. ANRs depend on specific input or component timeout rules; crashes have separate causes such as exceptions or signals. A long Message alone establishes neither.
  4. This series primarily analyzes smoothness-related issues. Responsiveness and stability will be covered in dedicated articles. Understanding smoothness first will make analyzing responsiveness and stability much easier.
  5. This series focuses on using Systrace (Perfetto) for analysis. Systrace is our entry point because many factors affect smoothness—some within the app itself and others within the system. Systrace (Perfetto) provides a holistic view of the system’s operation during the problem, helping us initially pinpoint the root cause.
Android Systrace Smoothness in Action 1 - Understanding Jank Principles

Different people have different understandings of smoothness (jank/dropped frames) and different perceptions of jitter thresholds. Therefore, before starting this series, it is necessary to clarify the content to avoid misunderstandings and help everyone approach these articles with the right questions. Here are some basic explanations:

  1. For mobile users, jank encompasses many scenarios: dropped frames when scrolling lists, excessive white screen during app startup, slow screen wake-up when pressing the power button, unresponsive interface followed by a crash, no response when clicking an icon, incoherent window animations, lagging touch response, or stuttering when entering the desktop after a reboot. These scenarios differ slightly from what developers understand as “jank.” Developers categorize these more finely, which is a cognitive gap between developers and users that must be noted when handling feedback from users or testers.
  2. Developers can initially classify feedback as Smoothness (uneven visual progress), Responsiveness (long waits after an action), or Stability (crashes and ANRs). These can overlap. An icon that appears unresponsive is not necessarily a stability failure; input, application state, and logs determine the diagnosis.
  3. These are not one Message-timeout mechanism with different thresholds. Long main-thread tasks can delay both input and rendering, but GPU work, SurfaceFlinger, the display stack, scheduling, or remote services can also cause delays. ANRs depend on specific input or component timeout rules; crashes have separate causes such as exceptions or signals. A long Message alone establishes neither.
  4. This series primarily analyzes smoothness-related issues. Responsiveness and stability will be covered in dedicated articles. Understanding smoothness first will make analyzing responsiveness and stability much easier.
  5. This series focuses on using Systrace (Perfetto) for analysis. Systrace is our entry point because many factors affect smoothness—some within the app itself and others within the system. Systrace (Perfetto) provides a holistic view of the system’s operation during the problem, helping us initially pinpoint the root cause.
Why is the Weibo Experience Better on Huawei? A Technical Analysis and Reflection

A fellow developer shared a Weibo post (https://weibo.com/1808884742/IApbpEVQr) where blogger @王波粒 noticed a peculiar phenomenon on the Mate 30 Pro. I highly recommend watching the video first.

The question concerns a difference observed in 2020: some Huawei samples displayed feed images during scrolling, while some other samples waited until the list stopped. This is not a claim about every current device; configuration, caches, and system behavior can differ even with the same client version.

The same version of Weibo behaving differently on different phones was something I wanted to understand as a system performance engineer. Had Weibo made a specific adaptation? What had changed? Let’s look at the code and see what we can learn.

An Incident Caused by a 'Leap' Month - Analysis of Samsung System Reboots

Around 1:30 AM on May 23, 2020, a large number of Samsung phone users in China experienced severe issues including freezes, infinite reboots, and forced entries into Recovery Mode. Improper handling by users led to data loss, and the incident quickly became a trending topic on social media platforms like Zhihu, with service centers overwhelmed.

Social media responses ranged from frustration to anger, with some comparing the incident to the Note 7 battery disaster, “charging-gate,” or “green-screen-gate.” Some predicted Samsung would be forced out of the Chinese market. People lost job offers due to missed calls, others lost valuable data, and some even resorted to smashing their devices in frustration.

As an Android developer, I am not here to pile on Samsung. My goal is to uncover the root cause of this incident and see what we can learn from it. Since it’s a technical failure in the Android system, it’s essential to analyze it from a technical perspective.

Analysis of Android App Chain Wakeups

The release of MIUI 12 brought a long-standing battle between App developers and ROM developers into the public eye, revealing the intricate details of this technical tug-of-war. As the saying goes, “While the demon rises a foot, the path rises ten feet.” ROM developers, with their higher system-level permissions, generally hold the upper hand. App developers, however, are not easily deterred, employing various “black technologies” for background persistence and cross-app wakeups. Even Google has stepped in to mediate, establishing rules to regulate behavior for both parties. This competition is arguably healthy; a total victory by either side would inevitably lead to stagnation or the loss of useful functionality.

However, the victims of this struggle are undoubtedly the consumers. If App developers succeed, phones become cluttered with persistent background processes that hog CPU and memory. Conversely, if ROM developers are too aggressive, the app experience suffers—a pain well-known to many Android developers.

As discussed later in this article, most smartphone manufacturers have developed their own strategies to handle auto-starts and associated starts. Beyond the technical struggle, there’s the issue of privacy. Baidu’s Robin Li once remarked that “Chinese people are more open about privacy and relatively less sensitive. If they can trade privacy for convenience, safety, or efficiency, they are willing to do so in many cases.” Consider the convenience of copying a phrase in WeChat and having Taobao automatically open to the corresponding item. It’s helpful, isn’t it? But do we really want every app peering into our clipboards?

Android Systrace Basics - SurfaceFlinger Explained

This is the fifth article in the Systrace series, primarily providing a brief introduction to the workflow of SurfaceFlinger. It covers several important threads within SurfaceFlinger, including Vsync signal interpretation, app buffer display, and jank detection. Since Vsync has already been covered in Systrace Basics - Vsync Explained and Detailed Explanation of Android Rendering Mechanism Based on Choreographer, it won’t be discussed in detail here.

The purpose of this series is to view the overall operation of the Android system from a different perspective using Systrace, while also providing an alternative angle for learning the Framework. Perhaps you’ve read many articles about the Framework but can never remember the code, or you’re unclear about the execution flow. Maybe from Systrace’s graphical perspective, you can gain a deeper understanding.

Android Developer Learning Path (2020 Edition)

On Medium, @MindOrks published a 2020 Android Developer Learning Path. Given that some readers may have difficulty accessing the original content, I am sharing it here combined with my own 2020 learning plan for your reference.

The original article is quite simple, mostly listing knowledge points without much explanation. I have added brief introductions for each point and included some additional topics based on my own understanding. This is for your reference only.

This article is primarily for Android developers. If you are a beginner, it will help you find a learning path. If you are an experienced developer, it can help you identify gaps in your knowledge. If you have any other suggestions, feel free to leave a message.

My 2020 Reading List

Below is my 2020 reading list. Everything recorded here has been finished - technical books are not included since it’s hard to define when they’re “finished.”

I prefer reading history-related books. Among them, The Siege of Kaifeng was painful to read—the idea that a weak country has no say in diplomacy felt horribly real; Bad Kids lives up to its name, personally I feel it’s much better than the TV series; Rework 2 and Rework 3 are work-related, covering remote work and work methods, consistent with the 2020 trend of working from home - recommended for white-collar programmers; My Last Diet Book systematically and professionally discusses weight loss knowledge, very useful for someone like me who’s trying to lose weight; finally, Blades of the Guardians is already a classic in Chinese comics - I’ll definitely buy a physical set for collection once it’s complete (same for Attack on Titan).

Didn’t read much in 2020. Need to invest more in this area in 2021. Read + Record + Summarize - reading notes will be added later.

Android Systrace Basics - CPU Info Interpretation

This is the twelfth article in the Systrace series, primarily providing a brief introduction to the CPU information area (Kernel) in Systrace. It covers how to view CPU-related information output by the Kernel module, including CPU frequency, scheduling, frequency locking, and core locking.

The purpose of this series is to view the overall operation of the Android system from a different perspective using Systrace, while also providing an alternative angle for learning the Framework. Perhaps you’ve read many articles about the Framework but can never remember the code, or you’re unclear about the execution flow. Maybe from Systrace’s graphical perspective, you can gain a deeper understanding.

Android Systrace Basics - Triple Buffer Explained

This is the eleventh article in the Systrace series, providing a brief introduction to Triple Buffer within Systrace. It covers how to identify jank in Systrace, perform preliminary localization and analysis, and explains the impact of Triple Buffer on performance.

The purpose of this series is to view the overall operation of the Android system from a different perspective using Systrace, while also providing an alternative angle for learning the Framework. Perhaps you’ve read many articles about the Framework but can never remember the code, or you’re unclear about the execution flow. Maybe from Systrace’s graphical perspective, you can gain a deeper understanding.

Android Systrace Basics - Binder and Lock Contention Explained

This is the tenth article in the Systrace series, primarily providing a brief introduction to Binder and lock information in Systrace. It covers the basic situation of Binder, the representation of Binder communication in Systrace, how to view Binder information, and analysis of lock contention in SystemServer.

The purpose of this series is to view the overall operation of the Android system from a different perspective using Systrace, while also providing an alternative angle for learning the Framework. Perhaps you’ve read many articles about the Framework but can never remember the code, or you’re unclear about the execution flow. Maybe from Systrace’s graphical perspective, you can gain a deeper understanding.

[Sticky] Blog Article Directory

The content of this blog mainly focuses on Android development and optimization-related topics, including the use of performance tools, Android App optimization knowledge, Android Framework explanations, and performance theory. Here is an organized directory for your reference. You can choose the parts you are interested in. This directory includes not only blog content but also some of my answers on Zhihu or historical discussions in The Performance, which has closed. This directory lists my original blog posts. Additionally, I have collected some excellent articles in Must-Knows for Android Performance Optimization, which I update periodically.

Articles come first; tools, Apps, and content projects are collected under Personal Projects. See also the AIW introduction and repository.

Android Systrace Basics - Vsync Explained

This is the seventh article in the Systrace series, primarily introducing the Vsync mechanism in Android. This article examines the display of each frame in the Android system from the perspective of Systrace. Vsync is a critical mechanism in Systrace. Although invisible and intangible when operating a phone, we can see in Systrace how the Android system, guided by Vsync signals, orderly performs rendering and composition for each frame, ensuring stable frame rates.

The purpose of this series is to view the overall operation of the Android system from a different perspective using Systrace, while also providing an alternative angle for learning the Framework. Perhaps you’ve read many articles about the Framework but can never remember the code, or you’re unclear about the execution flow. Maybe from Systrace’s graphical perspective, you can gain a deeper understanding.

Complete Guide to Android App Startup Optimization

I’ve gathered the Android app startup optimization approaches I knew of when writing this article. Use them as a checklist: see what others have tried, then look for gaps in your own app. The details depend heavily on your business, so I won’t explain every implementation here. Once you find an approach that fits, follow up on that particular method.

I’ve also included some startup work done by system manufacturers, limited to the parts I know about. There are proprietary tricks I can’t cover here. Knowing what happens on the system side may still help, including when discussing whitelisting or SDK integration with a manufacturer.

Comprehensive Record of Android App Startup Optimization

I’ve gathered the Android app startup optimization approaches I knew of when writing this article. Use them as a checklist: see what others have tried, then look for gaps in your own app. The details depend heavily on your business, so I won’t explain every implementation here. Once you find an approach that fits, follow up on that particular method.

I’ve also included some startup work done by system manufacturers, limited to the parts I know about. There are proprietary tricks I can’t cover here. Knowing what happens on the system side may still help, including when discussing whitelisting or SDK integration with a manufacturer.

Android Systrace Basics - MainThread and RenderThread Explained

This is the ninth article in the Systrace series, primarily introducing the MainThread and RenderThread in Android Apps—commonly known as the Main Thread and Rendering Thread. This article examines their workflows from the perspective of Systrace and covers related topics: jank, software rendering, and dropped frame calculation.

The purpose of this series is to view the overall operation of the Android system from a different perspective using Systrace, while also providing an alternative angle for learning the Framework. Perhaps you’ve read many articles about the Framework but can never remember the code, or you’re unclear about the execution flow. Maybe from Systrace’s graphical perspective, you can gain a deeper understanding.

Android Systrace Basics - Input Interpretation

This is the sixth article in the Systrace series, primarily providing a brief introduction to Input in Systrace. It covers the Input workflow, how Input information is represented in Systrace, and how to combine Input info to analyze related performance issues.

The purpose of this series is to view the overall operation of the Android system from a different perspective using Systrace, while also providing an alternative angle for learning the Framework. Perhaps you’ve read many articles about the Framework but can never remember the code, or you’re unclear about the execution flow. Maybe from Systrace’s graphical perspective, you can gain a deeper understanding.

Analysis of 'Zombie Animations' in the Android Background

This article records a 2019 issue: animation work continued after the app’s UI was no longer visible. However, some apps continue to run “zombie animations”—animations that are completely invisible to the user yet consume precious CPU cycles and battery. When users discover this, the result is often a manual kill, an OS-level background restriction, or an outright uninstallation.

This issue can be easy to miss. In the original investigation, I used Systrace after opening apps and returning home, capturing traces while swiping between launcher pages. Some departed apps still fired callbacks. A reproduction should record versions, operations, and visibility; opening many apps is not itself a diagnostic requirement or proof.

Here, “zombie animations” means updates that continue when their UI is invisible and the feature no longer needs them. Many paths can schedule animation work through Choreographer. Investigate the actual stack, playback state, and library version. A live process is not necessarily free to consume CPU indefinitely; modern systems can freeze eligible cached processes.

Detailed Explanation of Android Rendering Mechanism Based on Choreographer

This article introduces Choreographer, a class that app developers rarely encounter but is crucial in the Android Framework rendering pipeline. It covers the background of Choreographer‘s introduction, an overview, source code analysis, its relationship with MessageQueue, its use in APM, and optimization ideas from mobile manufacturers.

Choreographer coordinates animations, some input processing, and View updates with display timing. It requests frame callbacks when work is pending rather than unconditionally waking the app on every physical refresh. A 60Hz display, common in 2019, has an interval of about 16.67ms; 90Hz and 120Hz correspond to about 11.11ms and 8.33ms. Modern devices can also change refresh rates. A timely callback does not mean the image has been presented: RenderThread, GPU, composition, and display work remain. Understanding this flow helps explain Message, Handler, Looper, MessageQueue, Measure, Layout, and Draw.

Overview of Jank and Frame Drops in Android - Low Memory

In the Overview of Jank and Frame Drops in Android - System Layer article, we touched upon jank cases caused by low system memory. Since low memory has a significant impact on overall device performance, I’m dedicating this article to exploring those effects in depth.

As Android versions evolve and apps become more feature-heavy, their memory requirements increase. When this article was written in 2019, many devices had 4GB of RAM or less. These users are prone to low memory situations, especially after major system updates or as more apps and services run concurrently.

Memory pressure can contribute to slow responsiveness and jank. Examples include longer app launch times, more frame drops in scrolling, more frequent cold starts as background processes are killed, and extra reclaim/restart work that can increase power use. Heat alone does not diagnose memory pressure. Below, I’ll outline the causes, debugging methods, and potential optimizations for these issues.

Case Study: Debugging the Android Launcher Kill Problem

This started with a bug I encountered at work. It was not a difficult one, but while writing my diary afterward, I thought the investigation was worth recording and sharing. I also learned some useful analysis and tool tricks from my clever colleague Mei Ming.

I’ve used a variety of tools mentioned in my Android Performance Optimization Methodology, including:

  • Reproduction Video
  • Event Log
  • AS Source/Debug
  • AS Profiler
  • Systrace
  • Dumpsys
  • Unix ps utility

You might wonder whether such a simple bug needs an article. I wanted to keep a record for myself, and the way we used the tools together may be useful in other investigations. If it helps you, all the better. If you have your own debugging tricks, please join our discussion group and share them!

Overview of Jank and Frame Drops in Android - Application Layer

Technical review · 2026-10-13. The original 2019 images, thread listing, and author observations are retained. Technical checks use AOSP android-9.0.0_r1 and android-16.0.0_r1, with current entry points including API 31 frame timing and DataStore 1.2.1. The screenshots are not measurements of current app releases; no original-device or complete-trace reproduction was performed.

In the Overview of Jank and Frame Drops in Android - System Layer article, we listed causes of jank originating from the system. In this article, we focus on causes stemming from the App itself. When you encounter lag, before blaming the phone manufacturer, consider if it’s the App’s own inefficiency.

OEM and app teams may use Matrix or their own monitoring. System access can reveal more evidence, but coverage still depends on build, capture configuration, and platform support.

Average FPS alone does not describe smoothness. Two periods averaging 55 FPS can have different frame intervals and pauses. Consider intended cadence, actual presentation, and input response rather than using a change from 60 to 55 as a diagnosis. This four-part series includes:

Overview of Jank and Frame Drops in Android - System Layer

Technical review · 2026-10-13. These cases and screenshots date from 2019. The review uses relevant Android 8.1/9/16 source, Linux v6.6 documentation, and current Android documentation while preserving the images and the author’s experience. Long slices, CPU numbers, reclaim activity, and input pacing are no longer treated as standalone proof of root cause. No original-device rerun or complete trace replay was performed, and missing conditions are not invented.

The Application Layer article covers app-side problems. Here we organize cases around system services, display, scheduling, and memory. Hardware, kernels, and vendor implementations differ, so retain the actual system version and configuration.

OEM and app teams may use Matrix or their own monitoring. System privileges can expose more evidence, but capture scope still depends on build type, kernel configuration, and enabled sources.

Smoothness is not simply average FPS. An average of 55 FPS over one second on a 60 Hz display does not locate the delayed frames or determine every user’s perception. Examine intended pacing, actual presentation intervals, and input response. Static screens need not submit content on every refresh. The four-part series is:

Overview of Jank and Frame Drops in Android - Methodology

Technical review · 2026-10-13. This article retains the manufacturer’s optimization-team experience and industry opinions from 2019. The technical sections now distinguish Android 12 (API 31) FrameTimeline, JankStats, and Macrobenchmark. Looper logging was checked against AOSP android-9.0.0_r1 / android-16.0.0_r1; Matrix v2.1.0 is the documented feature baseline. No new device measurements were performed.

Jank issues in Android matter to both smartphone manufacturers and app developers. Internal performance or platform teams often investigate and optimize them.

Tools such as Tencent’s Matrix provide app-side performance evidence. Manufacturers can add their own instrumentation and use system source access and suitable debugging privileges to collect deeper data. Actual visibility still depends on the OS version, kernel configuration, build type, and enabled data sources.

Smoothness is not just average FPS. Two intervals averaging 55 FPS can contain very different frame spacing: one might include a noticeable pause, while another is more evenly paced. Consider the intended update cadence, actual presentation intervals, and input response together. Refresh intervals at 60/90/120 Hz are about 16.67/11.11/8.33 ms, but they are not fixed CPU budgets summed across every thread. A static screen need not submit new content on every refresh.

Causes can lie in the app, system, kernel, or display pipeline. This series has four parts:

A Detailed Guide to Activity Launch Modes in Android

Technical review · 2026-10-13. The 2019 sequences remain historical examples. Task selection, affinity, and Recents behavior were checked against AOSP android-9.0.0_r1 and android-16.0.0_r1; Android 12 (API 31) singleInstancePerTask is added below. The old records lack a complete device build identifier, and no device rerun was performed for this review.

Android Activities have several important launch modes: standard, singleTop, singleTask, and singleInstance. Plenty of articles explain these modes. I wrote a small demo to show how they change the arrangement of activities in tasks. The newer singleInstancePerTask mode is covered afterward.

Ordinary navigation within a task is commonly LIFO. Below, A -> B denotes the sequence of launch actions; task contents are listed top first. Keep an eye on the task contents after each action; following the changes makes the differences easier to see. Repeating a launch action does not necessarily create an instance. A Task is not a process or necessarily one visible Recents card.

I put the demo on GitHub too: AndroidLunchModeTest. The reviewed snapshot is eaa1f987e332e0f85187a911ad9ae01cd20fff05, using compile/target SDK 29 and min SDK 26. Its package is com.example.lunchmodetest, whereas the historical sequences below retain com.example.launchmodetest.

Check all navigation targets for each case. In the snapshot, MainActivity.startSingleTopActivity launches SingleTaskActivity, and StandardActivity launches SingleInstanceWithAffinityActivity by default. Changing one target does not implement every sequence. The WithAffinity classes actually use empty affinity; SingleTopWithAffinityActivity does not even declare singleTop. Class names are not configuration evidence. The sample code was inspected for this review; the project was not modified or compiled.

The explanations assume the same user, ordinary foreground Activity launches, and no extra Intent flags unless stated. Updating the old project to target SDK 31+ also requires explicit android:exported for components with intent filters; use true for the Launcher entry.

Android Systrace Basics - Prerequisites for Analyzing Systrace

Technical update — 2026-10-13: Historical Systrace screenshots are retained, including cases added after the original 2019 article. Colors and shortcuts refer to the legacy UI. Linux state semantics are checked against v6.6 documentation; the modern UI reference is Perfetto v58.3 (11fbaed83). Inaccurate Self Time, wakeup and scheduling-state annotations in the images are corrected in the adjacent text. These are not new device measurements.

This is the second article in the Systrace series, primarily explaining the prerequisites for analyzing Systrace. With these prerequisites, analyzing Systrace will be more effective, allowing you to identify issues faster and more efficiently.

This article introduces how to view thread states in Systrace, how to analyze thread wakeup information, how to interpret data in the information panel, and common shortcuts. By studying this article, you will gain an understanding of process and thread-related information and know how to extract key information from complex Systrace traces.

Android Systrace Basics - SystemServer Explained

Technical update — 2026-10-13: The historical screenshots and code are retained. Code excerpts were checked against AOSP android-10.0.0_r1; modern differences use android-16.0.0_r1 as an example. These tags do not identify the screenshot devices: the original traces, ROMs and build details were not supplied. The descriptions of animation ownership, StartingWindow and thread interactions are corrected below.

This is the fourth article in the Systrace series, primarily providing a brief introduction to SystemServer. It covers several important threads within SystemServer. Since Input and Binder are particularly critical, they are discussed separately and won’t be covered in detail here.

The purpose of this series is to view the overall operation of the Android system from a different perspective using Systrace, while also providing an alternative angle for learning the Framework. Perhaps you’ve read many articles about the Framework but can never remember the code, or you’re unclear about the execution flow. Maybe from Systrace’s graphical perspective, you can gain a deeper understanding.

Android Systrace Basics - Introduction to Systrace

Technical update — 2026-10-13: First published in 2019, this article retains Systrace HTML and script workflows as historical references. Modern capture examples start from Android 11 / API 30+, with separate version requirements for app tracing APIs, permissions and data sources. Device-side atrace, host-side systrace.py and perfetto are different tools; their options are not interchangeable.

This is the first article in the Systrace series, primarily providing a brief introduction to Systrace, its basic usage, how to interpret Systrace traces, and how to analyze phenomena in Systrace in conjunction with other tools.

The purpose of this series is to view the overall operation of the Android system from a different perspective using Systrace, while also providing an alternative angle for learning the Framework. Perhaps you’ve read many articles about the Framework but can never remember the code, or you’re unclear about the execution flow. Maybe from Systrace’s graphical perspective, you can gain a deeper understanding.

Android Systrace Basics - Why 60 FPS?

Technical update — 2026-10-13: First published in 2019, this article uses 60 Hz devices to explain frame pacing. 60 FPS is not a fixed standard for every Android device. The universal 16.67 ms budget, mismatched-rate examples and power claims are corrected below, with updated tools available from Android 11 / API 30 and Android 12 / API 31.

This is the third article in the Systrace series, explaining why 60 FPS is constantly emphasized. Here, FPS describes the app’s content frame rate, while Hz describes display refresh rate; they measure different things. For further context, refer to: A New Smooth Experience: A Talk on 90Hz.

The purpose of this series is to view the overall operation of the Android system from a different perspective using Systrace, while also providing an alternative angle for learning the Framework. Perhaps you’ve read many articles about the Framework but can never remember the code, or you’re unclear about the execution flow. Maybe from Systrace’s graphical perspective, you can gain a deeper understanding.

This article separates frame rate from refresh rate, then discusses pacing, power and response latency. On 90 Hz and 120 Hz devices, content updates still need to work with display timing, but 60 FPS and 16.67 ms are no longer universal targets.

Android Systrace -- Series Article Index

Technical update — 2026-10-13: This page is dated 2019 and retains update records from earlier tutorials. The old Systrace tooling workflow is obsolete. Read historical screenshots, source code and experiments against the Android versions stated in each article; they do not describe every current implementation. Start with the Perfetto series below for current capture and analysis workflows.

As Systrace and Android changed, my earlier tutorials started to show their age. I had also learned to read more from a trace, which helped me solve performance problems. I wanted to write those things down and get better at explaining what I had learned. If the notes helped someone else too, all the better.

The purpose of this series is to view the overall operation of the Android system from a different perspective using Systrace, while also providing an alternative angle for learning the Framework. Perhaps you’ve read many articles about the Framework but can never remember the code, or you’re unclear about the execution flow. Maybe from Systrace’s graphical perspective, you can gain a deeper understanding.

Sharp Tools - Efficient Tool Recommendations
I’ve been following the Sharp Tools Community Program for a long time. I’ve learned a lot from everyone’s sharing. As stated in the beginning: “Both tools and inspiration are sharp tools. When tools and inspiration from different fields and creators collide, more possibilities arise.“ Below are m...
Liqi - High-Efficiency Tools Recommendation
I saw the Liqi Community Project a long time ago. I learned a lot from everyone’s sharing. As stated in the beginning: “Tools and inspiration are both Liqi. When tools and inspiration from different fields collide with each other, more possibilities will emerge.“ Below are my simple answers to th...
2018 Best Items Recommendations - A Reward for Your Hard Work

At the beginning of 2018, I wrote 2017 Best Items Recommendations. Recently, some people asked if I’d do one for 2018. Although 2018 was a tough year, there were still some great things worth recommending to everyone.

Just like in 2017, I’ll share things that I found helpful for work or life. The recommendations include apps, hardware, books, blogs, and columns. I hope they provide value to you in 2019.

Historical recommendations (reviewed October 2026): This is a record of my 2018 experience. Book lists, ratings, prices, course posters, and buying recommendations belong to that period. Updated platform support and membership limits are noted below; old QR codes are not current enrollment links.

Lu Qi: Besides Good Code, What Makes an Engineer Excellent?
Reposted from: Baidu Family, based on Lu Qi’s internal sharing at Baidu in July 2017. It is highly worth learning and pondering for technical personnel. Historical reprint (reviewed October 2026): The speech text and personal appreciation below are preserved. Roles, schedules, and patent count...
Does the Android System Not Release Memory?

Besides the CPU, many users consider RAM size when buying a phone. Different RAM configurations come with different prices—but how much RAM do you actually need? How does Android manage its memory? Average users are often confused: How much RAM does this app use? How much does the system use? How does RAM affect my experience? And how much RAM should my next phone have?

A common question on Zhihu is: “Does the Android system not release memory?”. It’s not that the user doesn’t know the system releases memory, but rather they want to understand the mechanics to optimize their experience. In this article, I’ll address these user concerns. More technical details will be covered in later articles.

Some Thoughts on Android System Fluency

Version note — reviewed October 13, 2026: This article was written in 2018. Device examples, app experiences, and vendor opinions describe that period; the old hardware rankings and buying advice are outdated. Technical corrections and updates identify their Android versions. These are not new measurements of the named products.

I’ve long wanted to write about Android system fluency because it’s the most direct aspect of the user experience. The long-standing criticism that Android “gets laggier over time” still casts a shadow over the platform, and it’s a primary reason many users default to iPhone.

Because Google keeps Android open, different manufacturers produce devices with vastly different hardware, and app quality varies wildly. Consequently, fluency is affected by countless factors. It’s rarely just “the system isn’t optimized.” Often, two devices with the same OS but different SOCs offer completely different experiences.

I want to talk through some of the reasons Android can feel slow, so that the next time it happens, we don’t immediately blame the system. Perhaps uninstalling one app will turn out to be enough. Here are the areas I want to cover:

  1. Hardware
  2. System
  3. Applications
  4. The Optimization Loop

Ready? Let’s get started, and please join the discussion.

Zhihu: Save Your StartingWindow

It’s often said that the overall iOS experience is superior to Android. This is partly due to third-party software quality (iOS versions are often more polished) and partly due to Apple’s tight control over its ecosystem. To get on the App Store, you must pass rigorous reviews.

Today we look at the system-provided transition before app content is ready: Android’s StartingWindow and iOS’s Launch Screen. Neither is the same as an advertising Activity or business home screen rendered by the app.

I originally wrote that iOS required a single image. I was wrong about that. Xcode 6 release notes document XIB/Storyboard launch screens from iOS 8. They provide early feedback, not a guaranteed zero-delay timestamp. Older Android theme paths allowed customization, disabled previews, and translucent windows; behavior depends on the OS version.

2017 Best Recommendations - A Reward for Hard-Working Self

2017 slipped by before I knew it, and I haven’t updated the blog in ages. Partly, the more I learn, the less I feel I know, and I worry about misleading readers with a technical post. Partly, I’m just lazy. So I’ve decided this blog doesn’t have to be all technical articles. I’ll also write about things that matter to me and thoughts I want to keep. It’s a record for myself; if someone else finds it useful, even better. (Not that there are many readers…)

With 2017 just behind us, I wanted to share the things I enjoyed using or found helpful at work and at home. Maybe some will be useful to you in 2018. There are apps, hardware, books, and exercise equipment here. These are my picks; what worked for me may not work for you. Right, on to the list.