CN

loading
Android Performance Patterns: Profile GPU Rendering

Series Catalog:

  1. Overview of Android Performance Patterns
  2. Android Performance Patterns: Render Performance
  3. Android Performance Patterns: Understanding Overdraw
  4. Android Performance Patterns: Understanding VSYNC
  5. Android Performance Patterns: Profile GPU Rendering

Technical review (2026-10-13): The three-color diagrams are retained from the 2015 video. Their Update / Execute / Process stages can be compared with Android 4.4.4 source. Android 6.0 and Android 16 use finer breakdowns and different reference-line implementations; the old legend does not apply unchanged to every device.

Original video introduction:

“If you can measure it, you can optimize it” is a common term in the computing world, and for Android’s rendering system, the same thing holds true. In order to optimize your pipeline to be more efficient for rendering, you need a tool to give you feedback on where the current perf problems lie.

In this video, Colt McAnlis walks you through an on-device tool built for this exact reason. “Profile GPU Rendering” will help you understand the stages of the rendering pipeline, see which portions might be taking too long, and decide what to do about it in your application.

Profile GPU Rendering Tool

Profile GPU Rendering is a quick on-device tool for finding operations associated with high rendering-stage costs. Despite its name, the bars do not directly measure GPU hardware execution time, and cannot identify every cause of jank on their own. See the official explanation.

Android Performance Patterns: Understanding VSYNC

Series Catalog:

  1. Overview of Android Performance Patterns
  2. Android Performance Patterns: Render Performance
  3. Android Performance Patterns: Understanding Overdraw
  4. Android Performance Patterns: Understanding VSYNC
  5. Android Performance Patterns: Profile GPU Rendering

Technical review (2026-10-13): The introduction and nine diagrams are retained from the 2015 video. The text corrects the fixed-60Hz assumption, tearing explanation, and “VSync copies the back buffer” description, and adds modern frame-rate hints and analysis tools.

Original video introduction:

Unbeknownst to most developers, there’s a simple hardware design that defines everything about how fast your application can draw things to the screen.

You may have heard the term VSYNC - VSYNC stands for vertical synchronization and it’s an event that happens every time your screen starts to refresh the content it wants to show you.

Effectively, VSYNC is the product of two components: Refresh Rate (how fast the hardware can refresh the screen), and Frames Per Second (how fast the GPU can draw images). In this video, Colt McAnlis walks through each of these topics and discusses where VSYNC (and the 16ms rendering barrier) comes from, and why it’s critical to understand if you want a silky smooth application.

Basic Concepts

To understand smoothness and jank, distinguish app frame production, system composition, and display presentation. VSync (vertical synchronization) coordinates their timing. It is not the mathematical product of refresh rate and FPS, nor an operation that renders the app’s content for it. See the AOSP VSync explanation.

Android Performance Patterns: Understanding Overdraw

Series Catalog:

  1. Overview of Android Performance Patterns
  2. Android Performance Patterns: Render Performance
  3. Android Performance Patterns: Understanding Overdraw
  4. Android Performance Patterns: Understanding VSYNC
  5. Android Performance Patterns: Profile GPU Rendering

Technical review (2026-10-13): The excerpts and diagrams are from the 2015 video. Overdraw remains a useful concept; the text now adds versioned color mappings, transparency exceptions, and conditions for removing backgrounds. Lighter overlay colors alone are not evidence of a performance gain.

Original video introduction:

One of the most problematic performance problems on Android is the easiest to create; thankfully, it’s also easy to fix.

OVERDRAW is a term used to describe how many times a pixel has been re-drawn in a single frame of rendering. It’s a troublesome issue, because in most cases, pixels that are overdrawn do not end up contributing to the final rendered image. As such, it amounts to wasted work for your GPU and CPU.

Fixing overdraw has everything to do with using the available on-device tools, like Show GPU Overdraw, and then adjusting your view hierarchy in order to reduce areas where it may be occurring.

What is Overdraw?

At the beginning of the video, the author uses a house painter as an analogy: painting a wall is hard work, and if you have to repaint it because you don’t like the color, the first layer was a waste of effort. Similarly, some drawing beneath a fully opaque region may make no contribution to the final image. When you try to balance high performance with perfect design, you often run into a common performance issue: Overdraw!

Overdraw means drawing the same pixel more than once within a frame. In the stacked-card example below, work beneath a fully opaque card may be unnecessary. Overlap is not always waste: translucent content, shadows, and antialiased edges still need the underlying color for blending. Removing that content would change the image. Clipping and renderer optimizations also affect the work performed. See the official explanation.

Android Performance Patterns: Render Performance

Series Catalog:

  1. Overview of Android Performance Patterns
  2. Android Performance Patterns: Render Performance
  3. Android Performance Patterns: Understanding Overdraw
  4. Android Performance Patterns: Understanding VSYNC
  5. Android Performance Patterns: Profile GPU Rendering

Technical review (2026-10-13): This is a study note from the 2015 video series. The Nexus 5 example and tool screenshots remain historical material. The original introduction uses 16ms as an approximation for 60Hz; the discussion below now clarifies refresh behavior, jank, and tool limitations.

Original video introduction:

Rendering performance is all about how fast you can draw your activity, and get it updated on the screen. Success here means your users feeling like your application is smooth and responsive, which means that you’ve got to get all your logic completed, and all your rendering done in 16ms or less, each and every frame. But that might be a bit more difficult than you think.

In this video, Colt McAnlis takes a look at what “rendering performance” means to developers, alongside some of the most common pitfalls that are ran into; and let’s not forget the important stuff: the tools that help you track down, and fix these issues before they become large problems.

Android Rendering Knowledge

When you think you’ve developed a world-changing app, your users might not agree. They might think your app is slow and laggy, failing to achieve the smoothness they expect, let alone changing the world. Straight into the bin! Hang on, it runs smoothly on my Nexus 5. How can it be slow? If you know anything about Android fragmentation, you’d know that many low-end phones don’t have the powerful processor and GPU of a Nexus 5, or the same clean stock Android installation.

If a large number of users complain that your app is laggy, don’t just blame their hardware. Sometimes the problem lies within the app itself, including rendering work or a blocked main thread. Measure first to identify the cause and choose a fix. Thus, knowing how Android rendering works is essential for any Android developer.

Overview of Android Performance Patterns

Series Catalog:

  1. Overview of Android Performance Patterns
  2. Android Performance Patterns: Render Performance
  3. Android Performance Patterns: Understanding Overdraw
  4. Android Performance Patterns: Understanding VSYNC
  5. Android Performance Patterns: Profile GPU Rendering

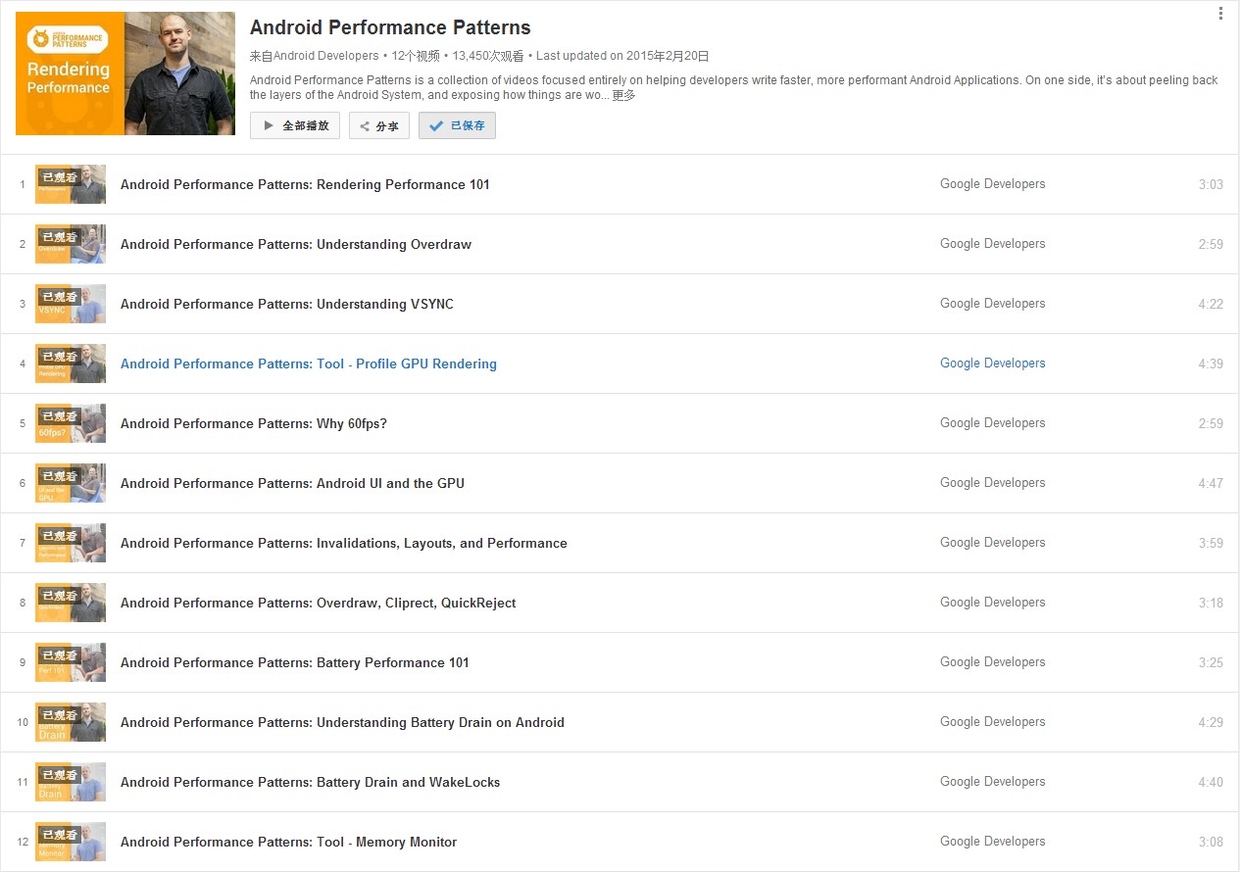
In 2015, Google introduced the Android Performance Patterns short-video series. The original playlist is on YouTube; Google’s companion-course announcement also documents the series.
Android Performance Patterns Overview

Technical review — 2026-10-13: The original 2015 motivation and viewing experience are retained. The videos remain useful background, while the old tools, Google+ resources, and fixed “16ms” guidance need the version context below.

Overdraw, VSYNC, and main-thread/RenderThread cooperation still matter, but the refresh interval is not always 16ms. It is about 16.67ms at 60Hz, 11.11ms at 90Hz, and 8.33ms at 120Hz. Use the system’s scheduling deadlines and trace data when judging actual frames instead of applying one fixed threshold to every device and scenario.

Investigation Current entry point and conditions
View / Compose hierarchy and attributes Use Layout Inspector on debuggable apps. It can also show Compose recomposition/skipping; hierarchy inspection is not a frame-duration measurement
Quick rendering-stage and overdraw signals Developer options provide Profile GPU/HWUI Rendering and Debug GPU Overdraw. The bars represent CPU-side rendering stages, not pure GPU execution time, and do not cover every custom rendering path. See the official guide
Frames missing their deadlines Perfetto FrameTimeline requires Android 12 / API 31+. Relate frames to the thread, scheduling, and SurfaceFlinger tracks actually captured
Regressions during scrolling or transitions Macrobenchmark FrameTimingMetric is available from AndroidX Benchmark 1.1.0. frameOverrunMs requires API 31+ and measures something different from frameDurationCpuMs

The old Android Device Monitor, which hosted Hierarchy Viewer and Traceview, was deprecated in Android Studio 3.1 and removed in 3.2. Use the current Profiler for method analysis and Layout Inspector for hierarchy inspection. For Macrobenchmark, follow the setup requirements: a release-like, non-debuggable, profileable target, with consistent device and scenario conditions.

Introduction quoted in the original 2015 article:

Android Performance Patterns is a collection of videos focused entirely on helping developers write faster, more performant Android Applications. On one side, it’s about peeling back the layers of the Android System, and exposing how things are working under the hood. On the other side, it’s about teaching you how the tools work, and what to look for in order to extract the right perf out of your app.

But at the end of the day, Android Performance Patterns is all about giving you the right resources at the right time to help make the fastest, smoothest, most awesome experience for your users. And that’s the whole point, right?

The videos explain Android performance in three to five minutes each. The speakers talk fast; before subtitles were available, they really tested my listening. Subtitles were available when this article was written; check each video’s current subtitle tracks rather than assuming complete coverage today.

While the videos are short, they are packed with information. A point the speaker passes over in one sentence can take a lot of reading to understand, or a while spent learning a debugging tool. This means the series doesn’t directly teach you “how to optimize your app” step-by-step; rather, it tells you what you need to know about Android performance so that you know which tools to use, what steps to take, and what goals to aim for.

Android Memory Optimization (3) - Viewing Original Bitmaps in MAT

This is the final article in our MAT series, detailing how to reconstruct original images from memory snapshots to debug leaks.

  1. Android Memory Optimization (1) - Introduction to MAT
  2. Android Memory Optimization (2) - Advanced MAT Usage
  3. Android Memory Optimization (3) - Viewing Original Bitmaps in MAT

Technical review — 2026-10-13: This historical technique depends on the Bitmap implementation. The original screenshots are retained. The field is checked against AOSP android-4.4.4_r2; Android 8.0 / API 26 explains the native-pixel change. Updated GIMP 3.2.6 import settings and a current debugging alternative follow.

When investigating image-related memory problems in MAT, knowing which image a Bitmap contains makes the object much easier to connect to an app feature. “Original image” here means the pixels held by the runtime Bitmap, not the downloaded JPEG/PNG, its compression settings, or EXIF. MAT can show what retains the object; a large Bitmap alone does not establish a leak.

This workflow requires the dump to contain the pixel array. A Java wrapper and a native address alone cannot reconstruct pixels missing from the dump.

Android Memory Optimization (2) - Advanced MAT Usage

This is the second article in our MAT series, focusing on advanced techniques for analyzing memory issues in Java and Android applications.

  1. Android Memory Optimization (1) - Introduction to MAT
  2. Android Memory Optimization (2) - Advanced MAT Usage
  3. Android Memory Optimization (3) - Viewing Original Bitmaps in MAT

Technical review — 2026-10-13: The 2015 screenshots are retained; concepts and query descriptions were checked against MAT 1.17.0 documentation. The old Studio conversion/GC menus are historical. Reference directions, unreachable-object interpretation, and leak criteria are corrected below, with missing steps restored.

For capture, see the introductory article: obtain a heap dump in Android Studio Profiler with debuggable / complete data, then export to MAT as needed. LeakCanary can support automated tests, but the ordinary leakcanary-android dependency belongs in debug builds. The official 2.14 release-analysis workflow is still marked experimental; adding LeakCanary is not a generic production-capture strategy. See UI-test integration and LeakCanary for releases.

Characteristics of Java Memory Leaks

  • A typical Java memory leak is an object that is still reachable but no longer useful.
  • Compare its intended lifetime with the actual ownership path, rather than judging only its size or instance count.
  • Recreating reusable objects adds allocation and GC work. If old objects are collected normally, that is allocation waste, not necessarily a leak. An oversized legitimate allocation can also cause OOM.

Advanced MAT Techniques

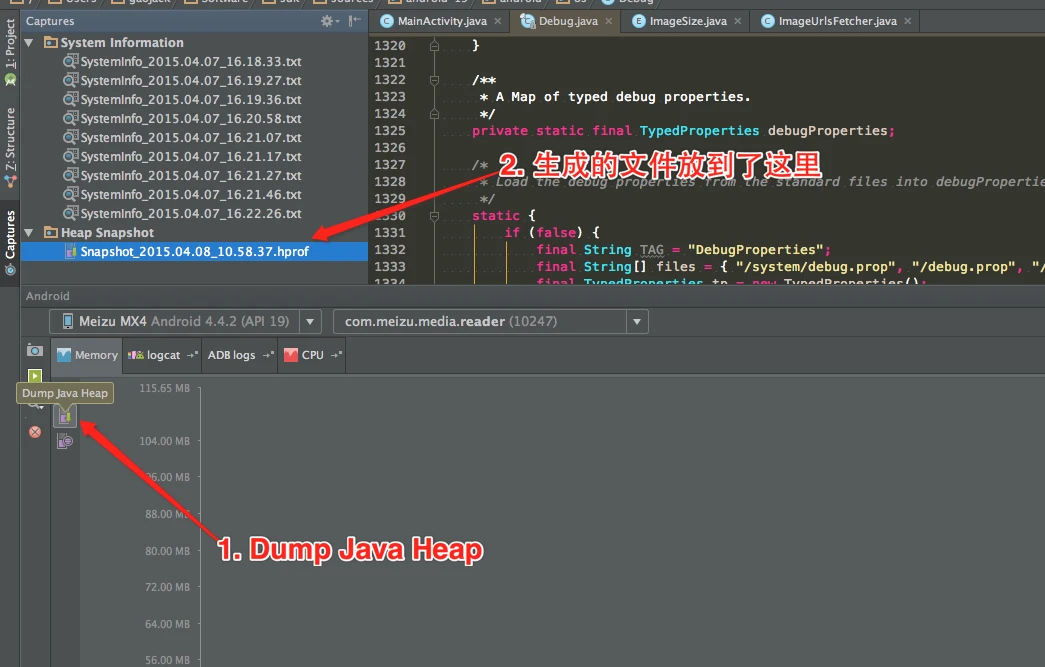
Dumping Memory with Android Studio

The screenshot shows an early Android Studio capture UI:

Historical Android Studio heap tools

Android Memory Optimization (1) - Getting Started with MAT

This is the first article in the series on using the MAT tool. This series consists of three articles, detailing how to use MAT to analyze memory issues, whether they are Java application memory issues or Android application memory issues:

  1. Android Memory Optimization (1) - Getting Started with MAT
  2. Android Memory Optimization (2) - Advanced MAT Usage
  3. Android Memory Optimization (3) - Opening Original Bitmap Images in MAT

Technical review — 2026-10-13: The tutorial and historical screenshots are retained. MAT’s heap-analysis concepts remain useful, while the Eclipse/DDMS capture workflow is obsolete. Installation requirements now reference MAT 1.17.0 (2026-06-10; Java 21+ for the standalone tool). The ART, Bitmap, retained-size, and reference explanations have been corrected.

Start with a Java/Kotlin heap dump in Android Studio Profiler, then export to MAT when its analysis is useful. LeakCanary can help find Android memory leaks. MAT mainly explains why managed-heap objects remain reachable; process-wide memory and native allocations also require tools such as dumpsys meminfo, native allocation recording, or Perfetto heapprofd on Android 10+. On user builds, heapprofd requires a debuggable or profileable app; it cannot arbitrarily profile other apps.

Introduction to MAT

What is MAT?

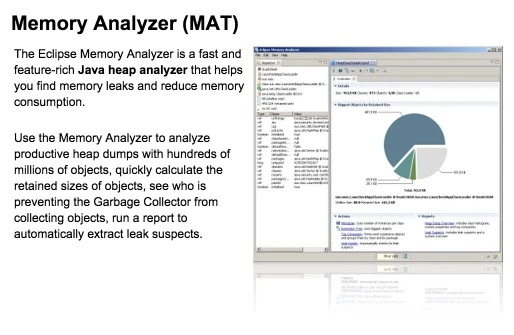
MAT (Memory Analyzer Tool) is an Eclipse-based Java heap analyzer. It helps us find memory leaks and reduce memory use by showing how much space objects occupy and which references keep them alive. Its reports give us places to start investigating.

image

MAT is available as an Eclipse plugin or a standalone Eclipse RCP application. The standalone tool does not require a full Eclipse IDE, but it still needs a compatible Java runtime. Whether an Android HPROF needs conversion depends on its format and the analyzer’s support, not on which MAT installation method you chose.